ULTRASONIC IMAGING FOR CONCRETE INFRASTRUCTURE CONDITION ASSESSMENT AND QUALITY ASSURANCE
|
|
|
- Judith Allison
- 5 years ago
- Views:
Transcription

1 CIVIL ENGINEERING STUDIES Illinois Center for Transportation Series No UILU-ENG ISSN: ULTRASONIC IMAGING FOR CONCRETE INFRASTRUCTURE CONDITION ASSESSMENT AND QUALITY ASSURANCE Prepared By John S. Popovics Jeffery R. Roesler James Bittner Armen N. Amirkhanian Alexander S. Brand Prakhar Gupta Katherine Flowers University of Illinois at Urbana-Champaign Research Report No. FHWA-ICT A report of the findings of ICT PROJECT R Ultrasonic Imaging for Concrete Infrastructure Condition Assessment and Quality Assurance Illinois Center for Transportation April 2017 i
2
3 Technical Report Documentation Page 1. Report No. FHWA-ICT Government Accession No. N/A 3. Recipient s Catalog No. N/A 4. Title and Subtitle 5. Report Date Ultrasonic Imaging for Concrete Infrastructure Condition Assessment and Quality Assurance April Performing Organization Code N/A 7. Author(S) John S. Popovics, Jeffery R. Roesler, James Bittner, Armen N. Amirkhanian, Alexander S. Brand, Prakhar Gupta, and Katherine Flowers 9. Performing Organization Name and address Illinois Center for Transportation Department of Civil and Environmental Engineering University of Illinois at Urbana-Champaign 205 North Mathews Avenue, MC-250 Urbana, IL Sponsoring Agency Name and Address Illinois Department of Transportation (SPR) Bureau of Research 126 East Ash Street Springfield, IL Performing Organization Report No. ICT UILU-ENG Work Unit No. N/A 11. Contract or Grant No. R Type of Report and Period Covered Final Report: 7/1/13 12/31/ Sponsoring Agency Code FHWA 15. Supplementary Notes Conducted in cooperation with the U.S. Department of Transportation, Federal Highway Administration. 16. Abstract This report describes work on laboratory and field performance reviews of an ultrasonic shear wave imaging device called MIRA for application to plain and reinforced concrete infrastructure components. Potential applications investigated included bridge deck delamination detection, deck thickness profiles, and detection of internal steel bars and dowels. Based on the observed performance of the unit, three classification categories of applications were defined: field ready, potentially ready, and challenging. In general, the MIRA device is not well suited to provide full-coverage rapid scans over an entire structure. Rather MIRA is more suited for targeted inspection or failure analysis to determine general geometric and internal features of concrete elements because MIRA is able to be quickly deployed for spot inspections with little site preparation. A user s manual was produced to assist in introducing new users to the proper operation and interpretation of the MIRA device. 17. Key Words bridge decks; columns; girders; MIRA; NDT; NDE; nondestructive; SAFT; shear wave; ultrasonic array 19. Security Classif. (of this report) Unclassified FORM DOT F (8-72) 18. Distribution Statement No restrictions. This document is available through the national technical information service, Springfield, VA Security Classif. (of this page) Unclassified 21. No. of pages 88 pp + appendices 22. PRICE N/A REPRODUCTION OF COMPLETED PAGE AUTHORIZED
4
5 ACKNOWLEDGMENT, DISCLAIMER, MANUFACTURERS NAMES This publication is based on the results of ICT-R27-146, Ultrasonic Imaging for Concrete Infrastructure Condition Assessment and Quality Assurance. ICT-R was conducted in cooperation with the Illinois Center for Transportation; the Illinois Department of Transportation; and the U.S. Department of Transportation, Federal Highway Administration. Members of the Technical Review panel were the following: Douglas A. Dirks, Illinois Department of Transportation, TRP Co-Chair Gary Kowalski, Illinois Department of Transportation, TRP Co-Chair Bill Beisner, Illinois Department of Transportation Dave Copenbarger, Illinois Department of Transportation Ryan Culton, Illinois Department of Transportation Dan Brydl, Federal Highway Administration Mark Gawedzinski, Illinois Department of Transportation James Krstulovich, Illinois Department of Transportation Tim Krumm, Illinois Department of Transportation Randell Riley, Illinois Chapter, American Concrete Pavement Association Steve Robinson, Illinois Department of Transportation Tom Weck, Illinois Department of Transportation Charles Wienrank, Illinois Department of Transportation The contents of this report reflect the view of the authors, who are responsible for the facts and the accuracy of the data presented herein. The contents do not necessarily reflect the official views or policies of the Illinois Center for Transportation, the Illinois Department of Transportation, or the Federal Highway Administration. This report does not constitute a standard, specification, or regulation. Trademark or manufacturers names appear in this report only because they are considered essential to the object of this document and do not constitute an endorsement of a product by the Federal Highway Administration, the Illinois Department of Transportation, or the Illinois Center for Transportation. i
6 EXECUTIVE SUMMARY This report provides a laboratory and field performance review of an ultrasonic shear wave imaging device called MIRA for application to plain and reinforced concrete infrastructure components. This device employs a series of sensor and signal processing innovations to allow the generation of crosssectional images of concrete structural elements. These cross-sectional images can then be used during field inspections to build an understanding of structural section geometry, reinforcement, or internal defects. Potential applications investigated included bridge deck delamination detection, deck thickness profiles, and detection of internal steel bars and dowels. The MIRA ultrasonic shear wave imaging device consists of an array of shear wave transducers. The transducers used are proprietary and employ a new dry-point contact design, which requires no traditional couplant. This feature allows the device to quickly employ 12 rows of four transducers with every scan, resulting in a rich ultrasound dataset. The ultrasound dataset is processed using a synthetic aperture focusing technique (SAFT) to identify strong reflectors. The resulting crosssectional datasets can be further compiled into a single large dataset and interpolated to construct 3D representations of the internal structure. Laboratory tests were designed and carried out with the commercial equipment on a series of test specimens designed to represent critical concrete inspection tasks. The device succeeded in identifying the planar location and depth of ideal simulated defects. However, during laboratory tests, the device had difficulty in detection of arbitrarily oriented defects and defect detection in zones of dense reinforcement. Based on the results of the laboratory tests, trials were initiated to test the device s ability to answer existing challenges in the field. Several focused tasks were explored, such as bridge deck delamination identification and generating a deck thickness profile. During implementation, several critical factors of use were identified and documented, such as limiting excess dust, occasional signal disruption caused by pavement surface tining/grooving, and inability to consistently detect shallow delaminations. The summary results of the field trials resulted in three classification categories for a suite of applications: field ready, potentially ready, and challenging. Two field-ready applications using the commercial package are reinforcement localization and thickness measurements of concrete sections. The MIRA device is not well suited to provide full-coverage rapid scans over an entire structure. Because of its extensive time requirements for scanning and interpolating the resulting data, MIRA is more suited for targeted inspection or failure analysis to determine general geometric and internal features of concrete elements. Other non-destructive testing (NDT) methods are able to perform fullcoverage scans at faster scanning speeds. However, unlike other NDT methods, MIRA is able to be quickly deployed for spot inspections with little site preparation. Several areas of critical concern for any practitioner implementing the device were identified through the course of this study. The first concern is the array polarization, which allows for the possibility of ii
7 defects not being identified due solely to the orientation of the device during data collection. Proper implementation of the device requires a trained user who has a thorough understanding of the limitations of the pre-packaged software and is able to design an appropriate testing plan. The ultrasonic shear wave imaging technique was consistently observed to be a step forward in the rapid concrete inspection of in situ infrastructure and for preliminary failure investigations. The ability to quickly deploy many transducers across the surface of an inspection zone generates a diverse signal dataset that has great potential for feature identification. The commercial hardware platform was observed to be robust and well implemented for intermittent, focused inspection of trouble areas. iii
8 CONTENTS CHAPTER 1: INTRODUCTION... 1 CHAPTER 2: CURRENT STATE OF UNDERSTANDING AND PRACTICE LITERATURE REVIEW Partial-Depth Repair and Thickness Assessment Dowel Bar and Cover Depth Measurements JOINT DETERIORATION MEASUREMENTS DETERIORATION AND CRACKING IN CONCRETE Assessment of Two-Lift Concrete Pavements Debonding and Delaminations in Concrete TECHNOLOGY USED BY MIRA DPC Transducers SAFT PROFESSIONAL PRACTICE PANEL CHAPTER 3: ULTRASONIC IMAGING EQUIPMENT VERIFICATION EQUIPMENT DISCOVERY UIUC Personnel Training General Device Operation File Format and Data Available Velocity Estimation Mechanism PRELIMINARY TESTS Embedded Duct Open Crack Reinforcing Bar Disbond Delamination Embedded Voids...24 iv
9 CHAPTER 4: IN SITU FIELD TESTING AND VERIFICATION FIELD VERIFICATION TESTS Demolished Bridge Deck Slabs Delamination Damaged Bridge Deck Delaminations Bridge Girders with Corrosion New Pavement Joints Asphalt Bridge Deck Scanned from Below MIRA Tests for Bridge Parapet Quality Dowel Alignment in Magnetically Complex Zone Bridge Deck Thickness Profile Pier Cap Repair Inspection Bridge Deck Thickness Profile Site OTHER FIELD VERIFICATION TESTS MIRA Tests on RCC MIRA Tests on UTW FIELD TEST CONCLUSIONS CHAPTER 5: IMPLEMENTATION AND TECHNOLOGY TRANSFER CHAPTER 6: SUMMARY AND RECOMMENDATIONS REFERENCES APPENDIX A: A1040M FILE SPECIFICATIONS APPENDIX B: MATLAB CODE FILE LOADING APPENDIX C: PRACTITIONERS SURVEY RESULTS APPENDIX D: PARAPET SCANS AND CORES APPENDIX E: MIRA USERS MANUAL v
10
11 CHAPTER 1: INTRODUCTION The aging infrastructure of the United States was given a D+ grade by the American Society of Civil Engineers and requires an estimated $3.6 trillion investment by 2020 (ASCE 2013). Accordingly, the need arises for rapid and cost-effective evaluation tools to optimize economy with repair and maintenance. Non-destructive testing (NDT) and non-destructive evaluation (NDE) technologies offer solutions to these issues by providing effective, efficient, economical, and often rapid data collection without significant detriment to a pavement or bridge deck and potentially without the need for road closure. Imaging of concrete pavements and concrete bridge decks has been performed with such NDT/NDE techniques as impact echo, ultrasonic pulse velocity, ground penetrating radar, infrared thermography, x- ray tomography, etc. While each of these techniques has its own respective list of advantages and disadvantages (ACI Committee ), the optimal technique for concrete pavements and bridge decks would be one that can provide a two-dimensional and/or three-dimensional view into the structure with relative ease, speed, and efficiency. A technique that meets these criteria is ultrasonic shear wave tomography. The commercially available MIRA (Figure 1) is a portable ultrasonic shear wave tomography device that consists of an array of four rows of 12 shear wave transducers that can obtain tomographic information from a small section of concrete pavement or bridge deck in a matter of seconds (Germann Instruments 2010). The set of 48 dry-point contacts (DPC) generate a signal with a central frequency of 50 khz and are activated in a pitch-catch regime (Figure 2) to create the tomograph (Figure 3). The tomograph provides a graphic that is relatively easy to understand and that allows a trained, though not necessarily expert, technician to identify defect locations or areas that require further investigation or repair. The device is programmed to provide output in metric units only; accordingly, all scan axes in the figures in this report will be depicted in millimeters, and a conversion to imperial units will be provided in the accompanying caption. Figure 1: MIRA device and laptop. The device can connect wirelessly to the laptop to allow access in restricted areas (Germann Instruments 2010). 1


12 Figure 2: Each row of sensors is activated in succession, while the non-activated sensors listen for the ultrasonic signal (Germann Instruments 2010). Figure 3: An example output tomograph from a MIRA analysis in metric units of millimeters, 1 in. = 25.4 mm (Michaux and Grill 2009). 2
13 CHAPTER 2: CURRENT STATE OF UNDERSTANDING AND PRACTICE 2.1 LITERATURE REVIEW The MIRA system has been reportedly used successfully on numerous projects, including bridge deck delamination inspection, grouted cable inspection, pavement thickness measurements, and pavement and joint deterioration investigations. The portability and versatility of the device allow it to be used on virtually any concrete structure. A detailed description of how the device is configured and standard operation procedures have been provided in Appendix E. The following review provides an overview of the results from existing studies of the device and performance to date Partial-Depth Repair and Thickness Assessment The MIRA system can generate B-, C-, and D-scans (Figure 4). A single scan at a location will produce a B-scan only, although multiple scans in a grid pattern can be processed to additionally produce C- and D-scans. From these scans, a wealth of information can be obtained from the concrete structure. For example, researchers have shown that the MIRA system is able to detect poor bonding within partialdepth repairs of concrete pavements (Hoegh et al. 2012). With poor repair bonding, the ultrasonic signal does not reflect from the full thickness of the sample; instead, it reflects off the partial-depth repair interface. In this case, the bottom of the concrete pavement is not observed in the image, and a shadow is created beneath the poorly bonded interface within the tomograph (Figure 5) where a backwall reflection would be expected (Figure 6). The researchers found that this shadowing effect was accurate at identifying locations where bonding was poor (Figure 7). A study by Vancura et al. (2013) found that MIRA was more adept at detecting and measuring the continual peaks and valleys in concrete pavement thickness relative to coring (Figure 8). Figure 4: Examples of the various scan directions that can be obtained with the MIRA system (De La Haza et al. 2013). 3
.")
.")
 and Figure 5 is core (b), imperial unit ruler")
14 Figure 5: Two MIRA scans of poorly bonded partial-depth repair material in a concrete pavement, 1 in. = 25.4 mm (Hoegh et al. 2012). Figure 6: Two MIRA scans of a sound partial-depth-repaired section of concrete pavement, 1 in. = 25.4 mm (Hoegh et al. 2012). Figure 7: Cores taken from the locations tested in Hoegh et al Figure 6 is core (a) and Figure 5 is core (b), imperial unit ruler shown (1 in. = 25.4 mm). 4
.")

15 Figure 8: Thickness variation on a project site as measured by MIRA and coring (Vancura et al. 2013) Dowel Bar and Cover Depth Measurements The MIRA system is also useful for locating dowel bars. One study has shown that MIRA has the ability to detect dowel bars almost automatically (Hoegh et al. 2011). Dowel bars represent a significant change in acoustic impedance and thus are strong reflectors of ultrasonic waves. These reflections are easily picked up by MIRA (Figure 9). However, simply analyzing the B-scans manually for cover depth measurements can prove time consuming. In addition, as seen in Figure 9, the dowel bars do not appear perfectly round in the B-scans. An automated system can be used to threshold the signals and calculate a centroid for each dowel bar (Figure 10). From this centroid, the center of the dowel bar is estimated, and the cover depth can thus be calculated. Hoegh et al. (2011) noted that the time to analyze the signals to calculate cover depth went from 2 weeks with the manual method to under 3 hours with the automatic method. The researchers concluded that MIRA is not an optimal method to detect dowel bar misalignment, but it can indicate locations where further scrutiny is required. Relative to other methods for locating and identifying steel in concrete pavements, MIRA has been shown to have superior performance to the covermeter, ground penetrating radar (GPR), and magnetic tomography (MIT scan), as shown by Hoegh et al. (2011). While both the covermeter and MIRA were able to locate the steel relative to the actual depth of steel as determined by coring, the covermeter yielded poorer results (R 2 = 0.186, comparing the actual to the measured depth) as compared with MIRA (R 2 = 0.991, comparing the actual to the measured depth). MIRA was able to confirm the findings of the GPR with respect to identifying tie bars; furthermore, MIRA was able to locate additional tie bars that were not detected by GPR. Hoegh et al. (2011) argued that GPR is superior to MIRA in that it can allow for high-speed scans and data analysis without the need for road closure, but MIRA has the advantage of providing scans of higher resolution. The magnetic tomography MIT scan system is able to accurately locate and identify instances of dowel misalignment quicker than MIRA can. However, MIRA provides a more detailed analysis of the condition of the dowel bar (i.e., debonding, deterioration), which MIT scan cannot provide. 5
 to investigate early spalls in a test pavement that had not been subject to loading.")
16 Another report demonstrated how a 3D image (Figure 11) can be constructed of 2D-imaged dowel bars (Khazanovich and Hoegh 2012). This testing was done at the National Airport Testing Facility (NAPTF) to investigate early spalls in a test pavement that had not been subject to loading. Although this is not clearly demonstrated in Figure 11, the researchers claim that they were able to determine, from the MIRA images, that the aluminum frames holding the strain gauges had deteriorated in the concrete, leaving areas of weakened pavement. Figure 9: MIRA B-scan showing pavement thickness and dowel bar locations, 1 in. = 25.4 mm (Hoegh et al. 2011). 6
. 2.1.3 Joint Deterioration Measurements Joint deterioration can also be detected using the MIRA system.")
 is unique in that several NDT technologies were compared on a blind basis. The technicians did not know of the defects a priori.")
17 Figure 10: Various stages of the thresholding procedure to calculate the cover depth of dowel bars (Hoegh et al. 2011). Figure 11: 3D reconstruction of MIRA scans showing dowel bars and an embedded strain gauge, 1 in. = 25.4 mm (Khazanovich and Hoegh 2012) Joint Deterioration Measurements Joint deterioration can also be detected using the MIRA system. Readings taken from the MnROAD bypass show that the technology can easily identify locations of joint deterioration (Figure 12). That particular study (Hoegh et al. 2013) is unique in that several NDT technologies were compared on a blind basis. The technicians did not know of the defects a priori. It was found that the MIRA system, albeit slower than GPR, detected deterioration and delaminations with the highest accuracy. A similar 7

 investigated continually reinforced concrete pavements (CRCP) in Texas and were able to confirm evidence of horizontal cracking and deterioration.")
18 project was conducted under the SHRP2 program (Gucunski et al. 2013). The report indicated that systems like MIRA can detect delaminations with great accuracy. One of the downsides listed was the large amount of time it took to perform all of the scans necessary to form a D-scan image of the entire bridge deck. Figure 12: Joint deterioration identified by MIRA, 1 in. = 25.4 mm (Hoegh et al. 2013) Deterioration and Cracking in Concrete A number of studies have used MIRA to investigate deterioration and cracking in concrete pavements. Ryu et al. (2012) investigated continually reinforced concrete pavements (CRCP) in Texas and were able to confirm evidence of horizontal cracking and deterioration. Voids and other air-filled pockets can also be detected using the MIRA device (Schabowicz 2014); Figure 13 shows how easily air-filled pockets can be detected in the B-scan. Hoegh and Khazanovich (2011) used post-processing in the form of Pearson s correlation coefficient to detect and localize subsurface defects (Figure 14). Figure 13: Detection of air-filled pockets with MIRA, 1 in. = 25.4 mm (Schabowicz 2014). 8

 used the MIRA device to assess the two-lift concrete pavement at the MnROAD facility.")
19 (a) Figure 14: The use of Pearson s correlation coefficient in identifying the location of a defect (a) based on the MIRA scans (b) (Hoegh and Khazanovich 2011). (b) Assessment of Two-Lift Concrete Pavements Two-lift composite pavements are constructed as two layers of concrete paved in a wet-on-wet scenario. Typically, the lower lift contains a more economical concrete, potentially with lower-quality or recycled aggregates, while the top lift contains conventional concrete, sometimes with higherquality or high-frictional aggregates. The condition of full bonding between the two layers is paramount to the durability and performance of the composite pavement. Therefore, MIRA has been used to assess the pavement to detect any possible issues. Tompkins et al. (2011) used the MIRA device to assess the two-lift concrete pavement at the MnROAD facility. The B-scans were able to locate sections of pavement that were indicative of full bonding between the two layers, while another scan indicated an area of either poor bonding between the layers or some other defect (Figure 15). Hoegh et al. (2015) used MIRA as a quality assessment and control tool for the composite two-lift concrete pavements constructed by the Illinois Tollway. The researchers were able to successfully identify locations of good concrete and areas of potential non-uniformity, such as poor consolidation (Figure 16). 9

. The preliminary conclusion of that study is as follows: Acquisition speed is 0.8 to 2.3 min/ft 3 (28.2 to 81.")
20 Figure 15: MIRA B-scans indicating complete bonding between the two lifts of concrete (left) and indicating a potential poor bonding condition or defect between the two lifts (right), 1 in. = 25.4 mm (Tompkins et al. 2011). Figure 16: MIRA B-scan of a section of two-lift concrete pavement indicating poor consolidation. 1 in. = 25.4 mm (Hoegh et al. 2015) Debonding and Delaminations in Concrete In another SHRP2 project, a variety of NDT technologies, including MIRA, were evaluated for use in tunnel applications (Wimsatt et al. 2012). The preliminary conclusion of that study is as follows: Acquisition speed is 0.8 to 2.3 min/ft 3 (28.2 to 81.2 min/m 3 ) The system has difficulty penetrating through two layers of reinforcement mesh Defects within 2 in. (50.8 mm) of the surface are not directly detected Rebar sizes #5 and smaller are not typically detected Backwall reflections up to 38 in. (965.2 mm) were accurately detected to ±0.3 in. (±7.6 mm). 10

21 The MIRA system was able to detect numerous defects within tunnel walls during the study (Figure 17). One downside to the MIRA system outlined in the report is that there are no industry standards on how to perform testing and no coherent training program available to technicians. In another study of tunnel linings, Bishko et al. (2008) were able to identify well-grouted and poorly grouted tunnel panels (Figure 18). The absence of a reflector in the MIRA B-scan suggested that the panel was well-grouted as shear waves traveled through the panel and grout into the soil without encountering any reflectors. Shokouhi et al. (2011) used MIRA along with other NDT techniques to examine a bridge deck section for potential delaminations. The authors concluded that MIRA was better than impact-echo and ultrasonic-echo techniques at detecting deep delaminations and providing an indication of the potential presence of a shallow delamination. Figure 17: MIRA scan inside the Chesapeake Bay Tunnel, 1 in. = 25.4 mm (Wimsatt et al. 2012). 11
. 2.2 TECHNOLOGY USED BY MIRA Understanding the operation and limitations of the MIRA device requires basic knowledge of the technology of its functionality.")
22 Figure 18: A well-grouted tunnel panel indicates no reflectors (left), while the presence of a reflector (presence of air) behind the panel indicates a poorly grouted panel (right), 1 in. = 25.4 mm (Bishko et al. 2008). 2.2 TECHNOLOGY USED BY MIRA Understanding the operation and limitations of the MIRA device requires basic knowledge of the technology of its functionality. The MIRA device functions so quickly and rapidly because it uses drypoint contact (DPC) transducers and the synthetic aperture focusing technique (SAFT) imaging algorithm DPC Transducers Typically, ultrasonic transducers require the use of a coupling agent to attach the transducer to the testing surface. The low-frequency range of ultrasonic transducers required for concrete necessitates a transducer with a relatively large contact area. The DPC transducer negates the need for a larger surface area by essentially acting as a point contact. The acoustic crystal in the DPC is significantly smaller than the wavelength of the shear wave that is emitted, which is how each DPC acts as a point contact (De La Haza et al. 2013). In the MIRA device, the DPC transducers are spring loaded, which allows for analysis of rougher surfaces SAFT The concept of a synthetic aperture is that it simulates a large transducer by sampling an area at multiple locations (Schickert et al. 2013), such as by an array of transducers. The SAFT numerical algorithm is used to focus the time-domain signals (A-scans) at any given point by coherent superposition (Schickert et al. 2013). 12
23 2.3 PROFESSIONAL PRACTICE PANEL The proposed goal was to organize a meeting with personnel from pertinent universities and transportation agencies, the purpose of which was to explore common areas of interest, exchange findings, and establish collaborations. An expert panel that represented a broad range of users was assembled. Most panel members met personally with the investigators at the first meeting, which was held during the American Concrete Institute (ACI) Spring 2014 meeting in Reno, Nevada. The investigators propose to convene the panel at future ACI meetings when needed. The expert panel members are the following: Nate Rende, Wiss Janney Elstner Ethan Dodge, CTL Group Dan Zollinger, Texas A&M Kyle Hough, University of Minnesota Michael Brown, Virginia DOT Research (VCITR) Chris McDermott, Alta Vista Solutions (consultant to CALTRANS) The panel was given 14 questions to consider. Most panel members met in person, and the rest participated via . The following questions represent a subset of those that are most relevant to field application of MIRA by a transportation agency. The complete set of question and responses is provided in Appendix C. Have you had to do any maintenance or general calibration on your instrument? If so, who carried out the maintenance/general calibration? No general maintenance or calibration needs. Good performance overall. What is the depth of penetration of the instrument? What is the deepest depth you have surveyed successfully? Difficult to answer, as the steel layers cause shadowing effect. Deepest is 4 to 5 ft. (1200 to 1500 mm), assuming very moderate, good quality concrete. Heavily reinforced elements, probably not able to detect defects. For moderately or lightly reinforced, can find some defects, but it depends on size and spacing of bar grid. What type of defects/characteristics have you surveyed for using your ultrasonic imaging tool? Voids/Honey-combing defects Delaminations (but for larger openings) Cracks (but indirectly by removing back wall) Concrete/stone thickness (for thicker elements, not heavily reinforced) Bonding in tunnel liners Deep duct detection (location) Locating deep-embedded I-beams 13
24 CHAPTER 3: ULTRASONIC IMAGING EQUIPMENT VERIFICATION Upon receiving the MIRA ultrasonic imaging equipment in May 2014, initial explorative work was conducted to classify the technical details of the device. Components of equipment verification included a training session, data product extraction, understanding assumptions made in processing, and equipment design. Each step of discovery enhances the overall understanding of the nondestructive results provided by the MIRA device. On several occasions, data interpretation required a full understanding of the device operation. As a result of these efforts an updated users manual was written with a detailed description of how the device is configured and standard operation procedures has been provided in Appendix E. 3.1 EQUIPMENT DISCOVERY UIUC Personnel Training A training session was held at the University of Illinois at Champaign-Urbana on May 22, The session was hosted by Aldo De La Haza, representing the Dynasty Group, Inc. The topics covered basic equipment setup, operation, and implementation options. A demonstration was carried out on available research slabs to confirm proper use of the device General Device Operation The MIRA device represents a complete ultrasonic collection and on-site display system. The developer and manufacturer of MIRA, ACSYS Ltd., also provides computer software for later 3D compilation of the collected ultrasonic data. The ultrasonic collection system is composed of a data acquisition system, an amplification component, memory-based storage, a display computer, and an array of 12 sets of four connected DPC shear wave transducers. The transducers are spaced approximately 30 mm (12 in.) from center to center in a grid pattern across the bottom of the device. The generation and reception of the ultrasonic signals are done on a set basis. This averaged signal across the four transducers in a set is used to generate a single composite B-scan. The acquisition of data in 3D and reconstructing a simplified 2D representation generates the potential for small reflectors to be lost in the noise of averaging. An overview of critical settings, method of operations, and potential interpretation of the output results can be found in the user manual provided in Appendix E File Format and Data Available The MIRA device has data download access via a USB port. The device presents as a flash drive on modern computer systems. Each scan is saved in a unique folder based on the MAP name, while single B-scans are aggregated in a single folder. In the map scan folders, the generated files are named based on row column order. Three files are generated for every scan with the MIRA device. The three files are of type.lbv,.cfg, and.bmp: The.lbv file contains binary data storage of all original time-domain signals and the corresponding configuration. An example of this time-domain data is plotted in Figure

25 The.cfg file provides an ASCII text presentation of various device configuration parameters. The.bmp file contains a device screenshot of the B-scan image during the moment of device capture. Figure 19: Example MIRA time-domain data from the.lbv file. Each signal corresponds to a pair of transducer sets, only 11 of 66 are shown. The red circle denotes the arrival of the surface propagating shear wave. The.lbv and.cfg file parameters are outlined in the ACSYS-provided documentation in Appendix A. Sample MATLAB code for extracting the original time-domain signals from the binary.lbv file is provided in Appendix B Velocity Estimation Mechanism The MIRA device documentation does not provide details into the algorithm to generate the reported wave velocity measurement. Experimentation was performed using the surface shear wave arrival across all transducer sets to estimate a wave velocity. This estimation method worked satisfactorily in laboratory tests on concrete samples. Overall, the agreement between the proprietary MIRA velocity measurement and a standard shear wave arrival velocity estimate was within 5%. Based on tests, the internal methods of the device provide some filtering on wave arrival estimates assuming a concrete material. In additional tests on acrylic glass (PMMA), the internal MIRA wave speed algorithm produced increased errors (28%) compared to the textbook wave speed reference values. Because of the inaccurate wave speed measurement on a non-concrete sample, additional tests or a fixed reference velocity are needed if non-concrete materials are to be inspected. 15
26 3.2 PRELIMINARY TESTS Laboratory tests were performed using the MIRA device to establish baseline performance characteristics. The goal of each test was to identify the capabilities of the ultrasound imaging array and SAFT algorithms in an ideal environment on simulated defects. All preliminary tests occurred on full-scale testing specimens that had not been exposed to typical service loads and degradation. Full-scale laboratory simulated defects that were inspected included embedded tendon ducts (plastic and metal), open surface crack of varying depths, debonding of rebar, delaminations, and voiding. Each defect is described in detail followed by the resulting SAFT image representation. All SAFT images were generated using the ACSYS-provided software package for image extraction Embedded Duct The embedded duct specimen was designed to simulate various grouting conditions of existing embedded tendon ducts. The slab was designed to be m ( ft). The compressive strength was measured at 42.3 MPa (6135 psi) with a p-wave velocity of 4100 to 4200 m/s (13,450 to 13,780 ft/s). MIRA scans were performed at multiple spots over each embedded duct, as indicated in Figures 20 and 21. Each scan was centered over the embedded duct, and a B-scan image was captured. Images were processed to expose the maximum amount of detail in the region near the expected duct location. Figure 20: Design view of embedded duct and crack. Red circles denote scan locations. Rebar used US #4, metric #13. Drawing in metric, 1 in. = 25.4 mm. 16


27 Figure 21: A single example of an embedded duct (as-built layout). MIRA scan results for the plastic-embedded duct are presented in Figure 22. Results for all three stages of grout conditions are provided. No consistent pattern was observed for each of the stages of grout conditions for plastic-embedded ducts. Strong reflections were observed in the expected region of the embedded duct and from the bottom of the slab; however, the shape and reflection patterns of the ducts were not consistent enough for determining the internal attributes of the ducts. Additionally, increased scattering noise was observed to the sides of the expected embedded duct location in half-full and empty duct cases. The observed increase noise was not consistent throughout every test in these regions. One explanation for this observation is potential consolidation issues around the flexible plastic-embedded tendon. Figure 22: MIRA SAFT B-scan results of embedded plastic duct at three grout filling stages, units in millimeters, 1 in. = 25.4 mm. Top: full ducts; middle: half-full ducts (half foam); bottom: empty ducts (foam only). 17


28 Results for the metal-embedded duct scans are presented in Figure 23. The results show solidly resolved reflections for the duct location and full slab thickness. As expected, the backwall reflection was observed to decrease in amplitude below the embedded duct. Based on the recorded results, no consistent pattern or signal was observed to identify a duct grouting condition. Localization of the duct was possible in the cross section for both material types. Figure 23: MIRA SAFT B-scan results of embedded metal duct at three grout filling stages, units in millimeters, 1 in. = 25.4 mm. Top: full ducts; middle: half-full ducts (half foam); bottom: empty ducts (foam only) Open Crack An open crack was constructed in the embedded duct slab by placing two greased sheets of metal into the concrete prior to hydration. The sheets of metal generated a straight crack of continuously changing depth parallel to the duct configuration, as indicated in Figure 21. The crack minimum depth was 10 mm (0.4 in.), while the maximum depth was 150 mm (5.9 in.) out of the total 255 mm (10.0 in.) thickness of the slab. Two MIRA scanning positions were explored to image this defect. The first scanning position was directly above the defect, as seen in Figure 24. MIRA Simulated Crack 10 mm min 155 mm max 0.4 in. min 6.1 in. max Figure 24: A depiction of the simulated open crack and location of MIRA scanning over the crack mouth. 18


; middle: halfway along slab cut, 75 mm (3.0 in.")

29 The results from the overhead scan position for the simulated open crack are provided in Figure 25. Directly in the center of each image is the expected location of the cracking reflections. Minor to no significant reflections were observed in the maximum-depth open crack, and only partial reflection was observed in the shallow open-crack depth. Successful visualization reflections were observed for the tip of the crack approximately halfway between the two extremes. Backwall reflections were observed in all cases, with sporadic reduction in backwall amplitude for the various open-crack depth conditions. Figure 25: MIRA SAFT B-scan results of simulated open crack at three depth stages, units in millimeters, 1 in. = 25.4 mm. Top: maximum cut depth, 150 mm (5.9 in.); middle: halfway along slab cut, 75 mm (3.0 in.); bottom: shallow cut depth, 10 mm (0.4 in.). The second scan position was to offset the MIRA device from the crack. This scanning position was designed to isolate the crack with waves from only one direction at a larger angle. A layout of this scanning configuration is provided in Figure 26. MIRA Simulated Crack 10 mm min 155 mm max 0.4 in. min 6.1 in. max Figure 26: A depiction of the simulated open crack and location of MIRA scanning beyond the crack mouth. 19


; bottom: shallow cut depth, 10 mm (0.4 in.). This offset technique to observe large crack tips was successful on individual scans.")


30 Results from the offset open-crack scanning are presented in Figure 27. Because of the offset configuration, the crack reflection was expected to be plotted at the 100 mm (3.9 in.) horizontal component in the plots. Reflections were observed for the end of the open crack in all six scans. As the scans moved from the maximum cut depth to the shallowest cut depth, the tip of the crack generated a clear reflection on the SAFT images. Figure 27: Offset position MIRA SAFT B-scan results of simulated vertical crack at three depth stages, units in millimeters, 1 in. = 25.4 mm. Top: maximum cut depth, 150 mm (5.9 in.); middle: halfway along slab cut, 75 mm (3.0 in.); bottom: shallow cut depth, 10 mm (0.4 in.). This offset technique to observe large crack tips was successful on individual scans. However, on integration into a volume image, the observed reflections were not visible. During the volume interpolation, higher value appeared to be given to reflections centered directly underneath the device footprint. If only one column of scans is used and thus no 3D interpolation these offset techniques can be used. Taken over the length of the full open crack, a profile can be constructed as presented in Figure 28. Figure 28: Open-crack offset scanning configuration along a crack tip 150 to 10 mm (5.9 to 0.4 in.) depth. Arrow shows potential reflection from crack tip area. Units of the plot are in millimeters, 1 in. = 25.4 mm. 20


31 3.2.3 Reinforcing Bar Disbond Another common defect of interest to detect is a debonded rebar. To simulate a debonded/disbonded condition, a rebar was coated with plastic wrap prior to the construction of a full-scale laboratory column. A photo of the defect during construction is provided in Figure 29. Two regions of localized rebar disbonding were simulated. The results of scanning the column with the MIRA device are presented in Figure 30. No visual difference was observed between regular rebar reflections and the simulated disbonded rebar reflections. Figure 29: Simulated disbonding using a plastic-wrapped rebar during construction. Figure 30: Debonding rebar MIRA D-scan result compared to normal rebar. Units of the plot are in millimeters, 1 in. = 25.4 mm. 21

. Figure 31: Simulated delaminations during slab construction.")
32 3.2.4 Delamination The next slab casted was designed to capture multiple types of delamination simulations at different depths. The slab dimensions were m ( ft). The delaminations were created using two plastic sheets, metal wire mesh, or foam blocks. A photo showing the created defects is provided in Figure 31. Scanning was carried out in the mapping mode based on a cm ( in.) grid to characterize the entire slab. The long axis of the MIRA device was oriented along the long axis of the slab (horizontal configuration). Figure 31: Simulated delaminations during slab construction. The plan view results from the delamination scanning are presented in Figure 32. The plan view reflection map was constructed by combining the observed reflections occurring at the depth range of 85 mm (3.3 in.) to 200 mm (7.9 in.) over the area of the slab. This depth range was below any cover depth rebar and above any reflections from the constant bottom reflection of the slab. The plan view map clearly identified the larger delamination while only partially classifying the rebar and smaller delaminations. Using a cm ( in.) grid step size, the US #4 (metric #13) rebar was observed, but interpolation across scans caused a double image to be generated in three of the four rebars present in the sample. Non-square defects, such as the center left and the center foam, were identified as rectangular defects due to interpolation artifacts. This caused significant identification problems for the smaller center 100 mm (3.9 in.) diameter foam block. The device failed to identify the mm ( in.) top and bottom plastic sheets in the top right and bottom right positions. Additionally, the mm ( in.) welded wire reinforcement (WWR) in the top right portion of the image was unable to generate a visible reflection. 22


33 Figure 32: MIRA D-scan of the concrete slab with simulated delaminations, plan view sliced from 85 to 200 mm (3.3 to 7.9 in.) depth. The through-center cross section of the slab and the corresponding MIRA panoramic scan are presented in Figures 33 and 34, respectively. The center foam cylinder column was not resolved in the SAFT image; only occasional top reflections are presented. The large plastic delaminations were captured well by the SAFT image. The SAFT image was constructed based on a pitch-catch ultrasonic transmission layout. This method experienced an echo when two reflectors were in the propagation path, and significant energy was present to bounce multiple times between the two reflectors. This behavior resulted in a ringing artifact or echoes in the recorded signals. These artifacts were observed as doubling of large reflectors in the depth direction, as seen in Figure 34. It is important for an operator to recognize these types of phenomena. Figure 33: Design plan cross section of the center of the delamination slab. Units in metric millimeters, 1 in. = 25.4 mm. 23

34 Figure 34: MIRA B-scan of the center of the delamination slab Embedded Voids To simulate an ideal embedded voids situation, a column was constructed with a pair of foam voids and pre-cracked prisms. Design and construction photos of the test specimen are provided in Figure 35. Because of the small dimensions, the column was scanned based on a mm (2 2 in.) grid spacing. A 3D slice model presented in Figure 36 highlights the detected defects. In Figure 36, the defect classified in red at the intersection of the three planes is the top foam void defect along section B-B in Figure 36. Placed directly in front of the foam defect is a pre-cracked prism. At the bottom half of the column, the void and pre-crack defects did not generate enough significant reflection to be classified by the scanning. Because of the decreased rebar spacing at the bottom half of the column, the energy that reaches the defects may not be large enough to reflect back to the array. V C B-B Styrofoam (void) V C A-A Pre-cracked prism V C V C Figure 35: Embedded void column design plan, Design in imperial units, 1 in. = 25.4 mm. Reinforcement size US #4, metric #13 bar (V: foam voids, C: pre-cracked concrete). 24

35 Figure 36: 3D projection of multiple slices of the embedded voiding (metric units). 25

36 CHAPTER 4: IN SITU FIELD TESTING AND VERIFICATION Initial laboratory testing outlined ideal conditions to test the ultrasonic array device. The next portion of the investigation was targeted toward field deployment to identify success or failure of the device using existing critical problems. For each deployment of the device, an objective was identified, and the device performance was compared against other available sets of data. Several practical limitations of the device were quickly identified through the field tests and mitigated in the following deployments. 4.1 FIELD VERIFICATION TESTS Demolished Bridge Deck Slabs Delamination Where: ATREL Field Storage, Rantoul, IL When: 5/17/2014 Test Plan: Deploy the ultrasound device to detect shallow 50 mm (2 in.) delaminations between the reinforced deck and the top surface wear layers. The device will be used in map mode with a spacing that allows for every square inch to be within the footprint twice or have 100% overlap. Visual Observations: On May 12, 2014, three bridge deck sections were delivered to the Advanced Transportation Research and Engineering Laboratory (ATREL) at the Illinois Center for Transportation, University of Illinois at Urbana-Champaign. The deck sections were previously labeled 1 through 3. Total slab thickness (base deck and top wear surface) was measured as 254 mm (10 in.). Each slab was inspected visually and with traditional chain sounding methods. Pictures of each slab are presented in Figures 37 through 39. For each slab, regions of significant sounding delamination interest are indicated in the figures with a blue highlight. Figure 37: Sounding delamination results (highlighted in blue) for IDOT deck specimen Slab 1. 26


37 Figure 38: Sounding delamination results (highlighted in blue) for IDOT deck specimen Slab 2. Figure 39: Sounding delamination results (highlighted in blue) for IDOT deck specimen Slab 3. Results: The best way to present delamination data is through a plan view perspective of each specimen. To generate the plan view perspective, a vertical range of depths needs to be selected to plot as a B-scan map. The range of depths selected was determined by measuring the full thickness of the sample and limiting the range to be above the full thickness. The resulting range used was 0 to 160 mm (0 to 6.3 in.) because it included the typical delamination zones of the wear surface interface and the first set of reinforcement. During testing the grooved surface of the provided bridge deck samples was not observed to impact the measurements of the device. The depth of cut in the roughened areas was approximately measured as 4 mm (0.15 in). 27


38 The ultrasonic map images generated by the MIRA platform are plotted as an overlay to the photographs of each slab in Figures 40 through 42. In general, most of the areas identified through sounding was also confirmed through the ultrasonic map images. In Slabs 1 and 3, a region that was identified with sounding was not observed as a reflection in the contour plots. Additionally, one region in Slab 1 was identified by ultrasonic inspection that was not identified by sounding. Figure 40: Map scan of delamination reflectors from 0 to 160 mm (0 to 6 in.) in Slab 1 transposed on top of a plan view photograph. Figure 41: MIRA results plan view sliced from 0 to 160 mm (0 to 6 in.) for IDOT field bridge Slab 2. 28

39 Figure 42: MIRA results plan view sliced from 0 to 150 mm (0 to 5.9 in.) for IDOT field bridge Slab 3. The failure of delamination identification by ultrasonic inspection on the left side of Slab 3 suggests that the interpolation or configuration may play a role in the effectiveness of ultrasonic inspection on delaminations. The delamination on Slab 1 not captured by ultrasonic inspection may be the result of edge effects of the discrete sample causing an audible sounding difference. In the processed SAFT images, rebar had a disruptive effect in identifying regions of delamination. Because the delaminations were expected at the same level of depth of the rebar, a global perspective is needed to determine whether a reflector is a sole rebar or whether a reflection area is large enough to justify a delamination classification. Furthermore, from this dataset, the researchers were unable to identify any differences between intact, corrosion-free rebar and corroded rebar. Discussion: The initial field study of existing infrastructure components using the ultrasonic shear wave tomographic inspection in comparison to common field procedures was useful in identifying critical testing parameters. The orientation and size of the defect intended to be captured are critical to the grid size and time spent collecting data with the device. Specifically, not including the grid layout, the ultrasonic scanning procedure for each slab took approximately 30 minutes for one map mode scan. The delamination identification difficulties experienced in Slab 3 highlight that the conversion from a 3D sample to a B-scan then resampled to a 3D tomographic image distorts nonsquare defects. It must be stated that the results of ultrasonic inspection in this case are being compared against another non-destructive testing procedure, chain sounding. Every non-destructive procedure has 29

40 strengths and weaknesses along with variable accuracy, and the results should be used only for relative comparison rather than absolute performance. As commonly accepted, sounding near structural edges reduces the accuracy of the identification method Damaged Bridge Deck Delaminations Where: I-55 bridge over river near Springfield, IL When: 5/17/2014 Test Plan: Deploy the ultrasound device on an in-service damaged bridge deck immediately prior to repair. Compare ultrasound delineated delaminations against the results from conventional sounding. Visual Observations: Sounding was performed prior to arrival by on-site personnel, and additional sounding was performed by IDOT engineers concurrently with the MIRA scanning. Sounding equipment was a common chain drag and a highly effective mason s hammer with a head of 1 cm 2 (0.15 in 2 ). The sounding results are presented in Figures 43 and 44. The delaminated areas defined by sounding were outlined to facilitate efficient saw cuts for repair. In the two delaminations investigated, the sounding result was continuous throughout the indicated region and was sized approximately half of the lane width in the long dimension (vertical dimension in figures). Figure 43: Sounding estimate of the I-55 bridge deck delamination
 grid. Owing to the excessive cracking observed in the concrete, imaging results were difficult to interpret.")

41 Figure 44: Sounding estimate of the I-55 bridge deck delamination 147. Results: The ultrasonic image capture was performed using the MIRA device on a cm ( in.) grid. Owing to the excessive cracking observed in the concrete, imaging results were difficult to interpret. Combinations of horizontal and vertical scanning orientations were carried out to identify an optimum configuration; however, upon analysis, no overall optimum configuration was identified. One orientation result has been overlaid for each observed delamination presented in Figures 45 and 46. Figure 45: Near-surface reflectors in range 0 to 150 mm (0 to 5.9 in.) for the I-55 bridge deck delamination

42 The results for delamination #132 presented in Figure 45 are the near-surface reflections observed between the surface and 150 mm (5.9 in.) of depth. The orientation of the device during scanning was horizontal, or left to right, in the figure. As a result of this orientation, the region of strongest reflection was the widest portion of the delamination, as seen in red in the figure. Because the device was positioned over an edge of the delamination boundary, the reflected portion was not consistently observed. This resulted in half of the delamination not being strongly reflective. Additional orientations, such as vertical, were able to capture these other areas to confirm delamination. Figure 46: Near-surface reflectors in range 0 to 150 mm (0 to 5.9 in.) for the I-55 bridge deck delamination 147. The second delamination investigated was 147, and the overlaid results are presented in Figure 46. The scan orientation was recorded as parallel to the orientation of the delamination, or as pictured, the MIRA device was oriented from the bottom left of the image scanning to the top right of the image. The observed striation is exactly perpendicular to the scan orientation and is an artifact generated during the interpolation phase of the MIRA software. The results of the second delamination were highly dependent on orientation, and the orientation overlaid was the optimum unique orientation. There was observable agreement between the identified sounded area and the MIRA device reflections. The detail of the agreement was not as predictable as captured in a laboratory test experiment. In this orientation, the reflections observed outside of the sounding boundary are believed to be rebar, with potential small delaminations. Discussion: The field study of critical delaminations under in situ conditions provided an excellent real-world situation in which to explore the capabilities of the MIRA ultrasonic shear wave device. It held a half-day battery charge in the cold climate and had ample data space for several complete grid scans of real-world defect areas. 32

43 The results of the ultrasonic scanned delamination defects did not provide a uniform identification of delamination area; however, the ultrasonic inspection did provide a depth for the observed delaminations. Through the combination of multiple device orientations and testing methods, a general confirmation of the defect was able to be constructed through engineering judgment. One problem encountered during both scans was the sheer number of scans that had to be taken to generate the 3D map. For a given section, it took approximately 1 hour of scanning for one orientation. This included time to mark a test grid on the pavement. The IDOT engineers on-site informed us that it took significantly less time to do sounding with a chain drag and hammer Bridge Girders with Corrosion Where: IL-10 overflow bridge, New Holland, IL When: 4/6/2015 Test Plan: Deploy ultrasound device on decommissioned pre-stressed bridge box girders experiencing corrosion in the stirrup reinforcement. Scan a non-corroded and a corroded bottom section of the box girders. Scans were performed over each target area with the long axis of the MIRA device perpendicular and parallel to the flow of traffic. Visual Observations: Box girders (Figure 47) display corrosion product staining, exposed stirrups and localized spalling of stirrup cover concrete. Damage was focused along bridge centerline and edge of each of the two lanes, concentrated at points distanced approximately 1.5 m (5 ft) longitudinally along each box girder. Water appeared to have seeped down the girder and penetrated the cover at the bottom corner of the suspended girder. Safety support girders were in place to provide additional support. Additional effort was needed to locate scan areas that were exposed, damaged and within reach of the operators. Future tests of bridge girders will require the assistance of a bucket truck for access. Assumed girder profile as drawn, with corrosion location highlighted by a yellow triangle. Figure 47: Simplified double box girder cross section. Yellow triangle denotes common area where corrosion products were observed. Results: The first set of scans (Figures 48 and 49) present a map profile box girder with no visual signs of corrosion. Figure 48 shows the encased strands, voided box area, and intact concrete middle web. Figure 49 displays the continuous void and the confining reinforcement present when scanned 33


44 parallel to bridge traffic flow. Figure 50 is a photograph showing the scanning procedure and an example of a pristine double box girder. Figure 48: Double box girder scanned from bottom. Orientation perpendicular to bridge traffic flow, no visual signs of corrosion. Units of the plot are in millimeters, 1 in. = 25.4 mm. Figure 49: Double box girder scanned from bottom. Orientation parallel to bridge traffic flow, no visual signs of corrosion. Aligned parallel to box girder web (top); aligned parallel to box girder void (bottom). No visual signs of corrosion. Units of the plot are in millimeters, 1 in. = 25.4 mm. 34
 display a region of the double box girders that visually presented signs of corrosion by-products.")

45 Figure 50: Photograph of scanning process on visually pristine double box girder. Orientation scanning perpendicular to traffic flow. The second set of scans (Figures 51 through 53) display a region of the double box girders that visually presented signs of corrosion by-products. Figure 51 displays no significant change in identifying the strands and the expected void present in the cross section. The parallel orientation was captured in Figure 52, where the continuous reflection resulting from the box girder void and the confinement reinforcement are clearly visible with no distortion. The scan presented in Figure 53 was performed over a longer distance on various levels of visual corrosion damage. Overall, the clarity and quality of the scan are noticeably decreased over this region. The only distinct, unexpected reflection is annotated in the figure and was observed in a region that was not visually displaying signs of corrosion by-products. A photograph capturing the state and scan method is provided in Figure 54. Figure 51: Double box girder scanned from bottom. Orientation perpendicular to bridge traffic flow, significant visual signs of corrosion. Units of the plot are in millimeters, 1 in. = 25.4 mm. 35

 Reflection @ 200 mm (7.9 in.")

46 Figure 52: Double box girder scanned from bottom. Orientation parallel to bridge traffic flow, significant visual signs of corrosion. Units of the plot are in millimeters, 1 in. = 25.4 mm. Unexpected Reflection (Delamination) 200 mm (7.9 in.) Figure 53: Double box girder scanned from bottom. Orientation parallel to bridge traffic flow, various levels of visual signs of corrosion. Unexpected reflection occurs at a zone with no visual corrosion. Units of the plot are in millimeters, 1 in. = 25.4 mm. Figure 54: Photograph of visually corroded scan location and testing method. 36
 successfully located the regions within the box girder that were intentionally voided by design and the location of the support web in the center of the cross")
47 Discussion: The device was able to observe all expected forms of steel present in the box girder, the pre-stressed strands, and the stirrup reinforcement. The ultrasonic maps (Figures 48 and 49) successfully located the regions within the box girder that were intentionally voided by design and the location of the support web in the center of the cross section of the box girder. The device was quite successful at quality assurance of in-service concrete elements. Until significant voiding or delamination was present within the concrete, the device did not provide a detailed-enough reflection to determine whether reinforcement was corroded or not. However, with significant corrosion comes the inevitable fracture and deterioration of the concrete matrix. The fracture and deterioration of the concrete matrix lead to poor energy penetration and provides an indirect indicator of corrosion by decreasing the quality of the overall scan. While not an exclusive diagnosis of issues, this method is a valid way to flag areas for further inspection New Pavement Joints Where: I-57 bridge near Monee, IL When: 4/6/2015 Test Plan: Deploy ultrasound device on new pavement to classify joint condition and quality. Four joints were identified for scanning. The first three were identified as acceptable by existing MIT scans, and a fourth joint was identified by MIT scans to be lacking dowels. Additionally, three of the joints were in pavement that was at least 1 week old, while the last joint was only 2 days old. Visual Observations: On the day of the scan, the site conditions were dry, cool, and windy. The joints being scanned had recently been saw-cut, and excess cement dust was present. To produce significant signal strength, the team was required to dry-sweep the area prior to scanning. The joints were scanned on each side, as shown in Figures 55 and 56. After sweeping the area, the tined surface was not observed to affect the test results. Figure 55: Scanning Joint 9, east side. 37
 had significant dust on the surface from being recently saw-cut.")

48 Figure 56: Map scanning Joint 26. Results: The results for the three acceptable joints are presented in Figures 57 through 62. To identify a joint position, the depth should be read from the centroid of the reflector. The west side of Joint 1 (Figure 58) had significant dust on the surface from being recently saw-cut. The cement dust significantly decreased the amount of energy penetrating into the slab. As a result, the reflections in some portions of the images were noticeably decreased. Figure 59 shows a scan on a relatively earlyage concrete slab at location Joint 9, which was only a single lane wide. The reflectors around the rebar were noticeably increased. On the other side of the same joint (Figure 60), the reflections from the scattering in the early-age concrete made dowel bar identification impossible. Saw Cut Back Wall Dowel Figure 57: Joint 1, east side. Units of the plot are in millimeters, 1 in. = 25.4 mm. 38

.")


49 Figure 58: Joint 1, west side. Units of the plot are in millimeters, 1 in. = 25.4 mm. Figure 59: Joint 9, east side (only 2 days old). Units of the plot are in millimeters, 1 in. = 25.4 mm. Figure 60: Joint 9, west side (only 2 days old). Units of the plot are in millimeters, 1 in. = 25.4 mm. Figure 61: Joint 12, east side. Units of the plot are in millimeters, 1 in. = 25.4 mm. 39

 and total count of a series of dowels.")

50 Figure 62: Joint 12, west side. Units of the plot are in millimeters, 1 in. = 25.4 mm. During initial MIT scanning, Joint 26 was identified as lacking any indication of dowels. On the basis of a site visit, some debate existed about whether the MIT experienced interference or whether the contractor had not inserted dowels. The team performed a map scan (Figure 63) and confirmed the MIT scan s findings that the joint lacked any dowels. Figure 63: Joint 26, map scan results displayed as a plan view over the joint area. Discussion: This inspection identified successful use of the MIRA device to locate the coarse horizontal position (± several inches) and total count of a series of dowels. The inspection also identified critical areas of limitations for the practical use of the MIRA device relating to surface conditions and age of concrete. The presence of loose cement dust causes excessive difficulty in imaging a structure. An ideal solution would be to pressure-wash clean, new joints prior to scanning or allow a structure to be naturally weathered to remove debris. However, the presence of tined pavement was not clearly observed to occur with the difficulty in imaging of the pavements. Another critical observation from this trip was the importance of concrete age for inspection. The early age (2 days after casting) of the concrete material around Joint 9 caused non-structural reflection noise. The pavement still exhibits significant plastic behaviors at a small energy scale. The increased random noise in the resulting images obscured the ability to identify dowels or the thickness of the slab. This poor early behavior can be expected and should be used when planning ideal inspection windows in project scheduling. Based on the results observed in this study, a minimum age of 1 week should be required before testing with the ultrasonic shear wave imaging device. 40

51 4.1.5 Asphalt Bridge Deck Scanned from Below Where: Bridge over I-72 near New Berlin, IL When: 5/18/2015 Test Plan: Deploy an ultrasound device on a bridge deck with asphalt overlay to determine the soundness of the concrete bridge deck by scanning from the bottom of the deck upward. The southbound lane of the bridge was recently milled, and two deteriorated sections were patched in a region where asphalt deterioration was also observed. The ultrasound device was deployed underneath the northbound lane to determine whether concrete damage could be detected beneath the non-milled asphalt section. After scanning, the northbound lane on the bridge deck was milled, and no obvious signs of excessive deterioration were observed. Chain sounding was used to confirm no detectable signs of deterioration. Visual Observations: The structure is a four-lane bridge with center curb median, approximately 50 to 75 mm (2 to 3 in.) of asphalt over a 203 mm (8 in.) concrete deck supported by steel girders. The bridge span is across a four-lane divided interstate with a center pier in the median (as pictured in Figure 65). Northbound lanes had asphalt disintegration between lanes of traffic localized to 3048 mm (10 ft) long approximately 3962 mm (13 ft) north of the southern edge of the deck. Figure 64 provides photos before work began, as captured in 2013 by Google Images. Areas of deterioration are visible along the white line on the northbound and southbound lanes. Figure 64: Bridge profile (top right), deck view midspan looking south in northbound lane with expansion joint visible (bottom). 41
.")
 deep, with a full thickness of the concrete slab at approximately 200 mm (7.8 in.). A 150 mm (5.9 in.) long reflector was observed at approximately 150 mm (5.9 in.), but this reflector could not be confirmed through later sounding.")
52 Results: A map mode image was captured from the bottom side of the bridge deck with existing asphalt overlay both perpendicular (Figure 65) and parallel (Figure 66) to the top traffic flow (note that these images are inverted to physical orientation; the top of the image corresponds to the bottom of the deck). In the perpendicular direction, longitudinal reinforcement was observed at approximately 60 mm (2.3 in.) and 110 mm (3.9 in.) deep, with a full thickness of the concrete slab at approximately 200 mm (7.8 in.). A 150 mm (5.9 in.) long reflector was observed at approximately 150 mm (5.9 in.), but this reflector could not be confirmed through later sounding. The parallel direction detected two layers of transverse reinforcement with a similar full-thickness reflection at 200 mm (7.8 in.). A map mode scan was captured on the southbound lanes to identify the recently patched region of the deck. The images produced by the standard Ideals software package that comes with the MIRA unit are presented in Figures 65 through 67. Owing to the significant roughness caused by the milling operation, the device was unable to automatically determine a consistent wave velocity. Independent processing with the free OpenSAFT MATLAB software allowed for a static velocity to be defined in the existing scan in post-processing. The adjusted B-scan image shown in Figure 67 is represented in Figure 68. The concrete patched area was anticipated to have distinctly different material properties than the original concrete deck. In the collected image, no distinct reflector of the patched area was observed. Unconfirmed Reflector Top Surface Figure 65: Underside of northbound lanes under asphalt deterioration (perpendicular to top traffic flow). Units of the plot are in millimeters, 1 in. = 25.4 mm. Reinforcement Figure 66: Underside of northbound lanes under asphalt deterioration (parallel to top traffic flow). Units of the plot are in millimeters, 1 in. = 25.4 mm. 42
. Units of the plot are in millimeters, 1 in. = 25.4 mm.")
.")
53 Figure 67: Topside of southbound lanes after milling exposed concrete (perpendicular to top traffic flow). Units of the plot are in millimeters, 1 in. = 25.4 mm. Figure 68: Topside of southbound milled lanes, OpenSAFT (perpendicular to top traffic flow). Units of the plot are in millimeters, 1 in. = 25.4 mm. Discussion: The completely independent device allowed for straightforward data collection while scanning from a bucket truck. Surveying an exact start and stop location was difficult using tape measures on the large structure (Figure 69). For future under-deck scans, a survey total station should be used to align the scan locations on the top and bottom of the deck structure. Scanning a concrete deck below an existing asphalt overlay allowed for successful identification of rebar locations and estimation of overall concrete damage level based on reflectors. The northbound lanes were scanned in areas of expected deterioration, with no damaged reflectors seen within the regions of observed asphalt deterioration. A potential false detection of damage was observed with the MIRA device with no confirmation by conventional sounding. MIRA scanning on a milled surface disrupted the detection of the wave velocity. This disruption resulted in a saturated image with no useful information. By assuming a constant wave velocity value in advance, a resulting image was reprocessed using the OpenSAFT scripts. In the resulting scan of a milled surface, significant noise was still observed, and the full-thickness backwall reflector location was skewed by the constant velocity assumption. 43

54 Figure 69: Device application overview MIRA Tests for Bridge Parapet Quality Where: I-57 bridge parapet near Kankakee, IL When: 4/27/2015 Test Plan: Deploy ultrasound device on slipform cast parapets to compare against drilled cores for detecting large air voids. Visual Observations: The bridge structure on this project was being reconstructed, and the investigation occurred near completion prior to traffic being resumed. The bridge parapets were cast 4/24/2015 and had remained covered since casting. The weather was dry, warm at 24 C (75 F), and 44

55 windy with 16 to 32 km/h (10 to 20 mph) gusts. Test locations were measured approximately 30 m (100 ft) apart with a random minor offset and placed near the mid height of the wall. A total of 18 test locations were identified and cored. Results: The scan record and core photograph for an example parapet location are provided in Figure 70. Additionally, a complete record of all MIRA and photographic images at each coring location are included in Appendix D of this report. Core locations 1 9 were located on the west parapet of the southbound lane. Core locations 10 through 18 were located on the east parapet of the southbound lane of the bridge. In general, Cores 1 through 9 presented increased scattering noise at each location compared with Cores 10 through 18. Figure 70: Example scans and core photographs from parapet location 10. The sampled cores displayed no obvious signs of significant voiding within the parapet wall section. Several core locations appear to have fractured. The cause of this fracture could be poor consolidation and/or a side effect of the horizontal coring procedure. With the collected data, an analysis was done to determine whether the MIRA data could correlate with a cracked extracted core. Table 1 presents a perceived quality factor and other key information regarding each core location. The quality factor was generated based on the amount of scattered reflectors in the shallow nearsurface portion of the image and whether a back wall was apparent within the MIRA scan image. An approximately 75% correlation was observed between the quality factor of the MIRA scan and the visual quality factor of the extracted core. 45
56 Table 1: Summary of Parapet Observations MIRA Core Quality Rebar Velocity Horizontal Velocity Vertical Quality Rebar Comment 1 Good Yes Good Yes 2 Good Yes Good Yes 3 Good Yes Poor Yes Crack in core at rebar 4 Good Yes Good Yes 5 Poor Yes Good Yes 6 Good Yes Good Yes 7 Poor Yes Poor Yes 8 Poor Yes Poor No 9 Poor Yes Poor Yes 10 Good Yes Good Yes 11 Good Yes Good Yes 12 Good Yes Good Yes 13 Good Yes Good Yes 14 Good Yes Good Yes 15 Good Yes Good Yes MIRA shows near-surface reflectors at 90 mm (3.5 in.); core does not Bottom of core missing; rebar exposed MIRA shows scattering; core shows crack at rebar depth MIRA shows large reflectors; core shows crack and no rebar MIRA shows large, shallow reflectors; core shows multiple cracks 16 Good Yes Poor Yes Cracked core not at rebar 17 Poor Yes Poor Yes Cracked at midspan of core; seen in 1 of 2 MIRA scans 18 Good Yes Poor Yes Cracked before inner rebar; not seen on MIRA Discussion: Based on the selected locations and extracted cores, no area of significant voiding was observed. However, the MIRA scans displayed several reflectors in regions of sound concrete. Some of these reflectors can be accounted for through the reinforcement, while others occurred in regions of sound extracted concrete. During the visit, a field engineer reported that during construction the contractor increased the slipform speed approximately through the regions of Cores 7 and 8. The contractor was instructed to reduce speed and continue the rest of the work (Regions 9 through 18). Qualitatively, MIRA scans at Cores 7 and 8 appeared to have increased scattered reflections. Currently, there is no common measure for recording and comparing this increased random scattering measurement. For future work, this test may form a basis for identifying areas of potentially poor consolidation when a clear air void reflector is not observed. Based on the performance in this brief field study, the MIRA device may be a successful first-pass, non-destructive measurement to identify regions of 46
57 potential need for further coring. If a region of a parapet returns a distinct and clear full-thickness reflection, the inspector can be reasonably confident that the parapet contains sound concrete and that a destructive core would not be needed. Test parapets with intentional or confirmed voiding would be needed to confirm the accuracy of this method Dowel Alignment in Magnetically Complex Zone Where: I-57 and IL-146 near Dongola, IL When: 10/14/2015 Test Plan: Deploy ultrasound device to locate dowels bars and tie bars on a slipform paved two-lane interstate with an existing reinforced jointed P.C.C. pavement that had been overlaid with hot mix asphalt. The standard accepted misalignment detection method for this project was the MIT scan. At the test locations, the MIT scan detected interference with the existing reinforced jointed P.C.C pavement. The MIRA device is not magnetic based and therefore is not influenced by the deeper steel. Additionally, a low-power handheld rebar meter was manually used to successfully compare measurements against the MIRA results. For the first test, the MIT scan and the handheld rebar meter were used near existing cores to confirm a visual ruler measurement to the top rebar inside the cored hole. The visual measurement was taken as the ground truth to identify a baseline accuracy for the two non-destructive testing methods. The second test measured the tie bar placement depth at the centerline of the two-lane-wide slipform paved slab. During paving operations, the inspector visually measured depth with a shovel and ruler. The final test performed on-site was a full-width scan of the hardened concrete two-lane slab at a contraction joint. This test was carried out using the MIRA device and the handheld rebar meter. The objective of this test was to compare MIRA against a rebar meter for identifying critical misalignment values. Visual Observations: Figures 71 through 75 provide an overview of the field testing activities and the layout of the site. Concern about the placement and orientation of the dowel bars with a dowel bar inserter arose because the MIT scan was unable to provide verification. The purpose of the investigation was to identify the ability of the MIRA device to locate dowel bars and tie bars. 47


58 Figure 71: Comparison scanning over a joint. Figure 72: MIRA scanning for dowel locations near core. 48


59 Figure 73: Two-lane slipform paver. Figure 74: Visual dowel bar depth at an existing cored location. Figure 75: Fresh tie bar location identification with low-power rebar meter. Fresh concrete was removed to confirm tie bar measurements. 49
60 Results: The depths of reinforcement for the ultrasonic device images were obtained by using the Ideals software and selecting the location of the centroid of the reinforcement reflector. The results of the dowel bar localization and tie bar localization tests are summarized in Table 2 and Table 3. At four cored dowel bar locations the average error for the magnetic rebar meter compared to visual measurement was 3.6 mm (0.14 in.). The similar measurement with the MIRA device yielded a higher average error of 7.4 mm (0.29 in.). The dowel bar localization test confirmed that for a group of four core locations, the rebar meter had a lower average error compared to the visual measurement of rebar depth. At three different tie bar locations, the two methods were evaluated again to determine the location of the tie bar. The error was calculated against fresh concrete measurements taken by the inspector on-site. The tie bar localization test showed the average error between the two methods being effectively identical. Station Table 2: Dowel Depth Comparison Near Existing Cored Areas, mm (in.) Visual Dowel Top Rebar Meter MIRA Rebar Meter Error MIRA Error (4.50) (4.48) (4.72) 0.5 (0.02) 5.6 (0.22) (4.75) (4.80) (4.17) 1.3 (0.05) 14.7 (0.58) (5.25) (4.88) (5.08) 9.4 (0.37) 4.3 (0.17) (5.00) (5.10) (4.80) 2.5 (0.10) 5.1 (0.20) Avg. Error 3.6 (0.14) 7.4 (0.29) Table 3: MIRA Scans on Centerline Tie Bar Depth, mm (in.) Visual Rebar Meter MIRA Center East West Center Center Error East West Center Center Error Tie Bar (4.88) (5.32) (5.44) (5.38) (0.51) (4.63) (4.35) (4.49) 9.85 (0.39) Tie Bar (5.13) (5.16) (5.48) (5.32) 4.95 (0.20) (5.37) (5.29) (5.33) 5.30 (0.21) Tie Bar (5.25) (5.08) (5.12) (5.10) 3.81 (0.15) (5.10) (5.65) (5.37) 3.13 (0.12) Avg. Err (0.28) Avg. Err (0.24) The final test carried out was to evaluate the position of dowel bars along a full joint of hardened concrete. This test took measurements on each side of a joint and calculated vertical tilt and horizontal alignment measurements as presented in Figures 76 and Figure 77. Figure 76 presents the absolute vertical tilt of the measured dowel bars. On average, the values obtained through MIRA measurement are larger than the values obtained through the rebar meter. Because no cores were 50


61 present at the joint scanned no visual observation occurred during this measurement, the expected error of the measurement (as reported in Table 2) should be taken into consideration before interpretation. The horizontal misalignment measurements shown in Figure 77 identify horizontal dowel spacing determined from the MIRA scan. As a result of operator positioning error, three dowel spacings are omitted from the plot. In general, the variability of dowel spacing determination by the MIRA device was visually lower than the variability observed through application of the standard rebar meter. Figure 76: Vertical tilt measurements for 38.1 mm (1.5 in.) dowels at Sta joint. Figure 77: Horizontal spacing for 38.1 mm (1.5 in.) dowels at Sta joint. 51
62 Discussion: The measurement of dowel depth with the handheld rebar meter was observed to be well correlated against the visual method. The dowel position error observed from the handheld rebar meter was approximately 3.5 mm (0.14 in.) with respect to the visual measurements. This accuracy is a practical limit of visual measurement in the field with a ruler. The MIRA device reported results with an increased error of approximately 6.4 mm (0.25 in.). For other standard ultrasonic methods operating at 50 khz in concrete, the value of error is relatively very low. In conventional ultrasound, the resolution of a full wave reflection is expected to be around one wavelength, or approximately 50 mm (2 in.). The SAFT technology provided a significant improvement over conventional ultrasound in this application. According to the American Concrete Pavement Association s specification for dowel misalignment (ACPA 2013), the maximum allowed vertical tilt is 25.4 mm (1 in.). The error observed from measurements and the maximum allowed tilt are on the same order of magnitude. Because a tilt measurement is the difference between two depth measurements, the expected average error is 6.35 mm (.25 in.) for the rebar meter and 12.7 mm (0.5 in.) for the MIRA device. The small magnitude of measurement error of the allowed tilt prevents a definitive misalignment decision to be generated. Only incidents of significant deviation are able to be determined through the MIRA scanning method. The horizontal translation is highly dependent on the ability of the operator to measure and place the MIRA device in a perfect fashion. The ACPA specification for individual dowel maximum horizontal displacement is 50.8 mm (2 in.). The horizontal errors observed were less than the allowed maximum displacement. The MIRA device alone appears to be useful as a measurement tool for horizontal dowel spacing. The device successfully identified the horizontal translation and vertical tilt, and spacing of the dowel bars. Horizontal skew and longitudinal translation were not discussed due to high positional errors in identifying the rebar reflectors in those planes using the MIRA device. In areas where the MIT scan fails to run because of interference or the MIT scan displays large errors, the MIRA device is an acceptable method to confirm findings before reconstruction is required Bridge Deck Thickness Profile Where: IL-78 bridge north of Jacksonville, IL When: 1/7/2016 Test Plan: Scan bridge deck cross section with ultrasound array device to generate a thickness profile map with the MIRA device to confirm existing fresh concrete ruler measurements. Visual Observations: A newly constructed bridge s deck formwork did not deflect as expected and resulted in a thin deck. During construction, depth measurements of the fresh concrete were recorded by an inspector with a ruler and are provided in Table 4. Target slab depth was 203 mm (8 in.). 52
 190.5 (7.5) 196.9 (7.8) G 187.3 (7.4) 187.3 (7.4) 177.8 (7.0) H 190.5 (7.5) 190.5 (7.5) 190.5 (7.5) I 196.9 (7.8) 196.9 (7.8) 190.5 (7.5) J 200.0 (7.9) 196.9 (7.8) 190.5 (7.5) AB 190.5 (7.5) 190.5 (7.5) 177.")
63 Table 4: Ruler-Measured Depths of Fresh Concrete During Construction in Units of mm (in.) Fillet Bay 1 Bay 2 Bay 3 B (7.5) (7.5) (7.5) C (7.5) (7.5) (7.8) D (7.5) (7.5) (7.8) G (7.4) (7.4) (7.0) H (7.5) (7.5) (7.5) I (7.8) (7.8) (7.5) J (7.9) (7.8) (7.5) AB (7.5) (7.5) (7.0) AC (8.0) (7.8) (7.5) Results: Results of the transverse scans were plotted in Figures 78 through 87, each labeled by fillet location. The vertical white lines denote the midspan of a bay as referenced by the ruler measurements taken during construction. Depths for each bay were visually read off the profile and are summarized in Table 5. Deck thickness profile plots along each bay were tabulated and are provided in Figure 88. Along with the profile plots, maximum and minimum thickness bounds were estimated and plotted to aid in confidence of each individual measurement. Sharp changes in depth are artifacts of inaccurate velocity measurements of the MIRA device from each scan position and were not confirmed visually. Figure 78: Fillet B thickness cross section; white lines display ruler locations. Units of the plot are in millimeters, 1 in. = 25.4 mm. 53


64 Figure 79: Fillet B cross section repeated. Units of the plot are in millimeters, 1 in. = 25.4 mm. Figure 80: Fillet C cross section. Units of the plot are in millimeters, 1 in. = 25.4 mm. Figure 81: Fillet D cross section. Units of the plot are in millimeters, 1 in. = 25.4 mm. 54


65 Figure 82: Fillet G cross section. Units of the plot are in millimeters, 1 in. = 25.4 mm. Figure 83: Fillet H cross section. Units of the plot are in millimeters, 1 in. = 25.4 mm. Figure 84: Fillet I cross section. Units of the plot are in millimeters, 1 in. = 25.4 mm. 55


66 Figure 85: Fillet J cross section. Units of the plot are in millimeters, 1 in. = 25.4 mm. Figure 86: Fillet AB cross section. Units of the plot are in millimeters, 1 in. = 25.4 mm. Figure 87: Fillet AC cross section. Units of the plot are in millimeters, 1 in. = 25.4 mm. 56
67 Table 5: Summary of Thickness Measurements for Each Bay and Cross-Section Fillet Fresh Ruler Thickness, mm (in.) MIRA Thickness Fillet Bay 1 Bay 2 Bay 3 Bay 1 Bay 2 Bay 3 B (7.5) (7.5) (7.5) 178 (7.0) 177 (7.0) 206 (8.1) C (7.5) (7.5) (7.8) 173 (6.8) 179 (7.0) 188 (7.4) D (7.5) (7.5) (7.8) 169 (6.7) 175 (6.9) 190 (7.5) G (7.4) (7.4) (7.0) 174 (6.9) 180 (7.1) 201 (7.9) H (7.5) (7.5) (7.5) 193 (7.6) 189 (7.4) 187 (7.4) I (7.8) (7.8) (7.5) 172 (6.8) 195 (7.7) 187 (7.4) J (7.9) (7.8) (7.5) 190 (7.5) 200 (7.9) 179 (7.0) AB (7.5) (7.5) (7.0) 177 (7.0) 205 (8.1) 169 (6.7) AC (8.0) (7.8) (7.5) 187 (7.4) 211 (8.3) 209 (8.2) Repeat Fillet B 195 (7.7) 182 (7.2) 174 (6.9) Difference B vs. Repeat B 17 (0.7) 6 (0.2) 32 (1.3) 57


68 Figure 88: Summary figures of MIRA depths for each respective bay along referenced cross sections. 58
69 Discussion: To measure the repeatability and demonstrated field confidence in the MIRA device, the first cross section was scanned twice (Figures 78 and 79). A comparison of the two scans for each bay was summarized in Table 5. The maximum thickness difference between the two datasets was 32 mm (1.3 in.). The difference between the two datasets significantly decreases the practical value of the individual thickness measurements. Prior to this field test, the expected maximum difference was ±7.3 mm (0.29 in.), as observed during a previous field study. To account for the observed repeatability error, ±16 mm (0.6 in.) bounds were plotted on each thickness profile plotted in Figure 89. Additional investigations into the accuracy of thickness measurements produced a similar repeatability error of ±18 mm (0.7 in.). The driving component behind this error is the error within the shear wave velocity measurement. In the mapping mode of the MIRA device, the shear wave velocity is not displayed and cannot be adjusted after the collection of data. Therefore, after this analysis, the researchers concluded that if thickness accuracy is critical, the wave velocity should be set to a constant value instead of using the value directly measured by MIRA. A representative section of known thickness concrete should be scanned, and the wave velocity should be set as a constant in the menu system. After accounting for the observed error, the scanned deck thickness was consistently observed to be below the target thickness of mm (8 in.). The location of the minimum observed deck thickness was at Bay 1 Cross-Section Fillet D, with an estimated thickness of 169 ± 18 mm (6.6 ± 0.7 in.) Pier Cap Repair Inspection Where: I-55/64 bridge piers in East St. Louis, IL When: 3/26/2016 an 10/26/2016 Tests Plan: Deploy the MIRA device on repaired pier caps to determine fiber-reinforced polymer (FRP) composite bonding. Visual Observations: Pier caps under the bridge are approximately 30 ft above grade. Approximately half of the pier caps displayed degradation and corrosion by-products and were being repaired. Pier caps were being repaired for continued improved service life. Results: During the first visit, the MIRA device was unable to display repeatable reconstructions of the pier caps. Further investigation found that the signal being received by the unit was not sufficient to detect velocity in the pier caps. After setting a fixed wave velocity, the reconstruction still could not provide a repeatable image. After processing the data, it was determined that the noise levels in these measurements were too high for sufficient reception of the ultrasonic signal. During the second visit after the FRP was applied, the device performed significantly better and was able to resolve images of the structural concrete. Two areas were selected to be scanned, first a section of a rectangular pier cap, and second, a section of a 1 m diameter round column. The device settings were setup with a fixed velocity estimate, a maximized analog gain and care was taken to maximize the coupling force to improve energy transmission into the pier. 59

70 The pier cap area selected to be scanned was directly above a repaired column and had also been repaired with fiber reinforcement. A map result across a repaired pier cap is presented in Figure 89a. The fiber reinforcement was only within the center region of the scanned area as noted in the caption. The fiber reinforcement in this pier cap improved the ability of MIRA to identify a reflector at the full depth thickness of approximately 1 m (3.28 ft). This behavior was noted to have occurred in a region that had the fiber reinforcement completely saturated with epoxy, such that the surface was smooth. In the center fiber-reinforced, region a distinct increase in near-surface noise in the image can also be seen. Device performance outside of the fiber reinforcement area was consistent with the initial visit to the site. The second scanned area was on a support column that was repaired with fiber reinforcement, as pictured in Figure 91b. The column was scanned on two sides; the device was oriented such that the long axis was parallel to the long axis of the column. The column was then scanned vertically along the long axis of the device. This orientation allowed all 12 sets of transducers to be in contact with the surface. Two locations (the northwest and northeast sides) on the same column were scanned. The results of these scans are presented in Figure 89c. The first scan (a) in the set was on a region where the FRP texture was rough and little surface epoxy pooling was visible. The second scan (b) in the set was on a region, Figure 89b, where the FRP texture was smooth and surface epoxy was apparent. In the second scan, strong backwall reflections were able to be observed just beyond 1 m (3.28 ft) in depth. Figure 89a: Repaired pier cap, fiber reinforced between 300 to 800 mm (11.8 to 31.5 in.); horizontal. Units of plot are in millimeters, 1 in. = 25.4 mm. 60

 diameter FRP-wrapped column, northeast (on left) and northwest (on right sides.")
71 Figure 89b: Northwest side of FRP-wrapped column, 1 m (3.28 ft) diameter. Triangle in region of smooth epoxy coating, Circle in region of coarse epoxy coating. Ruler in plot is in inches, 1 in. = 25.4 mm. Figure 89c: Two different vertical B-scans of a 1 m (3.28 ft) diameter FRP-wrapped column, northeast (on left) and northwest (on right sides. The plots are rotated to represent the orientation of the vertical column that was scanned. Units are in millimeters, 1 in. = 25.4 mm. 61

72 Discussion: In the field testing during the first visit, this was the first time the device failed to penetrate a concrete mixture and provide a surface wave for velocity measurement. The investigators are not able to explain why the MIRA device was unable to collect data from this test site. It is possible that high levels of ambient electromagnetic noise levels at the field site caused by a nearby electric train line disrupted the measurements. During the second visit, the performance of the device was greatly improved compared to the initial visit. The scan of the fiber-reinforced pier cap and column was successful in capturing the backwall reflection. The ability to observe a backwall appeared to visually correlate with the amount of epoxy present in the coating material. No additional studies were performed to determine the bonding characteristics of the fiber reinforcement. All of the fiber reinforcement appeared to be of good quality without any signs of tears or breaks. The results of this investigation found that the MIRA device was able to penetrate through fiber reinforcement in some regions, while the device was unable to resolve details on other regions of similar quality concrete Bridge Deck Thickness Profile Site 2 Where: Two bridge structures north of Gibson City, IL When: 9/27/2016 Test Plan: Scan bridge deck cross section with the MIRA device to confirm fresh concrete ruler measurements to indicate whether the thickness is comparable to the target design of 203 mm(8 in.) MIRA was used to measure the thickness of 40 different locations on each bridge (eight transverse lines; each line includes five locations). Visual Observations: At the center of one bridge, a hole was drilled through the thickness of the slab. The measurement indicated a thickness of 190 mm (7.5 in.), as shown in Figure 90. Figure 90: Measuring the thickness of a hole drilled through the slab. 62
73 Results: Tables 6 and 7 show the measured thicknesses of two bridge decks. The average thickness was 197 mm (7.8 in.) and 190 mm (7.5 in.) for Bridge 1 and Bridge 2, respectively. Table 6: MIRA-Measured Depths of Bridge 1 MIRA Thickness, units of mm (in.) Longitudinal Line # Transverse line # Average (7.32) 193 (7.60) 194 (7.64) 200 (7.87) 205 (8.07) 196 (7.72) (7.72) 193 (7.60) 205 (8.07) 189 (7.44) 201 (7.91) 197 (7.76) (7.60) 184 (7.24) 200 (7.87) 193 (7.60) 201 (7.91) 194 (7.64) (7.05) 179 (7.05) 200 (7.87) 191 (7.52) 212 (8.35) 192 (7.56) (7.05) 189 (7.44) 210 (8.27) 189 (7.44) 210 (8.27) 195 (7.68) (7.60) 184 (7.24) 205 (8.07) 193 (7.60) 196 (7.72) 194 (7.64) (7.87) 200 (7.87) 214 (8.43) 203 (7.99) 205 (8.07) 204 (8.03) (7.91) 200 (7.87) 220 (8.66) 215 (8.46) 196 (7.72) 206 (8.11) Average 191 (7.52) 190 (7.48) 206 (8.11) 197 (7.76) 203 (7.99) 197 (7.76) Table 7: MIRA-Measured Depths of Bridge 2 MIRA Thickness, units of mm (in.) Longitudinal Line # Transverse line # Average (7.99) 203 (7.99) 207 (8.15) 196 (7.72) 203 (7.99) 202 (7.95) (7.40) 186 (7.32) 196 (7.72) 200 (7.87) 191 (7.52) 192 (7.56) (7.17) 186 (7.32) 194 (7.64) 186 (7.32) 193 (7.60) 188 (7.40) (7.17) 182 (7.17) 191 (7.52) 179 (7.05) 184 (7.24) 184 (7.24) (7.05) 175 (6.89) 182 (7.17) 175 (6.89) 181 (7.13) 178 (7.01) (7.05) 186 (7.32) 193 (7.60) 184 (7.24) 193 (7.60) 187 (7.36) (6.89) 182 (7.17) 201 (7.91) 184 (7.24) 193 (7.60) 187 (7.36) (7.99) 203 (7.99) 207 (8.15) 196 (7.72) 203 (7.99) 202 (7.95) Average 188 (7.40) 186 (7.32) 196 (7.72) 200 (7.87) 191 (7.52) 192 (7.56) 63
74 4.2 OTHER FIELD VERIFICATION TESTS In experimenting with the MIRA device, tests were conducted during various field site visits in summer These sites included roller-compacted concrete (RCC) and a concrete overlay on a composite pavement (ultra-thin whitetopping, UTW). The composite pavement consisted of a concrete pavement that had been overlaid with hot mix asphalt MIRA Tests on Roller-Compacted Concrete (RCC) A newly constructed RCC storage lot was investigated as part of the survey of RCC pavements in Illinois. The 178 mm (7 in.) design thickness was confirmed by a MIRA scan (Figure 91), validating that the ultrasonic device is useful for concrete structures other than conventional concrete pavements. Additional scans at this project site were taken near a cold joint (Figure 92), where evidence of strong reflectors was seen in the thickness of pavement; this could be evidence of poor compaction or poor consolidation of the RCC at a cold joint. Figure 91: A MIRA B-scan of a 17.8 cm (7 in.) thick RCC pavement. Units of the plot are in millimeters, 1 in. = 25.4 mm. 64

75 Figure 92: Two MIRA B-scans of an RCC pavement near a cold joint, possibly indicating poor compaction or consolidation. Units of the plot are in millimeters, 1 in. = 25.4 mm MIRA Tests on Ultra-Thin Whitetopping (UTW) During a survey of a distressed UTW section, MIRA was used to evaluate the overlay thickness and provided evidence of the total composite pavement thickness. Ultra-thin whitetopping is also called bonded concrete overlay of asphalt. Ultrasonic test devices will indicate a reflection at an interface of materials with different acoustic impedances for example, between concrete and air but because concrete and asphalt have high aggregate contents, the acoustic impedances are not necessarily very different. It was therefore reasoned (though not confirmed through coring, for example) that a backwall reflection at the known design composite thickness would indicate the presence of a bond between the concrete overlay and the asphalt pavement substrate. Similarly, a backwall reflection at the known design depth of only the concrete overlay would indicate debonding of the overlay because it is likely that air or water would be present between the debonded layers to cause a reflection. The UTW project that was surveyed consisted of a nominal 10 cm (4 in.) UTW concrete overlay (9.9 to 11.7 cm (3.9 to 4.6 in. constructed thickness), a 10 to 13 cm (4 to 5 in.) post-milled asphalt pavement substrate, and an existing concrete substrate of 20 cm (8 in.) variable thickness. Figure 93 shows reflections at two depths, which could indicate the backwall reflections of the UTW overlay and the asphalt pavement substrate; this scan suggests that the composite thickness of the overlay and asphalt pavement substrate is about 13 cm (5.3 in.). Figure 94 shows a backwall reflection at a depth of almost 33 cm (13 in.), which could be the backwall reflection of the composite pavement consisting of the UTW overlay, the asphalt pavement, and the original concrete pavement. The presence of a reflection at a depth such as indicated in Figure 94 could be indicative of good contact or bond between each of the three layers. Although the MIRA findings of this survey were not confirmed, such as by using cores to determine which layers were bonded or unbonded, the findings do indicate that MIRA could be useful as a surveying tool for example, to aid in locating potential areas that may require coring to confirm thickness or bond condition. 65

76 Figure 93: A MIRA B-scan indicating possible backwall reflections at the interface between the UTW concrete overlay and asphalt and between the asphalt and the bottom layer of concrete. Units of the plot are in millimeters, 1 in. = 25.4 mm. Figure 94: The only reflection in this MIRA scan was at a depth of almost 33 cm (13 in.), which is likely the backwall reflection of the composite UTW-asphalt-concrete pavement. Units of the plot are in millimeters, 1 in. = 25.4 mm. 66

77 4.2.3 MIRA Tests on Urban Concrete Pavement The performance of concrete pavements is related to many factors including traffic loading, environmental factors, support conditions, and design features. The performance of concrete pavement on high volume routes have been studied more widely, but urban concrete pavement performance has received less attention. In the rehabilitation, repair, or maintenance of concrete pavements, there is a need to verify what are the in situ design features for a particular roadway or street. A MIRA investigation was designed to survey several, similar urban concrete pavements in Champaign-Urbana to determine the in situ design features, such as slab thickness, presence, dimensions, and location of reinforcements, and general reinforcement alignment. Many of these features could be estimated by slab coring, but MIRA s capabilities should give insight into pertinent design features rapidly, consistently, and without destructive methods. In the field study, it is generally assumed that longitudinal joints have tie bars while transverse joints contain dowel bars and there is likely no stabilized base below the slab. The seven urban concrete pavement sections inspected in Champaign-Urbana region. The following sub-sections will describe each project location, details, and findings from the MIRA inspection Urban Concrete Inspection on Green Street When: 09/19/2016 Test plan: Ultrasonic device was used to inspect Green Street corridor stretching from Green and Fourth to Green and Wright [3 blocks; m (1225 ft) long]. At each of the three blocks, two panels were investigated, of which one was cracked. The cracked panels are represented by a blue oval, while slabs without visible defects are represented by a a blue rectangle in Figure 95. The location of the panels investigated is marked. Figure 95: Panel locations for Green Street MIRA Investigation [Source: Google Maps] Visual observation: The Green Street corridor is about 10 m (32 ft) wide excluding the curbs. The curb is not within the main slab area and is casted separately. The two longitudinal joints divide the corridor into three distinct lanes. The two outer lanes are 3.4 m (11 ft) wide while the middle lane is 3.1 m (10 ft) wide. The lanes have main slabs about 4.6 m (15 ft) in the longitudinal direction and are expected to consist of 0.20 to 0.23 m (8 to 9 in.) thick slabs. 67
.")
, respectively. The center of the dowel bars was located at a depth of about 0.110 m (4.25 in.")
78 Results: To identify the approximate slab thickness and presence of reinforcement, the pavement surface was dry swept in the measurement area to avoid unnecessary wave scattering. Figure 96 shows two of the 70 B-scans, for the depth of reinforcement and the slab thickness. Discussion: The concrete pavement was found to have an estimated slab thickness of about 0.23 m (9 in.). Each curb-slab longitudinal joint tested had seven tie bars, and each transverse joint had ten dowel bars. The dowel bars were spaced 0.30 m (12 in.) with a length of around 0.61 m (2 ft). IDOT standards are for dowels length and spacing to be 0.46 and 0.30 m (18 and 12 in.), respectively. The center of the dowel bars was located at a depth of about m (4.25 in.) from the surface based on the MIRA scans. The tie bars spacing varied from 0.61 to 0.76 m (2 to 2.5 ft) and the tie bar length varied from 0.61 to 0.73 m (2 to 2.4 ft). Per IDOT standards, tie bar lengths are expected to be 0.76 m (2.5 ft), and tie bar spacing of curb/gutter to slabs or longitudinal construction joints should be approximately 0.61m (2ft). The depth of the tie bars (center) from the slab surface was approximately 0.11 m (4.25 in.) like the dowel bars. A summary of the tie bar calculations for each street block is shown in Tables 8 through 10. The diameter of the tie bars or dowels cannot be resolved with MIRA in its current programmable configuration. Figure 96: Green Street B-scans for the depths of dowel bar (left) and slab thickness (right). Units of the plot are in millimeters, 1 in. = 25.4 mm. Table 8: MIRA-Derived Reinforcement Length and Spacing on Green Street Between Fourth and Fifth Streets CRACKED SLAB PANEL Tie bar spacing Length of tie bar UNCRACKED SLAB PANEL Tie bar spacing Length of tie bar 0.61 m (2.0 ft) 0.73 m (2.4 ft) 0.76 m (2.5 ft) 0.61 m (2.0 ft) Table 9: MIRA-Derived Reinforcement Length and Spacing on Green Street Between Fifth and Sixth Streets 68
 0.73 m (2.")
79 CRACKED SLAB PANEL Tie bar spacing Length of tie bar UNCRACKED SLAB PANEL Tie bar spacing Length of tie bar 0.61 m (2.0 ft) 0.61 m (2.0 ft) 0.73 m (2.4 ft) 0.73 m (2.4 ft) Table 10: MIRA-Derived Reinforcement Length and Spacing on Green Street Between Sixth and Wright Streets CRACKED PANEL Tie bar spacing Length of tie bar UNCRACKED PANEL Tie bar spacing Length of tie bar 0.67 m (2.2 ft) 0.61 m (2.0 ft) 0.76 m (2.5 ft) 0.61 m (2.0 ft) Urban Concrete Inspection on Stadium Drive When: 09/23/2016 Test plan: A MIRA inspection was completed on Stadium Drive from First to Oak Street, which is about 220 m (728 ft) section. Stadium Drive is an old concrete pavement curb and gutter section (>20 years). Four continuous slab panels in this block were investigated. The first and last panel had contraction joints, shown in Figure 97, with a joint opening of about m (0.3 in.), while the jointing in between the panels were transverse contraction joints. The joint sealing is absent in many of the joints. Figure 97: Stadium Drive with unsealed joints. Visual observation: Stadium Drive is about 10 m (32 ft) wide excluding the curb. The curb is not integral with the slabs and is cast separately. The slab panels are about 3.05 m (10 ft) in longitudinal dimension 69
80 and 2.44 m (8 ft) in the transverse as noted in Figure 98. Tie bars are expected in the longitudinal joints and dowels in the transverse joints with an anticipated slab thickness around 0.20 to 0.23 m (8 to 9 in.). Figure 98: Plan view of Stadium Drive. Units of plot are in feet, 3.28 ft = 1 m. Results: The estimated slab depth was found to be about 0.25 m (10 in.). There were four tie bars in each of the inspected panels longitudinal edge. The device could not detect dowel bars in every construction joint, thus indicating their absence, but their presence was detected in every third panel, as shown in Figure 99. The dowel bars were found to have consistent spacing of 0.31 m (1 ft) and were around 0.51 m (20 in.) in length. The average dowel bar depth was estimated to be around 0.13 m (5.2 in.), but some dowel bars were found at a depth greater than 0.15 m (6 in.) as shown in Figure 100. The measured depth for the misaligned reinforcements are marked in Figure 100, for instance, the misaligned dowel bar in Panel 1 is 0.15 m (6 in.) and 0.07 m (2.6 in.) deep at its two ends while the rebar in Panel 4 was found to be 0.1 m (4 in.) horizontally misaligned. A possible zone of voiding or delamination around m (3 in.) can be seen in Figure 99. The tie bars were found to have a consistent spacing of 0.76 m (2.5 ft), which was around what is currently recommended at 0.61 m (2 ft) spacing. The tie bar depth was estimated to be around 0.13 m (5 in.). Discussion: The plan view of the reinforcement location is shown in Figure 100 with the misaligned tie and dowel bars marked in red. Missing and misaligned rebar have been shown in Figure 101 with their approximate vertical depths noted for the misaligned bars. For instance, the tie bar in Slab Panel 2 (indicated in red) was found to be 0.13 m (4 in.) deep while the other end of the tie bar was around 0.14 m (5.5 in.); thus the tie bar was found to be vertically misaligned. Also, all the tie bars were found to have a spacing of 0.76 m (2.5 ft), but in Panel 2, an exception was found where the spacing was 0.91 m (3 ft). In Panel 4, one of the tie bars was found to be missing on the curb-slab longitudinal joint. 70
.")
81 Figure 99: Stadium Drive B-scan showing potential voids/delamination and misaligned dowel bar and slab depth at 290 mm(11.4 in.). Units of the plot are in millimeters, 1 in. = 25.4 mm. Figure 100: Reinforcements location in inspected panels (red = misaligned bars; = missing bar). Plot is in units of inches, 1 in. = 25.4 mm. 71
82 Table 11: MIRA Reinforcement Summary for Stadium Drive PANEL 1 Tie bar spacing 0.76 m (2.5 ft) Length of tie bar 0.61 m (2.0 ft) Misaligned tie bars No Dowel bar spacing 0.30 m (1.0 ft) Dowel bar length 0.50 m (20 in.) Misaligned dowel bar 2 PANEL 2 Tie bar spacing 0.76 m (2.5 ft) Length of tie bar 0.61 m (2.0 ft) Misaligned tie bars 1 PANEL 3 Tie bar spacing 0.76 m (2.5 ft) Length of tie bar 0.61 m (2.0 ft) Misaligned tie bars No PANEL 4 Tie bar spacing 2.5 ft Length of tie bar Varied from m (16 18 in.) Misaligned tie bars Yes; 1 tie bar misaligned and 1 tie bar missing Dowel bar spacing 0.30 m (1.0 ft) Dowel bar length 0.50 m (20 in.) Misaligned dowel bar No Urban Concrete Inspection on First Street When: 10/03/2016 Test plan: The MIRA was used to inspect a three-lane (two main lanes and one bicycle lane) corridor on First Street that stretches from Gregory to Peabody (2 blocks) and is about 300 m (984 ft). The construction of this urban concrete pavement section on First Street was completed in the summer of The widths of the two vehicular lanes are 3.2 m (10.5 ft) and 2.9 m (9.5 ft) with a longitudinal slab length of 4.57 m (15 ft). During inspection, there were no visible signs of early-age cracking. Two slab panels were investigated, one panel in each of the blocks. Observation: The main traveling lanes on First Street are a total width of 8 m (26 ft) wide. This section does include a separated curb and gutter on both longitudinal edges. The slabs are 4.57 m (15 ft) in the longitudinal direction, with an expected slab thickness of 0.20 to 0.25 m (8 to 10 in.). The previous pavement section in this corridor was a distressed asphalt pavement, but details of its full removal were not known. The new construction had no visible defects or distresses. 72


83 Results: Many of the B-scans on First Street did not have backwall reflection, which is used to estimate the slab depth as seen in Figure 101. In such a situation, the absence of backwall reflection is interpreted as transmission of the majority of the wave energy downward. One explanation for this is a concrete slab bonded to the original asphalt pavement with the impedance of asphalt and concrete not significantly different and therefore, leading to the absence of reflection. In some areas, a backwall reflection existed which could mean no asphalt was present or an unbonded interface exists. Without a core through the slab and base layer, it is difficult to determine why a backwall reflection was not seen on many of the B-scans. Figure 101: B-scans without backwall reflection and with backwall reflection. Units of the plot are in millimeters, 1 in. = 25.4 mm. Discussion: The slab depth was found to average 0.23 m (8.5 in) for the scans with backwall reflections. In all the inspected panels, eight tie bars were found to be connecting the curb and slab section along the longitudinal construction joint. Due to heavy traffic on First Street during the inspection, no dowel bar inspection could be completed at the transverse joints. The tie bars were found to have consistent spacing of 0.55 to 0.61 m (1.8 to 2 ft) and were around 0.61 m (2 ft) in length at a depth of 0.11 m (4.3 in). The schematics of the tie bar location in the inspected section were found to be consistent as shown below in Figure 102. The variations in the tie bar depth and spacing are shown with the horizontally misaligned tie bars highlighted in red. 73
84 Figure 102: Tie bar location in the MIRA-inspected panels on the First Street. 1 in. = 25.4 mm. In Figure 102, the average tie bar spacing was found to be around 0.61 m (24 in.) with a depth of 0.11 m (4.3 in). One tie bar in Slab Panel 1 was found to be horizontally misaligned (highlighted red in the figure). Tie bars along centerline joint and dowel bars in transverse joints could not be investigated because of the heavy traffic Urban Concrete Inspection on Springfield Avenue When: 10/15/2016 Test plan: The MIRA-inspected area on West Springfield Avenue goes from North McCullough Street to South Birch Street (1 block) and is about 200 m (687 ft). In this area, there are two travel lanes and two adjacent parking lanes. Two continuous slab panels in the longitudinal direction were investigated. Observation: The longitudinal dimension of panels were 4.88 m (16 ft) with an expected slab thickness of 0.20 to 0.25 m (8 to 10 in.). The parking lane and the main lanes were 1.83 and 3.35 m (6 and 11 ft), respectively, in the transverse direction. Transverse contraction joints are shown in Figure 103. One of the inspected panels (Panel 2) was cracked. 74

85 Figure 103: Inspected Panels on Springfield Avenue in Urbana. Result: The B-scan showed the slab depth was about 0.20 m (8 in.). There were about six tie bars at the longitudinal joint and ten dowel bars at the transverse joint each for the main parking lane and curb parking lane. All the scans had clear backwall reflections. Figure 104 shows the B-scan of the dowel and tie bars with depth at 0.12 m (4.7 in.) and 0.10 m (4 in.), respectively, and a slab thickness of 0.20 m (8 in.). Figure 104: B-scan image of the dowel bar (left) and tie bar (right) on Springfield Avenue. Units of the plot are in millimeters, 1 in. = 25.4 mm. Discussion: The dowel bars were found to be 0.51 m (20 in.) long and consistently spaced at 0.30 m (1 ft.) at the contraction joints. The tie bars were found to have a consistent spacing of 0.76 m (2.5 ft.). No rebar misalignment was found, and all reinforcements were located at their respective depths consistently, shown in Figure 105. In Panel 2, three tie bars were found missing from the lane-parking lane joint. 75
86 Figure 105: Tie and dowel bar location in the inspected panels. Table 12: MIRA Reinforcement Summary for Springfield Avenue PANEL 1 (Uncracked Main Panel) Tie bar spacing Length of tie bar Misaligned tie bars Dowel bar spacing Dowel bar length Misaligned dowel bar PANEL 2 (Cracked Main Panel) Tie bar spacing Length of tie bar 0.76 m (2.5 ft) 0.61 m (2.0 ft) No 0.30 m (1.0 ft) 0.50 m (20 in.) No 0.76m (2.5 ft) 0.61 m (2.0 ft) Urban Concrete Inspection on Gregory Drive When: 10/23/2016 Test plan: Two panels along Gregory Drive from First Street to South Oak Street, about 250 m (800 ft) in length, were inspected using MIRA. Observation: Both panels were 4.57 m (15 ft) in longitudinal dimension with an expected slab thickness of 0.20 to 0.22 m (8 to 9 in.). The two lanes were 4.42 m (14.5 ft) and 5.49 m (18 ft) wide. One of the inspected panels was cracked. Gregory Drive is recent construction (< 5 years) but does have some visible cracks. 76
 and 4.42 m (14.5 ft) slabs, respectively. The tie bar depth was 0.1 m (4 in.) while the dowel bar was located at 0.12 m (4.7 in.), as shown in Figure 106.")
87 Result: The B-scan shows that the slab depth was found to be about m (8.5 in.). There were six tie bars in each longitudinal joint and 18 and 14 dowel bars in the transverse joint of 5.49 m (18.5 ft) and 4.42 m (14.5 ft) slabs, respectively. The tie bar depth was 0.1 m (4 in.) while the dowel bar was located at 0.12 m (4.7 in.), as shown in Figure 106. Table 13 presents reinforcement details of the inspected panels. Figure 106: Tie bar (left) and dowel Bar (right) B-scan image on Gregory Drive. Units of the plot are in millimeters, 1 in. = 25.4 mm. Discussion: The dowel bar spacing was 0.30 m (1 ft) consistently with length around 0.61 m (2 ft). Tie bar spacing was 0.61 m (2 ft) with a variation of ± 0.08 m (3 in.). The schematics of the tie bar location in the cracked and uncracked panel sections are shown below in Figure 107. No reinforcement misalignment was found. The longitudinal joint between lanes for the cracked slab section did not have any tie bars present. 77
88 Figure 107: Tie bar location in the inspected panels at Gregory Drive. Units of the plot are in feet, 3.28 ft = 1 m. Table 13: MIRA Reinforcement Location Summary for Gregory Drive PANEL 1 (Uncracked Panel) Tie bar spacing 0.61 ± 0.08 m (24.0 ± 3.0 in.) Length of tie bar 0.46 m (1.5 ft) Dowel bar spacing 0.30 m (1.0 ft) Dowel bar length 0.50 m (20 in.) PANEL 2 (Cracked Main Panel) Tie bar spacing 0.61 ± 0.08 m (24.0 ± 3.0 in.) Length of tie bar 0.61 m (2.0 ft) Urban Concrete Inspection on South Fourth Street When: 10/28/2016 Test plan: The inspected four-lane corridor on South Fourth Street stretches from West Kirby Avenue to Saint Mary s Road and is approximately 800 m long. The South Fourth Street construction was completed in summer of Two separate adjacent panels in the same direction were investigated. 78
 lane and Lane B for the 2.9 m (9.5 ft) wide panel.")
 deep, as shown in Figure 109.")
 and 0.12 m (4.7 in.) depths, respectively, as shown in Figure 108.")

89 Observation: The longitudinal dimension of panels were 14 ft, and the expected slab thickness was 203 to 254 mm (8 to 10 in.). The two panels were labeled Lane A for the 3.35 m (11 ft) lane and Lane B for the 2.9 m (9.5 ft) wide panel. There were panels being replaced when the inspection was done, but no panels with visible defects were found during inspection. Result: On Fourth Street, Lane A panels had slab depth of 0.25 m (10 in.0, while the Lane B panels were found to be 0.20 m (8 in.) deep, as shown in Figure 109. For the Lane B, tie bar and dowel bar depths were estimated about 0.14 m (5.5 in.) and 0.10 m (4 in.), respectively. In Lane A panel, tie bar and dowel bars were found at 0.16 m (6.5 in.) and 0.12 m (4.7 in.) depths, respectively, as shown in Figure 108. Multiple scans were found to have irregular wave reflections as shown in Figure 109. The scattered reflections at locations denote the presence of regions with highly different impedance than concrete. However, as MIRA is only an exploratory device, further tests would be needed to ascertain the cause for these multiple wave reflection. Lane A Lane B Dowel Bar Tie Bar Dowel Bar Tie Bar Figure 108: B-scans showing different reinforcement depth and slab depth of Lane A and Lane B panels. Units of the plot are in millimeters, 1 in. = 25.4 mm. 79

90 Figure 109: Fourth Street B-scans with different intensities of wave scattering. Engineering judgment is needed to estimate the design features in scattered B-scans. Units of the plot are in millimeters, 1 in. = 25.4 mm. Discussion: Each longitudinal joint of inspected panels had seven tie bars and seven dowel bars in 3.35 and 2.9 m (11 and 9.5 ft) wide slab sections, respectively. The dowel bars were spaced at 0.30 m (1 ft) with 0.55 m (21 in.) length. On an average with 20 measurements, tie bar spacing and lengths were found to be 0.61 and 0.76 m (2 and 2.5 ft), respectively. The schematics of the tie bar location in inspected section are shown in Figure 110. The variations in the tie bar depth and spacing are indicated, and the horizontally misaligned tie bars are highlighted in red. 80
91 Figure 110: Spatial configuration of the tie bars in the inspected panels on South Fourth Street. Unit conversions: 3.28 ft = 1 m, 1 in. = m. Table 14: MIRA Reinforcement Summary for Fourth Street Lane A PANEL (Slab Depth = 10 in.) Tie bar spacing Along L 3 Along L 2 Length of tie bar (both L 3 & L 2) Misaligned tie bars (both L 3 & L 2) Dowel bar spacing (both L 3 & L 2) Dowel bar length (both L 3 & L 2) Misaligned dowel bar Lane B PANEL (Slab Depth = 8 in.) Tie bar spacing Along L 2 Along L 1 Length of tie bar (both L 2 & L 1) Misaligned tie bars Dowel bar spacing (both L 3 & L 2) Dowel bar length (both L 3 & L 2) Misaligned dowel bar 0.76 m (2.5 ft) 0.55 m (1.8 ft) 0.61 m (2.0 ft) No 0.30 m (1.0 ft) 0.61 m (2.0 ft) No 0.55 m (1.8 ft) 0.61 m (2.0 ft) 0.61 m (2.0 ft) L 1: 1 Tie bar bisaligned 5 cm (2 in.); L 2: No 0.30 m (1 ft) 0.61 m (2 ft) No 81
92 Urban Concrete Inspection on John Street When: 11/03/2016 Test plan: The MIRA-inspected area on the John Street extension ran from Neil Street to South Elm Street. The length of the four-lane street area was 550 m (1820 ft) with two panels inspected. One of the panels had visible distress. Observation: Each of the four lanes had a width of 2.29 m (7.5 ft), and the longitudinal slab dimension was 4.27 m (14 ft). The John Street extension was constructed around 12 years ago, and the street was found to have no visible defects except the one cracked panel that was tested in the survey. Result: The panel depth was found to be about 0.22 m (8.5 in). The tie bar depths varied, but the tie bar spacing was consistent at 0.61 m (2 ft). The dowel bars were found to have consistent spacing of 0.30 m (1 ft) and were around 0.46 m (17 in.) in length with 0.09 m (3.5 in.) from the surface. Discussion: All the inspected longitudinal and transverse joints had seven tie and seven dowel bars, respectively. The schematics of the tie bar location are shown below in Figure 111. The variations in the tie bar depth and spacing are shown, and the vertically misaligned tie bars are highlighted with red. Table 15 summarizes the spatial data for the reinforcement. a) b) Figure 111: Rebar scheme: (a) cracked panel; (b) uncracked panel on John Street extension. Unit conversions: 3.28 ft = 1 m, 1 in. = m. 82
93 Table 15: MIRA Reinforcement Summary for John Street Extension PANEL 1 (Cracked Panel) Tie bar spacing 0.61 m (2.0 ft) Length of tie bar 0.55 m (1.8 ft) Misaligned tie bars 4, vertically misaligned Dowel bar spacing 0.30 m (1.0 ft) consistent Dowel bar length 0.51 m (20 in.) Misaligned dowel bar No PANEL 2 (Uncracked Main Panel) Tie bar spacing 0.61 m (2.0 ft) Length of tie bar 0.61 m (2.0 ft) Misaligned tie bars No Dowel bar spacing 0.30 m (1.0 ft) Dowel bar length 0.51 m (20 in.) Misaligned dowel bar No Urban Concrete Inspection Conclusion The inspection of seven urban concrete pavement sections in Champaign-Urbana demonstrate the application of the ultrasonic tomography device, MIRA. The results obtained were insightful for determining various design features not easily obtained by a visual survey and enables a rapid field assessment without needing to core the section. The MIRA inspections consistently were able to locate the presence of reinforcement at all types of joints which allowed for determination of spacing of the reinforcement. Likewise, the reinforcement depth from the surface could easily be estimated with the MIRA and whether the tie or dowel bars were significantly mislocated. The length of the dowel and tie bar could also be grossly (± several inches) estimated from MIRA, which could be indirectly used with bar spacing to determine if it is a tie bar or dowel bar. On several sections, single or multiple tie bars were missing in the inspected joints, which suggests MIRA could be applied as a post-construction inspection tool when limited oversight personnel are not available. MIRA was able to reasonably estimate the slab thickness on the seven projects with the strong backwall reflection. On only one project was there difficulty obtaining a backwall reflection, which may have been due to bonding to an asphalt base layer. MIRA, in its current configuration, is not capable of determining the diameter of a dowel or tie bar. It is not able for the sections surveyed to determine the type, thickness or bond condition of the base/subbase layer underneath the slabs. Additionally, in regions with high wave scattering from the MIRA output, engineering judgment and more destructive tests such as coring are likely needed to make sense of the tomographic output. 83
94 4.3 FIELD TEST CONCLUSIONS Based on the laboratory performance of the MIRA device, several field site challenges were attempted. This resulted in an overall improved understanding of the proper application of the ultrasonic device. Table 16 summarizes suggested uses for the device and is based on field test results. Distinct field success was observed in scanning bridge deck thicknesses with limited accuracy, compared to destructive coring operations. One potential application was identifying deep delaminations or debonding in pavement structures. However, the device s performance for imaging surface-breaking cracks and corrosion was obsereved to be poor and still requires additional research before practical and direct application is possible. Tasks that are identified in Table 16 as field ready are tasks that can be reasonably accomplished with the commercial package and return results comparable to existing alternative methods. Often, the alternative methods are significantly more complex, destructive, and/or time consuming than deploying the MIRA device. The potential label signifies field tests that require additional work or data processing by the operator beyond the capabilities of the commercial device package. Typically, these additional steps use multiple rotational orientations and/or special data processing beyond what is reasonably provided commercially. Additionally, in these potential areas, alternative methods may exist that perform the task more efficiently. The final category is challenging, defined as tasks the device was unable to perform in its current state. These tasks require additional research and investigation to improve device performance in those areas. Table 16: Summary of Results from Field Tests Field Ready Potential Challenging Internal voiding Parapet voiding Concrete delamination Distributed cracking/surfacebreaking crack depth Duct positions Concrete/asphalt boundary Duct grout condition Slab thickness (one-sided access) (Limited Accuracy) Initial condition survey (location of dowels / reinforcement) Bonding of overlays and FRP Precise rebar location and sizing Corrosion Heavily reinforced structures 84
95 CHAPTER 5: IMPLEMENTATION AND TECHNOLOGY TRANSFER The operation and use of the MIRA device has been documented in a manual written by the researchers; this user s manual is included as Appendix E. Because the device is relatively new to the market and existing standards do not cover use and functional limitations, the manual is intended to convey lessons learned by the researchers over the course of implementation. For a new practitioner, this manual aims to provide a thorough overview of the device s features and operation process. As with most non-destructive testing devices, decisions made concerning the device setup and testing approach greatly determine the ability of the tool to resolve the defects of interest. This level of knowledge goes beyond what can be provided in the user s manual. To provide this level of information to potential IDOT practitioners, a technology transfer session was offered by the researchers to provide instruction and access to laboratory samples for hands-on training. The objective of this technology transfer is to enable personnel to be able to independently deploy the device and correctly interpret the resulting datasets. The session was held on the UIUC campus to coincide with the annual IDOT bridge maintenance meeting held in Champaign on November 14, During the site visit portion of this research project, two separate site training visits (7/15/2016 and 8/9/2016) were performed with the objective of demonstrating the application of the device for onsite engineers to use. The device then remained with those IDOT personnel for their evaluation and application. The primary use demonstrated was rebar localization and alignment confirmation. 85
96 CHAPTER 6: SUMMARY AND RECOMMENDATIONS This project included equipment verification, laboratory testing, and field testing efforts with the MIRA ultrasonic shear wave imaging device. A user s manual was produced to assist in introducing new users to the proper operation and interpretation of the MIRA device. Laboratory testing enabled the researchers to fully learn the operation of the device and provided the opportunity to study the actual performance and limitations of the device for specific NDT tasks. Laboratory tests were carried out on slabs containing embedded ducts, open cracks, delaminations and on columns containing embedded voids, and disbonded reinforcing bars. The device was successful in identifying the location (planar and depth) of embedded ducts, delaminations, and reinforcing bars. The device with its current software was unsuccessful at determining the contents within an embedded duct (grout filled or empty) or the bond quality of reinforcing bars. Field testing provided an opportunity for practical deployment of the device to real-world transportation infrastructure testing tasks. The MIRA device was employed to assess concrete pavements, bridge decks, and column/parapet/girder elements. The portable nature of the device aided in the speed of deployment to field locations, with few barriers to applications presented. Based on the results of the laboratory and field testing work, the researchers have defined testing tasks that the MIRA device is well suited to perform, meaning that it performs as well or better than other currently available technology. Examples in the current commercially available configuration include estimating one-sided concrete bare deck thickness; detecting and positioning of relatively large internal inclusions in concrete such as steel reinforcing bars, ducts, and voids; determining concrete slab thickness; and locating dowel bars. Based on the findings of the practitioners survey (Appendix C) and the results from various field tests, the researchers believe the MIRA device works best as a focused and localized detection tool rather than a general large-scale assessment tool. The amount of time to obtain an accurate scan volume is prohibitive for complete evaluation of large structures. When used on areas of concern, the MIRA device works well to obtain accurate information about the internal conditions for the specific cases stated above. Thus, the MIRA device can serve as a good complement to global inspection efforts, in addition to troubleshooting specific problems that are within the device s main capability. Based on the work reported here, several future efforts to expand the capability and utility of the MIRA device for IDOT have been identified. A post-processing method of polarization correction is needed to improve the reliability of the interpolated 3D reconstructions. Also, the ability to identify the location of features displayed on the device s screen with respect to the overall volume of the full-sized structure needs improvement. Finally, improvement is needed in the data processing procedures to improve detection of near-surface defects and delamination and through-thickness cracks. 86
97 REFERENCES ACI Committee Report on Nondestructive Test Methods for Evaluation of Concrete in Structures, Report ACI 228.2R-13, American Concrete Institute. ACPA Guide Specification: Dowel Bar Alignment and Location. Ver , ACPA Guide Specification, American Concrete Pavement Association. ASCE Report Card for America s Infrastructure, American Society of Civil Engineers. Accessed 4 March < Bishko, A.V., A.A. Samokrutov, and V.G. Shevaldykin Ultrasonic Echo-Pulse Tomography of Concrete using Shear Waves Low-Frequency Phased Antenna Arrays, Proceedings of the 17th World Conference on Nondestructive Testing, Shanghai, China. De La Haza, A.O., A.A. Samokrutov, and P.A. Samokrutov Assessment of Concrete Structures using the Mira and Eyecon Ultrasonic Shear Wave Devices and the SAFT-C Image Reconstruction Technique, Construction and Building Materials, Volume 38, pp Germann Instruments NDT Systems Catalog. Accessed online 17 March Gucunski, N., A. Imani, F. Romero, S. Nazarian, D. Yuan, H. Wiggenhauser, P. Shokouhi, A. Taffe, and D. Kutrubes Nondestructive Testing to Identify Concrete Bridge Deck Deterioration, SHRP 2 Report S2-R06A-RR-1, Strategic Highway Research Program 2, Transportation Research Board. Hoegh, K., L. Khazanovich, and H.T. Yu Ultrasonic Tomography for Evaluation of Concrete Pavements, Transportation Research Record, Issue 2232, pp Hoegh, K., and L. Khazanovich Correlation Analysis of 2D Tomographic Images for Flaw Detection in Pavements, Journal of Testing and Evaluation, Volume 40, Issue 2, pp Hoegh, K., L. Khazanovich, and H.T. Yu Concrete Pavement Joint Diagnostics with Ultrasonic Tomography, Transportation Research Record, Issue 2305, pp Hoegh, K., L. Khazanovich, B.J. Worel, and H.T. Yu Detection of Subsurface Joint Deterioration, Transportation Research Record, Issue 2367, pp Hoegh, K., S. Gillen, W.R. Vavrik, and L. Khazanovich Use of Ultrasonic Tomography for QA/QC of Composite PCC Pavement Construction, Compendium of Papers of the 94th Annual Meeting of the Transportation Research Board, Washington, D.C., Paper No Khazanovich, L., and K. Hoegh Ultrasound Tomography Testing at the National Airport Testing Facility (NAPTF), FAA Airport Pavement Working Group Meeting, Atlantic City, New Jersey. Michaux, C., and M. Grill NDT 3D Tomographic Testing Cases on Concrete and National Heritage Buildings, Proceedings of the Ninth International Conference on Superplasticizers and Other Chemical Admixtures in Concrete, Seville, Spain. Ryu, S., P. Choi, W. Zhou, S. Saraf, and M.C. Won Improvements to Full Depth Repair Practices for CRCP Distresses, Report No. FHWA/TX , Texas Tech University, Texas Department of Transportation. 87
98 Schabowicz, K Ultrasonic Tomography The Latest Nondestructive Technique for Testing Concrete Members Description, Test Methodology, Application Example, Archives of Civil and Mechanical Engineering, Volume 14, pp Schickert, M., M. Krause, and W. Müller Ultrasonic Imaging of Concrete Elements Using Reconstruction by Synthetic Aperture Focusing Technique, Journal of Materials in Civil Engineering, Volume 15, Issue 3, pp Shokouhi, P., J. Wöstmann, G. Schneider, B. Milmann, A. Taffe, and H. Wiggenhauser Nondestructive Detection of Delamination in Concrete Slabs: Multiple-Method Investigation, Transportation Research Record, Issue 2251, pp Tompkins, D., M.E. Vancura, S. Rao, L. Khazanovich, and M.I. Darter Construction of Sustainable Pavements: Two-Layer Concrete Pavements at Mn/ROAD Facility, Compendium of Papers of the 90th Annual Meeting of the Transportation Research Board, Washington, D.C., Paper No Vancura, M., L. Khazanovich, and R. Barnes Concrete Thickness Variation Assessment with Cores and Nondestructive Testing Measurements, Transportation Research Record, Issue 2347, pp Wimsatt, A., J. White, C. Leung, T. Scullion, S. Hurlebaus, D. Zollinger, Z. Grasley, S. Nazarian, H. Azari, D. Yuan, P. Shokouhi, T. Saarenketo, and F. Tonon Mapping Voids, Debonding, Delaminations, Moisture, and Other Defects Behind or Within Tunnel Linings, Draft Final Report Project R06, Strategic Highway Research Program 2, Transportation Research Board. 88
99 APPENDIX A: A1040M FILE SPECIFICATIONS This section is reproduced from the MIRA documentation provided by ACSYS, with minor edits for clear translation. Description of the saved file formats for MIRA (Model A1040M): *.bin saved tomogram. The size of the file depends on the current size of the tomogram in pixels on the screen. IN THE MAP the size is fixed 216х432 pixels. IN IMAGE MODE there are two variants: 416х432 pixels (with A-Scan turned off) and 296х432 (with A-Scan turned on). This is written line-byline, starting from the upper left angle, from left to right. One pixel is saved by four bytes, littleendian order. 256 brightness levels. *.lbv initial data array. The file consists of a heading (128 bytes) and a data array (all the rest). This contains 32 parameters, 4 bytes each, little-endian order. Heading contents: 1 Number of array elements. 2 Array elements step, mm 3 ADC frequency, khz 4 Monitoring impulse frequency, khz 5 Number of monitoring impulse half-cycles, шт 6 Delay in quanta 7 Ultrasound wave speed, m/s 8 Analog gain, db 9 Horizontal scanning step, mm (between separate footprints) 10 Vertical scanning step, mm (between separate rootprints) 11 Number of realizations in the file (now 66) 12 Number of pixels in one footprint 13 Size of one pixel in bytes 14 Beginning of the SAFT horizontal scale in mm (upper left angle of the SAFT) 15 Beginning of the SAFT depth scale in mm (upper left angle of the SAFT) 89
100 16 Horizontal size of the image in mm 17 Depth size of the image in mm 18 Horizontal size of the synthesized image in pixels 19 Depth size of the synthesized image in pixels After the heading the received data starts. Written in following order (1 receiver 2 transmitter, 1 receiver 3 transmitter, 1 receiver 4 transmitter,, 1 receiver last transmitter, 2 receiver 3 transmitter,, second last receiver last transmitter). Description of the saving format of one pair data array receiver-transmitter is saved in the heading. Reciever 1 is located on the right side of the unit. *.cfg description of the configuration at which the image was saved. The data is stored in text format in X:Y form, where X s/n, Y parameter value. Contents of the parameter list: 0 Brightness gain (0-48 db) 1 Analog gain (0-60 db) 90
101 2 Working mode of the device (0-VIEW, 1-MAP, 2-SETTINGS, 4-NAME EDITOR) 3 Undermode of the screen (system parameter) 4 Previous working mode of the device (system parameter) 5 Previous undermode of the screen (system parameter) 6 Previous undermode of the settings (system parameter) 7 Size of SAFT in mm: left border 8 Size of SAFT in mm: upper border 9 Size of SAFT in mm: width of the tomogram 10 Size of SAFT in mm: depth of the tomogram 11 Size of the tomogram in pixels: width 12 Size of the tomogram in pixels: depth 13 Number of the current extension in VIEW mode (0-500mm, 1-750mm, mm, mm, mm, mm) 14 Number of current extension in MAP mode (0-500mm, 1-750mm, mm, mm, mm, mm) 15 A-Scan mode: 0-off, 1-detected filled, 2-detected contour, 4-radio signal 16 A-Scan type: SAFT/SAFP (now unavailable) 17 Cursor coordinates starting from the upper left angle horizontally in pixels 18 Cursor coordinates starting from the upper left angle vertically in pixels 19 Number of antenna array elements 20 Elements step 21 Number of monitoring impulse half-periods 22 Monitoring frequency, khz 23 Sample frequency of the initial signal, khz 24 Delay in the route (used while calculation) 25 Speed of the ultrasound waves, m/s 91
102 26 Preset ultrasound wave speed, m/s 27 Horizontal scanning step in MAP mode, mm 28 Vertical scanning step in MAP, mm 29 Using counted speed when constructing SAFT flag (0-no, 1-yes) 30 Width size of the tomogram in VIEW mode, mm 31 Depth size of the tomogram in VIEW mode, mm 32 Width size of the tomogram in MAP mode, mm 33 Depth size of the tomogram in MAP mode, mm 34 Isn t used 35 DAC (isn t used) 36 Pause between monitoring, ms 37 Number of accumulations in initial data 38 Counted delay in initial data 39 Tomogram shift number in View mode 40 Amplitude under the cursor in View mode 92
103 APPENDIX B: MATLAB CODE FILE LOADING function [Z, Config, Bmp] = afilereader(filename) % Function afilereader(filename) - Load a Set of MIRA Scan Files % Inputs: % filename - string - location of lbv file (e.g. 'scan1.lbv') % Outputs: % Z - Matrix - Matrix of 66 A-scans at 1e6 Mhz Sampling Rate % Config - Matrix - Matrix Table of Device Configuration % Bmp - Matrix - Matrix of Screen Captured BMP Image %% Import Signal Data % read the.lbv file and extract time series matrix Z if true fin= fopen(filename, 'r'); header=fread(fin,32,'int32', 'l'); data=fread(fin,inf, 'int16', 'b'); Z = reshape(data, header(12), header(11)); end %% Import Config % read the device.cfg file config file if true fin = fopen(strcat(filename(1:end-3),'cfg'), 'r'); Config = fscanf(fin, '%i:%i'); Config = transpose(reshape(config, 2, length(config)/2)); end %% Import Binary Image % read the.bin File to a Matrix if true row = 216; %Size of B-Scan in Screen Capture col = 432; fin=fopen(strcat(filename(1:end-3),'bmp'),'r'); I=fread(fin,row*col,'uint32=>uint32', 'l'); Bmp=reshape(I,row,col); Bmp=Bmp'; end end 93
104 APPENDIX C: PRACTITIONERS SURVEY RESULTS Questions for Ultrasonic Imaging Practitioners Participants: Chris McDermott of Alta Vista Solutions (consultant to CALTRANS) (CM); Michael Brown of VTRC (MB); Nate Rende of WJE (NR); Ethan Dodge of CTLGroup (ED); and Kyle Hough (UMN) 1. What types of ultrasonic imaging instruments do you have experience with? (MIRA, EyeCon etc.) Mostly MIRA (old and new), occasionally ICON. New MIRA is good for grids, not lines. ICON only for extracting raw data. ICON is not easy to use, especially as a stand-alone tool. ICON and new MIRA. MIRA and ICON. MIRA is better. MIRA, Eyecon, and Pundit 2. What type of materials (concrete, asphalt, stone etc.) and structures (Bridges, Tunnels, Pavements, Sound barrier walls, Buildings, etc.) have you surveyed using ultrasonic imaging instruments? concrete; large concrete elements, slip form chimneys, blast walls, slabs concrete; barriers, tunnel liners, mass foundations, rarely stone facades PCC, Asphalt, Stone (unsuccessfully due to the roughness of the particular stone we tested) primarily on pavements, but also some bridge, containment structure (eyecon), concrete foundation applications 3. Who carried out the field measurements? (e.g. you, a site engineer, a technician) self or technician self self 4. Coupling of MIRA/EyeCon instrument (If other instrument than MIRA or EyeCon please answer to the best of your ability) 94
105 a. What is your opinion on the Dry Point Contact (DPC) technology? Is it easy to use? Are you getting consistent and good coupling in the field? He has good experience. Consistent readings, even on tined structures. Very surface conditions (roughness, patches, etc.) cause problems for the SAFT algorithm. Positive. It seems very robust dealing with local roughness or different pavement tinings. The problems typically occur for more macro curvature larger than the spring loaded transducers can accommodate. Field coupling is consistent from my experience. b. What is the most extreme roughness you have dealt with? Was any surface preparation (grinding) done? (ACSYS claims that the device works for roughnesses up to 1cm) Comfortable with only smooth formed surfaces. He does not buy the 1cm claim. Can collect data, but my not be reliable. He has good experience with various surface roughness conditions. The foundation application had some significant consolidation problems that led to extreme roughness most likely up to 1 cm at times. There were some cases on that project where we had to diamond grind to get coupling. Some projects certain transducer pairs cannot be used due to coupling but often you can get enough information from the remaining transducers that do couple properly. c. How is the DPC tip durability? How long have you used the instrument? What type of tips do you have (metal/ceramic etc.)? Everyone: Tip durability is excellent. 5. Have you had to do any maintenance or general calibration on your instrument? If so, who carried out the maintenance/general calibration? Everyone: No general maintenance or calibration needs. 6. Are there any issues with in-situ calibration procedure to determine shear wave velocity in good concrete? If so, please describe. He uses automatic velocity measurement utility in general. 95
106 Calibration procedure of new unit (measures and uses with each shot). He usually disables auto feature and inputs a manual value. If there is a significant difference in PCC material properties with depth it can be a problem since the calibration velocity is on the surface. We have seen good repeatability with our version of MIRA. I received data from a newer unit in Belgium where they were experiencing problems with the calibration velocity repeatability. They sent me data from the same location giving differences in velocity up to 500 m/s, although I was not there to verify that it wasn t a problem with how they were collecting the data. 7. What is the depth of penetration of the instrument? (ACSYS claims 2m depth of penetration for their MIRA instrument). What is the deepest depth you have surveyed successfully? Would only work for large block with no internal steel! His deepest is 5 ft., with very moderate, good quality concrete. Any layers of steel cause problems with the SAFT algorithm. Heavily reinforced elements, probably not able to detect defects. For moderately or lightly reinforced, can find some defects, but it depends on size and spacing of bar grid. Difficult to answer, and steel layers cause shadowing effect. This is a problem with MIRA. Agrees with points above about rebar effects. Not very useful for depths greater than 4 feet. Steel congestion introduces challenges to getting accurate readings. We typically survey pavements, so have not tested the depth of penetration too much. The furthest we have tested was an approximately 0.9 meter slab in our structures lab. The backwall reflection was pretty clear, so I am assuming it should be able to penetrate deeper, although I haven t verified 2 meters. 8. What type of defects/characteristics have you surveyed for using your ultrasonic imaging tool? Please elaborate on your experience. (Ease of detection, resolution, accuracy, verification etc.) a. Voids? Yes b. Delaminations? Yes, but for larger openings. c. Cracks? Yes, but indirect, by removing backwall. d. Concrete/stone thickness? Yes, but for thinker elements, not heavily reinforced. e. Re-bar and dowel location/misalignment? 96
107 No, other methods are better. Yes f. Bonding in tunnel liners? Yes, for honey-combing defects. Deep duct detection (location); locating deep embedded I-beams 9. What is the smallest defect size you have successfully identified? (ACSYS claims that the MIRA instrument can measure defects greater than 10 mm in size). Difficult to answer this depends on concrete quality and rebar grid. But 10 mm is not realistic for real-world concrete. About 3-inches is comfortable minimum. The smallest defect size is less than 1 mm if it is a continuous plane or debonding interface, but if the defect size is defined as the largest dimension of the object approximately 15 mm diameter clayballs are the smallest dimension we have been able to directly detect. 10. Are there geometric constraints or influences (such as edge effects) on the operation or results? Edges can disrupt the imaging process. Especially when long axis of head is perpendicular to the edge. He likes to stay on antenna length away. He sees same effects. He likes to use 1 to 1 spacing rule. (edge distance to depth). Yes. When you get within about 2 in. of an edge you start to get more structural noise in the measurements. 11. What is your understanding and opinion on the Synthetic Aperture Focusing Technique (SAFT) used to create images? Not enough understanding of the process. He sees being tied to SAFT as a problem without ability to turn it off. He is not totally happy with SAFT, but it is the best available process in his opinion. It is a good general purpose tool. 12. Do you have access to raw pitch-catch data from each sensor? If so, have you done any postprocessing of raw data using your own algorithms? 97
108 No access with MIRA, but access with ICON. They use whatever MIRA gives. Yes. We started with recreating (as close as we could) the general software. We have extended it for full-waveform analysis, extended arrays, 3D imaging, and developed specific tools such as layer boundary, reinforcement depth, and signature analysis. 13. What are the qualities you like about ultrasonic imaging instrument/technique? Best imaging tool for concrete available. He agrees, especially ability to inspect deeper elements, and provide images. 4: Yes. We started with recreating (as close as we could) the general software. We have extended it for full-waveform analysis, extended arrays, 3D imaging, and developed specific tools such as layer boundary, reinforcement depth, and signature analysis. 14. What aspects can be improved about ultrasonic imaging instrument/technique? More flexibility with data processing; SAFT on and off. Availability to extract raw data. Ability to remove or identify rebar signals. Additional of variable gain. It required physical coupling, so cannot compete with air coupled methods for speed, but needs to be treated more as a core replacement. Additional Items: Proceq is also starting to offer a ultrasonic imaging unit. He is concerned about use of MIRA by inexperienced users. Generally other NDT technologies are less expensive and can produce similar flaw detection capabilities 98


109 APPENDIX D: PARAPET SCANS AND CORES C# Horizontal Vertical Orientation Top Bottom


110 C# Horizontal Vertical Orientation Top Bottom


111


112

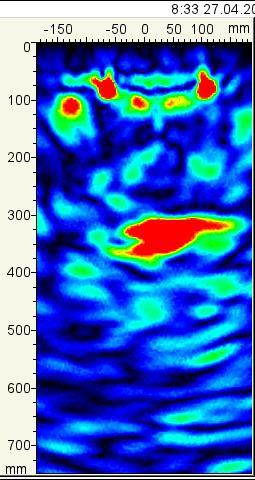


113


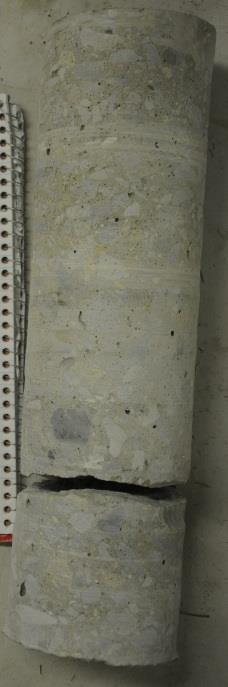
114
115 APPENDIX E: MIRA USERS MANUAL 105
116 MIRA ULTRASONIC IMAGING DEVICE USER S MANUAL Prepared by John Popovics, PhD, PE; James Bittner; Armen N. Amirkhanian; Alexander S. Brand; Jeffery R. Roesler, PhD, PE; and Katherine Flowers University of Illinois at Urbana-Champaign Published by The Illinois Department of Transportation Springfield, Illinois
117 MIRA Ultrasonic Imaging Device User s Manual CONTENTS Contents 1 Introduction 1 2 Equipment Ultrasonic Imaging Device Transducers Display Battery Ports and Cables Software Setup and Use Starting up Site Preparation Taking a Quick Scan B-Scan mode Purpose Configuring Settings Map Mode Purpose Configuring Settings Creating a Map Maintenance Data Processing Installing and Opening Software Data Transfer Configuring View Settings D and 3D Display Modes Color Modes Magnification Modes Exporting Results Data Interpretation B-Scan Interpretation Objects Echoes Blind Zones HARD COPIES UNCONTROLLED Page i
118 MIRA Ultrasonic Imaging Device User s Manual CONTENTS Halo Effects Saturation Map Scan Interpretation Positioning Spacing Troubleshooting Device Will Not Turn On Device Will Not Save Scans B-Scan Appears Red B-Scan Appears Pure Black B-Scan Appears Pure Blue B-Scan Has Unexpected Artifacts Map Scan Has Unexpected Artifacts Map Scan Appears Distorted or Compressed Additional Resources 40 8 References 41 HARD COPIES UNCONTROLLED Page ii
119 MIRA Ultrasonic Imaging Device User s Manual LIST OF FIGURES List of Figures 1 MIRA Ultrasonic Imaging Device and Laptop Illustration of Wave Behavior Top-Down Photo of Ultrasonic Imaging Device Diagram of Display Components Diagram of Left-side Buttons Key to the F Buttons when Editing Text Diagram of Right-side Buttons Photographs of the MIRA in Use Photo of User Pressing MIRA into Place Photo of Trigger Buttons Diagram of the Three Different Types of Scans Diagram of Display in Map Mode Photo of Lights on Device s Underside Photo of Lights in Use Photo of Ideal Viewer Start-up Screen Photo of a Scan in BCD Mode in Ideal Viewer Photo of a Scan in Isosurface Mode Photo of a Scan in Fit to Screen Mode in Ideal Viewer Photo of a Scan in Keep Proportions Mode Photo of Screenshot Export Options Photo of a PDF Generated by Ideal Viewer Screenshot of Echoing in a B-Scan Screenshot of a Halo Effect Screenshot of Localized Saturation List of Tables 1 MIRA Array Firing Sequence HARD COPIES UNCONTROLLED Page iii
120 MIRA Ultrasonic Imaging Device User s Manual Introduction 1 Introduction This manual describes the features and uses of the A1040 MIRA ultrasonic imaging device. The sections that follow will detail the components of the equipment, its setup and use in the field, data transfer and interpretation, and additional resources. As a non-destructive technology, the MIRA device allows technicians to provide effective, efficient, economic, and rapid data collection without any impact to a pavement or bridge deck and potentially without the need for full road closures. This commercially available device allows trained technicians to generate non-destructive, twoand three-dimensional images of concrete. These images can help them to identify defect locations or areas that require further investigation or repair. The device can build up three types of scans, each of which is non-destructive and informative either on its own or in conjunction with other scans. For any scan, the data collection begins when the device emits ultrasonic shear wave signals from each of its transducers. The signals are then reflected and received back by the device. These signals are initially captured in an A-Scan, which shows signal amplitude over the full time of the capture period. The device interprets these signals through a technique called "synthetic aperture focusing" (SAFT). The interpreted data and the extracted surface wave velocity are then used to generate a SAFT B-Scan, which is a 2-dimensional image of the concrete section. Finally, a series of B-Scans may be combined to generate a 3-dimensional "Map Scan" which can be referred to as C-Scan and D-Scan, based on orientation. The MIRA system has reportedly been used successfully on numerous projects; the portability and versatility of the device allows it to be used on virtually any concrete structure. Potential applications for this device include but are not limited to: Concrete thickness Interface bonding Internal steel reinforcement location Voids and other internal anomalies Delamination Duct detection HARD COPIES UNCONTROLLED Page 1

121 MIRA Ultrasonic Imaging Device User s Manual Equipment 2 Equipment This section introduces the pieces of equipment that comprise the MIRA system (Figure 1). Figure 1: MIRA Ultrasonic Imaging Device and laptop with software (Germann Instruments 2010). 2.1 Ultrasonic Imaging Device The Ultrasonic Imaging Device is the primary piece of equipment, and it has several components Transducers On the bottom of the Ultrasonic Imaging Device, there are 48 dry point contact shear transducers. As illustrated in Table 1 and Figure 2, Transducers both send and receive signals, and for each scan the transducers make 66 different signal combinations. The transducers are spring-loaded, so that they can be pressed into place and used on rough and/or non-flat surfaces. Transducers each have a ceramic tip, which vibrates perpendicular to the long axis of the device. HARD COPIES UNCONTROLLED Page 2
122 MIRA Ultrasonic Imaging Device User s Manual Equipment Table 1: MIRA Array Firing Sequence and Corresponding A-Scan Index Number. Transmitter Set Receiver Set Page 3 HARD COPIES UNCONTROLLED


123 MIRA Ultrasonic Imaging Device User s Manual Equipment Figure 2: Illustration of stress wave behavior at two different points in time. The signal is being emitted from the left-most transducer (green), while the ones to the right (2 12) are listening. The top half of the figure shows the initial shear pulse at approximately 0.08 ms while the bottom half shows the reflection that occurs later, at approximately 0.16 ms. Page 4 H ARD C OPIES U NCONTROLLED

 for velocity. There are three sets of buttons.")
124 MIRA Ultrasonic Imaging Device User s Manual Equipment Display On the top of the device, there is a display screen, buttons for adjusting the display and the device s operations, and small indicator lights that indicate when the device is on and when it is charging (Figure 3). The display screen includes quantitative data, AScan output, B-Scan output, and Map Scan data (Figure 4). The display on the MIRA device exclusively uses metric units of millimeters for distance and meters per second (m/s) for velocity. There are three sets of buttons. The main purpose of the buttons Figure 3: A top-down photograph of the MIRA buttons and display. From left to right, this photo shows the first set of buttons, the screen, the other sets of buttons, the orange power button, and the indicator lights just below the power button. The green light indicates that the device is on; when the device is charging the amber light will be illuminated. Figure 4: Key to display components when viewing a B-scan (Acoustic Control Systems 2010). Page 5 H ARD C OPIES U NCONTROLLED
125 MIRA Ultrasonic Imaging Device User s Manual Equipment on the left is to edit file names (Figure 5). The F key buttons just to the right of the display vary in function according to mode. For example, when editing text these keys are used to save the text, move the cursor, include capital letters, and delete content (Figure 6). The buttons on the far right are primarily used to edit settings, shift modes, and navigate within map mode (Figure 7). Figure 5: Key to buttons on the left side of the device. These buttons are primarily used for entering names for files (Acoustic Control Systems 2010). HARD COPIES UNCONTROLLED Page 6
126 MIRA Ultrasonic Imaging Device User s Manual Equipment Figure 6: Key to the F buttons when editing text, just to the right of the screen. These buttons vary in function depending on the pictogramm displayed on the screen. This figure shows various Pictogramms that may be associated with the F buttons when editing text (including names of files) (Acoustic Control Systems 2010). HARD COPIES UNCONTROLLED Page 7
127 MIRA Ultrasonic Imaging Device User s Manual Equipment Figure 7: Key to buttons on the far right side of the device. These buttons are primarily used for editing settings, shifting modes, and navigating map mode (Acoustic Control Systems 2010). HARD COPIES UNCONTROLLED Page 8
128 MIRA Ultrasonic Imaging Device User s Manual Equipment Battery The ultrasonic imaging device includes a laptop battery. The battery lasts 4 8 hours, depending on the number of scans and the ambient temperature (the battery lasts longer in warm weather than in cold weather) Ports and Cables The battery, discussed in the previous section, can be charged by plugging in the A/C power cord. The power cord is not polarized, so it will plug in either direction. To make sure it is correctly plugged in, check if the amber charging light on the top of the device is illuminated. The device also has a USB port and cable, which can connect the ultrasonic imaging device to a computer for data transfer. 2.2 Software The MIRA System includes a CD-ROM with software called Ideal Viewer. This software helps users compile, visualize, and manipulate the data after it has been collected. The Windows Operating System is required for the current version of this software. The help documents available on the provided CD-ROM provide clear descriptions of all functions of the software. As such the details will not be discussed in this manual. HARD COPIES UNCONTROLLED Page 9
129 MIRA Ultrasonic Imaging Device User s Manual Setup and Use 3 Setup and Use This section will describe how to set up and use the MIRA ultrasonic imaging device for a variety of purposes, including starting up, preparing the site, field work, and maintenance. 3.1 Starting up To start up the device, ensure the battery is charged and then press the orange power button. Once the blue splash screen has been displayed, the device is ready to begin scanning. 3.2 Site Preparation When selecting and preparing a site for imaging, it is important to use a site that is sufficiently large, clean, and smooth. At the same time, the MIRA system is designed to operate successfully in a variety of conditions (See Figure 8 for four different examples). Note that the device will still collect scans on unsuitable surfaces; such scans will just appear unclear or distorted. The following aspects of the site should be assessed: If the site has dust, debris, or moisture on the surface, clean the area with a wire brush and broom. Use a cloth to remove moisture. The transducers are designed to tolerate some roughness and surface elevation variation, so the concrete need not be perfectly smooth and flat. Nevertheless, scans will be most accurate if the vertical variation across the surface is minimal. Tining, grooving, and roughness may be up to 2.0 mm (0.078 in.), and vertical variation across the whole face of the ultrasonic imaging device may be up to 5.0 mm (0.25 in.). Issues with tining or grooving may be mitigated by aligning the long axis of the device parallel to the tining or grooving direction. The size of the concrete should also be big enough to span most or all of the ultrasonic imaging device s transducers. On the narrow axis, all four transducers in a given row need to be touching the concrete. On the long axis, there is slightly more flexibility, and a scan may still be useful if a few rows are hanging off the edge. If the surface is asphalt, scanning will be most accurate under cold conditions. Wave propagation depends on a sufficiently stiff material to travel through. Warm asphalt is able to deform and absorb the wave energy, resulting in poor signal HARD COPIES UNCONTROLLED Page 10
130 MIRA Ultrasonic Imaging Device User s Manual Setup and Use transmission through the material. A typical signal will display a complete reflection since the noise is all that is received. However, cold asphalt (below 1.6 C [35 F] ) has experimentally displayed acceptable results of enough transmission to present a thickness reflection. Once the site has been selected and prepared, and if the device is going to be used in Map Mode, a final step may be to create a grid with chalk (see discussion in 3.5.3). Map Mode is used to acquire a series of shots from multiple footprints that have a spatial correlation. HARD COPIES UNCONTROLLED Page 11
 Scanning under bridge box girder Setup")


131 MIRA Ultrasonic Imaging Device User s Manual (a) Scanning a concrete column (c) Scanning under bridge box girder Setup and Use (b) Scanning on the side of a bridge parapet (d) Scanning underside of bridge deck Figure 8: Photographs of the MIRA ultrasonic imaging device in use in four different settings and orientations. Page 12 H ARD C OPIES U NCONTROLLED
132 MIRA Ultrasonic Imaging Device User s Manual Setup and Use 3.3 Taking a Quick Scan First, with the device powered on set the device in B-Scan mode by pushing the Mode" icon on the bottom right hand side of the device until the display resembles Figure 3. Now, hold the ultrasonic imaging device compressed against the surface to be scanned (either by placing on top of a surface or holding it against a vertical surface (Figure 9). Then, with your thumbs, press at least one of the four trigger buttons on the perimeter of the device (Figure 10). The device will make a beeping sound when it has finished acquiring a scan. The transducers will also produce a faint vibrating sound during the scan, which may be barely audible. The temporary data will display on the screen and will not be automatically saved by default in B-scan mode. The color scale can be interactively adjusted through use of the +/- keys on the left side of the device. Every data collection project should begin with taking a few quick scans to assess the appropriate color gain and settings for the device. For brief investigations the quick scan or more formally the B-Scan can be saved by selecting the F key next to the save folder icon on right of the screen as seen in Figure 6. Before additional data collection occurs it is best practice to validate proper performance of the device by identifying a known reflector. One procedure for carrying out this validation is to find the thickness of a exposed portion of the concrete, such as a parapet wall or a slab with a exposed edge surface. Start by measuring the thickness of the slab edge with a ruler. Next shoot one 1 B-Scan image of a location on the slab top surface. Identify the center of the strong large flat reflector signifying a backwall reflection. You can adjust the colors of the reflectors using the +/- keys on the pad. If no reflector is observed, select another location, increase the analog gain in the device menus, or clean the surface of the slab. Once the vertical center of the backwall reflector is identified compare the ruler depth against the ultrasonic measured depth. The two should agree at maximum within 9 mm (0.3 in.), and ideally within 3 mm (0.1 in.). HARD COPIES UNCONTROLLED Page 13
133 MIRA Ultrasonic Imaging Device User s Manual Setup and Use Figure 9: A photograph of a user pressing the MIRA firmly into place before taking a scan of a concrete segment. HARD COPIES UNCONTROLLED Page 14

134 MIRA Ultrasonic Imaging Device User s Manual Setup and Use Figure 10: A photograph of a user about to press the trigger buttons. Page 15 HARD COPIES UNCONTROLLED
135 MIRA Ultrasonic Imaging Device User s Manual Setup and Use 3.4 B-Scan mode To enter B-Scan mode (also known as View mode), toggle the Mode" button on the right side of the device (Figure 3) Purpose B-Scans are 2-dimensional images generated by combining signal amplitude data and surface wave velocity measurements (or a manually set velocity value) through a SAFT procedure. B-Scans are one of the three possible two-dimensional scan types; the other two orientations, C-Scans and D-Scans are only available from map scan mode datasets (Figure 11). B-Scans are best for exploratory imaging, because their complete results are displayed immediately. Exploratory imaging can serve either to get a preliminary sense of the concrete s internal structure, or to assess the device settings (such as whether the color scale or amplification is resulting in clear images or not). Due to the importance of these settings, every investigation should begin with confirming a known attribute such as a back surface to confirm amplification/color scales are set to reasonable values. If a back surface is not observed, follow the steps outlined in the troubleshooting portion of this manual. HARD COPIES UNCONTROLLED Page 16
.")
136 MIRA Ultrasonic Imaging Device User s Manual Setup and Use Figure 11: Diagram of the three different types of scans: B-Scans, C-Scans, and D-Scans (Acoustic Control Systems 2010). HARD COPIES UNCONTROLLED Page 17
137 MIRA Ultrasonic Imaging Device User s Manual Setup and Use Configuring Settings The velocity, color scale, and analog gain can each be manually set. Press the button with the wrench icon on the right side of the device to access the settings menu then select the F1 button to select the wave settings. In this menu the settings can be adjusted with the +/- keys. While the device will automatically calculate velocity, if this shear velocity is not between 2,000 3,000 m/s ( ft/s) on concrete, then the number is likely inaccurate due to poor surface conditions or roughness. In this scenario, manually setting the velocity to a starting value of 2,500 m/s (8200 ft/s) may result in clearer images. Note: This velocity approximation results in a loss of accuracy in the displayed distance measurements and can degrade the SAFT procedure. The color scale should also be adjusted if the images are too uniform in color. Ideally, the color scale should be balanced such that solid concrete registers as a shade of blue, and reflecting objects in progressively warmer colors (refer back to Figure 4 to see an example of this level of saturation). If a B-Scan is uniformly red, then the analog gain may need to be adjusted, to avoid oversaturation (See Section 6.3). If oversaturation occurs, then it is possible that no useful data will be recorded. 3.5 Map Mode To enter Map Mode, again toggle the Mode" button on the right side of the device (Figure 12). Map mode can be confirmed since the display will present a grid on the left side of the display. HARD COPIES UNCONTROLLED Page 18
. HARD COPIES UNCONTROLLED Page 19")
138 MIRA Ultrasonic Imaging Device User s Manual Setup and Use Figure 12: A labeled diagram of the display in Map Mode (Acoustic Control Systems, 2010). HARD COPIES UNCONTROLLED Page 19
139 MIRA Ultrasonic Imaging Device User s Manual Setup and Use Purpose Map Scans are collections of B-Scans that are combined in a grid formation in order to make extended 2-dimensional and 3-dimensional figures. Map Scans are best for undertaking a more systematic investigation of a site, for assessing a larger area, and for visualizing more dimensions of an area (namely, C-Scans and D-Scans, see Figure 11). Map Scans are best done after some initial exploratory imaging with the B-scan mode Configuring Settings In contrast to B-Scan mode, the velocity, color scale, and analog gain settings may only be adjusted when a map is first created. In addition, the grid spacing distance must be defined at the creation of a map. You may define the grid spacing sizes in both the horizontal (x) and vertical (y) directions. The distance between the positioning lights is 170 mm (6.7 in.) but the default distance for map mode is 100 mm (3.9 in.), so the distance will likely need to be manually changed to 170 mm (6.7 in.) when the map is originally created, see Creating a Map. While it is common to make the grid spacing the same length as the ultrasonic imaging device itself for convenience, the appropriate values will be highly dependent on the defect(s) or feature(s) being investigated. Reducing the distance in either dimension can increase scan time considerably, but it will increase the final map resolution. Conversely, increasing the distance between scans will reduce the time necessary to complete the map, but will decrease the final map resolution. A general starting value is a step size 170 mm (6.7 in.) with a practical reflection of items approximately 25 mm (1 in.) in size. Based on field experience, defining a manual shear wave velocity setting for the map mode is highly recommended. A value can be selected through taking a few B-Scans over an area and averaging the measured shear wave velocity Creating a Map In Map Mode, use the vertical arrow buttons on the right side of the device to navigate to the Create Map... option. Then, use the horizontal arrow keys to move the cursor over to the right side of the screen, where you can adjust the default settings. Once the settings have been adjusted, move the cursor back to the left side of the screen, click the Enter button while the cursor is on the Create Map... cell. You will be prompted to name the new map. Save the map by Pressing F1 (next to the floppy disk pictogramm, see Figure 6). HARD COPIES UNCONTROLLED Page 20
140 MIRA Ultrasonic Imaging Device User s Manual Setup and Use After the grid spacing values have been finalized, mark the location of each grid point on the test specimen in chalk. If you are using 170 mm (6.7 in.) as one or both of the grid dimensions, use the lights on the device to confirm the grid marks (Figure 13) and during the mapping process itself to ensure precision (Figure 14). Once the new map file has been created and the grid laid out, select the newlycreated map file in the display and begin the mapping process. A cursor will show what data point is currently being scanned, as well as many other pieces of information (Figure 12). The double green arrow pictogramms (next to the F5 button) show where the cursor will move next after the current datapoint is collected (either to the left or downwards); this direction can be changed to align with your grid layout. It is also possible to redo a scan point if necessary, by using the cursor to select the faulty B-scan, pressing F5 (delete), and then replacing the cursor on the next grid point. These steps will delete the B-Scan from the total map. Once every desired B-Scan in the grid has been completed, the mapping process is complete. To view the full map, connect the device to a computer (maps cannot be viewed on the device s display itself; see Chapter 4 on Data Processing). Whenever using the device it needs to be completely lifted for each scan. Do not drag the sensors since this will degrade the ceramic tips. HARD COPIES UNCONTROLLED Page 21
 apart. HARD COPIES UNCONTROLLED Page 22")
141 MIRA Ultrasonic Imaging Device User s Manual Setup and Use Figure 13: A photograph of the two lights on the underside of the device. These lights can be used to mark the concrete while in map mode. They are 170 mm (6.7 in.) apart. HARD COPIES UNCONTROLLED Page 22

142 MIRA Ultrasonic Imaging Device User s Manual Setup and Use Figure 14: A photograph of device in use, with lights visible. Page 23 H ARD C OPIES U NCONTROLLED
143 MIRA Ultrasonic Imaging Device User s Manual Setup and Use 3.6 Maintenance The MIRA system does not require significant maintenance. The device should be charged regularly, which takes approximately 6 hours. To make sure that the power cord is plugged in correctly, remember to check to make sure that the amber light next to the power button is illuminated (if not, change the orientation of the plug at the wall since it is not polarized). The transducers may be cleaned with a dry cloth, but are sensitive so care is needed. For any more significant maintenance, contact the dealer or manufacturer (see Additional Resources). HARD COPIES UNCONTROLLED Page 24

144 MIRA Ultrasonic Imaging Device User s Manual Data Processing 4 Data Processing 4.1 Installing and Opening Software Install the Ideal Viewer on the computer being used for data processing, if necessary. Ideal Viewer is available on CD from the manufacturer, and works on computers with the Windows Operating System. Open the CD, click Setup.exe and follow the suggested steps. Figure 15 shows how the screen appears When the software is open but no data has been transferred yet. On first run after installation an activation key is needed for the software. This key should be provided within the MIRA device purchase documentation. Figure 15: A photograph of the start-up screen in Ideal Viewer. 4.2 Data Transfer Connect the ultrasonic imaging device to the computer using the USB cord (note that this USB cord will not charge the device). To transfer, open, or edit files, you may go directly to the MIRA drive which should be visible on the computer once the USB connection is made. Each scan will be comprised of three different file types:.lbv,.cfg, and.bmp. Each file type serves a different function: HARD COPIES UNCONTROLLED Page 25
145 MIRA Ultrasonic Imaging Device User s Manual Data Processing The.lbv files contain all original time domain signals and the corresponding configuration, in a binary format. In most cases, this is the only file type that needs to be opened directly by the Ideal Viewer. The file type.cfg contains data on the configuration parameters, in an ASCII text format. These files should be kept in the same folder as the.lbv file(s), but do not need to be opened in most cases. Finally,.bmp files are screenshots from the ultrasonic imaging device itself of the B-Scan image at the time of the scan. These files should be kept in the same folder as the.lbv file(s) and are often most convenient for generating quick reports. To view, process, and analyze a scan, open its.lbv file with the Ideal viewer. To work with a Map Scan, there will be multiple.lbv files but only one needs to be opened. Ideal Viewer will automatically load the other necessary files in the correct positions based on the spacing defined in the map settings. 4.3 Configuring View Settings This section will explain the different options for viewing scans, including 2-D and 3-D options, color options, and magnification. Note that in most settings, when the cursor is on a scan image, the left mouse button will allow rotation of the image and the right mouse button will allow zooming in and out of the image D and 3D Display Modes This section is only relevant to viewing of a Map Scan, since B-Scans are necessarily only 2D and in one orientation. The five buttons governing 2D and 3D display are at the top of the screen, and each has an image of a different cube. In order from left to right, the buttons allow users to toggle between: A 3D view of the data set A C-Scan from the data set (refer back to Figure 11 to see what B, C, and D represent) A D-Scan of the data set A B-Scan of the data set A B-, C-, D-, and 3D view all at once, also known as BCD Mode (Figure 16) HARD COPIES UNCONTROLLED Page 26
 road with rebar spaced approximately every 30.5 cm (1.0 ft). 4.3.2 Color Modes The three buttons in the top-middle of Ideal Viewer control the color of a scan.")
146 MIRA Ultrasonic Imaging Device User s Manual Data Processing Figure 16: A photograph of a scan in BCD mode in Ideal Viewer. Note that the BCD button is highlighted near the top of the image. This map scan is of a 6.0 m (19.7 ft) road with rebar spaced approximately every 30.5 cm (1.0 ft) Color Modes The three buttons in the top-middle of Ideal Viewer control the color of a scan. In order from left to right, these buttons allow users to toggle between: Default rendering (note that this option is selected in Figure 16) Texturizer rendering Isosurface rendering (see Figure 17 for an example) Generally, the default option creates the most color-rich image and is the default. The alternative texturizer rendering may be useful for emphasizing texture of a volume. Isosurface rendering may be useful in highlighting small artifacts, since they tend to show up as bright yellow while the rest of the scan appears white, or blank Magnification Modes The level of magnification can be determined to some degree using the mouse s zoom function, but may also be adjusted using two buttons at the top-right of the Ideal Viewer HARD COPIES UNCONTROLLED Page 27
: The left button (Fit to Screen mode), with the four arrows extending out from each corner, fits the scan to the")
147 MIRA Ultrasonic Imaging Device User s Manual Data Processing Figure 17: A photograph of a scan in Isosurface mode. Note that this scan is also in 3D mode. window. These two buttons are both gray and square-shaped (seen at the top of Figure 18): The left button (Fit to Screen mode), with the four arrows extending out from each corner, fits the scan to the screen. Some of the scan may be cut off, especially if the map was very long or tall (Figure 18). The right button (Keep Proportions mode), with the lines on the left and right side of the cube, keeps the proportions of the scan. The entire data set will be displayed, but the data may be difficult to interpret if the map was very long or tall (Figure 19). Switching between these two settings allows users to get a sense of the whole scan, and of smaller portions. 4.4 Exporting Results In some cases, data processing will only entail viewing the scans in Ideal Viewer. However, in many cases the final step will be to export the results so that they may be shared with other people, embedded in a report, etc. This section explains the steps and options for exporting results. HARD COPIES UNCONTROLLED Page 28


148 MIRA Ultrasonic Imaging Device User s Manual Data Processing Figure 18: A photograph of a scan in Fit to Screen mode in Ideal Viewer. Figure 19: A photograph of a scan in Keep Proportions mode. Page 29 HARD COPIES UNCONTROLLED

149 MIRA Ultrasonic Imaging Device User s Manual Data Processing First, click the camera-shaped button at the top-right of the Ideal Viewer window. This button may be hidden by default; clicking the right arrow button in the corner of the window will then make it visible along with any other additional buttons. Next, a window will pop up to offer different export options (Figure 20). Note the small icons and check boxes on the right side of that window: these allow the screenshot to be saved in.pdf or.bmp format. Bitmap files will only include the screenshot, while, the.pdf option will be formatted more like a writeup (Figure 21). The appropriate format will depend on the intended purpose of the data. Figure 20: A photograph of the window in Ideal Viewer for exporting screenshots. On the right, there are check boxes by the PDF and BMP icons. HARD COPIES UNCONTROLLED Page 30

150 MIRA Ultrasonic Imaging Device User s Manual Data Processing Figure 21: A photograph of a PDF report generated by Ideal Viewer. Page 31 HARD COPIES UNCONTROLLED
151 MIRA Ultrasonic Imaging Device User s Manual Data Interpretation 5 Data Interpretation This section describes how to interpret scans once they have been collected and processed. The section begins with features specific to B-Scans. This section is also relevant to interpreting Map Scans, since Map Scans are comprised of multiple B-Scans. The final section discusses issues specific to Map Scans. Note: To show how B-Scans, Map Scans, and various features are interrelated, all of the figures in this section come from the same mapping project. 5.1 B-Scan Interpretation Objects The primary goal of scanning concrete with the MIRA ultrasonic imaging device is to identify various objects and their relative locations and densities. As discussed in the introduction, the MIRA will display wave reflectors, like steel, as well as voids, areas of varying concrete thickness, and other features. Such reflection features will usually manifest as yellow, red, or orange areas. Their location can be determined by noting the coordinates on the X and Z axis, either on the device s display or in Ideal Viewer Echoes Echoes are areas of scans that appear to be reflecting objects, but which are actually just artificial reflections of nearby dense objects. In Figure 22, for example, only the top-most objects are actually present in the sample. Determining what is an echo and what is a real feature requires a familiarity with the material being scanned. At the same time, echoes are inherent components of the imaging process, and are not necessarily problematic Blind Zones Blind zones are areas of concrete where the MIRA does not register any data. They tend to occur due to excessive depth of concrete (greater than 1 m (3.28 ft), or due to the spacing of B scans when creating a map scan. These areas will appear completely black. HARD COPIES UNCONTROLLED Page 32

152 MIRA Ultrasonic Imaging Device User s Manual Data Interpretation Figure 22: A screenshot of echoing in a B-Scan. The top-most red area is an actual artifact; the echoes are below. HARD COPIES UNCONTROLLED Page 33
153 MIRA Ultrasonic Imaging Device User s Manual Data Interpretation Halo Effects Like echoes, halo effects are areas of scans that appear to be very strong reflection artifacts but which are actually side effects of nearby objects. The term halo refers to the curved nature of some of these distortions. This effect is often characterized by a arc-shaped image (Figure 23). Figure 23: A magnified image of a halo effect in a B-Scan. The halo is the curved, red artifact below the actual pieces of rebar near the top of the image. HARD COPIES UNCONTROLLED Page 34
154 MIRA Ultrasonic Imaging Device User s Manual Data Interpretation Saturation High levels of saturation (usually characterized by a very red image) may point to multiple or large actual artifacts in the concrete. Alternatively, the image may be simply oversaturated due to the positioning of the device on the concrete or the analog/color gain settings. If saturation is localized, that is likely due to the device s settings (Figure 24). If the saturation is more widespread, the source is probably the device s positioning (too few transducers were touching the surface, etc.). Figure 24: A screenshot of localized saturation in a B-Scan. This effect can be addressed by adjusting the color gain. HARD COPIES UNCONTROLLED Page 35
155 MIRA Ultrasonic Imaging Device User s Manual Data Interpretation 5.2 Map Scan Interpretation Interpreting Map Scans requires many of the same skills as interpreting B-Scans, for two reasons. First, any features in an individual B-Scan will appear in the overall Map Scan. Second, in Ideal Viewer it is common and often effective to analyze individual B-, C-, or D-scans rather than to analyze the overall 3D image. Nevertheless, there are some interpretive challenges that are specific to Map Scans Positioning When a Map Scan has more features than expected, the features may be actual artifacts in the concrete. Another possible explanation for such features, however, is that the device was positioned imprecisely during the scanning process. In some cases, the illusion of additional artifacts may not hinder interpretation of the data if the user is aware of the cause. If it does make interpretation difficult or impossible, however, then the map should be recaptured Spacing If a Map Scan has gaps or, on the other hand, appears compressed, then that is likely a result of how the map s grid was spaced out or recorded in the device. In some cases, spacing issues may not hinder interpretation of the data as long as the user is aware of the cause. If they do make interpretation difficult or impossible, however, then the map should be recaptured. HARD COPIES UNCONTROLLED Page 36
156 MIRA Ultrasonic Imaging Device User s Manual Troubleshooting 6 Troubleshooting 6.1 Device Will Not Turn On If the device will not power up, ensure that the battery is charged or charging by plugging it in with the power cord. If the device is plugged in but the problem persists, check to make sure the amber charging light is illuminated on top of the device (refer back to Figure 3). If that light is not visible, try reversing the wall plug s orientation (the plug is not polarized, so it is impossible to tell if it is plugged in correctly without checking the amber light). 6.2 Device Will Not Save Scans If the device will turn on but will not save scans, the hard drive may be full. When the hard drive is full, the device will still collect data, but that data will not be saved. There will not be any notification that the hard drive is full, so it is important to check that scans are being saved at the beginning of each scanning session. You can check the hard drive s content by turning on the device, Clicking the Wrench button on the device to enter the configuration settings, then clicking F5 to get to the System Options page, and reading the line that begins with Free memory left, Mb.. After checking the battery and deleting old scans a restart is necessary, turn the device off, restart it, and try taking a scan again. 6.3 B-Scan Appears Red If a scan appears uniformly or overwhelmingly red, then image oversaturation is the likely cause. Image oversaturation may occur in two ways, each with a different solution. If the device does not have enough transducers making contact with the concrete surface, that can lead to oversaturation. Try repositioning the device or choosing a larger, smoother section part of the concrete to scan. Alternatively, the problem could be with the device s gain settings. Try reducing these setting and taking a new scan. The color saturation can be directly adjusted with the +/- keys on the left side of the device. The device s gain settings can be adjusted by pushing the wrench button on the device to enter the configuration settings and then selecting the F1 key on the left of the display. Scroll to the analog gain setting and increase or decrease with the +/- keys. HARD COPIES UNCONTROLLED Page 37
157 MIRA Ultrasonic Imaging Device User s Manual Troubleshooting 6.4 B-Scan Appears Pure Black If a B-Scan appears uniformly or overwhelmingly black, it is likely that not enough signal amplitude is being collected. The first solution to try is to increase the scan color gain by pushing the + button. This problem may be also due to the surface conditions, which may be too rough, wet, or dusty. Try cleaning the surface and/or repositioning the device and rescan. For large test specimens, the time period of data collection may be too small. Try increasing the time period in the device configuration settings, so that there is more time for the device to collect data. Finally, the analog gain may be set too low for the intended application. Increasing the analog gain settings may also address this issue. A standard value to start with the analog gain is a gain of 40 db. This procedure is described in the configuration settings portion of this manual. 6.5 B-Scan Appears Pure Blue If a B-Scan appears uniformly or overwhelmingly blue, it is likely that the transducers are making little to no contact with the concrete. Try repositioning the device. 6.6 B-Scan Has Unexpected Artifacts There are several possible reasons why unexpected artifacts may appear in a B scan, not all of which are necessarily problematic. The artifact may be an actual anomaly in the concrete, whether a piece of steel, an air pocket, moisture pore, or some other impurity. An artifact may also be a reflection. If there is a piece of steel or other strong reflecting material in a concrete section, for example, it is common for a similar-looking or halo-shaped reflection of that artifact to appear deeper down in the scan. Although erroneous, these reflections are a sign of the device working as designed, and cannot be easily removed. Often if the scan is repeated the erroneous reflection will not resolve a second time. While images of actual objects or reflections of those objects may serve as useful data, unexpected artifacts may also come from errors in device positioning. Specifically, there may be errors with the device s placement location or its contact with the concrete. If several of the transducers are not making clean contact with the surface, the scan s appearance will be affected. Try re-positioning the device on a suitable section of concrete and redoing the scans. If the anomalies still appear, then they may be signs of an actual artifact or reflection. HARD COPIES UNCONTROLLED Page 38
158 MIRA Ultrasonic Imaging Device User s Manual Troubleshooting 6.7 Map Scan Has Unexpected Artifacts If a map scan has unexpected artifacts, that may be due to issues with the individual B scans (see previous section). However, if the B scans appear normal but the map scan has unexpected features, the cause may be positioning errors which interfere with the device s ability to interpolate B scans. Specifically, the grid spacing may have been inconsistent or too far apart. For example, if scans are taken with inconsistent spacing, a single piece of steel may appear as two distinct artifacts in the map scan. Ensure that the grid settings on the device match the grid spacing being used in the field, and that the device is being positioned carefully according to the lights and/or chalk marks, and then try redoing the scans. 6.8 Map Scan Appears Distorted or Compressed If individual B scans from a given surface appear normal but the overall map scan appears distorted, the cause may be the device s grid settings. The positioning lights on the device are 170 mm (6.7 in.) apart, but the default grid settings on the device are set to 100 mm (3.9 in.). When the grid settings on the device are different than how a user is actually spacing out the scans in the field, then the eventual map scan may appear condensed, even crunched. Try adjusting the device s grid settings to 170 mm (6.7 in.) on the map creation settings page, and then try redoing the scans. HARD COPIES UNCONTROLLED Page 39
159 MIRA Ultrasonic Imaging Device User s Manual Additional Resources 7 Additional Resources Advanced user tools have been written in MATLAB as Open Source code and released at the following website: Acoustic Control Systems Zagoryevskaya St. 10, Bldg , Moscow, Russia Phone: market@acsys.ru Web Site: Dynasty Group 205 W. Wacker Dr., Suite 1450 Chicago, Illinois Phone: info@dynastygrp.com Web Site: Germann Instruments 8845 Forest View Road Evanston, Illinois Phone: germann@germann.org Web Site: HARD COPIES UNCONTROLLED Page 40
160 MIRA Ultrasonic Imaging Device User s Manual References 8 References Acoustic Control Systems Ultrasonic Low-Frequency Tomograph A1040 Operation Manual. Accessed online 25 June Retrieved from production/detail/a1040-mira/ Acoustic Control Systems Manual of the Visualization Software Ideal Viewer. Accessed online 14 August Retrieved from Documents/IDEALview.pdf/ De La Haza, A. O., C. G. Petersen, and A. Samokrutov. No date. Three Dimensional Imaging of Concrete Structures Using Ultrasonic Shear Waves. Acoustic Control Systems. Accessed online 25 June Retrieved from three-dimensional-imaging-of-concrete-structures-using-ultrasonic-shear-waves/ De La Haza, A. O., A. A. Samokrutov, and P. A. Samokrutov Assessment of Concrete Structures using the Mira and Eyecon Ultrasonic Shear Wave Devices and the SAFT-C Image Reconstruction Technique, Construction and Building Materials, Volume 38, pp Germann Instruments. No date. NDT Systems Catalog. Accessed online 25 June Retrieved from Tomographer.pdf HARD COPIES UNCONTROLLED Page 41
161


162
MIRA Purpose MIRA Tomographer MIRA MIRA Principle MIRA MIRA shear waves MIRA
 Purpose The MIRA Tomographer is a state-of-the-art instrument for creating a three-dimensional (3-D) representation (tomogram) of internal defects that may be present in a concrete element. MIRA is based
Chapter 4 Results. 4.1 Pattern recognition algorithm performance
 94 Chapter 4 Results 4.1 Pattern recognition algorithm performance The results of analyzing PERES data using the pattern recognition algorithm described in Chapter 3 are presented here in Chapter 4 to
Identification of Delamination Damages in Concrete Structures Using Impact Response of Delaminated Concrete Section
 Identification of Delamination Damages in Concrete Structures Using Impact Response of Delaminated Concrete Section Sung Woo Shin 1), *, Taekeun Oh 2), and John S. Popovics 3) 1) Department of Safety Engineering,
Dowel Alignment: Measurement and Impacts on Pavement Performance
 Dowel Alignment: Measurement and Impacts on Pavement Performance prepared by: Mark B. Snyder, Ph.D., P.E. Vice-President, ACPA-PA Chapter for: ACPA s 2012 Annual Meeting Concrete Pavement University November
CENTER FOR INFRASTRUCTURE ENGINEERING STUDIES
 1 CENTER FOR INFRASTRUCTURE ENGINEERING STUDIES Nondestructive Ultrasonic Detection of FRP Delamination By Dr. Norbert Maerz University Transportation Center Program at UTC R81 The University of Missouri-Rolla
GPR SYSTEM USER GUIDE AND TROUBLESHOOTING GUIDE
 GPR SYSTEM USER GUIDE AND TROUBLESHOOTING GUIDE Implementation Report 5-4414-01-1 Project Number 5-4414-01 Subsurface Sensing Lab Electrical and Computer Engineering University of Houston 4800 Calhoun
SCANNING METHOD. Olson Instruments Impact Echo Scanner. incorporating source and receiver. Overlay. Sound joint between. overlay and bridge deck
 IE Method N D E I M P A C T E C H O S C A N N I N G A PPLICATION Impact Echo (IE) investigations are performed to assess the condition of slabs, beams, columns, walls, pavements, runways, tunnels, and
OPPORTUNISTIC TRAFFIC SENSING USING EXISTING VIDEO SOURCES (PHASE II)
") CIVIL ENGINEERING STUDIES Illinois Center for Transportation Series No. 17-003 UILU-ENG-2017-2003 ISSN: 0197-9191 OPPORTUNISTIC TRAFFIC SENSING USING EXISTING VIDEO SOURCES (PHASE II) Prepared By Jakob
CIVIL ENGINEERING STUDIES Illinois Center for Transportation Series No. 17-003 UILU-ENG-2017-2003 ISSN: 0197-9191 OPPORTUNISTIC TRAFFIC SENSING USING EXISTING VIDEO SOURCES (PHASE II) Prepared By Jakob
Automated NDE of Post-Tensioned Concrete Bridges Using Imaging Echo Methods
 ECNDT 2006 - We.1.3.1 Automated NDE of Post-Tensioned Concrete Bridges Using Imaging Echo Methods Doreen STREICHER, Daniel ALGERNON, Jens WÖSTMANN, Matthias BEHRENS, Herbert WIGGENHAUSER, BAM Federal Institute
AUTOMATED ULTRASONIC SCANNING AND IMAGING SYSTEM FOR APPLICATION AT CIVIL STRUCTURES
 AUTOMATED ULTRASONIC SCANNING AND IMAGING SYSTEM FOR APPLICATION AT CIVIL STRUCTURES Martin SCHICKERT Institute of Materials Research and Testing (MFPA Weimar), Weimar, Germany Wolfgang HILLGER Ing.-Büro
1. Report No. FHWA/TX-05/ Title and Subtitle PILOT IMPLEMENTATION OF CONCRETE PAVEMENT THICKNESS GPR
 1. Report No. FHWA/TX-05/5-4414-01-3 4. Title and Subtitle PILOT IMPLEMENTATION OF CONCRETE PAVEMENT THICKNESS GPR Technical Report Documentation Page 2. Government Accession No. 3. Recipient s Catalog
Non-Destructive Bridge Deck Assessment using Image Processing and Infrared Thermography. Masato Matsumoto 1
 Non-Destructive Bridge Deck Assessment using Image Processing and Infrared Thermography Abstract Masato Matsumoto 1 Traditionally, highway bridge conditions have been monitored by visual inspection with
The use of high frequency transducers, MHz, allowing the resolution to target a few cm thick in the first half meter suspect.
 METHODOLOGY GPR (GROUND PROBING RADAR). In recent years the methodology GPR (Ground Probing Radar) has been applied with increasing success under the NDT thanks to the high speed and resolving power. As
A practice driven approach to the development of the ultrasonic pulse echo technique applied to concrete structural assessment
 A practice driven approach to the development of the ultrasonic pulse echo technique applied to concrete structural assessment D. Corbett, F. Gattiker, S. Vonk 1, Dr.-Ing. A. Taffe 1 and L. Raj 2 Proceq
INTERNAL CONCRETE INSPECTION AND EVALUATION METHODS FOR STEEL PLATE-BONDED SLABS BY USING ELASTIC WAVES VIA ANCHOR BOLTS
 More info about this article: h Czech Society for Nondestructive Testing 32 nd European Conference on Acoustic Emission Testing Prague, Czech Republic, September 7-9, 216 INTERNAL CONCRETE INSPECTION AND
RapidScan II Application Note General Composite Scanning
 RapidScan II Application Note General Composite Scanning RapidScan II General Composite Scanning Application Note Page 1 Applications The RapidScan system has been utilised for a wide range of inspections
NUTC R293. Field Evaluation of Thermographic Bridge Concrete Inspection Techniques. Glenn Washer
 Field Evaluation of Thermographic Bridge Concrete Inspection Techniques by Glenn Washer NUTC R293 A National University Transportation Center at Missouri University of Science and Technology Disclaimer
Amplitudes Variation of GPR Rebar Reflection Due to the Influence of Concrete Aggregate Scattering
 More Info at Open Access Database www.ndt.net/?id=18402 Amplitudes Variation of GPR Rebar Reflection Due to the Influence of Concrete Aggregate Scattering Thomas KIND Federal Institute for Materials Research
Investigation of Bridge Decks Utilizing Ground Penetrating Radar
 Investigation of Bridge Decks Utilizing Ground Penetrating Radar Steve Cardimona *, Brent Willeford *, John Wenzlick +, Neil Anderson * * The University of Missouri-Rolla, Department of Geology and Geophysics
Extending Acoustic Microscopy for Comprehensive Failure Analysis Applications
 Extending Acoustic Microscopy for Comprehensive Failure Analysis Applications Sebastian Brand, Matthias Petzold Fraunhofer Institute for Mechanics of Materials Halle, Germany Peter Czurratis, Peter Hoffrogge
ANOTHER LOOKS: APPLICATION OF STICK SCANNER IN RC STRUCTURES ASSESSMENT (BM-003)
") ANOTHER LOOKS: APPLICATION OF STICK SCANNER IN RC STRUCTURES ASSESSMENT (BM-003) Achfas Zacoeb 1*, Yukihiro Ito 2, and Koji Ishibashi 3 1 Lecturer, Department of Civil Engineering, Brawijaya University,
ANOTHER LOOKS: APPLICATION OF STICK SCANNER IN RC STRUCTURES ASSESSMENT (BM-003) Achfas Zacoeb 1*, Yukihiro Ito 2, and Koji Ishibashi 3 1 Lecturer, Department of Civil Engineering, Brawijaya University,
Advances in NDE Technology WHATS NEW?
 Advances in NDE Technology WHATS NEW? Glen Simula, Owner GS Infrastructure, Inc. The state of America s deteriorating infrastructure presses us to find solutions to assess, with limited funds and resources.
Advanced Methods to Identify Asphalt Pavement Delamination (R06D) Minnesota DOT Evaluation: Calibration and Signal Analysis
 Minnesota DOT Evaluation: Calibration and Signal Analysis") Advanced Methods to Identify Asphalt Pavement Delamination (R06D) Minnesota DOT Evaluation: Calibration and Signal Analysis Ken Maser, Infrasense Shongtao Dai, Research Operations Engineer Kyle Hoegh,
Advanced Methods to Identify Asphalt Pavement Delamination (R06D) Minnesota DOT Evaluation: Calibration and Signal Analysis Ken Maser, Infrasense Shongtao Dai, Research Operations Engineer Kyle Hoegh,
ASSESSMENT OF STRUCTURAL CONCRETE COMPONENTS USING AIR-COUPLED IMPACT-ECHO
 ASSESSMENT OF STRUCTURAL CONCRETE COMPONENTS USING AIR-COUPLED IMPACT-ECHO Algernon, D., Ernst, H., Dressler, K., SVTI Swiss Association for Technical Inspections, Nuclear Inspectorate, Switzerland Contact:
SUMMARY SHEETS OF BAR COUPLER CONNECTIONS
 APPENDIX A SUMMARY SHEETS OF BAR COUPLER CONNECTIONS NCHRP 12 88 Connection Evaluations Appendix A A 1 APPENDIX A SUMMARY SHEETS OF BAR COUPLER CONNECTIONS NCHRP 12 88 Connection Evaluations Appendix
Guided Wave Travel Time Tomography for Bends
 18 th World Conference on Non destructive Testing, 16-20 April 2012, Durban, South Africa Guided Wave Travel Time Tomography for Bends Arno VOLKER 1 and Tim van ZON 1 1 TNO, Stieltjes weg 1, 2600 AD, Delft,
RELIABILITY OF GUIDED WAVE ULTRASONIC TESTING. Dr. Mark EVANS and Dr. Thomas VOGT Guided Ultrasonics Ltd. Nottingham, UK
 RELIABILITY OF GUIDED WAVE ULTRASONIC TESTING Dr. Mark EVANS and Dr. Thomas VOGT Guided Ultrasonics Ltd. Nottingham, UK The Guided wave testing method (GW) is increasingly being used worldwide to test
Dowel Bar Alignment and Location for Placement by Mechanical Dowel Bar Insertion
 Dowel Bar Alignment and Location for Placement by Mechanical Dowel Bar Insertion January 7, 2013 Scope, Background and Applicability This guide specification is directly applicable to 18 in. (457 mm) long,
(Gibbons and Ringdal 2006, Anstey 1964), but the method has yet to be explored in the context of acoustic damage detection of civil structures.
, but the method has yet to be explored in the context of acoustic damage detection of civil structures.") ABSTRACT There has been recent interest in using acoustic techniques to detect damage in instrumented civil structures. An automated damage detection method that analyzes recorded data has application
ABSTRACT There has been recent interest in using acoustic techniques to detect damage in instrumented civil structures. An automated damage detection method that analyzes recorded data has application
Testing of Buried Pipelines Using Guided Waves
 Testing of Buried Pipelines Using Guided Waves A. Demma, D. Alleyne, B. Pavlakovic Guided Ultrasonics Ltd 16 Doverbeck Close Ravenshead Nottingham NG15 9ER Introduction The inspection requirements of pipes
AFRL-RX-WP-TP
 AFRL-RX-WP-TP-2008-4046 DEEP DEFECT DETECTION WITHIN THICK MULTILAYER AIRCRAFT STRUCTURES CONTAINING STEEL FASTENERS USING A GIANT-MAGNETO RESISTIVE (GMR) SENSOR (PREPRINT) Ray T. Ko and Gary J. Steffes
NOVEL ACOUSTIC EMISSION SOURCE LOCATION
 NOVEL ACOUSTIC EMISSION SOURCE LOCATION RHYS PULLIN, MATTHEW BAXTER, MARK EATON, KAREN HOLFORD and SAM EVANS Cardiff School of Engineering, The Parade, Newport Road, Cardiff, CF24 3AA, UK Abstract Source
To: New York State Department of Transportation ENGINEERING INSTRUCTION. Approved:
 To: New York State Department of Transportation ENGINEERING INSTRUCTION Title: PRECAST CONCRETE PAVEMENT SLAB SYSTEMS STANDARD SPECIFICATION Distribution: Manufacturers (18) Local Govt. (31) Agencies (32)
Project No.: VTRC 06-R22 March Period Covered: Contract No.
 Standard Title Page - Report on State Project Report No. Report Date No. Pages Type Report: Final Project No.: 78783 VTRC 06-R22 March 2006 17 Period Covered: Contract No. Title: Evaluation of Precast
Adapting a Ground Coupled GPR Threshold Model for Use with Air Coupled GPR Systems
 International Symposium Non-Destructive Testing in Civil Engineering (NDT-CE) More Info at Open Access Database www.ndt.net/?id=18339 September 15-17, 2015, Berlin, Germany Adapting a Ground Coupled GPR
Integration of Traditional and Non- Traditional Remote Sensing for Bridge Condition Assessment
 Integration of Traditional and Non- Traditional Remote Sensing for Bridge Condition Assessment Tess Ahlborn, Ph.D., P.E., FPCI Devin Harris, Ph.D., Colin Brooks and Larry Sutter, Ph.D. Michigan Technological
Generation Laser Scanning Method for Visualizing Ultrasonic Waves Propagating on a 3-D Object
 1st International Symposium on Laser Ultrasonics: Science, Technology and Applications July 16-18 2008, Montreal, Canada Generation Laser Scanning Method for Visualizing Ultrasonic Waves Propagating on
EMAT Application on Incoloy furnace Tubing Ramamohan Reddy M (ASNT Level III UT, PCN Level III UT,PAUT&TOFD)
") EMAT Application on Incoloy furnace Tubing By Ramamohan Reddy M (ASNT Level III UT, PCN Level III UT,PAUT&TOFD) Outlines 1. Introduction EMAT 2. EMAT- Ultrasound waves 3. EMAT-Surface waves 4. EMAT-Guided
EMAT Application on Incoloy furnace Tubing By Ramamohan Reddy M (ASNT Level III UT, PCN Level III UT,PAUT&TOFD) Outlines 1. Introduction EMAT 2. EMAT- Ultrasound waves 3. EMAT-Surface waves 4. EMAT-Guided
A New Elastic-wave-based NDT System for Imaging Defects inside Concrete Structures
 A New Elastic-wave-based NDT System for Imaging Defects inside Concrete Structures Jian-Hua Tong and Shu-Tao Liao Abstract In this paper, a new elastic-wave-based NDT system was proposed and then applied
Ultrasonic Guided Waves for NDT and SHM
 Ultrasonic Guided Waves for NDT and SHM Joseph L. Rose Paul Morrow Professor Engineering Science & Mechanics Department Penn State University Chief Scientist FBS,Inc. CAV Presentation May 4, 2009 The difference
Diagnostics of Bridge Pavements by Ground Penetrating Radar
 11th European Conference on Non-Destructive Testing (ECNDT 2014), October 6-10, 2014, Prague, Czech Republic Diagnostics of Bridge Pavements by Ground Penetrating Radar Radek MATULA 1, Josef STRYK 1, Karel
New Multi-Technology In-Line Inspection Tool For The Quantitative Wall Thickness Measurement Of Gas Pipelines
 New Multi-Technology In-Line Inspection Tool For The Quantitative Wall Thickness Measurement Of Gas Pipelines A. Barbian 1, M. Beller 1, F. Niese 2, N. Thielager 1, H. Willems 1 1 NDT Systems & Services
Characterization of Damages in Honeycomb Structures Using SonatestDryScan 410D
 18thWorld Conference on Nondestructive Testing, 16-20 April 2012, Durban, South Africa Characterization of Damages in Honeycomb Structures Using SonatestDryScan 410D Winnie M. SITHOLE 1, Ngeletshedzo NETSHIDAVHINI
Estimaton of Rebar Diameter Using Ground Penetrating Radar
 International Journal of Advances in Scientific Research and Engineering (ijasre) E-ISSN : 2454-8006 Vol.3, Special Issue 1 Aug - 2017 Estimaton of Rebar Diameter Using Ground Penetrating Radar K Ambika
Jointed Precast Concrete Pavement
 NATIONAL PRECAST CONCRETE ASSOCIATION Manual for Jointed Precast Concrete Pavement 3rd Edition Authors Peter Smith, P.E. Mark B. Snyder, Ph.D., P.E. Graphic Designer Deborah Templeton NPCA Precast Concrete
Technical Report Documentation Page 2. Government 3. Recipient s Catalog No.
 1. Report No. FHWA/TX-06/0-4958-1 Technical Report Documentation Page 2. Government 3. Recipient s Catalog No. Accession No. 4. Title and Subtitle Linear Lighting System for Automated Pavement Distress
B. Installation Instructions. Provide installation instructions, including any special equipment, to address the following.
 SAMPLING AND TESTING. The Sampling and Testing requirements contained in -03 shall apply. MARKING. The Marking requirements contained in -03 shall apply. FINAL PRODUCTION INSPECTION. The Final Production
An acousto-electromagnetic sensor for locating land mines
 An acousto-electromagnetic sensor for locating land mines Waymond R. Scott, Jr. a, Chistoph Schroeder a and James S. Martin b a School of Electrical and Computer Engineering b School of Mechanical Engineering
A NOVEL HIGH SPEED, HIGH RESOLUTION, ULTRASOUND IMAGING SYSTEM
 A NOVEL HIGH SPEED, HIGH RESOLUTION, ULTRASOUND IMAGING SYSTEM OVERVIEW Marvin Lasser Imperium, Inc. Rockville, Maryland 20850 We are reporting on the capability of our novel ultrasonic imaging camera
Form DOT F (8-72) This form was electrically by Elite Federal Forms Inc. 16. Abstract:
 This form was electrically by Elite Federal Forms Inc. 16. Abstract:") 1. Report No. FHWA/TX-06/0-4820-3 4. Title and Subtitle Investigation of a New Generation of FCC Compliant NDT Devices for Pavement Layer Information Collection: Technical Report 2. Government Accession
1. Report No. FHWA/TX-06/0-4820-3 4. Title and Subtitle Investigation of a New Generation of FCC Compliant NDT Devices for Pavement Layer Information Collection: Technical Report 2. Government Accession
NUTC R305/ R306. Breaking Wire Detection and Strain Distribution of Seven-Wire Steel Cables with Acoustic Emission and Optical Fiber Sensors
 Breaking Wire Detection and Strain Distribution of Seven-Wire Steel Cables with Acoustic Emission and Optical Fiber Sensors by Dr. Maochen Ge Dr. Genda Chen NUTC R305/ R306 A National University Transportation
An Overview Algorithm to Minimise Side Lobes for 2D Circular Phased Array
 An Overview Algorithm to Minimise Side Lobes for 2D Circular Phased Array S. Mondal London South Bank University; School of Engineering 103 Borough Road, London SE1 0AA More info about this article: http://www.ndt.net/?id=19093
DETECTION OF CORROSION IN BOTTOM PLATES OF GAS AND OIL TANKS USING GUIDED ULTRASONIC WAVES AND ELECTROMAGNETIC ULTRASONIC (EMAT) TRANSDUCERS
 TRANSDUCERS") DETECTION OF CORROSION IN BOTTOM PLATES OF GAS AND OIL TANKS USING GUIDED ULTRASONIC WAVES AND ELECTROMAGNETIC ULTRASONIC (EMAT) TRANSDUCERS A Presentation prepared for the Jahrestagung der Deutsche Gesellschaft
DETECTION OF CORROSION IN BOTTOM PLATES OF GAS AND OIL TANKS USING GUIDED ULTRASONIC WAVES AND ELECTROMAGNETIC ULTRASONIC (EMAT) TRANSDUCERS A Presentation prepared for the Jahrestagung der Deutsche Gesellschaft
Tadeusz Stepinski and Bengt Vagnhammar, Uppsala University, Signals and Systems, Box 528, SE Uppsala, Sweden
 AUTOMATIC DETECTING DISBONDS IN LAYERED STRUCTURES USING ULTRASONIC PULSE-ECHO INSPECTION Tadeusz Stepinski and Bengt Vagnhammar, Uppsala University, Signals and Systems, Box 58, SE-751 Uppsala, Sweden
Array Eddy Current for Fatigue Crack Detection of Aircraft Skin Structures
 Array Eddy Current for Fatigue Crack Detection of Aircraft Skin Structures Eric Pelletier, Marc Grenier, Ahmad Chahbaz and Tommy Bourgelas Olympus NDT Canada, NDT Technology Development, 505, boul. du
Full Polarimetric THz Imaging System in Comparison with Infrared Thermography
 11th European Conference on Non-Destructive Testing (ECNDT 2014), October 6-10, 2014, Prague, Czech Republic More Info at Open Access Database www.ndt.net/?id=16556 Full Polarimetric THz Imaging System
AIR-COUPLED ULTRASONIC TOMOGRAPHIC IMAGING OF CONCRETE ELEMENTS KERRY STEVEN HALL DISSERTATION
 AIR-COUPLED ULTRASONIC TOMOGRAPHIC IMAGING OF CONCRETE ELEMENTS BY KERRY STEVEN HALL DISSERTATION Submitted in partial fulfillment of the requirements for the degree of Doctor of Philosophy in Civil Engineering
Frequency Considerations in Air-Coupled Ultrasonic Inspection.
 Frequency Considerations in Air-Coupled Ultrasonic Inspection. Joe Buckley, Sonatest Plc. Milton Keynes, Bucks, MK12 5QQ, England Tel: + 44 1908 316345 Fax: + 441908 321323 joeb@sonatest-plc.com Hanspeter
Design of a Piezoelectric-based Structural Health Monitoring System for Damage Detection in Composite Materials
 Design of a Piezoelectric-based Structural Health Monitoring System for Damage Detection in Composite Materials Seth S. Kessler S. Mark Spearing Technology Laboratory for Advanced Composites Department
RECENT ADVANCEMENTS IN THE APPLICATION OF EMATS TO NDE
 RECENT ADVANCEMENTS IN THE APPLICATION OF EMATS TO NDE D. MacLauchlan, S. Clark, B. Cox, T. Doyle, B. Grimmett, J. Hancock, K. Hour, C. Rutherford BWXT Services, Non Destructive Evaluation and Inspection
Design and Construction of Highway Pavement Joint Systems
 Design and Construction of Highway Pavement Joint Systems Troubleshooting Joint Design and Construction Issues Mark B. Snyder, Ph.D., P.E. Engineering Consultant to the American Concrete Pavement Association
Title: Reference-free Structural Health Monitoring for Detecting Delamination in Composite Plates
 Title: Reference-free Structural Health Monitoring for Detecting Delamination in Composite Plates Authors (names are for example only): Chul Min Yeum Hoon Sohn Jeong Beom Ihn Hyung Jin Lim ABSTRACT This
Keywords: Ultrasonic Testing (UT), Air-coupled, Contact-free, Bond, Weld, Composites
, Air-coupled, Contact-free, Bond, Weld, Composites") Single-Sided Contact-Free Ultrasonic Testing A New Air-Coupled Inspection Technology for Weld and Bond Testing M. Kiel, R. Steinhausen, A. Bodi 1, and M. Lucas 1 Research Center for Ultrasonics - Forschungszentrum
Single-Sided Contact-Free Ultrasonic Testing A New Air-Coupled Inspection Technology for Weld and Bond Testing M. Kiel, R. Steinhausen, A. Bodi 1, and M. Lucas 1 Research Center for Ultrasonics - Forschungszentrum
Quick Assessment of the Anomalies in Concrete Structure Using Dispersive Characteristic of Surface wave
 Quick Assessment of the Anomalies in Concrete Structure Using Dispersive Characteristic of Surface wave Chia-Chi Cheng 1 *, Keng-Tsang Hsu 1, Chih-Hung Chiang 1, Fong-Jhang Ke 1, and Hong- Hua Wang 1 1
DAMAGE DETECTION IN PLATE STRUCTURES USING SPARSE ULTRASONIC TRANSDUCER ARRAYS AND ACOUSTIC WAVEFIELD IMAGING
 DAMAGE DETECTION IN PLATE STRUCTURES USING SPARSE ULTRASONIC TRANSDUCER ARRAYS AND ACOUSTIC WAVEFIELD IMAGING T. E. Michaels 1,,J.E.Michaels 1,B.Mi 1 and M. Ruzzene 1 School of Electrical and Computer
CHARACTERIZATION OF THE INTERNAL MICROSTRUCTURES OF GRANULAR MATERIALS USING COMPUTERIZED TOMOGRAPHY
 CHARACTERIZATION OF THE INTERNAL MICROSTRUCTURES OF GRANULAR MATERIALS USING COMPUTERIZED TOMOGRAPHY Xiaogong Lee Apylied Research Associates, Inc. P.O. Box 40128 Tyndall AFB, FL 32403 William C. Dass
Pave-IR Scan TM Primer
 SHRP2 Solution: Technologies to Enhance Quality Control on Asphalt Pavements Introduction Pave-IR Scan TM Primer In-place density is a critical factor in determining pavement durability in hot mix asphalt
MICROWAVE SUB-SURFACE IMAGING TECHNOLOGY FOR DAMAGE DETECTION
 MICROWAVE SUB-SURFACE IMAGING TECHNOLOGY FOR DAMAGE DETECTION By Yoo Jin Kim 1, Associate Member, ASCE, Luis Jofre 2, Franco De Flaviis 3, and Maria Q. Feng 4, Associate Member, ASCE Abstract: This paper
Ground Penetrating Radar (GPR) By Dr. Eng. Zubair Ahmed
 By Dr. Eng. Zubair Ahmed") Ground Penetrating Radar (GPR) By Dr. Eng. Zubair Ahmed Acknowledgement Golder Associates, Whitby, Ontario Stantec Consulting, Kitchener, Ontario Infrasense Inc. USA Geophysical Survey Systems Inc. (GSSI),
Ground Penetrating Radar (GPR) By Dr. Eng. Zubair Ahmed Acknowledgement Golder Associates, Whitby, Ontario Stantec Consulting, Kitchener, Ontario Infrasense Inc. USA Geophysical Survey Systems Inc. (GSSI),
Determination of the Structural Integrity of a Wind Turbine Blade Using Ultrasonic Pulse Echo Reflectometry
 International Journal of Engineering and Technology Volume 3 No. 5, May, 2013 Determination of the Structural Integrity of a Wind Turbine Blade Using Ultrasonic Pulse Echo Reflectometry Benjamin Ayibapreye
ACOUSTIC MICRO IMAGING ANALYSIS METHODS FOR 3D PACKAGES
 ACOUSTIC MICRO IMAGING ANALYSIS METHODS FOR 3D PACKAGES Janet E. Semmens Sonoscan, Inc. Elk Grove Village, IL, USA Jsemmens@sonoscan.com ABSTRACT Earlier studies concerning evaluation of stacked die packages
INVESTIGATION OF A FULL-LANE ACOUSTIC SCANNING METHOD FOR BRIDGE DECK NONDESTRUCTIVE EVALUATION
 Highway IDEA Program INVESTIGATION OF A FULL-LANE ACOUSTIC SCANNING METHOD FOR BRIDGE DECK NONDESTRUCTIVE EVALUATION Final Report for Highway IDEA Project 134 Prepared by: John S. Popovics, University
ESTIMATION OF REBAR DIAMETER IN CONCRETE STRUCTURAL ELEMENTS USING GROUND PENETRATING RADAR
 More info about this article: http://www.ndt.net/?id=21143 ESTIMATION OF REBAR DIAMETER IN CONCRETE STRUCTURAL ELEMENTS USING GROUND PENETRATING RADAR Bhaskar Sangoju and Ramanjaneyulu, K. Scientists,
Imaging using Ultrasound - I
 Imaging using Ultrasound - I Prof. Krishnan Balasubramaniam Professor in Mechanical Engineering Head of Centre for NDE Indian Institute t of Technology Madras Chennai 600 036, INDIA Email: balas@iitm.ac.in
MIT Product Demonstration
 MIT Product Demonstration ACPA 55 th Annual Meeting CPU 4 Presented by Garry Aicken, P.E. North American Distributor for MIT Demonstrate the New Rail Less Dowel Bar Scanner - MIT-DOWEL-SCAN Demonstrate
Nondestructive Evaluation Tools to Improve the Inspection, Fabrication and Repair of Bridges
 Report # MATC-MU: 280 Final Report WBS: 25-1121-0003-280 Nondestructive Evaluation Tools to Improve the Inspection, Fabrication and Repair of Bridges Glenn Washer, Ph.D. Associate Professor Civil and Environmental
Advanced Ultrasonic Imaging for Automotive Spot Weld Quality Testing
 5th Pan American Conference for NDT 2-6 October 2011, Cancun, Mexico Advanced Ultrasonic Imaging for Automotive Spot Weld Quality Testing Alexey A. DENISOV 1, Roman Gr. MAEV 1, Johann ERLEWEIN 2, Holger
Hiding In Plain Sight. How Ultrasonics Can Help You Find the Smallest Bonded Wafer and Device Defects. A Sonix White Paper
 Hiding In Plain Sight How Ultrasonics Can Help You Find the Smallest Bonded Wafer and Device Defects A Sonix White Paper If You Can See It, You Can Solve It: Understanding Ultrasonic Inspection of Bonded
Ultrasonic Guided Wave Testing of Cylindrical Bars
 18th World Conference on Nondestructive Testing, 16-2 April 212, Durban, South Africa Ultrasonic Guided Wave Testing of Cylindrical Bars Masanari Shoji, Takashi Sawada NTT Energy and Environment Systems
Advances in Carbon Steel Weld Inspection using Tangential Eddy Current Array
 19 th World Conference on Non-Destructive Testing 2016 Advances in Carbon Steel Weld Inspection using Tangential Eddy Current Array Angelique RAUDE 1, Michael SIROIS 2, Hugo LEMIEUX 2, Joël CREPEAU 2 1
A. Extent of structural precast concrete work is shown on drawings and in schedules.
 SECTION 03 41 00 - STRUCTURAL PRECAST CONCRETE PART 1 GENERAL 1.1 RELATED DOCUMENTS A. Drawings and general provisions of Contract, including General and Supplementary Conditions and Division 1 specification
Attenuation-based Methodology for Condition Assessment of Concrete Bridge Decks using GPR
 The 32st International Symposium on Automation and Robotics in Construction and Mining (ISARC), June 15-18, 2015, Oulu, Finland. Attenuation-based Methodology for Condition Assessment of Concrete Bridge
Ultrasonic Guided Wave Applications
 Ultrasonic Guided Wave Applications Joseph L. Rose Penn State University April 29-30, 2013 2013 Center for Acoustics and Vibrations meeting What is a Guided Wave? (Guided wave requires boundary for propagation
Imaging System for Non-Destructive Testing of Glass Fibre Reinforced Plastics Martin NEZADAL 1,2, Jan SCHÜR 1, Lorenz-Peter SCHMIDT 1
 5th International Symposium on NDT in Aerospace, 13-15th November 2013, Singapore Imaging System for Non-Destructive Testing of Glass Fibre Reinforced Plastics Martin NEZADAL 1,2, Jan SCHÜR 1, Lorenz-Peter
FATIGUE CRACK DETECTION IN METALLIC MEMBERS USING SPECTRAL
 FATGUE CRACK DETECTON N METALLC MEMBERS USNG SPECTRAL ANAL YSS OF UL TRASONC RAYLEGH WAVES Udaya B. Halabe and Reynold Franklin West Virginia University Constructed Facilities Center Department of Civil
Texas Transportation Institute The Texas A&M University System College Station, Texas
 1. Report No. FHWA/TX-06/5-4577-01-1 4. Title and Subtitle PILOT IMPLEMENTATION OF PAVE-IR FOR DETECTING SEGREGATION IN HOT-MIX ASPHALT CONSTRUCTION 2. Government Accession No. 3. Recipient's Catalog No.
Emerging NDE Technology for Aging Aircraft
 Emerging NDE Technology for Aging Aircraft David G. Moore Richard L. Perry Sandia National Laboratories - Federal Aviation Administration Airworthiness Assurance NDI Validation Center Albuquerque, New
Easy Ultrasonic Phased Array Inspection of Corrosion - Resistant Alloys and Dissimilar Weld Materials
 Multimedia Application Notes Easy Ultrasonic Phased Array Inspection of Corrosion - Resistant Alloys and Dissimilar Weld Materials Many industries increasingly use austenitic welds and welds containing
A NEW APPROACH FOR THE ANALYSIS OF IMPACT-ECHO DATA
 A NEW APPROACH FOR THE ANALYSIS OF IMPACT-ECHO DATA John S. Popovics and Joseph L. Rose Department of Engineering Science and Mechanics The Pennsylvania State University University Park, PA 16802 INTRODUCTION
PS 1000 X-Scan Tips & Tricks. Quick Guide
 PS 1000 X-Scan Tips & Tricks Quick Guide en en QUICK GUIDE Tips & tricks 1. PS 1000 X-Scan Scanning on rough surfaces When the scanner is moved over a rough surface, the distance between the scanner and
RADAR INSPECTION OF CONCRETE, BRICK AND MASONRY STRUCTURES
 RADAR INSPECTION OF CONCRETE, BRICK AND MASONRY STRUCTURES C.P.Hobbs AEA Industrial Technology Materials and Manufacturing Division Nondestructive Testing Department Building 447 Harwell Laboratory Oxon
Multi-spectral acoustical imaging
 Multi-spectral acoustical imaging Kentaro NAKAMURA 1 ; Xinhua GUO 2 1 Tokyo Institute of Technology, Japan 2 University of Technology, China ABSTRACT Visualization of object through acoustic waves is generally
A Breakthrough in Sputtering Target Inspections: Ultra-High Speed Phased Array Scanning with Volume Focusing
 17th World Conference on Nondestructive Testing, 25-28 Oct 2008, Shanghai, China A Breakthrough in Sputtering Target Inspections: Ultra-High Speed Phased Array Scanning with Volume Focusing Dominique Braconnier,
Introduction To NDT. BY: Omid HEIDARY
 Introduction To NDT BY: Omid HEIDARY NDT Methods Penetrant Testing Magnetic Particle Testing Eddy Current Testing Ultrasonic Testing Radiographic Testing Acoustic Emission Infrared Testing Visual Testing
Fast, portable, user-friendly...the complete C-scan solution.
 Fast, portable, user-friendly......the complete C-scan solution. Designed for speed, portability, and performance, RapidScan2 has been developed as a versatile and user-friendly A, B and C-scan inspection
Pipeline Technology Conference 2010
 THRESHOLDS, ACCURACIES AND RESOLUTION: QUANTITATIVE MEASUREMENT AND ITS ADVANTAGES FOR METAL LOSS INSPECTION A. Barbian, M. Beller, A. Hugger, C. Jäger, A. Pfanger NDT Systems & Services Stutensee, Germany
FATIGUE CRACK CHARACTERIZATION IN CONDUCTING SHEETS BY NON
 FATIGUE CRACK CHARACTERIZATION IN CONDUCTING SHEETS BY NON CONTACT STIMULATION OF RESONANT MODES Buzz Wincheski, J.P. Fulton, and R. Todhunter Analytical Services and Materials 107 Research Drive Hampton,
HANDS ON EXPERIENCE WITH THE BROADBAND ELECTROMAGNETIC TOOL IN THE TRENCH
 The Northern California Pipe User s Group 22nd Annual Sharing Technologies Seminar www.norcalpug.com Berkeley, CA February 20, 2014 HANDS ON EXPERIENCE WITH THE BROADBAND ELECTROMAGNETIC TOOL IN THE TRENCH
Ultrasonic Phased Array Crack Detection Update
 Ultrasonic Phased Array Crack Detection Update By A. Hugger, D. Allen, I. Lachtchouk, P. Senf (GE Oil & Gas, PII Pipeline Solutions) and S. Falter (GE Inspection Technology Systems) 1 Abstract This paper
IMAGING OF DEFECTS IN CONCRETE COMPONENTS WITH NON-CONTACT ULTRASONIC TESTING W. Hillger, DLR and Ing. Büro Dr. Hillger, Braunschweig, Germany
 IMAGING OF DEFECTS IN CONCRETE COMPONENTS WITH NON-CONTACT ULTRASONIC TESTING W. Hillger, DLR and Ing. Büro Dr. Hillger, Braunschweig, Germany Abstract: The building industries require NDT- methods for