INSTRUCTION MANUAL: PHOTOGRAMMETRY AS A NON-CONTACT MEASUREMENT SYSTEM IN LARGE SCALE STRUCTURAL TESTING
|
|
|
- Charles Higgins
- 5 years ago
- Views:
Transcription
1 INSTRUCTION MANUAL: PHOTOGRAMMETRY AS A NON-CONTACT MEASUREMENT SYSTEM IN LARGE SCALE STRUCTURAL TESTING CEE 597 Summer Independent Study Deliverable Submitted: August 16, 2012 Anahid A. Behrouzi, Rui Li (REU Student) University of Illinois at Urbana-Champaign Faculty Advisor: Dr. Daniel A. Kuchma Abstract Photogrammetry is a non-contact measurement method that is being used in large scale structural experimentation to extract information about the overall geometry of the specimen as well as the XYZ motion of select points on the structure during testing. This is possible through the use of high-resolution still cameras that capture several photographs of the specimen and are processed using photogrammetric software. The following document will focus specifically on the application of PhotoModeler as the image post-processing tool. This instruction manual aims to provide guidance to researchers who would like to adopt photogrammetric techniques to acquire experimental test data, especially in cases where a high density grid of displacement measurements is desired at a relatively low cost. i
2 Table of Contents Abstract... i Chapter 1. Introduction to Photogrammetry Overview of Photogrammetry Benefits and Drawbacks of Photogrammetry Software and Equipment for Photogrammetry Introduction of Sample Photogrammetry Project C-Shaped Wall Experiment Photogrammetry Objectives with C-Shaped Wall Experiment...6 Chapter 2. Feasibility Evaluation for Photogrammetry Evaluating Experimental Objectives Evaluating Availability of Equipment Essential for Photogrammetry High-resolution Digital Cameras Photogrammetry Software Package Mount and Remote Triggering for Cameras Targets Evaluating Specimen and Laboratory Space Constraints for Photogrammetry Evaluating Time Constraints for Completing Trial Projects Summary for Feasibility Evaluation of Photogrammetry Chapter 3. Camera Calibration Introduction to Camera Calibration Selection of Camera Calibration Type Creating Camera Calibration Sheets Creating Single-Sheet Camera Calibration Sheets Creating Multi-Sheet Camera Calibration Sheets Photographing Camera Calibration Sheets Selection of Camera Parameters Selection of Location to take Calibration Photographs Set-up of Calibration Sheets at Location ii
3 3.4.4 Acquire set of Calibration Sheet Photographs Camera Calibration Project Single Sheet Calibration Procedure for Single Sheet Calibration in PhotoModeler Reviewing Report from Single Sheet Calibration Project Saving Camera Calibration Camera Calibration Project Multi-Sheet Calibration Procedure for Multi-Sheet Calibration in PhotoModeler Camera Calibration Project Field Calibration Chapter 4. Photogrammetric Project Setup Targets Selecting the Appropriate Target Type Procedure for Creating RAD Coded Target Estimating Target Size Determination of Target Position and Density Target Application to Test Specimen Chapter 5. Photogrammetric Project Setup Cameras Camera Parameters Definitions and Recommendations for Camera Parameters Determining Optimal Camera Parameters Camera Position Camera Field-of-View Angles between Cameras Distance Between Cameras and Targets External Light Source Synchronized Remote Camera Trigger System Chapter 6. Photogrammetric Project Setup Reference Target Group Function of Reference Target Group Creating and Positioning Reference Target Group Arrangement of Targets Stability Positioning Constructing Coordinate System Using Reference Targets Chapter 7. Photogrammetric Project Post-Processing iii
4 7.1 Procedure for Processing Automated Projects Multiple Cameras Evaluating Project Quality using PhotoModeler Report Error Residual Inspection of Project Quality Project Optimization High Residual Point Removal : Data Acquisition and Documentation References iv


5 Chapter 1. Introduction to Photogrammetry 1.1 Overview of Photogrammetry Photogrammetry is a method of extracting overall geometric properties of an object and 3D coordinates of specific points on its surface. This technique works on the principles of feature recognition and triangulation. The procedure involves obtaining several digital photographs of the object and processing these images through a photogrammetric software package. These programs first recognize the special features in images, then crossreference photographs to create relationships between corresponding features in different images, and finally solve spatial locations of each feature to obtain the geometry of the object. Photogrammetry can be applied in a wide range of fields to achieve a variety of objectives. It is an efficient method of acquiring the geometry of a structure where size or surface characteristics make it difficult to instrument with other traditional or noncontact measurement systems. Some examples may include projects to create 3D models of objects that include complex geometric features like irregular curved surfaces or cannot be touched because of preservation needs, such as historical architecture and crime or accident scenes (Figure 1.1a-d). (a) (b) (c) Figure 1.1: 3D Models generated using Photogrammetry (d) 1

6 1.2 Benefits and Drawbacks of Photogrammetry While photogrammetry can be traced back as far as the development of modern photography, this method has only just gained traction as a measurement technique for large-scale structural experimentation in recent years. More commonly researchers will choose other non-contact systems that employ electronic signal emission targets and a signal acceptor to gather data, which essentially provide the same functionality as photogrammetry. The objective of this section is to highlight the main items that need to be considered when deciding whether photogrammetry is viable as part of the instrumentation plan for an experiment. Specifically concerns with cost and availability of equipment as well as user knowledge are addressed. The use of photogrammetry is especially attractive when considering the cost of necessary equipment compared to that of a typical electronic positioning method such as the Nikon Metrology/Krypton unit shown in Figure 1.2. As a baseline, the Krypton system would require an initial investment of around $120,000 for the camera/controller to use as the signal receptor. This has a limited functioning range; the maximum coverage area is a rectangle 10 feet by 7 feet at a distance around 19 feet away from the camera (Braker, 2012). Also quite costly are the light-emitting diode (LED) targets used as signal emitters, which are around $150 each. If the project is large in scale, the complete set of equipment can be expensive because of the amount of cameras and targets required to achieve the desired coverage for collecting measurements. Figure 1.2: Nikon Metrology K-Series Optical Krypton System By contrast, the targets for photogrammetry are no more than cardstock printed with a special pattern, and the signal acceptors are ordinary high-resolution digital cameras with a fixed focal length lens, which cost around a thousand dollars each. As photogrammetry depends on triangulation it is required that printed targets or other special features that are being referenced appear in at least three photographs, so any experiment using fixed camera stations will require upwards of three cameras. At the same time the calculated coverage for a Nikon D90 type camera body with 20mm fixed lens is 15 feet by 10.5 feet at a distance 13 feet away from the camera 2
7 which will be able to cover much larger area than an individual Krypton camera. Of course, data cannot be derived from the images without the appropriate photogrammetry software. A program like PhotoModeler has an initial cost of $1145 and requires an additional yearly maintenance fee of $445 to install updates (PhotoModeler, 2012). Altogether, it is evident that the lower expense and greater availability of the equipment required for photogrammetry would make it a preferred option to other non-contact measurement methods. Furthermore, the Krypton camera field-of-vision is limited when compared to what can be achieved by current D-SLR camera models. Full coverage is critical in collecting measurements from large scale structural experiments, which can be achieved with relative ease using photogrammetry since the set-up is flexible. Though there are many advantages to photogrammetry, this method requires a considerable amount of experience and knowledge to acquire reliable data. In general, both the set-up and processing of raw images for photogrammetry entails much more involvement from the researcher than with the Krypton system. Using the Nikon Metrology technology, signal emission only requires attaching a LED target to the specimen and inserting its lead wire into the associated channel on a twenty-channel strober unit that connects to the camera controller. On the signal acceptor side, the camera needs to be powered and positioned so all the targets are visible within the field-of-view. The set-up process is relatively simple, though issues occasionally arise that require some level of expertise with the Krypton system. Primarily this occurs in projects with a large number of LED targets, upwards of one hundred, where powering the strober units becomes difficult due the volume of sensors that are connected. Though rare, complications have also been noted to occur with the functionality of the controller and camera that have necessitated outside service support. On the whole, photogrammetry involves a much more human component, and success is very much dependent on preparation and experience. For optimal results from this method, one must begin by processing numerous sets of trial photos of the test specimen using the photogrammetric software package prior to experimental testing. This is necessary as a preliminary step to determine the following items: optimal camera positions to achieve the desired coverage and provide best angles between images; appropriate camera settings, such as aperture as well as film and shutter speeds to take stable photos with sufficient contrast; locations for external light sources to improve the quality of images; and so forth. This is an iterative process, for a new user it generally takes weeks to months of training and preparation to successfully execute a photogrammetric project. Researchers are suggested to thoroughly consider this decision prior to choosing this method, alone or in conjunction with other non-contact measurement systems. It is also important to note that after the initial learning curve with using the photogrammetric technique the process becomes much easier. Also, results have 3
8 shown that measurement data collected from photogrammetry are quite accurate when compared with those from Krypton, an example comparing the XYZ displacement between the two measurement systems from the Coupled Wall test of the NEES Complex Walls Project can be seen Figure 1.3. Guidelines to help evaluate the viability of using Photogrammetry in a particular experiment will be discussed later in Chapter 2. (a) (b) (c) Figure 1.3: Comparison of Displacement Data between Krypton LED and Photogrammetry Target from Coupled Wall Test, (a) X-Direction, (b) Y-Direction, (c) Z-direction (Hart, 2012) 1.3 Software and Equipment for Photogrammetry There are several photogrammetric software packages available on the market, including iwitness, Imagemaster and may others. In this manual, instructions will be provided on how to complete a photogrammetric project by using PhotoModeler. Further details about this program can be accessed at the official website: The equipment needed to run a photogrammetry project includes D-SLR cameras with over 10 megapixels of resolution such as the Nikon D80/D90s. The resolution of cameras relates directly to the image quality, which affects the ability of PhotoModeler to successfully identify targets and geometric features of the object. In addition, the focus length of cameras cannot vary during the entire experimental test period, so fixed-focus lens are needed. There are other auxiliary items required for a photogrammetric project, including external light source(s), tripods or mounts to serve as camera stations, and a synchronized remote triggering system to have all cameras in the project capture photos at once. These items will be discussed in detail later in Chapter 5. 4
.")
9 1.4 Introduction of Sample Photogrammetry Project C-Shaped Wall Experiment As this manual is intended to provide guidance to researchers for setting up a large scale photogrammetric project, examples have been included from an ongoing experimental effort at the University of Illinois at Urbana-Champaign Multi-Axial Full-Scale Sub-Structured Testing and Simulations Facility (MUST-SIM). As part of the NEESR-SG: Seimsic Behavior, Analysis, and Design of Complex Wall Systems project, preparations are being made to test a reinforced concrete C-Shaped wall to better understand its performance under seismic conditions. The structural wall is a one-third scaled representation of the lower 3 floors of a 10-story building; the resulting dimension of the wall specimen is approximately 12 feet tall by 10 feet wide and has a flange at each end which is 4 feet wide, while the wall thickness is 6 inches throughout. During testing it will subject to cyclic displacements in the direction of the strong and weak axis, separately. At the same time a constant axial load and specified moment-to-shear ratio will be maintained at the top of the wall using the 6-DOF control available through the MUST-SIM Loading and Boundary Condition Boxes (LBCB). In addition to other forms of traditional and non-contact measurement instruments being used to monitor the deformation and damage of the specimen, photogrammetry will also be utilized to track the XYZ motion of the wall during testing. For this particular experiment, photogrammetry will be used on the web (large front face) and west flange (left side). The targets are laid out on the test specimen in a grid that is generally 9 inches by 11 inches which can be seen in Figure 1.4. Also, it should be noted that Krypton LEDs will be on the bottom 7 feet of the web (also visible in Figure 1.4) and the east flange, this grid is on a similar spacing to the photogrammetry targets to allow for comparison of displacement measurements in data post-processing. Figure 1.4: C-Shaped Wall Specimen 5

10 1.4.2 Photogrammetry Objectives with C-Shaped Wall Experiment As previously described, by utilizing photogrammetry one can acquire the position of special features on an object, which would be targets for this wall specimen. However, it is possible to go beyond merely measuring coordinates of these targets, and determine their displacement throughout the course of an experiment as well. To achieve this objective, images from an array of camera stations are taken of the specimen at each load step during the test. Batch processing the collected sets of images using photogrammetric software solves for the changing positions of points on the specimen, and from this displacement measurements can be extracted. Using this information, strain can also be calculated which enables researchers to develop strain contour maps, an example of which can be seen in Figure 1.5 from a previous test in the Complex Walls project. These provide similar strain field information from experimental results that one could generate through FEM modeling. Figure 1.5: Strain Contour Map using Photogrammetry (Hart, 2012) Another application of photogrammetry that will be utilized in the C-Shaped wall is to stitch together photos from the still cameras that capture different parts of the test specimen. Using the targets as references to establish relationships between the photos will allow for a relatively easy method to generate a larger combined image with complete coverage. The technique is especially useful as it will help with developing crack maps for the wall. An example of the final product of this procedure can be seen in Figure
11 Figure 1.5: Crack Map using Photogrammetry for Stitching (Hart, 2012) The manual will mostly focus on the first application described in this section, which is position and displacement measurement of points on the specimen. 7
12 Chapter 2. Feasibility Evaluation for Photogrammetry 2.1 Evaluating Experimental Objectives Before adopting any instrumentation method, careful consideration is necessary to evaluate the objectives of the experiment and decide what kind of data is ultimately desired. For the Complex Walls project, the goal is to gather comprehensive performance data for an improved understanding of earthquake response of modern walls as well as advance seismic design of these systems (Birley, 2012). Specifically the research team is interested in understanding the damage progression and final failure the walls experience. Therefore, a variety of instruments are used for collecting strain and displacement measurements, which is supplemented by digital photographs that capture concrete cracking and spalling. Specifically, the sensors used with the wall specimens have included: (1) Up to a hundred Linear Displacement Measurements; (2) Over 100 electrical resistance strain gauges to measure strain on the longitudinal, transverse, and stirrup reinforcement; (3) Nearly 20 two-inch long concrete surface strain gauges; (4) Over 150 small light-emitting diode targets attached to the wall surface where their XYZ coordinates were measured using the Nikon Metrology/Krypton Dynamic Measurement Machine; (5) Between Photogrammetric targets; and (6) Up to 14 high-resolution images taken at each of the steps in the loading protocol (Kuchma, 2012). This wide selection of instruments enables the researchers high-density data collection; additionally, it provides redundancy between measurements to verify that results from the various sources are accurate. While it is the combination of all these sensor types that provides a holistic understanding of a specimen s behavior during the experiment, the non-contact measurement methods, such as Krypton and photogrammetry, have a particularly vital contribution. These target based systems are set up on a uniform grid and can collect XYZ displacement data at hundreds of points to describe the 3D motion of a structure. This would otherwise require three different linear displacement sensors at each target s node. From the collected XYZ displacement data, strain can be calculated to produce strain contour maps for the experimental specimen, similar to those generated by FEM modeling software. In these capabilities, the Krypton and photogrammetry methods are mutually complementary. However, these two systems do have different strengths. Analyses of displacement data from previous wall tests indicate that the Krypton system is not as accurate in out-of-plane (y-direction) measurements as photogrammetry. On the other hand, the Krypton has a higher degree of accuracy than photogrammetry in measuring in-plane (x-z plane) displacements (Hart, 2012). Figure 2.1 shows the coordinate system that is used to describe the C-Shaped Wall test specimen. Since the upcoming C-Shaped Wall test is 8

13 anticipated to have three-dimensional movement, as loading is in both the strong and weak axis directions of the wall, photogrammetry will be beneficial in the instrumentation plan for this experiment. Figure 2.1: C-Shaped Wall Coordinate System 2.2 Evaluating Availability of Equipment Essential for Photogrammetry If researchers have evaluated their experimental project and concluded that photogrammetry will enable them to meet their needs, then the equipment required to use photogrammetry will have to be acquired. This list details the necessary items: High-resolution Digital Cameras Most high-resolution D-SLR cameras currently on the market typically have more than 15 megapixels resolution; the Nikon D90 used in the C-Shaped Wall sample project has 12.3 megapixels and this has proven to be a sufficient level of resolution. The quantity of cameras required for photogrammetry varies based on a number of experiment specific factors which will be discussed in further depth in Sections As mentioned previously, any project will need at least three still cameras in order to obtain the photographs necessary for the photogrammetry software to triangulate the position of special features or targets on an object Photogrammetry Software Package To extract three-dimensional coordinate data from digital photographs taken of a test specimen it is necessary to purchase a software package expressly designed for photogrammetry. It must be able to recognize the special 9


14 features or targets in the photos, cross-reference and create relationships between photos, and ultimately calculate the position of each of the features or points of interest. In this manual, the software that is being described is Eos PhotoModeler Mount and Remote Triggering for Cameras For the particular purpose of tracking specimen displacement during a test, it is of utmost importance that the cameras remain in the same position throughout the entire experiment. This is critical because displacement is determined by comparing positions of points in successive steps. To ensure this, cameras need to be mounted on fixed frames as shown in Figure 2.2, or less preferably one can use tripods that have been cordoned off and taped to the floor. The goal is that there is no physical contact with the cameras during the test that would cause the angle or location to change. This requires stable camera mounts and a synchronized remote triggering mechanism to remove any possibility of outside interference. Figure 2.2(a): Mounts used for Still Cameras Figure 2.2(b) Mount fixed to column in test set-up Targets Though photogrammetry software is capable of producing 3D models of objects by geometric feature recognition, the accuracy of the project is much less than those that have uniquely coded targets on the object for the software to identify. Also, in the case of the sample C-Shaped Wall project, feature recognition would not be possible to track interior points on the specimen as it has few defining features and little variation in texture. At best it would only be useful in defining the overall specimen geometry. With most structural tests researchers are interested in the precise displacement of points on the test specimen instead of a general sense of the global deformation. For this reason, targets are used in majority of the experiments. Unlike the delicate and expensive LED targets used for Krypton, photogrammetry targets are relatively small rectangles of cardstock with special patterns on them, as shown in Figure 2.3. To have a better understanding of size, it is worth noting that the targets in the image were used in the C-Shaped Wall project and are 2 ¾ inches by 3 inches. In PhotoModeler 10

15 there are six different kinds of targets: RAD Coded, RAD dot, dots, and 8, 10, 12 bit Coded. A more detailed explanation of how to select target type and size are included in Section 4.1. Figure 2.3: RAD Coded Targets used for C-Shaped Wall Project 2.3 Evaluating Specimen and Laboratory Space Constraints for Photogrammetry Usually a large scale structural experiment will include multiple data acquisition methods. This is largely because researchers are interested in capturing a variety of measurements, including but not limited to displacement, strain, and rotation. Furthermore, the ability to compare similar data types recorded by different sources allows for verification of the collected values and serves to increase the accuracy of the entire data set. Despite the benefits of including a variety of measurement systems in an experiment s instrumentation plan, it does create limitations: the sensors and associated equipment can occupy considerable space both on the physical specimen and within the laboratory. To coordinate photogrammetry with other methods, one needs to consider the space that will be available once the other instrumentation is in place. On the specimen, targets should be positioned so that they do not block any of the LED sensors if a non-contact system similar to Krypton is being employed, and conversely none of the LED lead wires should cross the photogrammetry targets. Potential interference between photogrammetry and Krypton type systems are illustrated in Figure 2.4. Another concern with the placement of the targets is the surface area of the specimen that is being covered. Crack mapping is commonly used in structural experiments involving reinforced concrete as it serves as an important visual indicator of the stresses that a specimen is experiencing. Targets that are too large or placed at too dense of a grid would limit the amount of crack tracing that can be done during a test, which means valuable information cannot be captured photographically. It is important to note that each coded target used for a photogrammetry project is similar to a barcode label, there can be no lead wires or crack tracings crossing them; any extraneous information creates complications when the photogrammetric software 11

16 is attempting to identify the targets. This also means no other instruments or components of the test set-up can interfere with the view of the specimen s targets from the camera stations. Figure 2.4: Photogrammetry Target Placement when using other Non-Contact Measurement Systems Aside from space on the physical specimen, there are constraints within the laboratory setting. There must be sufficient space to position the camera stations. As stated previously a high-resolution D-SLR such as the Nikon D90 achieves a maximum coverage area of 15 feet by 10.5 feet at 13 feet away from the camera. It is important to be able to place the camera stations far enough away from the specimen to capture the largest possible area without sacrificing the ability to clearly distinguish the targets. In a large lab with strong wall/floor it may not be that difficult to set up fixed columns or brackets with mounts attached to achieve this as illustrated earlier in Figure 2.2, in smaller labs the room available for camera stations may serve as a limiting factor to using photogrammetry. Not only is space a concern, but also interference of photogrammetry set-up with other instrumentation systems being used for the experiment. For example, one of the challenges in the C-Shaped Wall sample project is the fact that the Krypton camera will be located at a distance farther from the specimen than the columns intended for the camera stations. Special care in planning was required to ensure that the photogrammetry cameras, mounts, and columns did not block the Krypton field-of-view. This was achieved by developing preliminary 3D AutoCAD drawings to visualize the location and field-of-view of the Krypton camera, which is illustrated in Figure 2.5. Also, by visualizing all the digital camera volumes the researcher can check the overlap and see if each target can be captured by at least three cameras, as demonstrated in Figure 2.6. The motivation behind camera field-of-view overlap will be discussed in Section On the whole, a successful photogrammetry project requires careful preparation to work in conjunction with various other sensor systems on a large-scale experiment. 12


17 (a) (b) Figure 2.5: 3D AutoCAD Drawing with Krypton Volumes, (a) Perspective and (b) Top Views Figure 2.6: 3D AutoCAD Drawing with Still Camera Volumes 2.4 Evaluating Time Constraints for Completing Trial Projects It is absolutely essential that researchers new to photogrammetry plan time in their test preparation schedule to complete trial projects using this technique. The recommended start time would be at least several weeks, but preferably 1-2 months, prior to testing. The photogrammetry method requires the users to have considerable amount of experience in order to obtain optimal results. Trial projects should resemble the real project for the actual experiment, except key parameters, like target density, target size, camera position, camera settings and 13
18 so forth are not determined and need to be adjusted according to the results of trial projects. As stated earlier, photogrammetry is an iterative process where the user collects sample sets of photographs of the specimen, processes them using software, and examines the outcome to make improvements to the quality of their project. In addition to helping the researcher prepare for the experiment by determining the key parameters, trial projects are useful for gaining familiarity with the selected photogrammetry software and learning to solve problems at this stage rather than when post-processing images from the actual test. The following document is primarily based on trial projects carried out in preparation for the C-Shaped Wall test described earlier in Section 1.4. While the examples that follow are not from the actual experiment, as testing is scheduled for Fall 2012, the software, camera and targets used are essentially the same. In executing the trial projects, the research team working on the C-Shaped Wall test was able successfully determine the optimal setting for the experiment s photogrammetry project. Therefore, it is strongly recommended to go through various trial projects before making any final decisions on the settings and key parameters that will be used in the photogrammetry project for the experiment. 2.5 Summary for Feasibility Evaluation of Photogrammetry After fully evaluating whether photogrammetry meets the measurement needs of a structural experiment, that materials can be acquired, and that there is sufficient space for instrumenting as well as time for trial projects, it is time to learn how to actually create and process a project. This discussion will comprise the rest of this manual. 14
19 Chapter 3. Camera Calibration 3.1 Introduction to Camera Calibration The first step for a photogrammetry project is camera calibration. Before PhotoModeler can process any photos it needs information to describe the cameras that are being used to take the images. To do that requires creating a Calibration Sheet in PhotoModeler and taking photographs of those sheet(s) with the cameras that will be utilized for the project. These images will be used to run a Calibration Project in PhotoModeler so the software can obtain the camera parameters, including focus length, aperture, shutter speed, ISO, white balance and image resolution. There are slight differences between cameras even if they appear to have the same parameters. It is important to take the time to complete the camera calibration step for each camera body/lens combination that will be utilized in the photogrammetry project, because correct camera parameters are critical for PhotoModeler to get accurate results. 3.2 Selection of Camera Calibration Type There are two basic and one advanced type of camera calibration. The two basic types are Single Sheet Calibration (SSC) and Multi-sheet Calibration (MSC), which will be based on the photos of the calibration sheet(s) taken by the camera that needs to be calibrated. The advanced type is Field Calibration (FC) and will be based on a set of pictures of the actual test specimen instrumented with targets. The former will allow PhotoModeler to determine camera parameters, and the latter is used to refine the basic calibration by providing additional information specific to the condition of the specimen, such as lighting and scale. Selection between two basic calibration types is based upon the scale of the experiment. SSC is preferable when the object is relatively small, like a small scale model wall or column where all dimensions are less than 5 feet. Otherwise, MSC would be a better choice in the case of testing a relatively large structure, like the 1:3 scale three-story C-shaped wall in the example project. 3.3 Creating Camera Calibration Sheets Camera Calibration Sheet(s) are required to run a calibration project. These are no more than ordinary 8.5 x11 sheets of paper printed with a special pattern that PhotoModeler can recognize. 15
.")

20 3.3.1 Creating Single-Sheet Camera Calibration Sheets Open PhotoModeler, and open File on the upper left corner and select Print Calibration Sheet(s). A window will appear to select between Multi-Sheet Calibration and Single Sheet Calibration. Select Single Sheet Calibration, and the type Small Sheet. Select Print and the print window will appear just as printing ordinary documents. 16


21 Note: Selecting Large Sheet is an option if there is a printer capable of printing 36 x36 size sheet. This may be preferable since the targets will be able to cover a greater amount of the image area in the photos, further discussion of this topic can be found in Section 3.4. When attempting to print the file the following error may occur: To resolve this problem check whether the file named PhotoModelerCalibrationGrid.pdf is available in the directory mentioned (C:\ProgramFiles\x86\PhotoModeler Application). This error may appear even if the file is not missing in the directory, but if Adobe Reader is outdated on the computer. If this problem is encountered, check that the file is in the directory and whether the computer has the most updated PDF reader. 17

22 3.3.2 Creating Multi-Sheet Camera Calibration Sheets Select Multi-sheet Calibration in the Print Calibration Sheets window. PhotoModeler will then prompt the user for an input diameter of the inner target, sheet size and number of sheets. The inner target diameter should be approximately the same for the target that will used in the actual test. Starting with a value between 9-14mm is best, in the sample below 12mm has been selected. However, rather than arbitrarily assigning a inner target diameter, it is probably best to use the Estimate option. This function is described in detail in later Section The inner target diameter size may vary after experimenting with various options through the trial projects. The C-Shaped Wall trial project calibrations suggest that an inner target diameter of 10mm in calibration and 13mm for the actual test will work. The recommended sheet size is A4. For the multi-sheet calibration print 9 sheets to arrange in a 3x3 matrix. After printing the Calibration Sheet(s), it is time to take a set of photos of the sheet(s) with the camera that needs to be calibrated. 3.4 Photographing Camera Calibration Sheets To take the set of photos needed to run a camera calibration project, some preparations are required to provide the adequate lighting and background conditions as well as to determine camera positions. The procedure can be broken down into four parts: (1) Choose camera parameters; (2) Select a location to take calibration photos; (3) Set-up of calibration sheet(s) at location; and (4) Acquire set of calibration photos. 18
23 3.4.1 Selection of Camera Parameters As introduced in Section 3.1, camera parameters consist of key settings which play a critical role in photograph quality. Before starting a calibration project, the camera parameters must be decided according to those desired for the actual experiment and kept unchanged when taking photos of calibration sheet(s). The easiest way to get the initial setting to start calibration for the trial project is to adjust the camera parameters until you have a well-lighted, clear and stable photo of the test specimen, like the one shown in Figure 3.1 for the C- Shaped Wall sample project. The initial camera parameters used for this trial project were ISO 200, Aperture F11, Whitebalance auto, and Shutterspeed 1/2.5 second. Figure 3.1: C-Shaped Wall Photo with Initial Camera Parameters After determining the initial camera parameters, these settings can be used to take a complete set of photos to use in a trial calibration project (as described in Section ). The settings will be modified again based upon how well PhotoModeler is able to run a project using these photos. The successfulness of a project can be determined by examining data quality information that includes missing points, error, and residuals; a full discussion of assessing data quality can be found in Section 7.2. Camera calibration, like any step in executing a trial project, is an iterative process. If the image quality is still insufficient based on the data quality indicators in PhotoModeler, then camera parameters need to be modified and camera calibration will have to be repeated until the quality is suitable. Even if good camera parameters have been found for the calibration project, one 19

24 may discover they are not ideal for the taking pictures of the test specimen. It is through trial projects that the optimal camera settings can be determined, then the cameras will have to be recalibrated again. While this process may seem repetitive, the effort required for this is well worth it, as it insures that PhotoModeler will produce accurate data when running the actual test project Selection of Location to take Calibration Photographs Once the camera parameters are decided, it is necessary to find a place to set up calibration sheets and take photos. The ideal place should meet the following criteria: Sufficient Space around Calibration Sheets The location chosen to take the calibration images needs to provide enough room not only for the calibration sheet(s) but also the photographer and their tripod. The additional space required for this is about another four feet from the edge of the sheet(s), as shown in Figure 3.2. Figure 3.2: Location with Sufficient Space for Photographing Calibration Sheets 20
. Figure 3.3: Sufficient Illumination of Calibration Sheets 3.4.2.")
25 Sufficient Illumination of Calibration Sheets Based on calibration attempts for the C-Shaped Wall sample project, an image with the lighting that provides the brightness shown in Figure 3.3 is sufficient (slightly brighter is also acceptable). Figure 3.3: Sufficient Illumination of Calibration Sheets Free from disturbance of wind and passerbys The position of the calibration sheets must be stationary throughout the proccess of taking calibration photos. Even a slight draft may cause them to move, which would impair the accuracy of the calibration project. The same principle applies to passerbys since they may accidently affect the position of the calibration sheets. A good solution would be to tape the calibration sheets to the ground to prevent movement. If you choose not to do so, it is important to move slowly around the sheet while taking photos. This may seem an insignificant concern, but maintaining the targets in the same location when taking the photographs is critical to the calibration process. 21

26 3.4.3 Set-up of Calibration Sheets at Location Set-up of Calibration Sheets for Single-Sheet Calibration Project As the name suggests, there is only one calibration sheet in Single Sheet Calibration Project. The sheet can be 8.5 x11 or 36 x36 in size; if the 8.5 x11 option is chosen it may be necessary to attach it to a backing board depending on the location that has been selected to take the calibration photographs. If the location has a dark or textured background, like the carpet seen at the edges of Figure 3.4, it is suggested to tape the sheet onto a large white poster board to provide better contrast between targets on the sheet and the background. This allows PhotoModeler to identify the targets more easily, and avoids the issue of mistakenly recognizing some of the textured pattern in the carpet as other targets. Being careful to use a background free of extraneous information is important for the quality of camera calibration. Figure 3.4: Single Calibration Set-up Set-up of Calibration Sheets for Multi-Sheet Calibration Project For Multi-Sheet Calibration, nine calibration sheets are being used. PhotoModeler prefers the targets to cover around 80% of the image area for a more successful calibration project, to achieve this it is best to arrange sheets into a square 3x3 matrix, as shown in Figure


 while the sheet(s) remain in a stationary position during the entire process.")
27 Figure 3.5: Multi-Sheet Calibration Set-up It is not necessary to line them up perfectly; the photo set should be fine provided the camera can capture every target from each of the necessary camera positions described in Section Acquire set of Calibration Sheet Photographs In acquiring a set of calibration sheet photographs, the principle is to take photos in two different camera orientations -landscape and profile - shown in Figure 3.6 from four different locations around the sheet(s) while the sheet(s) remain in a stationary position during the entire process. Therefore, the entire photo set from one camera for a single or multi-sheet calibration should include 8 photos. (a) Figure 3.6: Camera Orientations (a) Landscape, (b) Profile (b) 23


28 Acquiring Photographs for Single- Sheet Calibration SSC Calibration Sheet (with background) 4 Figure 3.7: Camera Positions for Single Sheet Calibration Photos The distance from the calibration sheet and height of camera at position 2, 3, 4 are the same as shown in position 1; this also applies to Figure 3.8. After taking four photos in landscape orientation, take another set of photos in the same positions using profile orientation. This yields the eight-photo set for a calibration project Acquiring Photographs for Single- Sheet Calibration The 3x3 matrix of calibration sheets for Multi-Sheet Calibration has a considerably larger size and requires the camera position to be further away so that all targets fall within the image. The positions of cameras are shown in Figure MSC Calibration Sheet 4 Figure 3.8: Camera Positions for Multi-Sheet Calibration Photos 24
29 3.5 Camera Calibration Project Single Sheet Calibration As mentioned in Section 3.2, the Single Sheet Calibration (SSC) method is most commonly used for small scale projects. The target type on the SSC calibration sheet is dot and 8-bit coded while the MSC sheets have a RAD Coded target which are better suited for large scale applications. Therefore the calibration type that is selected is dependent on the scale of the actual project. While this section contains an overview on how to complete a SSC there are also tutorial videos available online at under the titles Calibration Single Sheet 1 & Procedure for Single Sheet Calibration in PhotoModeler Open PhotoModeler, and click File Getting Started (though usually the Getting Started window will be appear automatically when initializing the PhotoModeler program). Then, select Camera Calibration Project. 25


30 The window of New Project Wizard will appear and prompt the user to add photos of calibration sheet that have been taken with the camera that is being calibrated. Click Add Photos Next, navigate to the directories to find the location where the calibration photos taken during Section 3.4 have been saved. Select all 8 images and click Open. 26


31 After that, the photos will show up in the New Project Wizard. Double-check if these are the correct images for the Single Sheet Calibration and click Next. The Automated Camera Calibrator window will appear, select Single sheet Calibration and click Run. 27

32 PhotoModeler will process the photos and show the statistics relating to the photogrammetry solution in realtime. Further explanation of project processing and statistics will be included later in Chapter 7. After the processing finishes, PhotoModeler will go back to the Automated Camera Calibrator window. Select Show Report to view project accuracy. Also, the maximum residual will be shown at bottom right corner. 28

33 In addition, notice the small camera Icon on the top right corner of the image thumbnails after processing is complete. The icon indicates PhotoModeler has successfully oriented this image with the others in the photo set and thus the information it contains is contributing to the project. If the thumbnail images have a red cross in the corner instead, which means the software failed when trying to orient the photo and the image will not be included in the project. In this case it is necessary to retake the photo with a different camera setting or light source until all the images can be oriented and included in the project Reviewing Report from Single Sheet Calibration Project If all the images have been successfully oriented, then continue on to check the Project Status Report. The first item to check is Problems and Suggestions section. The red text shows a common issue that arises in camera calibration: percentage of the image area that contains targets. It is actually quite difficult to reach the recommended 80% target coverage and good calibration results are possible with only 43% coverage as shown in the sample calibration report below. Therefore, it is not an absolute necessity to meet this criterion. Refer to the Photo Package to view the calibration photos that are associated with this sample calibration project. 29


34 The other two values to check are Total Error and Quality Point Marking Residuals. A maximum error under 5.0 and maximum residuals under 1.0 indicate good results. Refer to Section 7.2 for details on project reports. Close the Project Status Report and click Close on the Automated Camera Calibrator window Saving Camera Calibration At this stage, if there were significant problems with the calibration, or the maximum error and residual are higher than the recommended threshold values then select No-Cancel when prompted by PhotoModeler 30


35 about whether to add the camera to library. The calibration should be attempted again, likely with new camera parameters as described in Section 3.4. If the calibration was successful, then name the camera that was just calibrated and record this camera into the camera library. It is important to name cameras in a logical fashion to keep things organized. The SSC calibration project is now finished, repeat if there are more cameras to calibrate. The camera information can also be saved as a.pmr or.cam file in a directory by clicking Save Project. It helps to keep record of multiple cameras, and will be needed when camera library cannot be used, as in Section

36 3.6 Camera Calibration Project Multi-Sheet Calibration Compared with the Single Sheet Calibration (SSC), the Multi-Sheet Calibration (MSC) project is more oriented towards large scale experiments since the targets on the MSC sheets are of the RAD Coded type. In PhotoModeler the user can create up to 999 unique RAD Coded targets, an ample quantity to cover large specimen (the C-Shaped Walls sample project uses over 250 targets). If the experimental project requires RAD Coded targets and high accuracy position data, MSC would be the preferred method to calibrate cameras. While this section contains an overview on how to complete a MSC there are also tutorial videos available online at under the title Calibration Multi-sheet Procedure for Multi-Sheet Calibration in PhotoModeler The procedure for a MSC project is essentially the same as the Single Sheet Calibration one, except one must add the calibration photos taken of the multi-sheet setup and choose Multi-Sheet Calibration instead of Single Sheet Calibration in the Automated Calibration Project window. Refer to Section that describes how to run the SSC project, since the first steps necessary for the MSC method are the same. 32


37 Choose photos taken for Multi-Sheet Calibration, click Open. Click Next when all the photos have been loaded. 33
38 Select Multi-Sheet Calibration, and click Run. The rest of MSC project is essentially the same as that for SSC. Please refer to Sections on how to read the calibration project report and save the camera calibration. The images for this sample calibration project can be viewed in accompanying Photo Package. 3.7 Camera Calibration Project Field Calibration Field Calibration (FC) is a part of an Automated Project that allows the user to refine the camera parameters already saved in the camera library from one of the basic camera calibration methods single or multi-sheet as described in Sections 3.6 and 3.7. FC is done using several images of the specimen in the laboratory environment under conditions that would be present during the actual experiment. A set of photos taken of the C-Shaped Wall sample project are used to demonstrate the steps required for field calibration; Figure 3.9 is just one of the photos in the image set. 34

39 Figure 3.9: Field Calibration Sample Image The complete set of images used for this procedure is available in the accompanying Photo Package; the camera positions for the sample field calibration are shown in Figure Figure 3.10: 3D AutoCAD Drawing for Field Calibration Camera Positions Unlike the Single or Multiple Sheet Calibration, Field Calibration does not use a pre-printed calibration sheet. Instead, photographs are taken of the test specimen (covered with some grid of targets) using the cameras that need to be calibrated. The primary objective of FC is to be able to take into account things like lighting, distance between specimen (targets) and camera, field-of-view and so forth. It is important to note that to carry out a field calibration the images have to first successfully run as an automated project. While the following section contains an overview on how to complete a FC project there are also tutorial videos available online at under the title Field Calibration. 35

40 3.7.1 Procedure for Field Calibration in PhotoModeler (also, Automated Project with Single Camera) The following section describes how to execute a field calibration project. First, one must go through the steps required to run an automated project and once this is completed successfully, a field calibration can be completed. The description of how to run an automated project will not be repeated later in this manual. First, open PhotoModeler and select Automated Project in the Getting Started window. Next, select RAD Coded Target Auto-project, and click Next. 36


41 Then, the New Project Wizard window will appear and prompt the user to input photos. Click Add Photos. Navigate to the directory where the images of the specimen for the automated project, click Open. 37


42 Once the images have been successfully uploaded, click Next. Now PhotoModeler will ask which camera should be used with the automated project, in the case when executing a field calibration select the camera that is being calibrated. Then, click OK ; on the next window that appears click Run. The software will then process the images as a normal automated project; Chapter 7 provides more information on how to open and view the photos. Once PhotoModeler finishes processing, select Project Process. Next, click the plus sign to expand Optimize section; then toggle Include Camera Optimization. For this sample the current maximum residual is However, there many times when the Include Camera Optimization option will appear ghosted and cannot be selected. This means the quality of image set is not sufficient and the camera layout needs to be changed until the field calibration option becomes available. Usually this occurs 38


43 because too few targets being successfully captured in each image or the camera angles between images are too small. Try capturing more targets in each image and getting a larger angle between camera orientations. [Field Calib.] will be shown on the option after the box has been toggled. Click Process. 39


44 After the software finishes processing, a window will appear if the optimization is successful. Notice the maximum Residual has decreased from 0.75 to 0.27, indicating the quality of project is improved. Click OK if to finish the Field Calibration project, or Show Report to check other quality statistics of the project. The final step is to name the calibrated camera file and add it to the Camera Library. It is suggested to replace SSC or MSC calibrated camera files with the Field Calibrated ones for more accurate results when using the camera calibration to run trial or actual photogrammetry projects for the experimental specimen. 40

45 Chapter 4. Photogrammetric Project Setup Targets 4.1 Selecting the Appropriate Target Type There are six different types of targets available in PhotoModeler : RAD Coded, RAD Dot, dot, 8, 10 and 12-Bit Coded. The dot type consists of uniform black dots; there is no way to distinguish between one target and the next. The RAD Dot type consists of black dots and several larger targets with unique patterns which can be seen in Figure 3.4 on the SSC sheet; this type is mostly used in dense point 3D modeling for small objects. Both RAD Coded and 8/10/12-Bit Coded targets have unique patterns on each individual target; the major difference is the maximum number of unique patterns that can be created for a target type. The target type used in the C-Shaped Wall sample project is RAD Coded because it provides the greatest number of unique patterns compared to the other types (999 different targets), while 12-bit Coded, with the second most number of unique patterns has only 161 distinct targets. In a large-scale project, it is likely that the number of targets will be great in order to have a relatively dense grid of targets over a massive specimen; the C-Shaped Wall project required more than 250 targets. Therefore, it is recommended to use RAD Coded targets in a large-scale structural experiment. 4.2 Procedure for Creating RAD Coded Target First, open PhotoModeler, click File Create Coded Targets 41

46 Then, select the target type needed for the project in the Create Coded Targets window. For this sample, the RAD Coded target type will be used Estimating Target Size The user is prompted in the Create Coded Targets window to input parameters relating to the target size, including inner target diameter (the size of the center dot in the RAD Coded target) and the percentage of white space around the outer ring of the target that provides a contrasting background. The most efficient way to determine what these size values should be is by using the estimation feature Estimating Inner Target Diameter Click Estimate to calculate the inner target diameter appropriate for a project. This requires a calibrated camera file which is mentioned in Section 3.5.3, and a measurement for the largest distance between camera and targets in the test project. 42


47 Click Browse and find the camera file to use, click Open. 43

48 After loading the camera file, enter the largest distance of the camera to target. Note that this is the largest distance, not horizontal distance; with simple trigonometry this value can be determined. As shown in Figure 4.1, the distances 8 feet horizontal and 6 feet vertical can be measured directly, while the maximum camera-to-target distance of 10 feet can be calculated. 6 feet 10 feet 8 feet Figure 4.1: Calculating Maximum Camera-to-Target Distance 44

49 Determining White Space for Border Next, enter Percentage of diameter to use as border. This value is to decide how much white space will be left around each target. More white space will increase the contrast between target pattern and background; this is useful when PhotoModeler is attempting to distinguish the individual targets. At the same time, increasing the white space may make the overall target larger than desired. As previously mentioned in Section 2.3, it is necessary to be careful in determining target size and density on the specimen, since the more the surface area that is covered the less crack tracing can be done during testing. For the C-Shaped Wall sample project, 15% white space was selected; the white-black contrast this provides was acceptable due to the fact that the wall specimen had been whitewashed so this also provides white-space. The pre-set value for the border in the Create Coded Targets window is 30%, it is important to try printing off targets with varying amounts of white space and take sample images to determine which yields the optimal performance for the trial project. 45


, so it is necessary to cut the targets out to be like those in Figure 4.2(b).")
50 After determining percentage of diameter to use as border, click Print. The window of print setup will appear as it would when printing ordinary word documents. It is suggested to print the final targets on cardstock to prevent bending of the target as folds decrease the ability for PhotoModeler to recognize targets correctly. Multiple targets will print on an individual sheet as shown in Figure 4.2(a), so it is necessary to cut the targets out to be like those in Figure 4.2(b). (a) (b) Figure 4.2: RAD Coded Photogrammetry Targets (a) Sheets, (b) Individually 46
51 4.3 Determination of Target Position and Density Photogrammetry can be a reliable non-contact measurement technique, but usually a large scale test will employ multiple instrumentation methods at the same time so it is necessary to consider how these may interact or interfere. Some challenges with this were previously mentioned in Section 2.3, one of the major issues of having photogrammetry targets in a high-density grid is the limitations on crack tracing during the experiment. To get a general impression of how dense the target placement should be on the specimen, it is helpful to use a drafting program like AutoCAD to produce a drawing. An example from the C-Shaped Wall sample project is shown in Figure 4.3. It should be noted that the dimensions of the targets used in the diagram match the 2.75 x3 selection that resulted from selecting the RAD Coded type with an inner target diameter of 12mm and outer border of 15% white space. When developing this drawing it was necessary to take into account various items: (1) That the photogrammetry target grid nearly matched the density of the Krypton LED (shown as red markers) so that strains and displacements at the nodes could be compared between the two non-contact instrumentation methods. (2) That the targets did not cover too much of the specimen s surface area and therefore impede the ability of researchers to mark developing cracks and take photographs to document cracking and spalling. (3) That targets are not blocking one another when images are taken at an angle, which occurred at the corner between the west flange and web as illustrated in Figure 4.4. This was resolved by offsetting the rightmost column of photogrammetry targets on the flange to the left. (4) Avoiding interference from other instruments, such as the linear potentiometers that are placed along the front of the west flange, another reason for offsetting the rightmost column to the left. Also, if a particular region of the specimen is more likely to fail and researchers are interested in having a better understanding of displacement or strain behavior at these locations, it is recommended to increase target density in those areas. The process of developing multiple AutoCAD drawings with varying target densities to make a final decision is extremely helpful, and far less time consuming than printing out targets and physically trying different options on the physical specimen. 47

 4: Angled Photograph results")
52 Figure 4.3: C-Shaped Wall AutoCAD Target Drawing (Left: West Flange, Right: Web) Figure 4.4: Angled Photograph results in Overlapping Targets 48


53 4.4 Target Application to Test Specimen Before permanently affixing targets to the specimen, it is recommended that one use low-weight paper to print draft targets and tape these in the intended grid, refer to Section 4.2 on how to create RAD Coded targets. Trial projects using PhotoModeler should be run to verify that the location of the targets is appropriate based on other instrumentation, camera stations, etc. Once photographs of the target density can successfully run as a trial project the target plan can be finalized. At this point the better quality cardstock targets can be produced, and the target application procedure can begin. A convenient way of doing it is to use AutoCAD drawing as reference, and use chalk line to mark a grid on the specimen as illustrated in Figure 4.5. Figure 4.5(a): Chalk Line Device Figure 4.5(a): Grid Chalk Line for Application of Photogrammetry Targets When the grid is marked on the wall, proceed to attach them on the grid that has been marked. In this it important to note that the RAD Coded targets created in PhotoModeler have crosshairs that indicate the 49

54 vertical and horizontal midpoints of the target. So the AutoCAD drawing can be dimensioned to show center-tocenter spacing of the target and this can be easily replicated on the physical specimen. When using the cardstock targets, apply thermal glue on the back of the target and position them on the specimen; the method of applying adhesive to the target is shown in Figure 4.6. It is important not to use too much glue on the target as this may cause rippling of the target surface; also, it is important to keep the glue at the center, directly behind the inner target diameter to decrease the chance that the target will be ripped into two when crack develops beneath it. As it can be assumed, the target is no longer able to provide valid displacement data after this point. Figure 4.6: Applying Adhesive to Targets 50

55 Chapter 5. Photogrammetric Project Setup Cameras 5.1 Camera Parameters Camera parameters can be defined as all the values selected for camera settings. The following section provides a detailed discussion of the most important camera parameters: aperture, ISO, shutter speed and image resolution. The objective is to explain how modifying these variables influence image quality, which in turn impacts the success of a photogrammetric project using PhotoModeler Definitions and Recommendations for Camera Parameters Aperture In photography, aperture refers to the size of the opening in the lens that light travels through, and this is designated by an F-number. The aperture setting effects how much light and the angle at which the light rays reach the image sensor, which changes the sharpness of the photograph. Small F-numbers like F4.5 indicate that the aperture is wide and therefore the only portions of the image that will appear sharp are objects located at the focus distance. This is illustrated in Figure 5.1(a) where the targets, in the focus range at the left of the photograph, appear clear and become more blurry towards the right. Contrast this with a large value like F22 which means the aperture is narrow. In this case, shown in Figure 5.1(b), all the targets in the image appear clear regardless of where they fall in relation to the focus range. Figure 5.1(a): Low Aperture Number, F5 51

56 Figure 5.1 b: High Aperture Number, F22 Though photos with large F-number are able to show every target clearly - in other words, the depth-of-field has been increased - there is a considerable disadvantage which cannot be neglected. Increasing the F-number will cause the aperture to shrink; therefore, the amount of light that reaches the image sensor will be decreased and the image will look darker than those with smaller F-numbers (given the same shutter speed and ISO). To achieve a larger F-number while maintaining sufficient image brightness requires increasing the ISO value or shutter time, which will result in more noise and/or blurry images ISO value ISO is the numerical scale system for film speed, which measures a digital camera image sensor s sensitivity to light. High ISO value indicates greater sensitivity, which means the resulting photos will be brighter but also exhibit a coarser grain and higher image noise. For these reasons a low ISO value is generally preferred; however, sometimes it is necessary to increase the ISO value if the desired aperture and shutter speed cannot achieve a clear, well-lighted image Shutter Speed Shutter speed (also exposure time) is a measure of time that describes how long a camera s shutter is open when taking photographs. This is designated by a number that represents the denominator of time measured in seconds, so 2.5 means the shutter speed is 1/2.5 second; however, if a quotation mark ( ) appears after the number then the measurement is in time and 2.5 would mean 2.5 seconds. In the case where there are low 52


57 lighting conditions or very narrow aperture (high F-number), the shutter speed needs to be over one second. The shutter speed selected in the C-Shaped Wall sample project was 2.5; during this exposure period when the image sensor receives light, the camera must remain stable to avoid getting a blurry image. If the shutter time is too much longer, the experimental test will be extended since images have to be taken at the completion of every load step and the cameras often trigger in succession, rather than simultaneously. Generally for the Complex Walls test project, researchers have made every effort to keep shutter speeds under 2.5 seconds while maintaining the necessary brightness and contrast of images Image Resolution Image resolution for digital cameras is a measure of the pixel count in the image. Typically this is calculated using the product of the pixel number along the two adjacent edges of an image. For example, the Nikon D90 has an edge pixel count of 4288 by 2848 for a total of 12.3 megapixels. In a photogrammetric project, it is recommended to place the camera at a distance from the test specimen, so the resulting the inner target diameter shown in digital images should be around 20 pixels. Figure 5.2 provides a sample photo which is considered to have good resolution as well as a zoomed-in image of a target from this photo to demonstrate the method of determining the inner target diameter in pixels. 20 pixels (a) (b) Figure 5.2: Image Resolution (a) Overall Photo (b) Target Detail As shown in Figure 5.2(b), the pixels of the inner diameter can be counted if the photo is zoomed-in to focus on one target. Each square in the grid represents one pixel; therefore, the inner target diameter for this sample, as indicated by the dimension lines, is nearly 20 pixels. 53
 It can be placed farther away from the specimen to capture more targets in one photo while still maintaining the required number of pixels")
58 Having adequate number of pixels for the targets allows sufficient clarity so PhotoModeler can identify them. The benefit of using a higher resolution camera is that: (1) It can be placed farther away from the specimen to capture more targets in one photo while still maintaining the required number of pixels for the target center, or (2) If placed at the same location of a lower resolution camera, it can be used to increase the resolution of the target to make it easier for PhotoModeler to recognize. Such improvements will decrease the number of cameras needed for the project or increase the accuracy of calculation by software. Thus, it is strongly recommended to use high-resolution digital cameras in photogrammetric project Determining Optimal Camera Parameters To determine the optimal camera setting for a project, it is best to run several trial projects to see how those parameters work in the actual lab environment. Figure 5.2 shows a comparison of two trial projects for the C- Shaped Wall sample. For, Figure 5.2(a) the parameters used were F22, ISO 800, and Shutter Speed 2.5 and for Figure 5.2(b) they were F11, ISO 200, and Shutter Speed 2.5. Based on PhotoModeler project statistics the parameters used for Option (b) are preferred, as the residual value is lower (0.47 compared to 0.58) and a greater number of targets were successfully captured (only missing 9 targets compared to 16 from the total target grid). Note that maximum residual is indicated at the lower right of the screen, and missing targets can be determined by looking at the 3D Viewer window. (a) 54
 but successfully captured in set (b), the image noise in set (a) with ISO 800 is higher than that")
59 (b) Figure 5.2: Camera Parameters Comparison, (a) F22, ISO 800, Shutter Speed 2.5, (b) F11, ISO 200, Shutter Speed 2.5 Further examination of these two cases show that after zooming in on the points missing in set (a) but successfully captured in set (b), the image noise in set (a) with ISO 800 is higher than that in set (b) with ISO 200. Also apparent is the fact that the larger F-number utilized in set (a) to compensate for high ISO value did not appear to have much advantage over set (b) with F11. As a result of analysis, it was determined better to keep a low ISO value (200) with low F-number (11) for the C-shaped wall project. These observations are illustrated through Figure 5.3; note that any time a white cursor appears at the center of the target, PhotoModeler was able to recognize its position. 55


60 (a) (b) Figure 5.3: Zoomed-in Comparison, (a) F22, ISO 800, Shutter Speed 2.5, (b) F11, ISO 200, Shutter Speed Camera Position Camera Field-of-View In general, photogrammetry is a process by which three-dimensional spatial information is obtained about an object from ordinary photographs using the principles of triangulation (Hart, 2012). PhotoModeler can calculate the positions of targets in space and construct a 3D model only if it is able to recognize each target in three photos taken from different angles. Thus, to achieve accurate results with photogrammetry it is essential to position cameras in a way that every target on the specimen will fall into the field-of-view of at least three cameras. This section includes an overview of how to display images and the 3D model of specimen in PhotoModeler after a project has been processed to determine the photo(s) in which a target appears. Refer to Section for the procedure to run an automated project. 56


61 Viewing Photos and 3D Model of Targets in PhotoModeler After the processing is finished, click Select All Photos (indicated as 1 in the image). Then, click Open Photos Tablet ( 2 ). 2 1 The photos will appear in the center of the PhotoModeler viewing screen. Notice every target that has been recognized in an image is indicated by a white cursor at its center. 57

.")
62 Next, click Open 3D View. The 3D model of targets on the specimen will be shown at right side of the software window There are five tools at the bottom right corner of 3D Viewer, listed from left to right: rotate, zoom in/out, pan, reset view, and the options menu window (shown below). To modify the 3D view, select one of the first four icons using the left mouse button and dragging the cursor across the 3D Viewer screen. Note that when looking 58


63 at the 3D Viewer, cursors may appear for targets even if they are not recognized in the requisite three images. This is why the user has to individually verify that each target appears in three photos. The procedure for this is included later in this section Determining Photos in which Targets Appear Click Select Items Mode if it is has not been activated. When one of the targets in 3D Viewer Window is selected the cursor associated with the chosen target turns red in 3D Viewer and purple in any photos where it is recognized. Earlier in Section 2.3 there was a discussion of how equipment for other instrumentation systems can interfere with photogrammetry. Looking at Photo 4 from the C-Shaped Wall flange project below it is evident that a wooden bracket is blocking two of the targets. However, since the other camera positions have been specifically selected to deal with this interference, the targets are still visible in the necessary three photos; thus, PhotoModeler is able to solve the targets position correctly. Aside from visually reviewing all the images where the target appears to see if it is included in the required three photos; one can select a target cursor in any photo and a text box will appear at the bottom right 59
64 of the screen that indicates the photograph numbers used to calculate the target position. The remainder of the targets can be checked in the same manner. PhotoModeler is generally only able to recognize the center 90% of the image as there is generally distortion at the extents of the photographs. Therefore, it is necessary to pay special care to the targets around the edge of photos as they are most likely to be missing. To avoid these issues, if possible, try to avoid taking photographs where targets are located at the edges of the camera field-of-view, especially the corners. Distortion is maximum in these regions as the distance covered along the edge of image is less than that covered along a vertical line closer to the center of the image; this concept is illustrated in Figure 5.4. Notice how the column of targets along the left edge of C-shaped Wall is distorted in Figure 5.4(a) and less so in Figure 5.4(b). Both images are taken from the same position; the only difference is camera orientation. 60


65 (a) (b) Figure 5.4: Distortion at Vertex of Camera Visual Field Angles between Cameras When positioning cameras for a photogrammetry project, the difference between angles is a key factor to consider. In order to get an accurate triangulation result, images of the test specimen must be taken from at least three different positions with relatively large angles between them. The easiest way to achieve this is placing the cameras as far apart from each other while capturing the same targets. Also, the individual cameras should be positioned to shoot nearly perpendicular to the object to avoid considerable perspective distortion. This type of distortion may create issues if the still images are intended to serve as documentation of cracking and spalling; also, this can result in significant ovalization of the targets which means they will not be recognized in PhotoModeler. For these reasons, selecting camera positions is another aspect of photogrammetry that requires various trials. When processing images for a project, PhotoModeler does provide feedback if there is an issue with the angle of separation between cameras. This is illustrated in the Figure 5.5, where the Project Status Report indicates 61

66 there are very small differences in angle shots. There are even some instances where the project will terminate before completion due to insufficient angle of separation. In either situation, whether there is a warning or the project fails entirely, it is recommended that cameras by re-positioned for greater angles between the images. Some sources indicate that if the distance between cameras cannot be increased to resolve this problem, then the camera orientation should be modified (landscape versus profile as shown in Figure 3.6). This was attempted with the C-Shaped Wall sample project, and no real benefits were seen; however, it may be worth trying if all other options are exhausted. Figure 5.5: Small Angle of Separation between Images Distance Between Cameras and Targets The distance between cameras and targets depends primarily on two items: (1) The minimum distance must meet the requirements for overlapping camera field-of-views to capture each target in three images as discussed in Section 5.2.1, and (2) The maximum distance should allow for images where the targets appear clearly and the inner target diameter meets the pixel width defined in Section The range associated with minimum and maximum distances depends on the focus length of cameras that will be used in the experiment. This is due to the fact that image coverage area is inversely proportional to the focus length of a camera lens, given that the distance between targets and camera is fixed. In other words, if a larger field-of-vision is desired, a lens with smaller focus length would be preferable. Figure 5.6 provides an example of how the coverage area of a camera field-of-view changes with varying focus lengths at a fixed distance 7 feet away from targets. 62
: Focus")
: Focus")
67 200 mm 50 mm (a): Focus length 20mm 200 mm (b): Focus Length 50mm 63

68 (c): Focus Length: 200mm Figure 5.6: Coverage Area due to Varying Len s Focal Length For the C-Shaped Wall sample an effort has been made to limit camera lens focal length to 20mm as this provides the best coverage. While similar coverage could be achieved with the next lens size, 35 mm, the camera would have to be positioned farther away from the specimen which would cause the targets to appear smaller and be harder to recognize in PhotoModeler. This is not to say that one cannot mix-and-match lens types within an experiment, rather it is not advised. The better option would be to acquire more 20mm lenses, than have a few 35 mm lenses in the project. It is important to note that the previous discussion about focal lengths pertains to fixed focal length lenses only, the use of variable focal length lenses is not recommended. This is for the fact that camera calibrations are dependent on the focal length setting, and many variable lenses do not have a locking mechanism to ensure that the focal length setting does not change throughout the course of a test. In previous Complex Walls tests cameras with variable focal length were utilized, and it was noted that when replacing the lens cap between days of testing the focal length would change. This is something that cannot occur with cameras being used for photogrammetry since the position calculations for the targets will be inaccurate. Therefore, it is best to eliminate variable focal length lenses as an option. 64


69 5.3 External Light Source It is important to keep the test specimen well-lighted for sufficient brightness and contrast in photos. In the case where a larger F-number for aperture is required, increasing the lighting around the test specimen will help maintain image brightness without the necessity of increasing ISO value that would cause image noise. These concepts were introduced in Sections , and should be revisited in a photogrammetric project when determining whether external light sources are needed and where the optimal positions should be. At the same time, an excess amount of external light can be detrimental to project quality, as shown in Figure 5.7. Notice in Figure 5.7(a) there is missing a target in the close-up image, while in Figure 5.7 (b) this target was successfully captured with less lighting. Also, the residual in project (a) with more lighting is worse than project (b), given that all other project variables have remained unchanged (0.83 compared to 0.24). (a) (b) Figure 5.7: Comparison of Results with Varying External Light Sources In examining these two cases, it is important to note that contrast plays a more significant role PhotoModeler s ability to identify targets than brightness does. If one exposes an object to too much light, the images of that object may actually lose contrast, like the target shown in Figure 5.8. Therefore, it is necessary to keep in mind that adding external light source may be helpful, but also has possibility of becoming detrimental to the project. Determining the amount and location of light sources is another process in setting up a photogrammetry project that will require various trials. 65

70 Figure 5.8: Loss of Image Contrast due to Excessive Lighting 5.4 Synchronized Remote Camera Trigger System To take photos simultaneously with multiple cameras at the completion of every load step in an experiment requires a synchronized remote trigger system. This is necessary so that researchers do not have to manually trigger the cameras and potentially change the position of the cameras, besides the fact that doing this is not feasible when there are multiple cameras and the experiment contains load steps. The University of Illinois facility, where the C-Shaped Wall sample test is being conducted, has its own camera triggering system. The CameraPlugin receives a message as the control software completes a load step, and in turn sends a signal for the cameras to fire. The images from each camera are saved in a specific folder on designated computer systems; each of these images contains in its name the load step at which it was acquired. Other laboratories may find it useful to develop or a similar system to assist in image acquisition. 66
71 Chapter 6. Photogrammetric Project Setup Reference Target Group 6.1 Function of Reference Target Group In large-scale structural experimentation the goal of using photogrammetry is to determine the XYZ coordinates of targets on the specimen at each load step. To achieve this it is first necessary to construct a fixed, scaled 3D coordinate system that PhotoModeler references to solve the position of targets. Since the entire specimen will be moving during the test, a reference target group must be installed to a stationary part of the test set-up to define the coordinate system. 6.2 Creating and Positioning Reference Target Group The reference target group will consist of three targets positioned in an L-shaped configuration that is attached to a solid frame. As illustrated in Figure 6.1, these targets will define the origin and two axes vertical and horizontal. Figure 6.1: Reference Target Group There are three essential items that must be considered in developing a reference target group: (1) Arrangement of Targets, (2) Stability and (3) Position of Solid Frame. These will be discussed in further detail in this section Arrangement of Targets Though the L-shaped arrangement shown in Figure 6.1 is recommended, reference targets can be in arranged in any way so long as they form two axes that are perpendicular to each other on a flat plane. Only two axes are 67

. The spacing between the targets must be measured very precisely; for this task the use of calipers is recommended.")
72 required to define the coordinate system in PhotoModeler as it provides sufficient information to measure the displacements that occur along the out-of-plane axis. Also important in the arrangement of targets is the spacing between targets, which needs to be relatively large to accommodate the scale of the test specimen. For previous Complex Wall tests that have employed photogrammetry, it was determined that a spacing around 2 feet between the reference target being used for the origin point and the other two targets is acceptable (recall the wall specimens are 10 feet by 12 feet). The spacing between the targets must be measured very precisely; for this task the use of calipers is recommended. It is important that these exact distances are known, because the accuracy of all the other measurements that occur in the photogrammetry project will be based upon these reference targets Stability The reference target group must be attached to a frame that will be stationary and not deform throughout the entire experiment. Therefore, it is suggested to attach targets to a solid frame of wood or metal, and install the frame to fixed part of the experimental test set-up. In a prior coupled wall test the reference targets were attached to a piece of plywood mounted to the specimen s footing, as shown in Figure 6.2. This was possible since the footing is attached to the strong floor with twelve threaded rods post-tensioned at 100 kips each, it is considered fixed and the targets are not expected to move. To ensure that the fixed frame with the reference targets did not move, three Krypton LEDs (indicated in red) were also attached to the solid frame to measure any displacements that occurred. The coupled wall is a unique instance where there was space on the stationary part of the specimen to install reference targets, in most cases the solid frame will be mounted on brackets attached to either the strong wall or steel columns bolted into the strong floor. Figure 6.2: Coupled Wall with Reference Targets 68

73 6.1.3 Positioning The coupled wall, shown in Figure 6.2, was a unique case where the specimen had an opening where the reference target frame could be placed without blocking any targets on the specimen. Although, the 2 foot by 2 foot area required for the frame seems relatively small compared to the overall specimen dimensions for the C- Shaped Wall sample, positioning the reference target has required a great deal of consideration since there is little room to spare around the specimen. Figure 6.3 illustrates some of the main concerns with placement of the reference target frame: (1) There is little room to remaining at the edges of the image, so reference targets must be placed more centrally to be captured in the necessary three images, and (2) The reference target frame cannot be fixed to specimen foundation in front of wall, like for coupled wall, because it will block targets on the specimen and there is a potential risk that during crack tracing researchers may accidently cause the frame to move from its initial position. Positioning of the reference target frame is another item that requires various trials to determine where the most suitable place would be. Figure 6.3: Space Constraints on Placement of Reference Target Frame To overcome the various challenges with the C-Shaped Wall sample, a frame, shown in Figure 6.4, has been designed that will attach to a steel column at the left side of the test specimen. The arms of the frame will extend into the specimen area between the rows of targets, and the vertical brace to stiffen the arms will be located outside of the specimen area. This will eliminate the issue of having blocked targets even when the wall is displacing. Furthermore, the planned location of the brace several feet above the ground, removes it from the path of traffic when researchers are crack tracing during the test. An approximate drawing showing how the frame will appear in the camera image is included in Figure


74 Figure 6.4: C-Shaped Wall, 3D Model of Reference Target Frame Figure 6.4: Approximate Drawing of Frame in Camera Image Considerations have also been made for the bi-directional loading that will occur in the upcoming C-Shaped Wall experiment; given that the maximum displacement for the last C-Shaped Wall was slightly over 5 inches when loaded only in the strong axis, the frame has been designed to allow at least 4 inches of clearance in the out-ofplane direction. 6.3 Constructing Coordinate System Using Reference Targets In PhotoModeler, a coordinate system is constructed by using the Scale, Rotate and Translate feature. An overview of how to use this tool is provided below. Since reference targets have not been installed on the C- Shaped Wall sample project yet, the procedure provides instructions on creating a coordinate system for three aligned targets on the specimen. The steps would be identical when using actual reference targets. 70


75 In a project which has already been processed, click Project -> Scale/Rotate Viewer The External Geometry Explorer window will appear; initially it will be empty since no geometric constraint has been added. Click the Add/Import External Geometry button at top left corner the window. 71


76 In the Add or Import external geometry window, choose Add new empty object, and select Scale, Rotate and Translate in types. Click OK. Now, three geometric constraints are added: scale, rotate and translate. The measurement units can be changed using the Units tab; for the C-Shaped Walls sample, all distances will be reported in inches. Then, select Scale (the table entry highlighted in green under the Units pull-down menu), and click New at the right side of External Geometry Explorer window. 72


77 Next, enter the distance known between two arbitrary targets. When setting up the coordinate system for a project, the distance between two of the reference targets will be used. Click OK to proceed Next, select the two targets used for the distance in the previous step (left click + Shift ), and click Assign. 73

78 Notice an S appears beside the cursors of the selected targets, indicating a scale is has been assigned to them. Next, click Rotate, and the External Geometry Explorer window will show axes that can be assigned. 74

79 Select the two targets which can become the base for an axis in the image, then select the corresponding axis to assign the geometry. Pay attention to the order when choosing the targets (e.g. X1 indicates starting point and X2 defines the positive direction). For the C-Shaped Wall sample, the x-axis will be defined using the same points as those selected for Scale ; note that X1 and X2 appear beside the points that have been chosen. Next, repeat the procedure to define another axis for the coordinate system. Use the same origin point, and another point that creates a perpendicular line with the first axis that was defined. 75


80 Now that the orientation of axes and scale is defined, the only thing left is to choose an origin for the coordinate system. Click Translate, select the target that was used for defining both axes as the origin and click Assign. Now the 3D coordinate system has been successfully created. To check the position of any target in the project, right click the white cursor at its center and select Properties from the pull-down list that appears. 76

81 The position of selected target is shown in Properties window. It is recommended to select several targets on the structure and physically measure their XYZ coordinates in relation to the established origin to verify that the coordinate system was correctly set-up for the project using the Scale, Rotate, and Translate tool. 77

82 Chapter 7. Photogrammetric Project Post-Processing After the preparation and set-up mentioned in previous chapters is complete, the final step is to run a full photogrammetric project with the multiple cameras, light sources, and targets at their planned settings/positions. This allows researchers to simulate actual test conditions and verify that no adjustments are necessary before running the experiment. In other words, this provides confidence that the test data collected by this system will be valid and can be utilized later to analyze the specimen s performance. 7.1 Procedure for Processing Automated Projects Multiple Cameras Unlike earlier trial projects where the researcher could use only one camera to take photos from different positions, now a complete photo set will be generated simultaneously by multiple cameras like in the real test. Thus, it becomes important to assign different names to cameras when creating the calibration files and in associating each with the photos it has taken. This section provides an overview of how to execute a photogrammetric project based on images from multiple cameras. (Recall that Section describes processing an automated project with a single camera; many of the initial steps are the same in both cases.) First, open PhotoModeler and open File -> Getting Started, if the Getting Started window does not automatically appear. Select Automated Project. 78


83 Then, choose RAD Coded Target Auto-project in the window that appears, and click Next The software will prompt the user to add photos to the project. Click Add Photo(s) 79


84 Navigate to the directory where the project photos have been saved, and click Open to import them into PhotoModeler. Take note of the corresponding camera used to take each photo; it helps if images are titled in a way that associates each with a camera. When the photo image appears in the New Project Wizard window it has been successfully uploaded. Repeat the procedure until all the photos required for the project have been uploaded. 80


85 Click Next when the uploading is complete. A window will appear listing the camera calibration files that PhotoModeler thinks may match the photos that have been imported. It will ask the user which of the cameras contained in the Camera Library was used to take the images. The image below shows that multiple Nikon D90 type cameras have been calibrated; however, at this time, select an arbitrary camera from the list and click OK. It does not matter since the cameras corresponding to individual images will be assigned later. 81


86 Sometimes, rather than displaying a list of options, the software will automatically assign a camera calibration file to images with same size of pixels. While this feature may be helpful in trial projects where there is only one camera calibration file, it can be neglected in a multiple camera project since any cameras assigned by PhotoModeler will be manually replaced later. Click OK to proceed. Next, Click Run. 82


87 PhotoModeler will start processing the project with the total error shown in real-time. After processing is complete, click Close. Recall that an arbitrary camera is being used for all the images; therefore, it is not necessary to examine the report for project quality. Now individual cameras will be assigned to images. Select Project -> Cameras 83


88 The Camera Viewer window will appear, which has information for all the cameras being used in the project. Currently, the only camera that appears under the Cameras in Project heading is the one that the user either arbitrarily selected or the software automatically matched with the photos. It is necessary to add the correct cameras to this list. Click Library to find the calibration information for cameras saved in the camera library. From the Camera Library select cameras that need to be added to the project, then click the >> button to add them into Cameras in Project. Click OK when finished. 84

89 If the cameras for the project have not been recorded in the library, choose Load from disk... instead of Library in the Camera Viewer window. Select and open the camera files needed. Refer to Section for instructions on saving camera in.pmr or.cam file. Repeat the procedure until all the cameras are loaded correctly. In the Camera Viewer, left click the camera name and the detailed information associated with that camera will be shown at right. Notice how the cameras labeled 7873 and 7874, both are Nikon D80 with 20mm lens, can differ from each other. This highlights the necessity of calibrating every camera even if they are the same model with identical focus length; recall this is critical to the accuracy of the photogrammetry project. 85
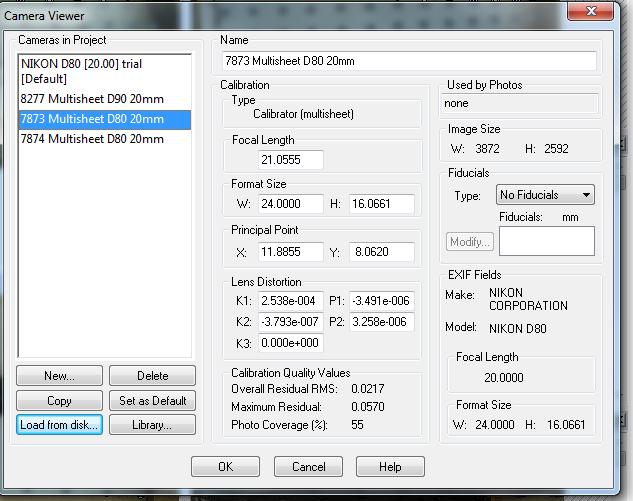
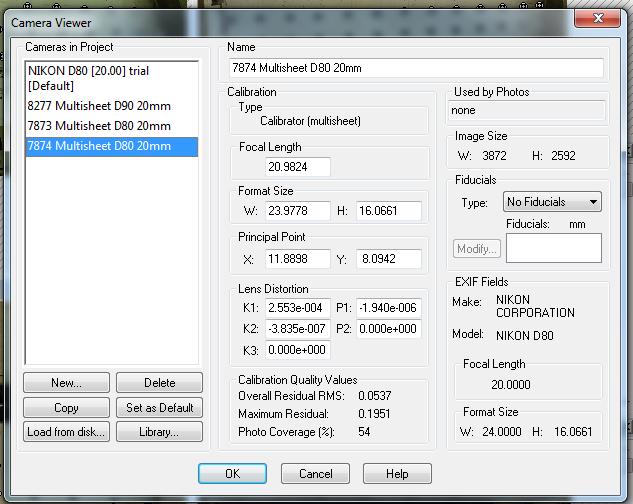
90 86
 In")

91 Now, close the Camera Viewer and return to PhotoModeler s main window. Under the Photo List, right click an image and select Properties of selected photo(s) In the Properties window, click the name next to Camera and select the appropriate camera calibration file for the image, click Apply and then OK. This is how the camera for each photo will be reset. 87


92 Repeat the procedure until every photo has been linked to its correct camera. Then, click Project -> Process Click Process. Now the project has been processed with the correct camera calibration files. If the experiment includes a large number of cameras, the images need be organized in a way to prevent confusion between which calibration file corresponds to each image. There are methods of writing an external script that can automatically assign camera calibration files to images, since this would be an extremely lengthy task to do it manually given that a project like the C-Shaped Wall sample will have ten cameras and over a thousand photo sets in total. 88

93 7.2 Evaluating Project Quality using PhotoModeler Report There are two significant criteria to examine when trying to determine whether a PhotoModeler project is accurate: error and residual. The error indicates the goodness of fit which is a measure of how well all the input data agree with one another, while residual is a measurement of the difference between the targets actual positions and the ones solved by PhotoModeler. The following section will discuss these two project quality indicators in further detail. More information on checking the accuracy of a photogrammetry project can also be accessed at Error When processing project in PhotoModeler, the error will be shown real-time in a constantly changing histogram, as shown in Figure 7.1 Figure 7.1: Real-time Error Histogram A final error under 10 indicates a relatively accurate result. In some cases the error will remain high throughout processing and ultimately cause the project to fail before completing. This is typically because the software failed to orient some of the photos, which occurs when a target that has been mistaken for another target. Recall that all the RAD Coded targets are unique; each pattern has a number associated to it (1-999) that PhotoModeler recognizes and assigns in both the photographs and 3D Model view. There are instances where the software mislabels a target, or labels two targets with the same number. To resolve this issue, one possible solution is to include High Residual Point Removal (HRPR) in the project, which will be further explained in Section Also, if the same targets are consistently mislabeled when running the same project from different photo sets, it would be worth investigating why PhotoModeler is having issues recognizing the target; this may have to do with bending of the target, lighting, or camera position. 89


94 7.2.2 Residual The residual is calculated after a project is complete, and it is a significant indicator of project accuracy. A project with maximum residual under 1.0 is considered reliable; this number can be easily checked at the bottom right corner of the PhotoModeler main window: For a more in-depth analysis of residual, turn on the visibility of residual on photo. Click Visibility on Photos on the upper left corner. The Visibility on Photos window will open. Toggle the box beside Residuals. 90
95 Notice there is not much difference in the photos after Residuals tab is checked; the exception is one point in the top left image that has a line extending from it. The length of the line represents the amount of residual a point has, for the particular point that has been highlighted the residual value is 788. The other points residuals cannot be seen because they are very small by comparison. However, they can be magnified to become more distinguishable. To do so, type a number (usually for good quality project) beside the Magnify tab. Now that the lengths of the lines are magnified, their directions and magnitudes are much more discernible. The lines point from the actual targets positions in the image toward the positions solved by PhotoModeler (i.e. the positions of points in project). If the directions of residuals are relatively random, it indicates the project quality is acceptable. Otherwise, if most of the residuals are pointing in the same direction, there may be a problem, like unstable camera position while taking images Inspection of Project Quality The project quality is summarized in Project Status Report, which can be opened in this window by clicking Show Report after the project processing is finished.. Notice the photo numbers used in the Automated Coded Target Project window all appear green, which means the images have been oriented and are included in the project; otherwise, they would appear grey. This serves the same purpose as the small icon in the corner of 91


96 images seen in Section 3.5.1; the camera icon indicates the photo has been oriented, the red cross shows that it has not. In the case where there are un-oriented images, the quality of the photo set does not meet the requirements for reference point density and needs to be replaced. In the report, the first thing to look at is Problems and Suggestions. If the project quality is good, there will be zero problems and suggestions like this: 92


97 If problems exist, for instance the maximum residual is over 1.0 or the target coverage area in the image is not ideal, they will be shown in red text: The user should read through the list of problems and suggestions to resolve those issues. Next, scroll down the report and look at Total Error and Quality -> Point Marking Residuals 93

98 The Last Error, which is the error at final stage of processing, should be less than 10 and maximum residuals need to be less than 1. The project shown above meets both criteria, indicating the project quality is acceptable. Click Close to go back to main window. The report can be re-opened at any time by clicking Project -> Show Report. 7.3 Project Optimization Every project goes through an optimization stage where a number of parameters are solved or improved. PhotoModeler makes use advanced methods to fine tune results during processing which increases the project accuracy. Primarily the two optimization methods used are Field Calibration and High Residual Point Removal (HRPR); these options both appear under the tab Project Optimization. Field Calibration has already been explained in detail in Section This section will focus on HRPR as a method that can enable PhotoModeler to process projects that may otherwise been invalid due to high error in orienting the photos High Residual Point Removal High Residual Points Removal (HRPR) is an option which enables the software to automatically ignore points having relatively high residuals compared to nearby targets that are accurate. The option can be very helpful when the project fails because a target in a photo is mistaken for another and thus the individual photos cannot be oriented to solve for the entire 3D object. This is an example of using HRPR to process a failed project, notice the high real-time error shown while the project is running: 94


99 PhotoModeler shows that the project is not complete. Click Close to go back to main window. 95


100 Click Project -> Process. In Process window, select the Optimize tab and check the white box besides Include High Residual Point Removal, and click Process. 96


101 A window appears indicating that the project has been successfully processed. Click OK. Now the project has been successfully processed. Though HRPR increases the accuracy of project, in the actual experimental project it is not advised to include this optimization method as it may generate deceptive good results. If HRPR is enabled in real test it is possible that PhotoModeler will ignore multiple high residual points in the project, which will cause the researchers to mistakenly think the project quality is acceptable and neglect problems that would otherwise be evident and could be fixed. This is illustrated by the example below: The software recognized the target on the left as number 9, and mistakenly connected it to the actual target with ID 9. This occurred despite the targets having distinct patterns: 97


102 In a trial project, where it is not necessary to capture all targets positions in high accuracy (for example testing camera visual field coverage), HRPR may save the effort of retaking the whole set of photos in case a project cannot be processed at all. 7.4: Data Acquisition and Documentation The ultimate objective in photogrammetry is to extract position and displacement data of points on the test specimen. This information helps researchers understand how the specimen behaves under the experimental loading history. As mentioned in Section 2.1, the C-Shaped Wall sample project will have a photo set containing 10 images that are taken at the completion of each load step where there are steps in total. For each photo set, positions of over 260 targets will be solved by PhotoModeler and recorded in a tabular format. The raw data would be organized similar to that gathered from Krypton LEDs where the measurements for the target s XYZ position are stored in three different channels. It goes without saying that attempting to process the image sets individually and extract the position data for all the targets would be inefficient and burdensome to do manually. Previous researchers at the University of Illinois at Urbana-Champaign working on the Complex Walls project have developed a Matlab script wrap-around script for PhotoModeler to automate the process of associating camera calibration files to photos, processing image sets, and extracting the 3D coordinates of targets. It is strongly recommended to acquire or develop similar method. It is likely that in a future version of this document there will be a detailed description of how to create such a script and what functions that it executes. However, the scope of this instruction manual was to provide an introduction to photogrammetry and enable researchers to set up a project using this instrumentation method. 98
Use of Photogrammetry for Sensor Location and Orientation
 Use of Photogrammetry for Sensor Location and Orientation Michael J. Dillon and Richard W. Bono, The Modal Shop, Inc., Cincinnati, Ohio David L. Brown, University of Cincinnati, Cincinnati, Ohio In this
Strain Measurements with the Digital Image Correlation System Vic-2D
 CU-NEES-08-06 NEES at CU Boulder 01000110 01001000 01010100 The George E Brown, Jr. Network for Earthquake Engineering Simulation Strain Measurements with the Digital Image Correlation System Vic-2D By
CSI: Rombalds Moor Photogrammetry Photography
 Photogrammetry Photography Photogrammetry Training 26 th March 10:00 Welcome Presentation image capture Practice 12:30 13:15 Lunch More practice 16:00 (ish) Finish or earlier What is photogrammetry 'photo'
A Study of Slanted-Edge MTF Stability and Repeatability
 A Study of Slanted-Edge MTF Stability and Repeatability Jackson K.M. Roland Imatest LLC, 2995 Wilderness Place Suite 103, Boulder, CO, USA ABSTRACT The slanted-edge method of measuring the spatial frequency
Stereo Image Capture and Interest Point Correlation for 3D Modeling
 Stereo Image Capture and Interest Point Correlation for 3D Modeling Andrew Crocker, Eileen King, and Tommy Markley Department of Math, Statistics, and Computer Science St. Olaf College 1500 St. Olaf Avenue,
Opto Engineering S.r.l.
 TUTORIAL #1 Telecentric Lenses: basic information and working principles On line dimensional control is one of the most challenging and difficult applications of vision systems. On the other hand, besides
How to combine images in Photoshop
 How to combine images in Photoshop In Photoshop, you can use multiple layers to combine images, but there are two other ways to create a single image from mulitple images. Create a panoramic image with
Displacement Measurement of Burr Arch-Truss Under Dynamic Loading Based on Image Processing Technology
 6 th International Conference on Advances in Experimental Structural Engineering 11 th International Workshop on Advanced Smart Materials and Smart Structures Technology August 1-2, 2015, University of
Determining MTF with a Slant Edge Target ABSTRACT AND INTRODUCTION
 Determining MTF with a Slant Edge Target Douglas A. Kerr Issue 2 October 13, 2010 ABSTRACT AND INTRODUCTION The modulation transfer function (MTF) of a photographic lens tells us how effectively the lens
Ball State University Department of Architecture Spring 2017 Grondzik
 ASSIGNMENT THREE Delightful Daylighting DUE: various dates POINTS: 7 of 45 Objectives: The intent of this assignment is to provide hands-on experience with the use of daylighting models as a design and
Great (Focal) Lengths Assignment #2. Due 5:30PM on Monday, October 19, 2009.
 Lengths Assignment #2. Due 5:30PM on Monday, October 19, 2009.") Great (Focal) Lengths Assignment #2. Due 5:30PM on Monday, October 19, 2009. Part I. Pick Your Brain! (50 points) Type your answers for the following questions in a word processor; we will accept Word
Great (Focal) Lengths Assignment #2. Due 5:30PM on Monday, October 19, 2009. Part I. Pick Your Brain! (50 points) Type your answers for the following questions in a word processor; we will accept Word
MULTIPLE SENSORS LENSLETS FOR SECURE DOCUMENT SCANNERS
 INFOTEH-JAHORINA Vol. 10, Ref. E-VI-11, p. 892-896, March 2011. MULTIPLE SENSORS LENSLETS FOR SECURE DOCUMENT SCANNERS Jelena Cvetković, Aleksej Makarov, Sasa Vujić, Vlatacom d.o.o. Beograd Abstract -
AUTOMATED INSPECTION SYSTEM OF ELECTRIC MOTOR STATOR AND ROTOR SHEETS
 9th International DAAAM Baltic Conference "INDUSTRIAL ENGINEERING" 24-26 April 2014, Tallinn, Estonia AUTOMATED INSPECTION SYSTEM OF ELECTRIC MOTOR STATOR AND ROTOR SHEETS Roosileht, I.; Lentsius, M.;
Which equipment is necessary? How is the panorama created?
 Congratulations! By purchasing your Panorama-VR-System you have acquired a tool, which enables you - together with a digital or analog camera, a tripod and a personal computer - to generate high quality
FSI Machine Vision Training Programs
 FSI Machine Vision Training Programs Table of Contents Introduction to Machine Vision (Course # MVC-101) Machine Vision and NeuroCheck overview (Seminar # MVC-102) Machine Vision, EyeVision and EyeSpector
A New Capability for Crash Site Documentation
 A New Capability for Crash Site Documentation By Major Adam Cybanski, Directorate of Flight Safety, Ottawa Major Adam Cybanski is the officer responsible for helicopter investigation (DFS 2-4) at the Canadian
Bringing Answers to the Surface
 3D Bringing Answers to the Surface 1 Expanding the Boundaries of Laser Microscopy Measurements and images you can count on. Every time. LEXT OLS4100 Widely used in quality control, research, and development
The Elegance of Line Scan Technology for AOI
 By Mike Riddle, AOI Product Manager ASC International More is better? There seems to be a trend in the AOI market: more is better. On the surface this trend seems logical, because how can just one single
Kit for building your own THz Time-Domain Spectrometer
 Kit for building your own THz Time-Domain Spectrometer 16/06/2016 1 Table of contents 0. Parts for the THz Kit... 3 1. Delay line... 4 2. Pulse generator and lock-in detector... 5 3. THz antennas... 6
CircumSpect TM 360 Degree Label Verification and Inspection Technology
 CircumSpect TM 360 Degree Label Verification and Inspection Technology Written by: 7 Old Towne Way Sturbridge, MA 01518 Contact: Joe Gugliotti Cell: 978-551-4160 Fax: 508-347-1355 jgugliotti@machinevc.com
Using PhotoModeler for 2D Template Digitizing Eos Systems Inc.
 Using PhotoModeler for 2D Template Digitizing 2017 Eos Systems Inc. Table of Contents The Problem... 3 Why use a photogrammetry package?... 3 Caveats and License to Use... 3 The Basic Premise... 3 The
Technical information about PhoToPlan
 Technical information about PhoToPlan The following pages shall give you a detailed overview of the possibilities using PhoToPlan. kubit GmbH Fiedlerstr. 36, 01307 Dresden, Germany Fon: +49 3 51/41 767
ORIFICE MEASUREMENT VERISENS APPLICATION DESCRIPTION: REQUIREMENTS APPLICATION CONSIDERATIONS RESOLUTION/ MEASUREMENT ACCURACY. Vision Technologies
 VERISENS APPLICATION DESCRIPTION: ORIFICE MEASUREMENT REQUIREMENTS A major manufacturer of plastic orifices needs to verify that the orifice is within the correct measurement band. Parts are presented
APPLICATION OF PHOTOGRAMMETRY TO BRIDGE MONITORING
 APPLICATION OF PHOTOGRAMMETRY TO BRIDGE MONITORING Jónatas Valença, Eduardo Júlio, Helder Araújo ISR, University of Coimbra, Portugal jonatas@dec.uc.pt, ejulio@dec.uc.pt, helder@isr.uc.pt KEYWORDS: Photogrammetry;
Here are some things to consider to achieve good quality photographic documentation for engineering reports.
 Photography for Engineering Documentation Introduction Photographs are a very important engineering tool commonly used to document explorations, observations, laboratory and field test results and as-built
On spatial resolution
 On spatial resolution Introduction How is spatial resolution defined? There are two main approaches in defining local spatial resolution. One method follows distinction criteria of pointlike objects (i.e.
Machine Vision for the Life Sciences
 Machine Vision for the Life Sciences Presented by: Niels Wartenberg June 12, 2012 Track, Trace & Control Solutions Niels Wartenberg Microscan Sr. Applications Engineer, Clinical Senior Applications Engineer
Close-Range Photogrammetry for Accident Reconstruction Measurements
 Close-Range Photogrammetry for Accident Reconstruction Measurements iwitness TM Close-Range Photogrammetry Software www.iwitnessphoto.com Lee DeChant Principal DeChant Consulting Services DCS Inc Bellevue,
Leica DMi8A Quick Guide
 Leica DMi8A Quick Guide 1 Optical Microscope Quick Start Guide The following instructions are provided as a Quick Start Guide for powering up, running measurements, and shutting down Leica s DMi8A Inverted
PHOTOGRAMMETRY STEREOSCOPY FLIGHT PLANNING PHOTOGRAMMETRIC DEFINITIONS GROUND CONTROL INTRODUCTION
 PHOTOGRAMMETRY STEREOSCOPY FLIGHT PLANNING PHOTOGRAMMETRIC DEFINITIONS GROUND CONTROL INTRODUCTION Before aerial photography and photogrammetry became a reliable mapping tool, planimetric and topographic
EC-433 Digital Image Processing
 EC-433 Digital Image Processing Lecture 2 Digital Image Fundamentals Dr. Arslan Shaukat 1 Fundamental Steps in DIP Image Acquisition An image is captured by a sensor (such as a monochrome or color TV camera)
Introduction to 2-D Copy Work
 Introduction to 2-D Copy Work What is the purpose of creating digital copies of your analogue work? To use for digital editing To submit work electronically to professors or clients To share your work
Princeton University COS429 Computer Vision Problem Set 1: Building a Camera
 Princeton University COS429 Computer Vision Problem Set 1: Building a Camera What to submit: You need to submit two files: one PDF file for the report that contains your name, Princeton NetID, all the
nanovea.com PROFILOMETERS 3D Non Contact Metrology
 PROFILOMETERS 3D Non Contact Metrology nanovea.com PROFILOMETER INTRO Nanovea 3D Non-Contact Profilometers are designed with leading edge optical pens using superior white light axial chromatism. Nano
Almost all of the measurement process is automated. The images are processed and the coordinates extracted by the AutoMeasure command.
 The following report summarizes the results of the targetless 3-D measurement of a car hood. The hood was photographed and measured using Geodetic Services, Inc s (GSI) and a single projector setup (targetless
Inserting and Creating ImagesChapter1:
 Inserting and Creating ImagesChapter1: Chapter 1 In this chapter, you learn to work with raster images, including inserting and managing existing images and creating new ones. By scanning paper drawings
The Fastest, Easiest, Most Accurate Way To Compare Parts To Their CAD Data
 210 Brunswick Pointe-Claire (Quebec) Canada H9R 1A6 Web: www.visionxinc.com Email: info@visionxinc.com tel: (514) 694-9290 fax: (514) 694-9488 VISIONx INC. The Fastest, Easiest, Most Accurate Way To Compare
ECEN 4606, UNDERGRADUATE OPTICS LAB
 ECEN 4606, UNDERGRADUATE OPTICS LAB Lab 2: Imaging 1 the Telescope Original Version: Prof. McLeod SUMMARY: In this lab you will become familiar with the use of one or more lenses to create images of distant
MIT CSAIL Advances in Computer Vision Fall Problem Set 6: Anaglyph Camera Obscura
 MIT CSAIL 6.869 Advances in Computer Vision Fall 2013 Problem Set 6: Anaglyph Camera Obscura Posted: Tuesday, October 8, 2013 Due: Thursday, October 17, 2013 You should submit a hard copy of your work
Robert B.Hallock Draft revised April 11, 2006 finalpaper2.doc
 How to Optimize the Sharpness of Your Photographic Prints: Part II - Practical Limits to Sharpness in Photography and a Useful Chart to Deteremine the Optimal f-stop. Robert B.Hallock hallock@physics.umass.edu
Autodesk Advance Steel. Drawing Style Manager s guide
 Autodesk Advance Steel Drawing Style Manager s guide TABLE OF CONTENTS Chapter 1 Introduction... 5 Details and Detail Views... 6 Drawing Styles... 6 Drawing Style Manager... 8 Accessing the Drawing Style
CRISATEL High Resolution Multispectral System
 CRISATEL High Resolution Multispectral System Pascal Cotte and Marcel Dupouy Lumiere Technology, Paris, France We have designed and built a high resolution multispectral image acquisition system for digitizing
Applying Automated Optical Inspection Ben Dawson, DALSA Coreco Inc., ipd Group (987)
") Applying Automated Optical Inspection Ben Dawson, DALSA Coreco Inc., ipd Group bdawson@goipd.com (987) 670-2050 Introduction Automated Optical Inspection (AOI) uses lighting, cameras, and vision computers
Applying Automated Optical Inspection Ben Dawson, DALSA Coreco Inc., ipd Group bdawson@goipd.com (987) 670-2050 Introduction Automated Optical Inspection (AOI) uses lighting, cameras, and vision computers
WHITE PAPER. Methods for Measuring Flat Panel Display Defects and Mura as Correlated to Human Visual Perception
 Methods for Measuring Flat Panel Display Defects and Mura as Correlated to Human Visual Perception Methods for Measuring Flat Panel Display Defects and Mura as Correlated to Human Visual Perception Abstract
Chapters 1 & 2. Definitions and applications Conceptual basis of photogrammetric processing
 Chapters 1 & 2 Chapter 1: Photogrammetry Definitions and applications Conceptual basis of photogrammetric processing Transition from two-dimensional imagery to three-dimensional information Automation
Lab Report 3: Speckle Interferometry LIN PEI-YING, BAIG JOVERIA
 Lab Report 3: Speckle Interferometry LIN PEI-YING, BAIG JOVERIA Abstract: Speckle interferometry (SI) has become a complete technique over the past couple of years and is widely used in many branches of
Getting Started in Eagle Professional Schematic Software. Tyler Borysiak Team 9 Manager
 Getting Started in Eagle 7.3.0 Professional Schematic Software Tyler Borysiak Team 9 Manager 1 Executive Summary PCBs, or Printed Circuit Boards, are all around us. Almost every single piece of electrical
PhotoModeler Quick Start Guide
 PhotoModeler Quick Start Guide Start Here First Eos Systems Inc. 6th Edition Jan 2014 Copyrights & Legal 2014 Eos Systems Inc. All rights reserved. No part of this publication can be reproduced, transmitted,
AgilEye Manual Version 2.0 February 28, 2007
 AgilEye Manual Version 2.0 February 28, 2007 1717 Louisiana NE Suite 202 Albuquerque, NM 87110 (505) 268-4742 support@agiloptics.com 2 (505) 268-4742 v. 2.0 February 07, 2007 3 Introduction AgilEye Wavefront
Coded Aperture for Projector and Camera for Robust 3D measurement
 Coded Aperture for Projector and Camera for Robust 3D measurement Yuuki Horita Yuuki Matugano Hiroki Morinaga Hiroshi Kawasaki Satoshi Ono Makoto Kimura Yasuo Takane Abstract General active 3D measurement
Techniques for Suppressing Adverse Lighting to Improve Vision System Success. Nelson Bridwell Senior Vision Engineer Machine Vision Engineering LLC
 Techniques for Suppressing Adverse Lighting to Improve Vision System Success Nelson Bridwell Senior Vision Engineer Machine Vision Engineering LLC Nelson Bridwell President of Machine Vision Engineering
Introductory Photography
 Introductory Photography Basic concepts + Tips & Tricks Ken Goldman Apple Pi General Meeting 26 June 2010 Kenneth R. Goldman 1 The Flow General Thoughts Cameras Composition Miscellaneous Tips & Tricks
Advance Steel. Drawing Style Manager s guide
 Advance Steel Drawing Style Manager s guide TABLE OF CONTENTS Chapter 1 Introduction...7 Details and Detail Views...8 Drawing Styles...8 Drawing Style Manager...9 Accessing the Drawing Style Manager...9
Photography Help Sheets
 Photography Help Sheets Phone: 01233 771915 Web: www.bigcatsanctuary.org Using your Digital SLR What is Exposure? Exposure is basically the process of recording light onto your digital sensor (or film).
High Dynamic Range (HDR) Photography in Photoshop CS2
 Photography in Photoshop CS2") Page 1 of 7 High dynamic range (HDR) images enable photographers to record a greater range of tonal detail than a given camera could capture in a single photo. This opens up a whole new set of lighting
Page 1 of 7 High dynamic range (HDR) images enable photographers to record a greater range of tonal detail than a given camera could capture in a single photo. This opens up a whole new set of lighting
Time-Lapse Panoramas for the Egyptian Heritage
 Time-Lapse Panoramas for the Egyptian Heritage Mohammad NABIL Anas SAID CULTNAT, Bibliotheca Alexandrina While laser scanning and Photogrammetry has become commonly-used methods for recording historical
PERFORMANCE EVALUATIONS OF MACRO LENSES FOR DIGITAL DOCUMENTATION OF SMALL OBJECTS
 PERFORMANCE EVALUATIONS OF MACRO LENSES FOR DIGITAL DOCUMENTATION OF SMALL OBJECTS ideharu Yanagi a, Yuichi onma b, irofumi Chikatsu b a Spatial Information Technology Division, Japan Association of Surveyors,
digital film technology Resolution Matters what's in a pattern white paper standing the test of time
 digital film technology Resolution Matters what's in a pattern white paper standing the test of time standing the test of time An introduction >>> Film archives are of great historical importance as they
Film Cameras Digital SLR Cameras Point and Shoot Bridge Compact Mirror less
 Film Cameras Digital SLR Cameras Point and Shoot Bridge Compact Mirror less Portraits Landscapes Macro Sports Wildlife Architecture Fashion Live Music Travel Street Weddings Kids Food CAMERA SENSOR
A Comparison Between Camera Calibration Software Toolboxes
 2016 International Conference on Computational Science and Computational Intelligence A Comparison Between Camera Calibration Software Toolboxes James Rothenflue, Nancy Gordillo-Herrejon, Ramazan S. Aygün
GigaPan photography as a building inventory tool
 GigaPan photography as a building inventory tool Ilkka Paajanen, Senior Lecturer, Saimaa University of Applied Sciences Martti Muinonen, Senior Lecturer, Saimaa University of Applied Sciences Hannu Luodes,
Before you start, make sure that you have a properly calibrated system to obtain high-quality images.
 CONTENT Step 1: Optimizing your Workspace for Acquisition... 1 Step 2: Tracing the Region of Interest... 2 Step 3: Camera (& Multichannel) Settings... 3 Step 4: Acquiring a Background Image (Brightfield)...
6.098 Digital and Computational Photography Advanced Computational Photography. Bill Freeman Frédo Durand MIT - EECS
 6.098 Digital and Computational Photography 6.882 Advanced Computational Photography Bill Freeman Frédo Durand MIT - EECS Administrivia PSet 1 is out Due Thursday February 23 Digital SLR initiation? During
Technical Guide Technical Guide
 Technical Guide Technical Guide Introduction This Technical Guide details the principal techniques used to create two of the more technically advanced photographs in the D800/D800E catalog. Enjoy this
ROBOT VISION. Dr.M.Madhavi, MED, MVSREC
 ROBOT VISION Dr.M.Madhavi, MED, MVSREC Robotic vision may be defined as the process of acquiring and extracting information from images of 3-D world. Robotic vision is primarily targeted at manipulation
Name: Date: Math in Special Effects: Try Other Challenges. Student Handout
 Name: Date: Math in Special Effects: Try Other Challenges When filming special effects, a high-speed photographer needs to control the duration and impact of light by adjusting a number of settings, including
Relative Quantum Efficiency Measurements of the ROSS Streak Camera Photocathode. Alex Grammar
 Relative Quantum Efficiency Measurements of the ROSS Streak Camera Photocathode Alex Grammar Relative Quantum Efficiency Measurements of the ROSS Streak Camera Photocathode Alex Grammar Advised by Dr.
High Performance Imaging Using Large Camera Arrays
 High Performance Imaging Using Large Camera Arrays Presentation of the original paper by Bennett Wilburn, Neel Joshi, Vaibhav Vaish, Eino-Ville Talvala, Emilio Antunez, Adam Barth, Andrew Adams, Mark Horowitz,
Implementation of Adaptive Coded Aperture Imaging using a Digital Micro-Mirror Device for Defocus Deblurring
 Implementation of Adaptive Coded Aperture Imaging using a Digital Micro-Mirror Device for Defocus Deblurring Ashill Chiranjan and Bernardt Duvenhage Defence, Peace, Safety and Security Council for Scientific
CHAPTER 7 - HISTOGRAMS
 CHAPTER 7 - HISTOGRAMS In the field, the histogram is the single most important tool you use to evaluate image exposure. With the histogram, you can be certain that your image has no important areas that
INTRODUCTION TO VISION SENSORS The Case for Automation with Machine Vision. AUTOMATION a division of HTE Technologies
 INTRODUCTION TO VISION SENSORS The Case for Automation with Machine Vision AUTOMATION a division of HTE Technologies TABLE OF CONTENTS Types of sensors... 3 Vision sensors: a class apart... 4 Vision sensors
Understanding Infrared Camera Thermal Image Quality
 Access to the world s leading infrared imaging technology Noise { Clean Signal www.sofradir-ec.com Understanding Infared Camera Infrared Inspection White Paper Abstract You ve no doubt purchased a digital
How to Optimize the Sharpness of Your Photographic Prints: Part I - Your Eye and its Ability to Resolve Fine Detail
 How to Optimize the Sharpness of Your Photographic Prints: Part I - Your Eye and its Ability to Resolve Fine Detail Robert B.Hallock hallock@physics.umass.edu Draft revised April 11, 2006 finalpaper1.doc
Large Field of View, High Spatial Resolution, Surface Measurements
 Large Field of View, High Spatial Resolution, Surface Measurements James C. Wyant and Joanna Schmit WYKO Corporation, 2650 E. Elvira Road Tucson, Arizona 85706, USA jcwyant@wyko.com and jschmit@wyko.com
Topic 6 - Optics Depth of Field and Circle Of Confusion
 Topic 6 - Optics Depth of Field and Circle Of Confusion Learning Outcomes In this lesson, we will learn all about depth of field and a concept known as the Circle of Confusion. By the end of this lesson,
ACTION AND PEOPLE PHOTOGRAPHY
 ACTION AND PEOPLE PHOTOGRAPHY These notes are written to complement the material presented in the Nikon School of Photography Action and People Photography class. Helpful websites: Nikon USA Nikon Learn
Considerations: Evaluating Three Identification Technologies
 Considerations: Evaluating Three Identification Technologies A variety of automatic identification and data collection (AIDC) trends have emerged in recent years. While manufacturers have relied upon one-dimensional
A Laser-Based Thin-Film Growth Monitor
 TECHNOLOGY by Charles Taylor, Darryl Barlett, Eric Chason, and Jerry Floro A Laser-Based Thin-Film Growth Monitor The Multi-beam Optical Sensor (MOS) was developed jointly by k-space Associates (Ann Arbor,
Fotoman Panoramic Cameras
 Fotoman Panoramic Cameras focus mount shim Procedure for Assembly of your Fotoman Camera and Cone Assembly Please take a moment, and study the assembly diagram shown on the previous page prior to actually
1. Any wide view of a physical space. a. Panorama c. Landscape e. Panning b. Grayscale d. Aperture
 Match the words below with the correct definition. 1. Any wide view of a physical space. a. Panorama c. Landscape e. Panning b. Grayscale d. Aperture 2. Light sensitivity of your camera s sensor. a. Flash
Versatile Camera Machine Vision Lab
 Versatile Camera Machine Vision Lab In-Sight Explorer 5.6.0-1 - Table of Contents Pill Inspection... Error! Bookmark not defined. Get Connected... Error! Bookmark not defined. Set Up Image... - 8 - Location
Standard Operating Procedure
 Standard Operating Procedure Nanosurf Atomic Force Microscopy Operation Facility NCCRD Nanotechnology Center for Collaborative Research and Development Department of Chemistry and Engineering Physics The
T I P S F O R I M P R O V I N G I M A G E Q U A L I T Y O N O Z O F O O T A G E
 T I P S F O R I M P R O V I N G I M A G E Q U A L I T Y O N O Z O F O O T A G E Updated 20 th Jan. 2017 References Creator V1.4.0 2 Overview This document will concentrate on OZO Creator s Image Parameter
MINIMISING SYSTEMATIC ERRORS IN DEMS CAUSED BY AN INACCURATE LENS MODEL
 MINIMISING SYSTEMATIC ERRORS IN DEMS CAUSED BY AN INACCURATE LENS MODEL R. Wackrow a, J.H. Chandler a and T. Gardner b a Dept. Civil and Building Engineering, Loughborough University, LE11 3TU, UK (r.wackrow,
High Dynamic Range Photography
 JUNE 13, 2018 ADVANCED High Dynamic Range Photography Featuring TONY SWEET Tony Sweet D3, AF-S NIKKOR 14-24mm f/2.8g ED. f/22, ISO 200, aperture priority, Matrix metering. Basically there are two reasons
Swept-Field User Guide
 Swept-Field User Guide Note: for more details see the Prairie user manual at http://www.prairietechnologies.com/resources/software/prairieview.html Please report any problems to Julie Last (jalast@wisc.edu)
So far, I have discussed setting up the camera for
 Chapter 3: The Shooting Modes So far, I have discussed setting up the camera for quick shots, relying on features such as Auto mode for taking pictures with settings controlled mostly by the camera s automation.
Figure 1 The Raith 150 TWO
 RAITH 150 TWO SOP Figure 1 The Raith 150 TWO LOCATION: Raith 150 TWO room, Lithography area, NanoFab PRIMARY TRAINER: SECONDARY TRAINER: 1. OVERVIEW The Raith 150 TWO is an ultra high resolution, low voltage
AUTOMATED PAVEMENT IMAGING PROGRAM (APIP) FOR PAVEMENT CRACKS CLASSIFICATION AND QUANTIFICATION A PHOTOGRAMMETRIC APPROACH
 FOR PAVEMENT CRACKS CLASSIFICATION AND QUANTIFICATION A PHOTOGRAMMETRIC APPROACH") AUTOMATED PAVEMENT IMAGING PROGRAM (APIP) FOR PAVEMENT CRACKS CLASSIFICATION AND QUANTIFICATION A PHOTOGRAMMETRIC APPROACH M. Mustaffar a*, T. C. Ling b, O. C. Puan b a Surveying Unit, Faculty of Civil
AUTOMATED PAVEMENT IMAGING PROGRAM (APIP) FOR PAVEMENT CRACKS CLASSIFICATION AND QUANTIFICATION A PHOTOGRAMMETRIC APPROACH M. Mustaffar a*, T. C. Ling b, O. C. Puan b a Surveying Unit, Faculty of Civil
Abaqus Beam Tutorial (ver. 6.12)
") Abaqus Beam Tutorial (ver. 6.12) Problem Description The two-dimensional bridge structure is simply supported at its lower corners. The structure is composed of steel T-sections (E = 210 GPa, ν = 0.25)
Abaqus Beam Tutorial (ver. 6.12) Problem Description The two-dimensional bridge structure is simply supported at its lower corners. The structure is composed of steel T-sections (E = 210 GPa, ν = 0.25)
Overview. Objectives. The ultimate goal is to compare the performance that different equipment offers us in a photogrammetric flight.
 Overview At present, one of the most commonly used technique for topographic surveys is aerial photogrammetry. This technique uses aerial images to determine the geometric properties of objects and spatial
CODE V Introductory Tutorial
 CODE V Introductory Tutorial Cheng-Fang Ho Lab.of RF-MW Photonics, Department of Physics, National Cheng-Kung University, Tainan, Taiwan 1-1 Tutorial Outline Introduction to CODE V Optical Design Process
Endoscopic Inspection of Area Array Packages
 Endoscopic Inspection of Area Array Packages Meeting Miniaturization Requirements For Defect Detection BY MARCO KAEMPFERT Area array packages such as the family of ball grid array (BGA) components plastic
Standard Operating Procedure for Flat Port Camera Calibration
 Standard Operating Procedure for Flat Port Camera Calibration Kevin Köser and Anne Jordt Revision 0.1 - Draft February 27, 2015 1 Goal This document specifies the practical procedure to obtain good images
Fuzzy-Heuristic Robot Navigation in a Simulated Environment
 Fuzzy-Heuristic Robot Navigation in a Simulated Environment S. K. Deshpande, M. Blumenstein and B. Verma School of Information Technology, Griffith University-Gold Coast, PMB 50, GCMC, Bundall, QLD 9726,
One Week to Better Photography
 One Week to Better Photography Glossary Adobe Bridge Useful application packaged with Adobe Photoshop that previews, organizes and renames digital image files and creates digital contact sheets Adobe Photoshop
The History and Future of Measurement Technology in Sumitomo Electric
 ANALYSIS TECHNOLOGY The History and Future of Measurement Technology in Sumitomo Electric Noritsugu HAMADA This paper looks back on the history of the development of measurement technology that has contributed
Flash and Natural Lighting Categorical Photography Macro Photography Depth of Field Action Photography Portrait Photography Shooting RAW Photographs
 Photography Concepts Midterm Project Review your photographs up to this point. Choose six to seven categories to organize your best photographs. For example: Flash and Natural Lighting Categorical Photography
FTA SI-640 High Speed Camera Installation and Use
 FTA SI-640 High Speed Camera Installation and Use Last updated November 14, 2005 Installation The required drivers are included with the standard Fta32 Video distribution, so no separate folders exist
GlassSpection User Guide
 i GlassSpection User Guide GlassSpection User Guide v1.1a January2011 ii Support: Support for GlassSpection is available from Pyramid Imaging. Send any questions or test images you want us to evaluate