Lesson 12-1 Stem-and-Leaf Plots Lesson 12-2 Measures of Variation Lesson 12-3 Box-and-Whisker Plots Lesson 12-4 Histograms Lesson 12-5 Selecting an
|
|
|
- Kelley Rice
- 5 years ago
- Views:
Transcription
1
2 Lesson 12-1 Stem-and-Leaf Plots Lesson 12-2 Measures of Variation Lesson 12-3 Box-and-Whisker Plots Lesson 12-4 Histograms Lesson 12-5 Selecting an Appropriate Display Lesson 12-6 Misleading Graphs Lesson 12-7 Simple Probability Lesson 12-8 Counting Outcomes Lesson 12-9 Permutations and Combinations Lesson Probability of Composite Events
3 Five-Minute Check (over Chapter 11) Main Ideas and Vocabulary Example 1: Draw a Stem-and-Leaf Plot Example 2: Interpret Data Example 3: Real-World Example
4 Display data in stem-and-leaf plots. Interpret data in stem-and-leaf plots. stem-and-leaf plot stems leaves back-to-back stem-and-leaf plot

5 Draw a Stem-and-Leaf Plot FOOD Display the data in a stem-and-leaf plot.
6 Draw a Stem-and-Leaf Plot Step 1 Find the least and the greatest number. Then identify the greatest place value digit in each number. In this case, thousands The least number has 2 in the thousands place The greatest number has 3 in the thousands place
7 Draw a Stem-and-Leaf Plot Step 2 Step 3 Stem 2 3 Leaf Draw a vertical line and write the stems 2 and 3 to the left of the line. Write the leaves to the right of the line, with the corresponding stem. For example, for 2400, write 4 to the right of
8 Draw a Stem-and-Leaf Plot Step 4 Rearrange the leaves so they are ordered from least to greatest. Then include a key or an explanation. Stem Leaf The key tells what 2 4 = 2400 lb the stems and leaves represent.
9 Draw a Stem-and-Leaf Plot Answer: Stem Leaf = 2400 lb
10 SPEED Display the following speeds given in miles per hour in a stem-and-leaf plot
11 A. Stem Leaf B = 64 mph C. Stem Leaf D Stem Stem Leaf = 64 mph Leaf A. A B. B C. C D. D = 64 mph = 64 mph A 0% 0% 0% 0% B C D
12 MEXICO The stemand-leaf plot lists the percent of people in each state in 2004 that were born in Mexico, rounded to the nearest whole number. A. What interval contains the most percentages? Answer: Most of the data occurs in the 0-9 interval. Interpret Data Stem Leaf = 31%
13 MEXICO The stemand-leaf plot lists the percent of people in each state in 2004 that were born in Mexico, rounded to the nearest whole number. B. What is the greatest percent of people living in one U.S. state that were born in Mexico? Answer: 74% Interpret Data Stem Leaf = 31%
14 MEXICO The stemand-leaf plot lists the percent of people in each state in 2004 that were born in Mexico, rounded to the nearest whole number. C. What is the median percent of people living in one U.S. state that were born in Mexico? Answer: 22.5% Interpret Data Stem Leaf = 31%
15 ALLOWANCE The stem-and-leaf plot lists the amount of allowance students are given each month. A. In which interval do most of the monthly allowances occur? A. 0-9 interval B interval C interval D interval Stem Leaf = 31% 1. A 2. B 3. C 4. D 0% A B C D
16 A. $0 B. $5 C. $50 D. $495 Stem ALLOWANCE The stem-and-leaf plot lists the amount of allowance students are given each month. B. What is the difference between the least and greatest monthly allowance given? Leaf = 31% 1. A 2. B 3. C 4. D 0% A B C D
17 ALLOWANCE The stem-and-leaf plot lists the amount of allowance students are given each month. C. What is the median monthly allowance given? A. $25 and $45 B. $30 C. $30.8 D. $32 Stem Leaf = 31% 1. A 2. B 3. C 4. D 0% A B C D
18 AGRICULTURE The yearly production of honey in California and Florida is shown for the years 2000 to 2004, in millions of pounds. (Source: USDA) A. Which state produces the most honey? California 2 3 = 32 million lb Florida = 20 million lb Answer: California
19 AGRICULTURE The yearly production of honey in California and Florida is shown for the years 2000 to 2004, in millions of pounds. (Source: USDA) B. Which state has the most varied production? Explain. California 2 3 = 32 million lb Florida = 20 million lb Answer: California; the data are more spread out.
20 EXAM SCORES The exam score earned on the first test in a particular class is shown for male and female students. A. Which group of students had the higher test scores? Male Female = = 74 A. males B. females C. Both groups had an equally high score. D. cannot be determined 0% 1. A 2. B 3. C 4. D A B C D
21 EXAM SCORES The exam score earned on the first test in a particular class is shown for male and female students. B. Which group of students had more varied test scores? Male Female = = 74 A. males B. females C. Both groups had equally varied scores. D. cannot be determined 0% 1. A 2. B 3. C 4. D A B C D
22
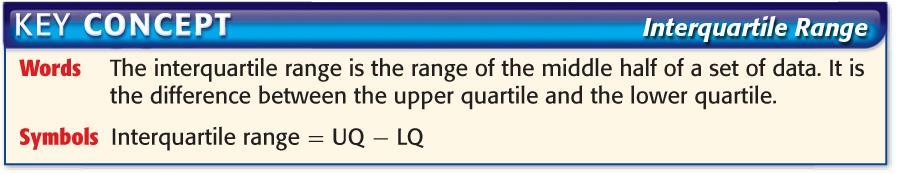
23 Five-Minute Check (over Lesson 12-1) Main Ideas and Vocabulary Example 1: Range Key Concept: Interquartile Range Example 2: Interquartile Range and Outliers Example 3: Real-World Example
24 Find measures of variation. Use measures of variation to interpret and compare data. measures of variation range quartiles lower quartile upper quartile interquartile range outlier
25 Range A. Find the range of the set of data. {$79, $42, $38, $51, $63, $91} The greatest value is $91, and the least value is $38. Answer: The range is $91 $38 or $53.
26 Range B. Find the range of the set of data. Stem Leaf = 35 The greatest value is 59, and the least value is 33. Answer: The range is or 26.
27 A. Find the range of the set of data. {14, 37, 82, 45, 24, 10, 75} A. 61 B. 65 C. 68 D. 72 A B A. A B. B 0% 0% 0% 0% C. C C D. D D
28 B. Find the range of the set of data. A. 27 B. 20 C. 18 D. 12 Stem Leaf = 68 A A. A B. B 0% 0% 0% 0% B C. C D. D C D
29
30 Interquartile Range and Outliers A. Find the interquartile range and any outliers for {38, 40, 32, 34, 36, 45, 33} Step 1 Step 2 List the data from least to greatest. Then find the median. Find the upper and lower quartiles. lower half upper half LQ median UQ
31 Interquartile Range and Outliers Answer: The interquartile range is or 7.
32 Interquartile Range and Outliers B. Find the interquartile range and any outliers for {2, 49, 17, 14, 14, 22, 15, 32, 24, 25} Step 1 Step 2 List the data from least to greatest. Then find the median. Find the upper and lower quartiles. lower half upper half median LQ UQ or 19.5
33 Interquartile Range and Outliers Step 3 Find the limits for the outliers. Multiply the interquartile range, 11, by = 16.5 Subtract 16.5 from the lower quartile = 2.5 Add 16.5 to the upper quartile = 41.5 The limits for the outliers are 2.5 and There are no values less than 2.5. One value, 49, is greater than Answer: So, 49 is the one outlier.
34 Find the interquartile range and any outliers. {12, 18, 25, 31, 23, 19, 16, 22, 28, 32} A. interquartile range: 10, outliers: none B. interquartile range: 15, outliers: 3.43 C. interquartile range: 20, outliers: none D. interquartile range: 24, outliers: 12 0% 1. A 2. B 3. C 4. D A B C D
35 LAND USE The urban land in certain western and eastern states is listed below as the percent of each state s total land, rounded to the nearest percent. A. What is the median percent of urban land use for each region? Western States = 2% Eastern States = 27% Answer: The median percent of urban land use for the western states is 1%. The median percent of urban land use for the eastern states is 9%.
36 LAND USE The urban land in certain western and eastern states is listed below as the percent of each state s total land, rounded to the nearest percent. B. Compare the range for each set of data. Western States Eastern States = 2% = 27% Answer: The range for the west is 5% 0% or 5%, and the range for the east is 35% 3% or 32%. The percents of urban land use in the east vary more.
37 A. EXERCISE The hours per week spent exercising for teenagers and people in their twenties are listed in the stem-and-leaf plot. What is the median time spent exercising for each group? Teens A. teenagers: 5 hr; twenties: 12 hr B. teenagers: 8.9 hr; twenties: 13.9 hr C. teenagers: 15 hr; twenties: 16 hr D. teenagers: 21 hr; twenties: 28 hr 1. A 2. B 3. C 4. D Twenties = 13 hr 1 5 = 15 hr 0% A B C D
38 Teens Twenties B. EXERCISE The hours per week spent exercising for teenagers and people in their twenties are listed in the stem-and-leaf plot. Compare the range for each set of data A. teenagers: 12 hr; twenties: 28 hr The hours of the twenties group vary more. 3 1 = 13 hr 1 5 = 15 hr B. teenagers: 15 hr; twenties: 16 hr The hours of the twenties group vary only slightly more. C. teenagers: 22.5 hr; twenties: 24 hr The hours of the twenties group vary only slightly more. D. teenagers: 5 hr; twenties: 12 hr The hours of the twenties group vary more. 1. A 2. B 3. C 4. D 0% A B C D
39
40 Five-Minute Check (over Lesson 12-2) Main Ideas and Vocabulary Example 1: Draw a Box-and-Whisker Plot Example 2: Interpret Data Example 3: Real-World Example
41 Display data in a box-and-whisker plot. Interpret data in a box-and-whisker plot. box-and-whisker plot

42 JOBS The projected number of employees in 2008 in the fastest-growing occupations is shown. Display the data in a box-and-whisker plot. Step 1 Find the least and greatest number. Then draw a number line that covers the range of the data. Draw a Box-and-Whisker Plot
43 Draw a Box-and-Whisker Plot Step 2 lower extreme: 44 Find the median, the extremes, and the upper and lower quartiles. Mark these points above the number line. LQ: median: 510 UQ: 1024 upper extreme: 1194
44 Draw a Box-and-Whisker Plot Step 3 Draw a box and the whiskers. The box contains the UQ and the LQ The whiskers extend from each quartile to the extreme data points. Answer:
45 TRANSPORTATION The data listed below represents the time, in minutes, required for students to travel from home to school each day. Display the data in a box-and-whisker plot A. B. C. D. 0% 0% 0% 0% A. A B. B C. C D. D A B C D
46 Interpret Data A. WEATHER The box-and-whisker plot below shows the average percent of sunny days per year for selected cities in each state. Half of the selected cities have an average of sunny days under what percent? Answer: Half of the selected cities have an average percent of sunny days under 56%.
47 Interpret Data B. WEATHER The box-and-whisker plot below shows the average percent of sunny days per year for selected cities in each state. What does the length of the box in the box-and-whisker plot tell about the data? Answer: The length of the box is short. This tells us that the data values are clustered together.
48 A. RETAIL The box-and-whisker plot below shows the average amount spent per month on clothing. Half of the monthly expenditures on clothing are under what amount? A. $275 B. $ A 2. B 3. C 4. D 0% C. $80 A B C D D. $55
49 B. RETAIL The box-and-whisker plot to the right shows the average amount spent per month on clothing. What does the length of the box in the box-and-whisker plot tell about the data? A. The values of the data in the lower half are very spread out. B. The values of the data in the upper half are very concentrated. C. The values of the data in the middle 50% are very spread out. D. The values of the data in the middle 50% are concentrated. 1. A 2. B 3. C 4. D 0% A B C D
50 TREES The average maximum height, in feet, for selected evergreen trees and deciduous trees is displayed. How do the heights of evergreen trees compare with the heights of deciduous trees?
51 Most deciduous trees range in height between 25 and 60 feet. However, some are as tall as 80 feet. Most evergreen trees range in height between 50 and 70 feet. However, some are as tall as 80 feet. Answer: Most evergreen trees are taller than most deciduous trees.
52 CARS The average gas mileage, in miles per gallon, for selected compact cars and sedans is displayed. How do the gas mileages of compact cars compare with the gas mileages for sedans? A. The gas mileage of compact cars and sedans is about the same. B. Most compact cars have a lower gas mileage than most sedans. C. Most compact cars have a higher gas mileage than most sedans. D. The median gas mileage for compact cars is lower than the median gas mileage for sedans. 1. A 2. B 3. C 4. D 0% A B C D
53
54 Five-Minute Check (over Lesson 12-3) Main Ideas and Vocabulary Example 1: Draw a Histogram Example 2: Interpret Data Example 3: Real-World Example
55 Display data in a histogram. Interpret data in a histogram. histogram

56 Draw a Histogram TOURISM The frequency table shows the number of overseas visitors to the top 15 U.S. cities in Display the data in a histogram.
57 Draw a Histogram Step 1 Draw and label a horizontal and vertical axis. Include a title.
58 Draw a Histogram Step 2 Show the intervals from the frequency table on the horizontal axis and an interval of 2 on the vertical axis.

59 Draw a Histogram Step 3 For each interval, draw a bar whose height is given by the frequency. Answer:

60 CUSTOMERS The frequency table shows the number of daily customers a new grocery store has during its first 30 days in business. Display the data in a histogram.


61 A. B. A. A B. B C. C D. D C. D. 0% 0% 0% 0% A B C D
62 Interpret Data A. ELEVATIONS Use the histogram. How many states have highest points with elevations at least 3751 meters? Since 11 states have elevations in the range and 1 state has elevations in the range, or 12 states have highest points with elevations at least 3751 meters. Answer: 12

63 Interpret Data B. ELEVATIONS Use the histogram. Is it possible to tell the height of the tallest point? Answer: No, you can only tell that the highest point is between 5001 and 6250 meters.
64 A. SPEED Use the histogram. How many drivers had a speed of at least 70 miles per hour? A. 3 B. 5 C A 2. B 3. C 4. D 0% A B C D D. 9
65 B. SPEED Use the histogram. Is it possible to tell the lowest speed driven? A. Yes, the lowest speed was 40 miles per hour. B. Yes, the lowest speed was 45 miles per hour. C. Yes, the lowest speed was 49 miles per hour. D. No, you can only determine that the lowest speed was between 40 and 49 miles per hour. 1. A 2. B 3. C 4. D 0% A B C D

66 EMPLOYMENT Use the histograms. Which business sector has more states with between 1,001,000 and 3,000,000 employees? Answer: Services

67 EATING OUT Use the histograms. Which coast has more people spending at least $60 weekly? 0% A. East Coast B. West Coast C. Both have an equal number of people spending at least $60 weekly. D. cannot be determined 1. A 2. B 3. C 4. D A B C D
68
69 Five-Minute Check (over Lesson 12-4) Main Idea Concept Summary: Statistical Graphs Example 1: Select an Appropriate Display Example 2: Standardized Test Example
70 Select an appropriate display for a set of data.

71 Interactive Lab: Bar Graphs and Line Graphs

72 A. DESSERT Danielle took a survey of her classmates preferences for desserts. Danielle s survey revealed that 46% of her classmates like pies, 32% like ice cream, 9% like cake, 7% like candy, and 6% don t have a preference. Select an appropriate type of display for this situation. Then make the display with or without the use of technology. Answer: A circle graph would compare the parts of the data to the whole. Select an Appropriate Display
73 B. LACROSSE Juan compares the heights of the players on the two lacrosse teams. Juan s team has the following players with heights, in inches: 61, 60, 58, 59, 57, 67, 58, 60, 60, 65, 61, and 61. The rival team has the following players, with heights, in inches: 62, 70, 65, 60, 60, 58, 66, 63, 61, 57, 67, and 64. Select an appropriate type of display for this situation. Then make the display with or without the use of technology. A back-to-back stemand-leaf plot would condense and compare the data. Answer: Select an Appropriate Display Juan s Team Rival = 57 inches


74 A. SPORTS Out of 40 athletes surveyed, 12 play basketball and 18 play soccer. Of those athletes who play either sport, 5 play both sports. Select an appropriate type of display for this situation. Then make the display with or without the use of technology. A. B. C. D. A A. A B. B C. C 0% 0% 0% 0% D. D B C D
75 B. TEST SCORES Ms. Slater compares the scores of the students in her two math classes. The morning math class earned the following scores on the last test: 98, 82, 76, 94, 65, 82, 78, 98, 86, 93, 74, 96, 73, 87, and 81. The afternoon math class earned the following scores: 86, 93, 75, 89, 100, 84, 86, 97, 64, 95, 92, 85, 79, 90, and 85. Select an appropriate type of display for this situation. Then make the display with or without the using technology.


76 A. B. C. D. Morning class Afternoon class = 56 A A. A B. B C. C 0% 0% 0% 0% D. D B C D

77 Which graph would best represent the data if you want to show relationships among sets of data? A line graph B Venn diagram C bar graph D circle graph Answer: B
78 Which graph would best represent the data if you want to show how many times each number occurs in the data? A. box-and-whisker plot B. line plot C. line graph D. bar graph 0% 1. A 2. B 3. C 4. D A B C D
79
80 Five-Minute Check (over Lesson 12-5) Main Ideas Example 1: Real-World Example Example 2: Accuracy of Predictions and Conclusions
81 Recognize when graphs are misleading. Evaluate predictions and conclusions based on data analysis.
82 A. FOOD The graphs show the decrease in the price of lemons. Why do the graphs look different? Answer: The horizontal scales differ.
83 B. FOOD The graphs show the decrease in the price of lemons. Which graph appears to show a more rapid decrease in the price of lemons after 2002? Explain. Answer: Graph B; the slope of the line from 2002 to 2004 is steeper in Graph B.
84 A. ATTENDANCE The graphs show the increase in attendance at a public elementary school. Why do the graphs look different? A. The vertical scales differ. B. The vertical axis does not include zero. C. There are no labels on either side. D. The horizontal scales differ. A 0% 0% 0% 0% B C D A. A B. B C. C D. D
85 B. ATTENDANCE The graphs show the increase in attendance at a public elementary school. Which graph appears to show a more rapid increase in attendance between 2002 and 2003? Explain. A. Graph A; The slope of the line from 2002 to 2003 is steeper in graph A. B. Graph B; The slope of the line from 2002 to 2003 is steeper in graph B. C. Both graphs show the same increase from 2002 to A B A. A B. 0% B 0% 0% 0% C. C C D. D D D. cannot be determined

86 Accuracy of Predictions and Conclusions INTERNET The graph shows the percent of Internet use in different age groups. According to the graph, more 18- to 24-year-olds are using the internet than the other age groups. Determine whether this statement is accurate. Justify your reasoning. Answer: No, the statement is not accurate. Even though the age group has the greatest percent of users, the other age groups span a greater age range and thus have more people.

87 WEATHER According to the graph, the difference between the number of days with temperatures 20 F 49 F and 50 F 79 F is the same as the difference between 50 F 79 F and 80 F 99 F. Determine whether this statement is accurate. Justify your reasoning.
88 A. Yes, the bars for the 20 F 49 F interval and the 50 F 79 F interval are lines apart and so are the bars for the 50 F 79 F 0% interval and the 80 F 99 F interval. B. No, the difference between the number of days in the 20 F 49 F interval and the 50 F 79 F interval is 25 while the difference between the 50 F 79 F interval and the 80 F 99 F interval is 20. C. Yes, the intervals on the horizontal axis are all evenly spaced A B C D 1. A 2. B 3. C 4. D D. Yes, the numbers on the vertical axis are all evenly spaced.
89
90 Five-Minute Check (over Lesson 12-6) Main Ideas and Vocabulary Key Concept: Probability Example 1: Find Probability Example 2: Find Probability Example 3: Find Experimental Probability Example 4: Make a Prediction
91 Find the probability of simple events. Use a sample to predict the actions of a larger group. outcomes simple event probability sample space theoretical probability experimental probability

92 BrainPOP: Probability of Events

93 Find Probability Suppose a number cube is rolled. What is the probability of rolling a 4 or a 5? There are 2 numbers on the number cube that are a 4 or a 5: 4 and 5. There are 6 possible outcomes: 1, 2, 3, 4, 5, and 6. Answer:
94 Suppose a number cube is rolled. What is the probability of rolling a number that is divisible by 3? A. AnsA B. AnsB C. AnsC D. AnsD A. A B. B C. C D. D A 0% 0% 0% 0% B C D

95 Find Probability Suppose that two number cubes are rolled. Find the probability of rolling two identical numbers. Make a table showing the sample space when rolling two number cubes.
96 Find Probability There are 6 outcomes in which the two numbers are identical. Answer:
97 Suppose that two number cubes are rolled. Find the probability of rolling two numbers whose sum is 8. A. B. 0% C. D. 1. A 2. B 3. C 4. D A B C D

98 Find Experimental Probability A coin was tossed 40 times and heads came up 18 times. Find the experimental probability of getting tails for this experiment. Answer:
99 BASKETBALL Brian is shooting baskets with a basketball. He makes 13 shots and misses 9 shots. Determine the experimental probability of Brian making a shot. A. 0% B. C. D. 1. A 2. B 3. C 4. D A B C D
100 Make a Prediction SPORTS Miss Newman surveyed her class to see which sports they preferred watching. 44% preferred football, 28% basketball, 20% soccer, and 8% tennis. Out of 560 students in the entire school, how many would you expect to say they prefer watching basketball? The total number of students is 560. So, 560 is the base. The percent is 28%. What number is 28% of 560? Write the percent proportion. Let a represent the part.
101 Make a Prediction part base percent Answer: You can expect about 157 students to say they prefer watching basketball.
102 COLORS The students in an art class were surveyed about their favorite color. 32% preferred blue, 29% preferred red, 23% preferred yellow, and 16% preferred green. Out of 450 students in the entire school, how many would you expect to say they prefer red? A. about 6 B. 29 C. about 131 D. 144 A A. A B. B 0% 0% C. C 0% 0% D. D B C D
103
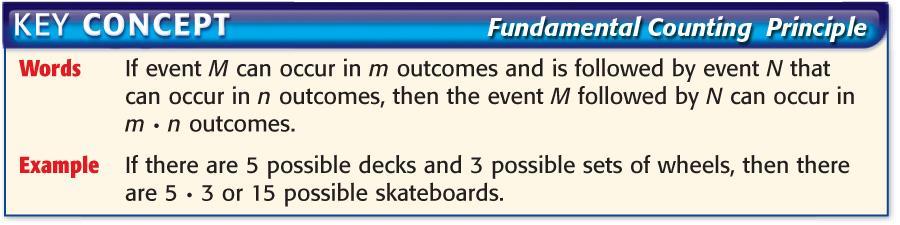
104 Five-Minute Check (over Lesson 12-7) Main Ideas and Vocabulary Example 1: Use a Tree Diagram to Count Outcomes Key Concept: Fundamental Counting Principle Example 2: Use the Fundamental Counting Principle Example 3: Find Probabilities
105 Use tree diagrams or the Fundamental Counting Principle to count outcomes. Use the Fundamental Counting Principle to find the probability of an event. tree diagram Fundamental Counting Principle
106 Use a Tree Diagram to Count Outcomes GREETING CARDS A greeting card maker offers three birthday greetings in four possible colors, as shown below. Draw a tree diagram to find the number of cards that can be made from three greeting choices and four color choices? Greeting Humorous Traditional Romantic Color Blue Green Orange Red
107 You can draw a diagram to find the number of possible cards. Answer: There are 12 possible cards. Use a Tree Diagram to Count Outcomes
108 ICE CREAM An ice cream parlor offers a special on one-scoop sundaes with one topping. The ice cream parlor has 5 different flavors of ice cream and three different choices for toppings. How many different sundaes can be made? A. 3 B. 5 C. 8 D. 15 A B A. A B. B 0% 0% 0% 0% C. C D. D C D
109
110 Use the Fundamental Counting Principle CELL PHONES A cell phone company offers 3 payment plans, 4 styles of phones, and 6 decorative phone wraps. How many phone options are available? Use the Fundamental Counting Principle. The number of types of payment plans times the number of styles of phones times the number of decorative wraps equals the number of possible outcomes = 72 Answer: There are 72 possible phone options.
111 SANDWICHES A sandwich shop offers 4 choices for bread, 5 choices for meat, and 3 choices for cheese. If a customer can make one choice from each category, how many different sandwiches can be made? A. 60 B. 12 C. 5 D. 3 0% 1. A 2. B 3. C 4. D A B C D
112 Find Probabilities A. Henry rolls a number cube and tosses a coin. What is the probability that he will roll a 3 and toss heads? First find the number of outcomes. Number Cube Coin H T H T H T H T H T H T
113 Find Probabilities There are 12 possible outcomes. Look at the tree diagram. There is one outcome that has a 3 and a head.
114 Find Probabilities B. What is the probability of winning a raffle where the winning number is made up of 6 numbers from 1 to 50 chosen at random? Assume all numbers are eligible each draw. First, find the number of possible outcomes. Use the Fundamental Counting Principle. There are 50 choices for the first number, 50 choices for the second number, 50 choices for the third number, and so on = 15,625,000,000
115 Find Probabilities There are 15,625,000,000 possible outcomes. There is 1 winning number.
116 A. Bob rolls a number cube and tosses a coin. What is the probability that he will roll an odd number and toss tails? A. 0% B. C. D A 2. B 3. C 4. D A B C D
117 B. What is the probability of winning a lottery where the winning number is made up of 5 numbers from 1 to 20 chosen at random? Assume all numbers are eligible each draw. A. 0% B. C. D. 1. A 2. B 3. C 4. D A B C D
118
119 Five-Minute Check (over Lesson 12-8) Main Ideas and Vocabulary Example 1: Use a Permutation Example 2: Use a Combination Example 3: Real-World Example
120 Use permutations. Use combinations. permutation combination
121 Use a Permutation A. TRAVEL The Reyes family will visit a complex of theme parks during their summer vacation. They have a four-day pass good at one park per day; they can choose from seven parks. How many different ways can they arrange their vacation schedule? The order in which they visit the parks is important. This arrangement is a permutation. 7 parks Choose 4 p(7,4) = = choices for the 1 st day 6 choices for the 2 nd day 5 choices for the 3 rd day 4 choices for the 4 th day Answer: There are 840 possible arrangements.
122 Use a Permutation B. NUMBERS How many five-digit numbers can be made from the digits 2, 3, 4, 5, 8, and 9 if each digit is used only once? p(5,5) = = choices for the 1 st digit 4 choices for the 2 nd digit 3 choices for the 3 rd digit 2 choices for the 4 th digit 1 choice remains for the 5 th digit Answer: 720
123 A. TRACK AND FIELD How many ways can five runners be arranged on a three-person relay team? A. 10 B. 30 C. 60 D. 120 A B A. A B. B 0% 0% 0% 0% C. C C D. D D
124 B. How many six-digit numbers can be made from the digits 1, 2, 3, 4, 5, and 6 if each digit is used only once? A. 6 B. 720 C D. 46,656 A B A. A B. B 0% 0% 0% 0% C. C C D. D D
125 Use a Combination HATS How many ways can a window dresser choose two hats out of a fedora, a bowler, and a sombrero? Since order is not important, this arrangement is a combination. First, list all of the permutations of the types of hats taken two at a time. Then cross off arrangements that are the same as another one. FB FS BF BS SF SB FB and BF are not different in this case, so cross off one of them.
126 Use a Combination There are only three different arrangements. Answer: There are three ways to choose two hats from three possible hats.
127 Use a Combination B. PENS How many ways can a customer choose two pens from a purple, orange, green, red, or black pen? The arrangement is a combination because order is not important. First, list all of the permutations. Then cross off the arrangements that are the same. PO PG PR PB OP OG OR OB GP GO GR GB RP RO RG RB BP BO BG BR Answer: There are 10 ways to choose two pens from five possible colored pens.
128 A. SHIRTS How many ways can two shirts be selected from a display having a red shirt, a blue shirt, a green shirt, and a white shirt? A. 4 B. 6 C. 12 D. 24 0% 1. A 2. B 3. C 4. D A B C D
129 B. BOOKS How many ways can a student select 2 books from a bookshelf containing a mystery, a biography, a non-fiction book, a fantasy book, and a novel? A. 10 B. 20 C. 60 D % 1. A 2. B 3. C 4. D A B C D

130 TENNIS The players listed are playing singles in a tennis tournament. If each player plays every other player once, what is the probability that Kyle plays in the first match? Explore Plan The order in which the players are selected is not important, so this is a combination. Find the combination of 8 people taken 2 at a time. This will give you the number of matches that take place during the tournament. Then find how many of the matches involve Kyle.
131 Solve Check List all the 2-player matches in the tournament. Check to see that there are 28 matches.
132 Answer:

133 VOLLEYBALL The teams listed are playing in a volleyball tournament. If each team plays every other team once, what is the probability that the Lions play in the first game? A. B. 1. A 2. B 3. C 0% 4. D C. A B C D D.
134
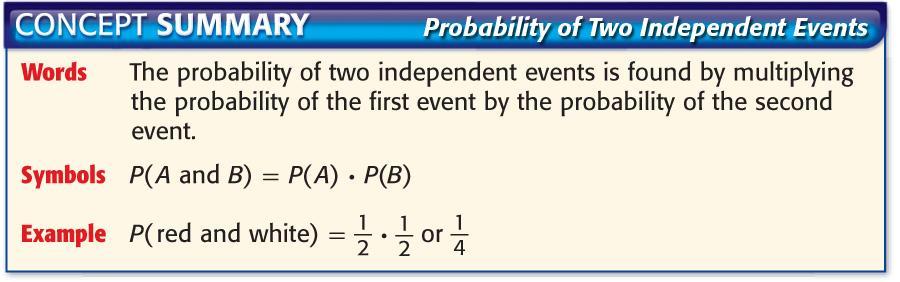
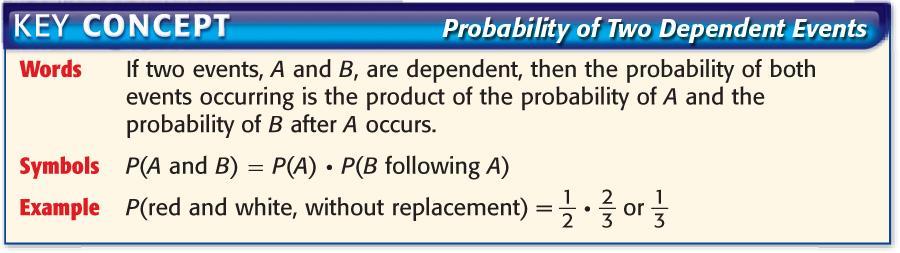
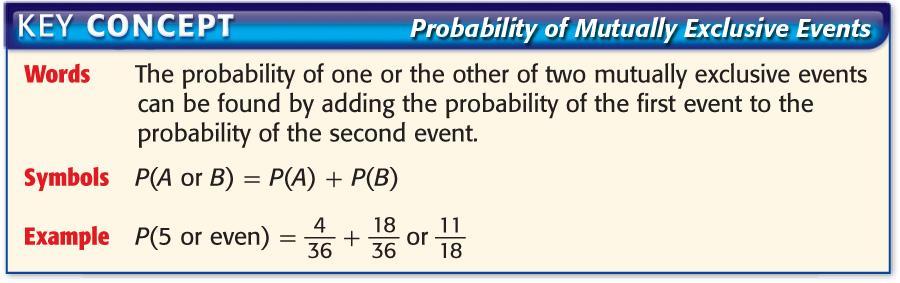
135 Five-Minute Check (over Lesson 12-9) Main Ideas and Vocabulary Concept Summary: Probability of Two Independent Events Example 1: Probability of Independent Events Key Concept: Probability of Two Dependent Events Example 2: Probability of Dependent Events Key Concept: Probability of Mutually Exclusive Events Example 3: Probability of Mutually Exclusive Events
136 Find the probability of independent and dependent events. Find the probability of mutually exclusive events. composite events independent events dependent events mutually exclusive events
137
138 Probability of Independent Events GAMES In a popular number cube game, the highest possible score in a single turn is a roll of five of a kind. After rolling one five of a kind, every other five of a kind you roll earns 100 points. What is the probability of rolling two five of a kinds in a row?


139 Probability of Independent Events
140 GAMES Find the probability of rolling doubles four times in a row when rolling a pair of number cubes. A. B. C. D. A. A B. B C. C D. D A 0% 0% 0% 0% B C D
141

142 Probability of Dependent Events CLOTHES Charlie s clothes closet contains 3 blue shirts, 10 white shirts, and 7 striped shirts. What is the probability that Charlie will reach in and randomly select a white shirt followed by a striped shirt?
143 COOKIES A plate has 6 chocolate chip cookies, 4 peanut butter cookies, and 5 sugar cookies. What is the probability of randomly selecting a chocolate chip cookie followed by a sugar cookie? A. 0% B. C. 1. A 2. B 3. C 4. D D. A B C D
144
145 Probability of Mutually Exclusive Events You draw a card from a standard deck of playing cards. What is the probability that the card will be a black nine or any heart? The events are mutually exclusive because the card cannot be both a black nine and a heart at the same time. P(black nine or heart) = P(black nine) + P(heart)
146 Probability of Mutually Exclusive Events
147 CARDS You draw a card from a standard deck of playing cards. What is the probability that the card will be a club or a red face card? A. 0% B. C. D. 1. A 2. B 3. C 4. D A B C D
148


149 Five-Minute Checks Image Bank Math Tools Bar Graphs and Line Graphs Probability of Events
150 Lesson 12-1 (over Chapter 11) Lesson 12-2 (over Lesson 12-1) Lesson 12-3 (over Lesson 12-2) Lesson 12-4 (over Lesson 12-3) Lesson 12-5 (over Lesson 12-4) Lesson 12-6 (over Lesson 12-5) Lesson 12-7 (over Lesson 12-6) Lesson 12-8 (over Lesson 12-7) Lesson 12-9 (over Lesson 12-8) Lesson (over Lesson 12-9)
151 To use the images that are on the following three slides in your own presentation: 1. Exit this presentation. 2. Open a chapter presentation using a full installation of Microsoft PowerPoint in editing mode and scroll to the Image Bank slides. 3. Select an image, copy it, and paste it into your presentation.

152

153

154
155 (over Chapter 11) Find the volume of a cylinder having radius 2.3 cm and height 9 cm. If necessary, round to the nearest tenth. A cm 3 B cm 3 C cm 3 D cm 3 A B A. A B. B 0% 0% 0% 0% C. C C D. D D
156 (over Chapter 11) Find the volume of a rectangular pyramid having length 12 in., width 8 in., and height 11 in. A. 62 in 3 B. 352 in 3 C. 325 in 3 D in 3 0% 1. A 2. B 3. C 4. D A B C D

157 (over Chapter 11) Find the surface area of the solid shown in the figure. If necessary, round to the nearest tenth. A ft 2 B ft 2 C ft 2 0% 1. A 2. B 3. C 4. D D ft 2 A B C D

158 (over Chapter 11) Find the surface area of the solid shown in the figure. If necessary, round to the nearest tenth. A in 2 B in 2 C in 2 D in 2 A 0% 0% 0% 0% B C D A. A B. B C. C D. D
159 (over Chapter 11) A model for a new movie theatre is 55 centimeters tall. On the model, 1 centimeter represents 5 meters. How tall is the actual theatre? A. 11 m 0% B. 55 m C. 175 m D. 275 m 1. A 2. B 3. C 4. D A B C D
160 (over Chapter 11) A cone and a cylinder have the same radius and the same height. The volume of the cone is 48 cm 3. What is the volume of the cylinder? A. 48 cm 3 0% B. 96 cm 3 C. 144 cm 3 1. A 2. B 3. C 4. D D. 192 cm 3 A B C D
161 (over Lesson 12-1) The table displays information about the tallest buildings. Identify the stem-and-leaf plot that represents the data. A. B. C. D. A. A B. B C. C D. D A 0% 0% 0% 0% B C D
162 (over Lesson 12-1) The table displays information about the tallest buildings. How many buildings have 32 stories? A. 2 buildings B. 3 buildings C. 5 buildings 0% 1. A 2. B 3. C 4. D D. 7 buildings A B C D
163 (over Lesson 12-1) The table displays information about the tallest buildings. How many buildings have more than 40 stories? A. 3 buildings B. 4 buildings C. 5 buildings 0% 1. A 2. B 3. C 4. D D. 6 buildings A B C D
164 (over Lesson 12-1) The table displays information about the tallest buildings. What is the median number of stories for the data set? A. 40 stories B. 41 stories C. 42 stories D. 43 stories A 0% 0% 0% 0% B C D A. A B. B C. C D. D
165 (over Lesson 12-1) Which stem-and-leaf plot key represents the number 108? A. 1 8 B C D % 1. A 2. B 3. C 4. D A B C D
166 (over Lesson 12-2) Refer to the table. Find the interquartile range for the highest average annual precipitation (HAAP) and for the elevation (El). A ; B. 205; C ; D. 211; 5072 A 0% 0% 0% 0% B C D A. A B. B C. C D. D

167 (over Lesson 12-2) Refer to the table. For which set of data is the middle data more clustered about the median? Which choice provides a correct explanation? A. The data for the average annual precipitation is more clustered around the median because the interquartile range is smaller B. The data for the elevation is more clustered around the median because the interquartile range is high. C. The data for the elevation is more clustered around the median because the interquartile range is high. D. The data for the avarage annual precipitation is more clustered around the median because the interquartile range is high. 1. A 2. B 3. C 4. D 0% A B C D
168 (over Lesson 12-2) Which is the least measure for the data set {73, 81, 60, 94, 48, 57, 68}? A. range 0% B. median C. lower quartile 1. A 2. B 3. C 4. D D. interquartile range A B C D
169 (over Lesson 12-3) Identify the box-and-whisker plot for {$125, $93, $111, $101, $125, $115, $90, $150, $99, $120}. A. B. C. D. A B A. A B. B C. C 0% 0% 0% 0% D. D C D
170 (over Lesson 12-3) Use the box-and-whisker plot. What percent of the data is between 20 F and 35 F? A. 15 percent 0% B. 20 percent C. 35 percent D. 50 percent 1. A 2. B 3. C 4. D A B C D
171 (over Lesson 12-3) Use the box-and-whisker plot. Which option describes the data for January? A. The low daily temperatures for January ranged from 0 F to 50 F with most between 20 F and 35 F. B. The low daily temperatures for January ranged from 20 F to 45 F with most between 20 F and 40 F. C. The low daily temperatures for January ranged from 10 F to 40 F with most between 20 F and 35 F. D. The low daily temperatures for January ranged from 10 F to 40 F with most between 20 F and 30 F. 0% 1. A 2. B 3. C 4. D A B C D
172 (over Lesson 12-3) Which does the number 100 represent on the plot shown in the figure? A. extreme B. median C. lower quartile D. interquartile range A B A. A B. B 0% 0% 0% 0% C. C C D. D D
173 (over Lesson 12-4) Use the data in the histogram shown in the figure. What are the intervals on the histogram? A. 2 B. 3 C. 4 D. 5 A 0% 0% 0% 0% B C D A. A B. B C. C D. D
174 (over Lesson 12-4) Use the data in the histogram shown in the figure. How many countries won between 1 and 10 medals? A. 6 countries B. 10 countries C. 16 countries D. 20 countries 0% A B C D 1. A 2. B 3. C 4. D
175 (over Lesson 12-4) Use the data in the histogram shown in the figure. How many countries won medals at the 1998 Winter Olympics? A. 10 countries B. 24 countries C. 26 countries 0% 1. A 2. B 3. C 4. D D. 30 countries A B C D

176 (over Lesson 12-4) Use the data in the histogram shown in the figure. Is it possible to tell the largest number of medals won by a country? Which choice proved a correct explanation? A. It is only possible to tell that one country won between 26 and 30 medals. B. It is only possible to tell that two countries won 30 medals. C. It is only possible to tell that 30 countries won between 2 and 10 medals. D. It is only possible to tell that 24 countries won the largest number of medals. A A. A B. B C. 0% 0% C 0% 0% D. D B C D

177 (over Lesson 12-4) The histogram in the figure shows the average amount of monthly precipitation in a city. How many months average at least 3 inches of rain? A. 2 B. 6 C. 8 D. 11 0% A B C D 1. A 2. B 3. C 4. D


178 (over Lesson 12-5) Select an appropriate type of display for the data set. Out of 195 mothers surveyed, 42 have only 1 child, 67 have 2 children, 34 have 3 children, and 22 have 4 or more children. A. B. C. D. A A. A B. B C. C 0% 0% 0% 0% D. D B C D
 Select an")


179 (over Lesson 12-5) Select an appropriate type of display for the data set represented in the graph. A. B. C. D. 0% 1. A 2. B 3. C 4. D A B C D
180 (over Lesson 12-5) Select an appropriate type of display for the relationship among people who have one pet, two or more pets, or have no pets. A. circle graph 0% B. histogram C. bar graph 1. A 2. B 3. C 4. D D. Venn diagram A B C D
181 (over Lesson 12-6) Refer to the graphs. What causes the graphs to appear different? A. The graphs do not differ. B. The vertical scales are different. C. The horizontal scales are different. D. The vertical and horizontal scales are different. A B A. A B. B 0% C. C 0% 0% 0% D. D C D


182 (over Lesson 12-6) Refer to the graphs. Which of the following explains which graph is misleading? A. Graph B is misleading because the increase in online households appears gradual. B. Graph A is misleading becuase the increase in online households appears gradual. C. Graph B is misleading because the increase in online households appears more drastic. D. Graph A is misleading because the increase in online households appears more drastic. 1. A 2. B 3. C 4. D 0% A B C D

183 (over Lesson 12-6) Refer to the graph. Which statement best describes the change in cell phone subscribers from 1997 to 2000? A. It doubled. B. It tripled. C. It quadrupled. 0% 1. A 2. B 3. C 4. D D. It cannot be determined. A B C D
184 (over Lesson 12-7) Suppose a number cube is rolled. What is the probability of rolling an even number? A. B. C. D. A. A B. B C. C D. D A 0% 0% 0% 0% B C D
185 (over Lesson 12-7) Suppose a number cube is rolled. What is the probability of rolling a number that is a factor of 6? A. B. C. D. 1. A 2. B 3. C 4. D 0% A B C D
186 (over Lesson 12-7) Suppose two number cubes are rolled. What is the probability of rolling a difference of less than 4? A. 0% B. C. 1. A 2. B 3. C 4. D D. A B C D
187 (over Lesson 12-7) Suppose two number cubes are rolled. What is the probability of rolling a sum greater than 5? A. B. C. D. A. A B. B C. C D. D A 0% 0% 0% 0% B C D

188 (over Lesson 12-7) What is the probability of spinning blue or green on the spinner shown? A. B. C. D. 0% A B C D 1. A 2. B 3. C 4. D
189 (over Lesson 12-8) Find the number of possible outcomes for the situation. Lou has a choice of 4 sandwiches, 3 beverages, and 2 desserts. A. 4 outcomes B. 9 outcomes C. 12 outcomes D. 24 outcomes A B A. A B. B 0% 0% 0% 0% C. C C D. D D
190 (over Lesson 12-8) Two number cubes labeled 1 to 6 are rolled. What is the probability of getting an even number on both number cubes? A. 0% B. C. 1. A 2. B 3. C 4. D D. A B C D
191 (over Lesson 12-8) Three coins are tossed. What is the probability of getting all heads or all tails? A. 0% B. C. 1. A 2. B 3. C 4. D D. A B C D
192 (over Lesson 12-8) A wheel of chance has the numbers 1 to 42 once each, evenly spaced. What is the probability that a multiple of 7 will come up when the wheel is spun? A. B. C. D. A. A B. B C. C D. D A 0% 0% 0% 0% B C D
193 (over Lesson 12-8) A password is made using three components. The first component is any of the 26 letters of the alphabet, and the last two are each one-digit numbers from 0 through 9. How many possible passwords can be made? A. 260 B C % 1. A 2. B 3. C 4. D D A B C D
194 (over Lesson 12-9) Tell whether the situation is a permutation or combination. Then solve. How many ways can a president and vice president be chosen from the 8 people running for office. A. combination; 28 B. combination; 56 C. permutation; 56 D. permutation; 28 A 0% 0% 0% 0% B C D A. A B. B C. C D. D
195 (over Lesson 12-9) Tell whether the situation is a permutation or combination. Then solve. An ice cream sundae shop has 9 toppings to choose from. How many different 3-topping sundaes can be ordered? A. combination; 432 B. combination; 84 C. permutation; 432 D. permutation; A 2. B 3. C 4. D 0% A B C D
196 (over Lesson 12-9) How many ways can 7 runners place first and second in a race? A. 24 0% B. 42 C A 2. B 3. C 4. D D. 256 A B C D
197 (over Lesson 12-9) Find the number of line segments that can be drawn between any two vertices of a hexagon. A. 6 B. 12 C. 15 D. 25 A B A. A B. B 0% 0% 0% 0% C. C C D. D D
198 (over Lesson 12-9) How many different 4-letter codes can be formed from the letters shown in the figure if a letter is used only once in the code? A % B C. 840 D A 2. B 3. C 4. D A B C D
199 This slide is intentionally blank.
Chapter Test Form A. mean median mode. 187 Holt Algebra 1. Name Date Class. Select the best answer.
 Select the best answer. 1. Use this bar graph to identify how many more candies are blue than red. A 3 B 6 C 9 D 15 Form A 2. Which type of graph would be best for displaying this data? Board Members Opinions
Incoming Advanced Grade 7
 Name Date Incoming Advanced Grade 7 Tell whether the two fractions form a proportion. 1. 3 16, 4 20 2. 5 30, 7 42 3. 4 6, 18 27 4. Use the ratio table to find the unit rate in dollars per ounce. Order
Name: Period: Date: 7 th Pre-AP: Probability Review and Mini-Review for Exam
 Name: Period: Date: 7 th Pre-AP: Probability Review and Mini-Review for Exam 4. Mrs. Bartilotta s mathematics class has 7 girls and 3 boys. She will randomly choose two students to do a problem in front
Intro to Algebra Guided Notes (Unit 11)
") Intro to Algebra Guided Notes (Unit 11) PA 12-1, 12-2, 12-3, 12-7 Alg 12-2, 12-3, 12-4 NAME 12-1 Stem-and-Leaf Plots Stem-and-Leaf Plot: numerical data are listed in ascending or descending order. The
Intro to Algebra Guided Notes (Unit 11) PA 12-1, 12-2, 12-3, 12-7 Alg 12-2, 12-3, 12-4 NAME 12-1 Stem-and-Leaf Plots Stem-and-Leaf Plot: numerical data are listed in ascending or descending order. The
The tree diagram and list show the possible outcomes for the types of cookies Maya made. Peppermint Caramel Peppermint Caramel Peppermint Caramel
 Compound Probabilities using Multiplication and Simulation Lesson 4.5 Maya was making sugar cookies. She decorated them with one of two types of frosting (white or pink), one of three types of sprinkles
Math. Integrated. Trimester 3 Revision Grade 7. Zayed Al Thani School. ministry of education.
 ministry of education Department of Education and Knowledge Zayed Al Thani School www.z2school.com Integrated Math Grade 7 2017-2018 Trimester 3 Revision الوزارة كتاب عن تغني ال المراجعة هذه 0 Ministry
Unit 11 Probability. Round 1 Round 2 Round 3 Round 4
 Study Notes 11.1 Intro to Probability Unit 11 Probability Many events can t be predicted with total certainty. The best thing we can do is say how likely they are to happen, using the idea of probability.
THOMAS WHITHAM SIXTH FORM
 THOMAS WHITHAM SIXTH FORM Handling Data Levels 6 8 S. J. Cooper Probability Tree diagrams & Sample spaces Statistical Graphs Scatter diagrams Mean, Mode & Median Year 9 B U R N L E Y C A M P U S, B U R
She concludes that the dice is biased because she expected to get only one 6. Do you agree with June's conclusion? Briefly justify your answer.
 PROBABILITY & STATISTICS TEST Name: 1. June suspects that a dice may be biased. To test her suspicions, she rolls the dice 6 times and rolls 6, 6, 4, 2, 6, 6. She concludes that the dice is biased because
Unit 14 Probability. Target 3 Calculate the probability of independent and dependent events (compound) AND/THEN statements
 AND/THEN statements") Target 1 Calculate the probability of an event Unit 14 Probability Target 2 Calculate a sample space 14.2a Tree Diagrams, Factorials, and Permutations 14.2b Combinations Target 3 Calculate the probability
Target 1 Calculate the probability of an event Unit 14 Probability Target 2 Calculate a sample space 14.2a Tree Diagrams, Factorials, and Permutations 14.2b Combinations Target 3 Calculate the probability
Advanced Intermediate Algebra Chapter 12 Summary INTRO TO PROBABILITY
 Advanced Intermediate Algebra Chapter 12 Summary INTRO TO PROBABILITY 1. Jack and Jill do not like washing dishes. They decide to use a random method to select whose turn it is. They put some red and blue
Section 1.5 Graphs and Describing Distributions
 Section 1.5 Graphs and Describing Distributions Data can be displayed using graphs. Some of the most common graphs used in statistics are: Bar graph Pie Chart Dot plot Histogram Stem and leaf plot Box
STATISTICS and PROBABILITY GRADE 6
 Kansas City Area Teachers of Mathematics 2016 KCATM Math Competition STATISTICS and PROBABILITY GRADE 6 INSTRUCTIONS Do not open this booklet until instructed to do so. Time limit: 20 minutes You may use
Name: Class: Date: 6. An event occurs, on average, every 6 out of 17 times during a simulation. The experimental probability of this event is 11
 Class: Date: Sample Mastery # Multiple Choice Identify the choice that best completes the statement or answers the question.. One repetition of an experiment is known as a(n) random variable expected value
Key Concept Probability of Independent Events. Key Concept Probability of Mutually Exclusive Events. Key Concept Probability of Overlapping Events
 15-4 Compound Probability TEKS FOCUS TEKS (1)(E) Apply independence in contextual problems. TEKS (1)(B) Use a problemsolving model that incorporates analyzing given information, formulating a plan or strategy,
Mrs. Ambre s Math Notebook
 Mrs. Ambre s Math Notebook Almost everything you need to know for 7 th grade math Plus a little about 6 th grade math And a little about 8 th grade math 1 Table of Contents by Outcome Outcome Topic Page
MATH STUDENT BOOK. 7th Grade Unit 6
 MATH STUDENT BOOK 7th Grade Unit 6 Unit 6 Probability and Graphing Math 706 Probability and Graphing Introduction 3 1. Probability 5 Theoretical Probability 5 Experimental Probability 13 Sample Space 20
Collecting, Displaying, and Analyzing Data
 Collecting, Displaying, and Analyzing Data Solutions Key Are You Ready? 1. 3 1 5 1 4 1 7 4 5 19 4 5 4 3 4 5 4.75 3.. 1 1.7 1 1.8 5 5.7 3 3 5 1.9 5. 87, 10, 103, 104, 105, 118 6. 19, 4, 33, 56, 65, 76,
Probability Unit 6 Day 3
 Probability Unit 6 Day 3 Warm-up: 1. If you have a standard deck of cards in how many different hands exists of: (Show work by hand but no need to write out the full factorial!) a) 5 cards b) 2 cards 2.
UNIT 5: RATIO, PROPORTION, AND PERCENT WEEK 20: Student Packet
 Name Period Date UNIT 5: RATIO, PROPORTION, AND PERCENT WEEK 20: Student Packet 20.1 Solving Proportions 1 Add, subtract, multiply, and divide rational numbers. Use rates and proportions to solve problems.
A 20% B 25% C 50% D 80% 2. Which spinner has a greater likelihood of landing on 5 rather than 3?
 1. At a middle school, 1 of the students have a cell phone. If a student is chosen at 5 random, what is the probability the student does not have a cell phone? A 20% B 25% C 50% D 80% 2. Which spinner
A B C. 142 D. 96
 Data Displays and Analysis 1. stem leaf 900 3 3 4 5 7 9 901 1 1 1 2 4 5 6 7 8 8 8 9 9 902 1 3 3 3 4 6 8 9 9 903 1 2 2 3 3 3 4 7 8 9 904 1 1 2 4 5 6 8 8 What is the range of the data shown in the stem-and-leaf
Core Connections, Course 2 Checkpoint Materials
 Core Connections, Course Checkpoint Materials Notes to Students (and their Teachers) Students master different skills at different speeds. No two students learn exactly the same way at the same time. At
Unit 8, Activity 1, Vocabulary Self-Awareness Chart
 Unit 8, Activity 1, Vocabulary Self-Awareness Chart Vocabulary Self-Awareness Chart WORD +? EXAMPLE DEFINITION Central Tendency Mean Median Mode Range Quartile Interquartile Range Standard deviation Stem
Algebra II- Chapter 12- Test Review
 Sections: Counting Principle Permutations Combinations Probability Name Choose the letter of the term that best matches each statement or phrase. 1. An illustration used to show the total number of A.
Algebra 2 P49 Pre 10 1 Measures of Central Tendency Box and Whisker Plots Variation and Outliers
 Algebra 2 P49 Pre 10 1 Measures of Central Tendency Box and Whisker Plots Variation and Outliers 10 1 Sample Spaces and Probability Mean Average = 40/8 = 5 Measures of Central Tendency 2,3,3,4,5,6,8,9
Unit 7 Central Tendency and Probability
 Name: Block: 7.1 Central Tendency 7.2 Introduction to Probability 7.3 Independent Events 7.4 Dependent Events 7.1 Central Tendency A central tendency is a central or value in a data set. We will look at
Date. Probability. Chapter
 Date Probability Contests, lotteries, and games offer the chance to win just about anything. You can win a cup of coffee. Even better, you can win cars, houses, vacations, or millions of dollars. Games
Probability and Statistics 15% of EOC
 MGSE9-12.S.CP.1 1. Which of the following is true for A U B A: 2, 4, 6, 8 B: 5, 6, 7, 8, 9, 10 A. 6, 8 B. 2, 4, 6, 8 C. 2, 4, 5, 6, 6, 7, 8, 8, 9, 10 D. 2, 4, 5, 6, 7, 8, 9, 10 2. This Venn diagram shows
Essentials. Week by. Week. Calculate! What is the largest product you can compute on your calculator? largest quotient?
 Week by Week MATHEMATICS Essentials Grade WEEK 5 Calculate! What is the largest product you can compute on your calculator? largest quotient? Is the answer the same for all the calculators in your class?
Minute Simplify: 12( ) = 3. Circle all of the following equal to : % Cross out the three-dimensional shape.
 = 3. Circle all of the following equal to : % Cross out the three-dimensional shape.") Minute 1 1. Simplify: 1( + 7 + 1) =. 7 = 10 10. Circle all of the following equal to : 0. 0% 5 100. 10 = 5 5. Cross out the three-dimensional shape. 6. Each side of the regular pentagon is 5 centimeters.
Minute 1 1. Simplify: 1( + 7 + 1) =. 7 = 10 10. Circle all of the following equal to : 0. 0% 5 100. 10 = 5 5. Cross out the three-dimensional shape. 6. Each side of the regular pentagon is 5 centimeters.
Name Date. Chapter 15 Final Review
 Name Date Chapter 15 Final Review Tell whether the events are independent or dependent. Explain. 9) You spin a spinner twice. First Spin: You spin a 2. Second Spin: You spin an odd number. 10) Your committee
Question 1. The following set of data gives exam scores in a class of 12 students. a) Sketch a box and whisker plot of the data.
 Sketch a box and whisker plot of the data.") Question 1 The following set of data gives exam scores in a class of 12 students 25, 67, 86, 72, 97, 80, 86, 55, 68, 70, 81, 12 a) Sketch a box and whisker plot of the data. b) Determine the Interquartile
Question 1 The following set of data gives exam scores in a class of 12 students 25, 67, 86, 72, 97, 80, 86, 55, 68, 70, 81, 12 a) Sketch a box and whisker plot of the data. b) Determine the Interquartile
Cumulative Test (Multiple Choice)
") 1. Noah is going to draw one marble from the can without looking.. The vertical dimensions of this polygon are doubled. Dimensions are in inches. 5 8 1 9 1 Which type of marble is Noah most likely to draw?
1. Noah is going to draw one marble from the can without looking.. The vertical dimensions of this polygon are doubled. Dimensions are in inches. 5 8 1 9 1 Which type of marble is Noah most likely to draw?
Instructions: Choose the best answer and shade in the corresponding letter on the answer sheet provided. Be sure to include your name and student ID.
 Math 3201 Unit 3 Probability Test 1 Unit Test Name: Part 1 Selected Response: Instructions: Choose the best answer and shade in the corresponding letter on the answer sheet provided. Be sure to include
Algebra II. Slide 1 / 241. Slide 2 / 241. Slide 3 / 241. Probability and Statistics. Table of Contents click on the topic to go to that section
 Slide 1 / 241 Slide 2 / 241 Algebra II Probability and Statistics 2016-01-15 www.njctl.org Table of Contents click on the topic to go to that section Slide 3 / 241 Sets Independence and Conditional Probability
9. If 35% of all people have blue eyes, what is the probability that out of 4 randomly selected people, only 1 person has blue eyes?
 G/SP focus Name 1. Tonya wants to have a raised flower bed in her backyard. She measures the area of the flower bed to be 10 square feet. The actual measurement of the flower bed is 10.6 square feet. Approximately
1. How to identify the sample space of a probability experiment and how to identify simple events
 Statistics Chapter 3 Name: 3.1 Basic Concepts of Probability Learning objectives: 1. How to identify the sample space of a probability experiment and how to identify simple events 2. How to use the Fundamental
Algebra 2- Statistics and Probability Chapter Review
 Name Block Date Algebra 2- Statistics and Probability Chapter Review Statistics- Calculator Allowed with Applicable Work For exercises 1-4, tell whether the data that can be gathered about each variable
Unit 6: Probability Summative Assessment. 2. The probability of a given event can be represented as a ratio between what two numbers?
 Math 7 Unit 6: Probability Summative Assessment Name Date Knowledge and Understanding 1. Explain the difference between theoretical and experimental probability. 2. The probability of a given event can
Algebra II. Sets. Slide 1 / 241 Slide 2 / 241. Slide 4 / 241. Slide 3 / 241. Slide 6 / 241. Slide 5 / 241. Probability and Statistics
 Slide 1 / 241 Slide 2 / 241 Algebra II Probability and Statistics 2016-01-15 www.njctl.org Slide 3 / 241 Slide 4 / 241 Table of Contents click on the topic to go to that section Sets Independence and Conditional
3. A box contains three blue cards and four white cards. Two cards are drawn one at a time.
 MATH 310 FINAL EXAM PRACTICE QUESTIONS solutions 09/2009 A. PROBABILITY The solutions given are not the only method of solving each question. 1. A fair coin was flipped 5 times and landed heads five times.
2011 Summer Math Packet Students entering Fifth Grade Math
 Name 0 Summer Math Packet Students entering Fifth Grade Math Rachel Carson Elementary PACKET MUST INCLUDE COVER SHEET WITH THE FOLLOWING INFORMATION CLEARLY PRINTED Students Name (first & last) 0-0 Homeroom
TEKSING TOWARD STAAR MATHEMATICS GRADE 6. Student Book
 TEKSING TOWARD STAAR MATHEMATICS GRADE 6 Student Book TEKSING TOWARD STAAR 2014 Six Weeks 1 Lesson 1 STAAR Category 1 Grade 6 Mathematics TEKS 6.2A/6.2B Problem-Solving Model Step Description of Step 1
Name Date. Chapter 15 Final Review
 Name Date Chapter 15 Final Review Tell whether the events are independent or dependent. Explain. 9) You spin a spinner twice. First Spin: You spin a 2. Second Spin: You spin an odd number. 10) Your committee
Grade 6 Math Circles Winter 2013 Mean, Median, Mode
 1 University of Waterloo Faculty of Mathematics Grade 6 Math Circles Winter 2013 Mean, Median, Mode Mean, Median and Mode The word average is a broad term. There are in fact three kinds of averages: mean,
LC OL Probability. ARNMaths.weebly.com. As part of Leaving Certificate Ordinary Level Math you should be able to complete the following.
 A Ryan LC OL Probability ARNMaths.weebly.com Learning Outcomes As part of Leaving Certificate Ordinary Level Math you should be able to complete the following. Counting List outcomes of an experiment Apply
Counting Methods and Probability
 CHAPTER Counting Methods and Probability Many good basketball players can make 90% of their free throws. However, the likelihood of a player making several free throws in a row will be less than 90%. You
2 Event is equally likely to occur or not occur. When all outcomes are equally likely, the theoretical probability that an event A will occur is:
 10.3 TEKS a.1, a.4 Define and Use Probability Before You determined the number of ways an event could occur. Now You will find the likelihood that an event will occur. Why? So you can find real-life geometric
13-6 Probabilities of Mutually Exclusive Events
 Determine whether the events are mutually exclusive or not mutually exclusive. Explain your reasoning. 1. drawing a card from a standard deck and getting a jack or a club The jack of clubs is an outcome
NAME DATE PERIOD. Study Guide and Intervention
 9-1 Section Title The probability of a simple event is a ratio that compares the number of favorable outcomes to the number of possible outcomes. Outcomes occur at random if each outcome occurs by chance.
Algebra II Probability and Statistics
 Slide 1 / 241 Slide 2 / 241 Algebra II Probability and Statistics 2016-01-15 www.njctl.org Slide 3 / 241 Table of Contents click on the topic to go to that section Sets Independence and Conditional Probability
Math 1116 Probability Lecture Monday Wednesday 10:10 11:30
 Math 1116 Probability Lecture Monday Wednesday 10:10 11:30 Course Web Page http://www.math.ohio state.edu/~maharry/ Chapter 15 Chances, Probabilities and Odds Objectives To describe an appropriate sample
Exam 2 Review (Sections Covered: 3.1, 3.3, , 7.1) 1. Write a system of linear inequalities that describes the shaded region.
 1. Write a system of linear inequalities that describes the shaded region.") Exam 2 Review (Sections Covered: 3.1, 3.3, 6.1-6.4, 7.1) 1. Write a system of linear inequalities that describes the shaded region. 5x + 2y 30 x + 2y 12 x 0 y 0 2. Write a system of linear inequalities
Exam 2 Review (Sections Covered: 3.1, 3.3, 6.1-6.4, 7.1) 1. Write a system of linear inequalities that describes the shaded region. 5x + 2y 30 x + 2y 12 x 0 y 0 2. Write a system of linear inequalities
Graphs and Probability
 11 CHAPTER Graphs and Probability Lesson 11.1 Making and Interpreting Line Plots Make a line plot to show the data in the table. The school uses 9 buses. The table shows the number of students on each
Grade 6 Test pool
 Grade 6 Test 2005. On the map shown below, the intervals all represent the same distanc The mall is 2 miles from Tina s hom How far is the pool from Tina s home? Tina s home 2 miles mall pool 2 miles 2
Second Semester SOL Review. 1) What are the three ways to show a relation? First way: second way: third way:
 What are the three ways to show a relation? First way: second way: third way:") Section 1: Relations and Functions (7.12) Second Semester SOL Review 1) What are the three ways to show a relation? First way: Second way: Third way: 2) Identify the Domain and the Range of the relation:
Section 1: Relations and Functions (7.12) Second Semester SOL Review 1) What are the three ways to show a relation? First way: Second way: Third way: 2) Identify the Domain and the Range of the relation:
Summer Math Learning Packet
 Summer Math Learning Packet Sixth grade math was a blast, The year just went by so fast! Let s keep everything fresh in your mind, So you can rely on it in a bind. Just complete two problems a day, And
Use this information to answer the following questions.
 1 Lisa drew a token out of the bag, recorded the result, and then put the token back into the bag. She did this 30 times and recorded the results in a bar graph. Use this information to answer the following
11-1 Practice. Designing a Study
 11-1 Practice Designing a Study Determine whether each situation calls for a survey, an experiment, or an observational study. Explain your reasoning. 1. You want to compare the health of students who
Tree and Venn Diagrams
 OpenStax-CNX module: m46944 1 Tree and Venn Diagrams OpenStax College This work is produced by OpenStax-CNX and licensed under the Creative Commons Attribution License 4.0 Sometimes, when the probability
UNIT 6: CONJECTURE AND JUSTIFICATION WEEK 24: Student Packet
 Name Period Date UNIT 6: CONJECTURE AND JUSTIFICATION WEEK 24: Student Packet 24.1 The Pythagorean Theorem Explore the Pythagorean theorem numerically, algebraically, and geometrically. Understand a proof
Independence Is The Word
 Problem 1 Simulating Independent Events Describe two different events that are independent. Describe two different events that are not independent. The probability of obtaining a tail with a coin toss
pre-hs Probability Based on the table, which bill has an experimental probability of next? A) $10 B) $15 C) $1 D) $20
 $10 B) $15 C) $1 D) $20") 1. Peter picks one bill at a time from a bag and replaces it. He repeats this process 100 times and records the results in the table. Based on the table, which bill has an experimental probability of next?
1. Peter picks one bill at a time from a bag and replaces it. He repeats this process 100 times and records the results in the table. Based on the table, which bill has an experimental probability of next?
THE ALGEBRA III MIDTERM EXAM REVIEW Name. This review MUST be turned in when you take the midterm exam
 THE ALGEBRA III MIDTERM EXAM REVIEW Name This review MUST be turned in when you take the midterm exam ALG III Midterm Review Solve and graph on a number line. 1. x 6 14. 3x 1 5x 14 3. 4(x 1) (4x 3) Find
MDM4U Some Review Questions
 1. Expand and simplify the following expressions. a) ( y 1) 7 b) ( 3x 2) 6 2x + 3 5 2. In the expansion of ( ) 9 MDM4U Some Review Questions, find a) the 6 th term b) 12 the term containing x n + 7 n +
Student-Built Glossary
 7 NAME DATE PERIOD Student-Built Glossary This is an alphabetical list of new vocabulary terms you will learn in Chapter 7. As you study the chapter, complete each term s definition or description. Remember
Theoretical or Experimental Probability? Are the following situations examples of theoretical or experimental probability?
 Name:Date:_/_/ Theoretical or Experimental Probability? Are the following situations examples of theoretical or experimental probability? 1. Finding the probability that Jeffrey will get an odd number
Test Booklet. Subject: MA, Grade: 07 7th Grade Math May Student name:
 Test Booklet Subject: MA, Grade: 07 7th Grade Math May 2005 Student name: Author: Ohio District: Ohio Released Tests Printed: Monday July 09, 2012 1 There are 2 9 bacteria in a sample. How many bacteria
12.1 Practice A. Name Date. In Exercises 1 and 2, find the number of possible outcomes in the sample space. Then list the possible outcomes.
 Name Date 12.1 Practice A In Exercises 1 and 2, find the number of possible outcomes in the sample space. Then list the possible outcomes. 1. You flip three coins. 2. A clown has three purple balloons
AWM 11 UNIT 1 WORKING WITH GRAPHS
 AWM 11 UNIT 1 WORKING WITH GRAPHS Assignment Title Work to complete Complete 1 Introduction to Statistics Read the introduction no written assignment 2 Bar Graphs Bar Graphs 3 Double Bar Graphs Double
Coordinate Algebra 1 Common Core Diagnostic Test 1. about 1 hour and 30 minutes for Justin to arrive at work. His car travels about 30 miles per
 1. When Justin goes to work, he drives at an average speed of 55 miles per hour. It takes about 1 hour and 30 minutes for Justin to arrive at work. His car travels about 30 miles per gallon of gas. If
15,504 15, ! 5!
 Math 33 eview (answers). Suppose that you reach into a bag and randomly select a piece of candy from chocolates, 0 caramels, and peppermints. Find the probability of: a) selecting a chocolate b) selecting
2. The value of the middle term in a ranked data set is called: A) the mean B) the standard deviation C) the mode D) the median
 the mean B) the standard deviation C) the mode D) the median") 1. An outlier is a value that is: A) very small or very large relative to the majority of the values in a data set B) either 100 units smaller or 100 units larger relative to the majority of the values
1. An outlier is a value that is: A) very small or very large relative to the majority of the values in a data set B) either 100 units smaller or 100 units larger relative to the majority of the values
CHAPTER 9 - COUNTING PRINCIPLES AND PROBABILITY
 CHAPTER 9 - COUNTING PRINCIPLES AND PROBABILITY Probability is the Probability is used in many real-world fields, such as insurance, medical research, law enforcement, and political science. Objectives:
SHORT ANSWER. Write the word or phrase that best completes each statement or answers the question.
 Math 1332 Review Test 4 Name SHORT ANSWER. Write the word or phrase that best completes each statement or answers the question. Solve the problem by applying the Fundamental Counting Principle with two
Test Booklet. Subject: MA, Grade: 07 TAKS Grade 7 Math Student name:
 Test Booklet Subject: MA, Grade: 07 Student name: Author: Texas District: Texas Released Tests Printed: Friday March 02, 2012 1 The top, front, and side views of a 3-dimensional figure built with identical
Student Answer Document STAAR Practice Test, Form A
 Student Answer Document STAAR Practice Test, Form A Sample A 3 3 Sample B Use grid BELOW. 4 37 Item 3 Use grid BELOW. 5 3 Item 39 4 Use grid BELOW. 40 5 7 4 3 4 4 7 9 43 5 30 44 9 3 45 7 0 3 4 Item 33
Chapter Start Thinking! For use before Activity ; 4; Warm Up. For use before Activity Start Thinking!
 . This cylindrical bucket has a smaller diameter than the cylindrical bucket from Exercise. This cylindrical bucket is holding 6 cubic inches of water because that is the volume of the cube bucket. If
Name: Class: Date: ID: A
 Class: Date: Chapter 0 review. A lunch menu consists of different kinds of sandwiches, different kinds of soup, and 6 different drinks. How many choices are there for ordering a sandwich, a bowl of soup,
THE ALGEBRA III MIDTERM EXAM REVIEW Name
 THE ALGEBRA III MIDTERM EXAM REVIEW Name This review MUST be turned in when you take the midterm exam OR you will not be allowed to take the midterm and will receive a ZERO for the exam. ALG III Midterm
Part 1: I can express probability as a fraction, decimal, and percent
 Name: Pattern: Part 1: I can express probability as a fraction, decimal, and percent For #1 to #4, state the probability of each outcome. Write each answer as a) a fraction b) a decimal c) a percent Example:
Spring 2017 Math 54 Test #2 Name:
 Spring 2017 Math 54 Test #2 Name: You may use a TI calculator and formula sheets from the textbook. Show your work neatly and systematically for full credit. Total points: 101 1. (6) Suppose P(E) = 0.37
12.1 The Fundamental Counting Principle and Permutations
 12.1 The Fundamental Counting Principle and Permutations The Fundamental Counting Principle Two Events: If one event can occur in ways and another event can occur in ways then the number of ways both events
Unit 1 Day 1: Sample Spaces and Subsets. Define: Sample Space. Define: Intersection of two sets (A B) Define: Union of two sets (A B)
 Define: Union of two sets (A B)") Unit 1 Day 1: Sample Spaces and Subsets Students will be able to (SWBAT) describe events as subsets of sample space (the set of outcomes) using characteristics (or categories) of the outcomes, or as unions,
Unit 1 Day 1: Sample Spaces and Subsets Students will be able to (SWBAT) describe events as subsets of sample space (the set of outcomes) using characteristics (or categories) of the outcomes, or as unions,
Mathematicsisliketravellingona rollercoaster.sometimesyouron. Mathematics. ahighothertimesyouronalow.ma keuseofmathsroomswhenyouro
 Mathematicsisliketravellingona rollercoaster.sometimesyouron Mathematics ahighothertimesyouronalow.ma keuseofmathsroomswhenyouro Stage 6 nalowandshareyourpracticewit Handling Data hotherswhenonahigh.successwi
Individual 5 th Grade
 Individual 5 th Grade Instructions: Problems 1 10 are multiple choice and count towards your team score. Bubble in the letter on your answer sheet. Be sure to erase all mistakes completely. 1. Which one
Learning Log Title: CHAPTER 2: ARITHMETIC STRATEGIES AND AREA. Date: Lesson: Chapter 2: Arithmetic Strategies and Area
 Chapter 2: Arithmetic Strategies and Area CHAPTER 2: ARITHMETIC STRATEGIES AND AREA Date: Lesson: Learning Log Title: Date: Lesson: Learning Log Title: Chapter 2: Arithmetic Strategies and Area Date: Lesson:
green, green, green, green, green The favorable outcomes of the event are blue and red.
 5 Chapter Review Review Key Vocabulary experiment, p. 6 outcomes, p. 6 event, p. 6 favorable outcomes, p. 6 probability, p. 60 relative frequency, p. 6 Review Examples and Exercises experimental probability,
Making Middle School Math Come Alive with Games and Activities
 Making Middle School Math Come Alive with Games and Activities For more information about the materials you find in this packet, contact: Sharon Rendon (605) 431-0216 sharonrendon@cpm.org 1 2-51. SPECIAL
MULTIPLE CHOICE. Choose the one alternative that best completes the statement or answers the question.
 More 9.-9.3 Practice Name MULTIPLE CHOICE. Choose the one alternative that best completes the statement or answers the question. Answer the question. ) In how many ways can you answer the questions on
Name Class Date. Introducing Probability Distributions
 Name Class Date Binomial Distributions Extension: Distributions Essential question: What is a probability distribution and how is it displayed? 8-6 CC.9 2.S.MD.5(+) ENGAGE Introducing Distributions Video
A. 15 B. 24 C. 45 D. 54
 A spinner is divided into 8 equal sections. Lara spins the spinner 120 times. It lands on purple 30 times. How many more times does Lara need to spin the spinner and have it land on purple for the relative
Chapter 0: Preparing for Advanced Algebra
 Lesson 0-1: Representing Functions Date: Example 1: Locate Coordinates Name the quadrant in which the point is located. Example 2: Identify Domain and Range State the domain and range of each relation.
Review. In an experiment, there is one variable that is of primary interest. There are several other factors, which may affect the measured result.
 Review Observational study vs experiment Experimental designs In an experiment, there is one variable that is of primary interest. There are several other factors, which may affect the measured result.
!!!!!!!!!!!!!!! Rising 6 th Grade Summer Interactive Math Practice
 Rising 6 th Grade Summer Interactive Math Practice Rising Sixth Grade Summer Math Packet I. Place Value Write each number in word form, in expanded form, expanded notation, name the place of the underlined
10-8 Probability of Compound Events
 1. Find the number of tennis shoes available if they come in gray or white and are available in sizes 6, 7, or 8. 6 2. The table shows the options a dealership offers for a model of a car. 24 3. Elisa
TJP TOP TIPS FOR IGCSE STATS & PROBABILITY
 TJP TOP TIPS FOR IGCSE STATS & PROBABILITY Dr T J Price, 2011 First, some important words; know what they mean (get someone to test you): Mean the sum of the data values divided by the number of items.
Mid-Year Review. Test Prep. Multiple Choice. Fill in the circle next to the correct answer.
 Name: Date: Summer Math Packet for Students Entering 5th Grade Mid-Ye r Review Test Prep Multiple hoice Fill in the circle next to the correct answer. 1. 13 thousands 4 tens 8 ones in standard form is.
out one marble and then a second marble without replacing the first. What is the probability that both marbles will be white?
 Example: Leah places four white marbles and two black marbles in a bag She plans to draw out one marble and then a second marble without replacing the first What is the probability that both marbles will