ELECTRONIC MEASUREMENTS & INSTRUMENTATION UNIT-I
|
|
|
- Helen Curtis
- 5 years ago
- Views:
Transcription
1 SHRI VISHNU ENGINEERING COLLEGE FOR WOMEN :: BHIMAVARAM DEPARTMENT OF ELECTRONICS & COMMUNICATION ENGINEERING ELECTRONIC MEASUREMENTS & INSTRUMENTATION PERFORMANCE CHARACTERISTICS: UNIT-I Static characteristics: The static characteristics of an instrument are, in general, considered for instruments which are used to measure an unvarying process condition. All the static performance characteristics are obtained by one form or another of a process called calibration. There are a number of related definitions (or characteristics), which are described below, such as accuracy, precision, repeatability, resolution, errors, sensitivity, etc. l. Instrument: A device or mechanism used to determine the present value of the quantity under measurement. 2. Measurement: The process of determining the amount, degree, or capacity by comparison (direct or indirect) with the accepted standards of the system units being used. 3. Accuracy: The degree of exactness (closeness) of a measurement compared to the expected (desired) value. 4. Resolution: The smallest change in a measured variable to which an instrument will respond. 5. Precision: A measure of the consistency or repeatability of measurements, i.e. successive readings does not differ. (Precision is the consistency of the instrument output for a given value of input). 6. Expected value: The design value, i.e. the most probable value that calculations indicate one should expect to measure. 7 Error: The deviation of the true value from the desired value. 8. Sensitivity: The ratio of the change in output (response) of the instrument to a change of input or measured variable. Dynamic characteristics: Instruments rarely respond instantaneously to changes in the measured variables. Instead, they exhibit slowness or sluggishness due to such things as mass, thermal capacitance, fluid capacitance or electric capacitance. In addition to this, pure delay in time is often encountered where the instrument waits for some reaction to take place. Such industrial instruments are nearly always used for measuring quantities that fluctuate with time. Therefore, the dynamic and transient behavior of the instrument is as important as the static behavior. The dynamic behavior of an instrument is determined by subjecting its primary element (sensing
2 element) to some unknown and predetermined variations in the measured quantity. The three most common variations in the measured quantity are as follows: l. Step change in which the primary element is subjected to an instantaneous and finite change in measured variable. 2. Linear change, in which the primary element is following a measured variable, changing linearly with time. 3. Sinusoidal change, in which the primary element follows a measured variable, the magnitude of which changes in accordance with a sinusoidal function of constant amplitude. The dynamic characteristics of an instrument are (i) speed of response, (ii) Fidelity, (iii) lag, and (iv) Dynamic error. (i) Speed of Response: It is the rapidity with which an instrument responds to changes in the measured quantity. (ii) Fidelity: It is the degree to which an instrument indicates the changes in the measured variable without dynamic error (faithful reproduction). (iii) Lag: It is the retardation or delay in the response of an instrument to changes in the measured variable. (iv) Dynamic Error: It is the difference between the true values of a quantity changing with time and the value indicated by the instrument, if no static error is assumed. When measurement problems are concerned with rapidly varying quantities, the dynamic relations between the instruments input and output are generally Defined by the use of differential equations Different types of static errors The static error of a measuring instrument is the numerical difference between the true value of a quantity and its value as obtained by measurement, i.e. repeated measurement of the same quantity give different indications. Static errors are categorized as gross errors or human errors, systematic errors and Random errors. 1. Gross Errors This error is mainly due to human mistakes in reading or in using instruments or errors in recording observations. Errors may also occur due to incorrect adjustments of instruments and computational mistakes. These errors cannot be treated mathematically. The complete elimination of gross errors is not possible, but one can minimize them.some errors are easily detected while others may be elusive. One of the basic gross errors that occur frequently is the improper use of an Instrument the error can be minimized by taking proper care in reading and recording the measurement parameter. In general, indicating instruments change ambient conditions to some extent when connected into a complete circuit. 2. Systematic Errors These errors occur due to shortcomings of, the instrument, such as defective or worn parts, or ageing or effects of the environment on the instrument. These e r r o r s a r e sometimes referred t o a s b i a s, a n d t h e y i n f l u e n c e all measurements of a quantity alike. A constant uniform deviation of the operation of an instrument is known as a systematic error. There are basically three types of systematic errors (i) Instrumental, (ii) Environmental, and (iii) Observational
3 (i) Instrumental Errors Instrumental errors are inherent in measuring instruments, because of their mechanical structure. For example, in the D'Arsonval movement friction in the bearings of various moving components, irregular spring tensions, stretching of the spring or reduction in tension due to improper handling or over loading of the instrument. Instrumental errors can be avoided by (a) Selecting a suitable instrument for the particular measurement applications. (b) Applying correction factors after determining the amount of instrumental error. (c) Calibrating the instrument against a standard. (ii) Environmental Errors Environmental errors are due to conditions external to the measuring device, including conditions in the area surrounding the instrument, such as the effects of change in temperature, humidity, barometric pressure or of magnetic or electrostatic fields. These errors can also be avoided by (i) air conditioning, (ii) hermetically sealing certain components in the instruments, and (iii) using magnetic shields. (iii) Observational Errors Observational errors are errors introduced by the observer. The most common error is the parallax error introduced in reading a meter scale, and the error of estimation when obtaining a reading from a meter scale. These errors are caused by the habits of individual observers. For example, an observer may always introduce an error by consistently holding his head too far to the left while reading a needle and scale reading. In general, systematic errors can also be subdivided into static and dynamic Errors. Static errors are caused by limitations of the measuring device or the physical laws governing its behavior. Dynamic errors are caused by the instrument not responding fast enough to follow the changes in a measured variable. DC-Voltmeter: A basic D'Arsonval movement can be converted into a dc voltmeter by adding a series resistor known as multiplier, as shown in the figure. The function of the multiplier is to limit the current through the movement so that the current does not exceed the full scale deflection value. A dc voltmeter measures the potential difference between two points in a dc circuit or a circuit component. To measure the potential difference between two points in a dc circuit or a circuit component, a d c vo lt met er i s alwa ys c o nn e c t e d across them with the proper polarity. The value of the multiplier required is calculated as follows.
4 DC VOLTMETER Im: full scale deflection current of the movement Rm : internal resistance of movement Rs : Multiplier resistance V: full range voltage of the instrument From the circuit of Fig. The multiplier limits the current through the movement, so as to not exceed the value of the full scale deflection Ifsd. The above equation is also used to further extend the range in DC voltmeter. Multi range Voltmeter: As in the case of an ammeter, to obtain a multi range ammeter, a number of shunts are connected across the movement with a multi-position switch. Similarly, a dc voltmeter can be converted into a multi range voltmeter by connecting a number of resistors (multipliers) along with a range switch to provide a greater number of workable ranges. The above Figure shows a multi range voltmeter using a three position switch and three multipliers R1,R2, and R3, for voltage values V1, V2, and V3.Fig. can be further modified to multipliers connected in series string, which is a more practical arrangement of the multiplier resistors of a multi range voltmeter. In this arrangement, the multipliers are connected in a series string, and the range selector selects the appropriate amount of
5 resistance required in series with the movement. Solid state voltmeter: The below figure shows the circuit of an electronic voltmeter using an IC Op Amp 741C.This is a directly coupled very high gain amplifier. The gain of the Op Amp can be adjusted to any suitable lower value by providing appropriate resistance between its output terminal, Pin No. 6, and inverting input, Pin No. 2, to provide a negative feedback. The ratio R2/R1 determines the gain, i.e. 101 in this case, provided by the Op Amp. The 0.1 pf capacitor across the100 k resistance R is for stability under stray pick-ups Terminals 1 and 5 are called offset null terminals. A 10 kω potentiometer is connected between these two offset null terminals with its centre tap connected to a - 5V supply. This potentiometer is called zero set and is used for adjusting zero output for zero input conditions. The two diodes used are for IC protection. Under normal conditions, they are non-conducting, as the maximum voltage across them is l0 mv. If an excessive voltage, say more than 100 mv appears across them, then depending upon the polarity of the voltage, one of the diodes conducts and protects the IC. A µa scale of µa full scale deflection can be used as an indicator. Aryton shunt: It is also known as universal shunt. Figure shows the basic circuit of an aryton shunt. It avoids the possibility of using the meter in the circuit without a shunt. This is the most important merit of the aryton shunt. From the figure, it is noted that the series combination of resistors R 2, R3 and the meter movement is in parallel with R 1 when the switch (SW) is connected to position "1". Therefore, the current through the meter movement is less than the current through the shunt, thereby protecting the meter movement. This reduces the sensitivity of meter movement. The series combination of resistor R 6 and the meter movement is in parallel with resistor R 1, R 2, when the SW is connected to position "2". Therefore, the current through the shunt resistance is less than the current through the meter movement. The resistors R 1, R 2, and R 3, are together in parallel with meter movement. When the switch is in position "3".Now the current flowing through the shunt is very little whereas the current flowing through the meter is very high. Hence the sensitivity of the meter movement is increases.
6 Solid state voltmeter Aryton shunt Series Ohmmeter: A D'Arsonval movement is connected in series with a resistance R, and a battery which is connected to a pair of terminals A and B, across which the unknown resistance is connected. This forms the basic type of series ohm meter, as shown in the fig. The current flowing through the movement then depends on the magnitude of the unknown resistance. Therefore, the meter deflection is directly proportional to the value of the unknown resistance referring to the figure below R 1 : current limiting resistance R 2 : zero adjust resistance V= battery R m =meter resistance R x =un know resistance Calibration of the Series Type Ohmmeter: To mark the "0" reading on the scale, the terminals A and B are Shorted, i.e. the Unknown resistance Rx=0, maximum current flows in the circuit and the shunt Resistance R 2 is adjusted until the movement indicates full
7 scale current (I fsd ). The Position of the pointer on the scale is then marked "0" ohms. Similarly, to mark the " " reading on the Scale, terminals A and B are open, i.e., the unknown resistance R x =, no current flow in the circuit and there is no deflection of the pointer. The position of the pointer on the scale is then marked as 0hms. Series type Ohmmeter Dial of series ohmmeter By connecting different known values of the unknown resistance to terminals A and B, intermediate markings can be done on the scale. The accuracy of the Instrument can be checked by measuring different values of standard resistance, i.e., the tolerance of the calibrated resistance, and noting the readings a major drawback in the series ohmmeter is the decrease in voltage of the internal battery with time and age. Due to this, the full scale deflection current Drops and the meter does not read "0" when A and B are shorted. The variable Shunt resistor R 2 across the movement is adjusted to counteract the drop in battery Voltage. There by bringing the pointer back to "0" ohms on the scale. It is also possible to adjust the full scale deflection current without the shunt R 2 in the circuit, by varying the value of R 1, to compensate for the voltage drop. Since this value affects the calibration of the scale, varying by R 2 is much better solution. The internal resistance of the coil R m is very low compared to R 1 When R 2 is varied, the current through the movement is increased and the Current through R 2 is reduced, thereby bringing the pointer to the full scale deflection position. The series ohmmeter is a simple and popular design, and is used extensively For general services work, Therefore,in a series ohmmeter the scale marking on the dial has 0 on the right side,corresponding to full scale deflection current,and " " on the left side corresponding to no current flow as given in the fig Values of R 1 be determined from the value of R x,which gives half the full scale deflection. UNIT 2 STANDARD SIGNAL GENERATOR and R 2 can A standard signal generator produces known and controllable voltages. It is used as power source for the measurement of gain, signal to noise ratio (SN), bandwidth standing wave ratio and other properties. It is extensively used in the measuring of radio receivers and transmitter instrument is provided with a means of modulating the carrier frequency, which is indicated by the dial setting on the front panel. The modulation is indicated by a meter. The output signal can be Amplitude Modulated (AM) or Frequency Modulated (FM). Modulation may be done by a sine wave, Square, rectangular, or a pulse wave. The elements of a conventional signal generator
8 The carrier frequency is generated by a very stable RF oscillator using an LC tank circuit, having a constant output over any frequency range. The frequency of oscillations is indicated by the frequency range control and the venire dial setting. AM is provided by an internal sine wave generator or from an external source. Sine and square wave generator: The signal generator is called an oscillator. A Wien bridge oscillator is used in this generator. The Wien bridge oscillator is the best of the audio frequency range. The frequency of oscillations can be changed by varying the capacitance in the oscillator. The frequency can also be changed in steps by switching the resistors of different values. The output of the Wien bridge oscillator goes to the function switch. The function switch directs the oscillator output either to the sine wave amplifier or to the square wave shaper. At the output, we get either a square or sine wave. The output is varied by means of an attenuator.
9 The instrument generates a frequency ranging from 10 Hz to 1 MHz continuously variable in 5 decades with overlapping ranges. The output sine wave amplitude can be varied from 5 mv to 5V (rms).the output is taker through a push-pull amplifier. For low output, the impedance is 6000 Ohms. The square wave amplitudes can be varied from 0-20 v (peak). It is possible to adjust the symmetry of the square wave from 30-70%. The instrument requires only 7W of power at 220V,50Hz. The front panel of a signal generator consists of the following. l. Frequency selector: It selects the frequency in different ranges and varies it continuously in a ratio of 1: 11. The scale is non-linear. 2. Frequency multiplier: It selects the frequency range over 5 decades from 10 Hz to 7 MHz 3. Amplitude multiplier: It attenuates the sine wave in 3 decades, x l x 0.1 and x Variable amplitude: It attenuates the sine wave amplitude continuously 5. Symmetry control: It varies the symmetry of the square wave from 30% to 70%. 6. Amplitude: It attenuates the square wave output continuously. 7. Function switch: It selects either sine wave or square output. 8. Output available: This provides sine wave or square wave output. FUNCTION GENERATOR A function generator produces different waveforms of adjustable frequency. The common output waveforms are the sine, square, triangular and saw tooth waves. The frequency may be adjusted, from a fraction of a Hertz to several hundred khz lie various outputs of the generator can be made available at the same time. For example, the generator can provide a square wave to test the linearity of a rectifier and simultaneously provide a saw tooth to drive the horizontal deflection amplifier of the CRO to provide a visual display. Capability of Phase Lock the function generator can be phase locked to an external source. One function generator can be used to lock a second function generator, and the two output signals can be displaced in phase by adjustable amount. In addition, the fundamental frequency of one generator can be phase locked to a harmonic of another generator, by adjusting the amplitude and phase of the harmonic; almost any waveform can be generated by addition. The function generator can also be phase locked to a frequency standard and its output waveforms will then have the same accuracy and stability as the standard source. The block diagram of a function generator is illustrated in fig. Usually the frequency is controlled by varying the capacitor in the LC or RC circuit. In the instrument the frequency is controlled by varying the magnitude of current which drives the integrator. The instrument produces sine, triangular and square waves with a frequency range of 0.01
10 Hz to 100 khz. The frequency controlled voltage regulates two current sources. The upper current source supplies constant current to the integrator whose output voltage increases linearly with time, according to the equation of the output signal voltage. An increase or decrease in the current increases or decreases the slope of the output voltage and hence controls the frequency. The voltage comparator multi-vibrator changes states at a pre-determined maximum level of the integrator output voltage. This change cuts off the upper current supply and switches on the lower current supply. The lower current source supplies a reverse current to the integrator, so that its output decreases linearly with time. When the output reaches a pre-determined minimum level, the voltage comparator again changes state and switches on the Lower current source. The output of the integrator is a triangular waveform whose frequency is determined by the magnitude of the current supplied by the constant current sources. The comparator output delivers a square wave voltage of the same frequency. e = - The resistance diode network alters the slope of the triangular wave as its amplitude changes and produces a sine wave with less than 1% distortion.
11 RANDOM NOISE GENERATOR The spectrum of random noise covers all frequencies the lower density spectrum tells us how the energy of the signal is distributed in frequency, but it does not specify the signal uniquely nor does it tell us very much about how the amplitude of the signal varies with time. The spectrum does not specify the signal uniquely because it contains no phase information. The method of generating noise is usually to use a semi conductor noise which delivers frequencies in a band roughly extending from KHz The output from the noise diode is amplified and heterodyned down to audio frequency band by means of a balanced symmetrical modulator. The filter arrangement controls the bandwidth and supplies an output signal in three spectrum choices, white noise, pink noise and Usasi noise. From the Fig 4.2 it is seen that white noise is flat from 20Hz to 20 KHz and has upper cutoff frequency of 50 khz with a cutoff slope of -12 dbs/ octave. Pink noise is so called because the lower frequencies have larger amplitude, similar to red light. Pink noise has a voltage spectrum which is inversely proportional to the square root of frequency and is used in band analysis. Usasi noise ranging simulates the energy distribution of speech and music frequencies and is used for testing audio amplifiers and loud speakers. Sweep Generator: It provides a sinusoidal output voltage whose frequency varies smoothly and continuously over an entire frequency band, usually at an audio rate. The process of frequency modulation may be accomplished electronically or mechanically.
12 It is done electronically by using the modulating voltage to vary the reactance of the oscillator tank circuit component, and mechanically by means of a motor driven capacitor, as provided for in a modern laboratory type signal generator. Figure shows a basic block diagram of a sweep generator. The frequency sweeper provides a variable modulating voltage which causes the capacitance of the master oscillator to vary. A representative sweep rate could be of the order of 20 sweeps/second. A manual control allows independent adjustment of the oscillator resonant frequency. The frequency sweeper provides a varying sweep voltage for Synchronization to drive the horizontal deflection plates of the CRO. Thus the amplitude of the response of a test device will be locked and displayed on the screen. To identify a frequency interval, a marker generator provides half sinusoidal waveforms at any frequency within the sweep range. The marker voltage can be added to the sweep voltage of the CRO during alternate cycles of the sweep voltage, and appears superimposed on the response curve. The automatic level control circuit is a closed loop feedback system which monitors the RF level at some point in the measurement system. This circuit holds the power delivered to the load or test circuit constant and independent o frequency and impedance changes. A constant power level prevents any source mismatch and also provides a constant readout calibration with frequency. SQUARE AND PULSE GENERATOR: These generators are used as measuring devices in combination with a CRO. They provide both quantitative and qualitative information of the system under test. They are made use of in transient response testing of amplifiers. The fundamental difference between a pulse generator and a square wave generator is in the duty cycle. Duty cycle = A square wave generator has a 500/o duty cycle. Requirements of a Pulse 1. The pulse should have minimum distortion, so that any distortion, in the display is solely due to the circuit under test. 2. The basic characteristics of the pulse are rise time, overshoot, ringing, sag, and undershoot. 3. The pulse should have sufficient maximum amplitude, if appreciable output power is required by the test circuit, e.g. for magnetic core memory. At the same time, the attenuation range should be adequate to produce small amplitude pulses to prevent over driving of some test circuit. 4. The range of frequency control of the pulse repetition rate (PRR) should meet the needs of the experiment. For example, a repetition frequency of 100 MHz is required for testing fast circuits.
13 Other generators have a pulse-burst feature which allows a train of pulses rather than a continuous output. 5. Some pulse generators can be triggered by an externally applied trigger signal; conversely, pulse generators can be used to produce trigger signals, when this output is passed through a differentiator circuit. 6. The output impedance of the pulse generator is another important consideration. In a fast pulse system, the generator should be matched to the cable and the cable to the test circuit. A mismatch would cause energy to be reflected back to the generator by the test circuit, and this may be re- reflected by the generator, causing distortion of the pulses. 7. DC coupling of the output circuit is needed, when dc bias level is to be maintained. The basic circuit for pulse generation is the asymmetrical multi-vibrator. A laboratory type square wave and pulse generator is shown in Fig 6.1 The frequency range of the instrument is covered in seven decade steps from 1Hz to 10 MHz, with a linearly calibrated dial for continuous adjustment on all ranges. The duty cycle can be varied from 25-75%. Two independent outputs are available, a 50Ω source that supplies pulses with a rise and fall time of 5 ns at 5V peak amplitude and a 600Ω source which supplies pulses with a rise and fall tme of 70 ns at 30 V peak amplitude. The instrument can be operated as a freerunning genenrator or, it can be synchronized with external signals. The basic generating loop consists of the current sources, the ramp capacitor, the Schmitt trigger and the current switching circuit as shown in the fig 6.2
14 The upper current source supplies a constant current to the capacitor and the capacitor voltage increases linearly. When the positive slope of the ramp voltage reaches the upper limit set by the internal circuit components, the Schmitt trigger changes state. The trigger circuit output becomes negative and reverses the condition of the current switch. The capacitor discharges linearly, controlled by the lower current source. When the negative ramp reaches a predetermined lower level, the Schmitt trigger switches back to its original state. The entire process is then repeated. The ratio i 1 /i 2 determines the duty cycle, and is controlled by symmetry control. The sum of i 1 and i 2 determines the frequency. The size of the capacitor is selected by the multiplier switch. The unit is powered by an intenal supply that provides regulated voltages for all stages of the instrument. Fixed and variable AF oscillator: The AF oscillators are divided into two types. They are as follows, 1. Fixed frequency AF oscillator 2. Variable frequency AF oscillator. 1. Fixed Frequency AF Oscillator Many instrument circuits contain oscillator as one of its integral parts to provide output signal within the specified fixed audio frequency range. This specified audio frequency range can be 1 khz signal or 400 Hz signal. The 1 khz frequency signal is used to execute a bridge circuit and 400 Hz frequency signal is used for audio testing. A fixed frequency AF oscillator employs an iron core transformer. Due to this a positive feedback is obtained through the inductive coupling placed between the primary winding and secondary winding of the transformer and hence fixed frequency oscillations are generated. 2. Variable Frequency AF Oscillator It is a general purpose oscillator used in laboratory. It generates oscillations within the entire audio frequency range i.e. from 2O Hz to 20 khz. This oscillator provides a pure, constant sine wave output throughout this AF range. The examples of variable AF oscillators used in laboratory are RC feedback oscillator, beat frequency oscillator.
15 AF sine wave generator: As the name suggest an AF sine and square wave generator produces either sine wave or square wave output. It employee a Wein bridge oscillator, sine wave amplifier, square wave shaper, square wave amplifier and attenuator. The schematic arrangement of these blocks is shown below. The Wien bridge oscillator operates effectively in audio frequency ranges. It produces oscillations whose frequency can be varied by varying the capacitance value of the capacitor of the oscillator. Also the frequency value can be varied in steps by switching in different values of resistors. The oscillations of Wien bridge oscillator are applied to either sine wave amplifier or sine wave shaper through function key. When the key is connected to position 1, the output oscillations are connected to sine wave amplifier and then to attenuator. Therefore, the oscillations are amplified and then attenuated and a pure sine wave is available at the output. Depending on the requirement the amplitude of this sine wave can be varied from 5 mv to 5 V (r.m.s value). When the key is connected to position 2, the oscillations are applied to square wave shaper which converts the oscillations into square wave. The square wave signal is amplified and then attenuated and finally appears as pure square wave at the output. The amplitude of the square wave can be varied from 0 V to 20 V (peak value). This generator produces output in the frequency range of 1 0 Hz to I MHz and it requires power of 7 W at 220V, 50 Hz. The front panel of the instrument contains (i) ON/OFF switch. (ii)frequencymultip1ier: To choose the frequency range over 5 decades (from10hz to1mhz). (iii) Amplitude Multiplier: To attenuate sine wave output in 3 decades (x 1; x 0.1 and x 0.01). (iv) Amplitude: To continuously attenuate the amplitude of square wave output. (v) Variable Amplitude: To continuously attenuate the amplitude of sine wave output. (vi) Frequency Selector: To select different ranges of frequencies and to vary the frequency in a ratio of 1: 11. (vii) Function Key: To select either square wave or sine wave output. (viii) Symmetry Control: To adjust the symmetry of square wave from 30% to 70% (ix) Sync: To synchronize the internal signal with external signal. Introducing an Isolation Amplifier between oscillator and Attenuator: In this method of achieving isolation, the oscillator output is amplified by certain amount using a buffer amplifier. Consecutively, it is attenuated by same amount by a fixed attenuator before feeding the oscillator output to the variable attenuator of the signal generator. In this way isolation is achieved without any change in the signal level of oscillator output. To achieve an isolation of 20 db or more, a 10 db gain isolation amplifier followed by a 10 db fixed attenuator is introduced between the oscillator and variable attenuator as

16 shown in the following figure. The gain of the isolation amplifier and thus the attenuation of a fixed attenuator depend on the amount of isolation required and also on the attenuation of the variable attenuator
17 UNIT-3 AF Wave analyzer principle and Working: The wave analyzer consists of a very narrow pass-band filter section which can be tuned to a particular frequency within the audible frequency range (20Hz to 20 KHz)). The block diagram of a wave analyzer is as shown in fig. The complex wave to be analyzed is passed through an adjustable attenuator which serves as a range multiplier and permits a large range of signal amplitudes to be analyzed without loading the amplifier. The output of the attenuator is then fed to a selective amplifier, which amplifies the selected frequency. The driver amplifier applies the attenuated input signal to a high-q active filter. This high-q filter is a low pass filter which allows the frequency which is selected to pass and reject all others. The magnitude of this selected frequency is i n d i c a t e d by t h e meter and the filter section identifies the frequency of the component. The filter circuit consists of a cascaded RC resonant circuit and amplifiers. For selecting the frequency range, the capacitors generally used are of the closed tolerance polystyrene type and the resistances used are precision potentiometers. The capacitors are used for range changing and the potentiometer is used to change the frequency within the selected pass-band, hence this wave analyzer is also called a Frequency selective
18 voltmeter. The entire AF range is covered in decade steps by switching capacitors in the RC section. The selected signal output from the final amplifier stage is applied to the meter circuit and to an unturned buffer amplifier. The main function of the buffer amplifier is to drive output devices, such as recorders or electronics counters. The meter has several voltage ranges as well as decibel scales marked on it. It is driven by an average reading rectifier type detector. The w a v e analyzer must have e x t r e m e l y low input distortion, undetectable by the analyzer itself. The band width of the instrument is very narrow typically about 1% of the selective band. Application of wave analyzer: 1. Electrical measurements 2. Sound measurements 3. Vibration measurements. In industries there are heavy machineries which produce a lot of sound and vibrations, it is very important to determine the amount of sound and vibrations because if it exceeds the permissible level it would create a number of problems. The source of noise and vibrations is first identified by wave analyzer and then it is reduced by further circuitry. Harmonic distortion analyzer: Fundamental Suppression Type:- Distortion analyzer measures the total harmonic power present in the test wave rather than the distortion caused by each component. The simplest method is to suppress the fundamental frequency by means of a high pass filter whose cut off frequency is a little above the fundamental frequency. This high pass allows only the harmonics to pass and the total harmonic distortion can then be measured. Other types of harmonic distortion analyzers based on fundamental suppression are as follows 1. Employing a Resonance Bridge h e T b r i d g e s h o w n in fig 3.1 is balanced for the fundamental frequency, i.e. L and C are tuned to the fundamental frequency. The bridge is unbalanced for the harmonics, i.e. only harmonic power will be available at the output terminal and can be measured. If the fundamental frequency is changed, the bridge must be balanced again. If L and C are fixed components, then this method is suitable only when the test wave has a fixed frequency. Indicators can be thermocouples or square law VTVMs. This indicates the rms value of all harmonics. When a continuous
19 adjustment of the fundamental frequency is desi frequency is desired a Wien bridge arrangement is used as shown in fig Wien s Bridge Method The bridge is balanced for the fundamental frequency. The fundamental energy is dissipated in the bridge circuit elements. Only the harmonic components reach the output terminals.the harmonic distortion output can then be measured with a meter. For balance at the fundamental frequency C 1 =C 2 =C, R 1 =R 2 =R, R 3 =2R 4. Spectrum Analyzer: The most common way of observing signals is to display them on an oscilloscope with time as the X-axis (i.e. amplitude of the signal versus time). This is the time domain. It is also useful to display signals in the frequency domain. The providing this frequency domain view is the spectrum analyzer. A spectrum analyzer provides a calibrated graphical display on its CRT, with frequency on the horizontal axis and amplitude (voltage) on the vertical axis. Displayed as vertical lines against these coordinates are sinusoidal components of which the input signal is composed. The height represents the absolute magnitude, and the horizontal location represents the frequency. These instruments provide a display of the frequency spectrum a given frequency band. Spectrum analyzers use either parallel filter bank or a swept frequency technique. In a parallel filter in a parallel filter bank analyzer, the frequency range is covered by a series of filters whose central frequencies and bandwidth are so selected that they overlap each others, as shown in fig 7.1. Typically, an audio analyzer has 32 of these filters, each covering one third of an octave. For wide band narrow resolution analysis, particularly at RF or microwave signals, the swept Technique is preferred.

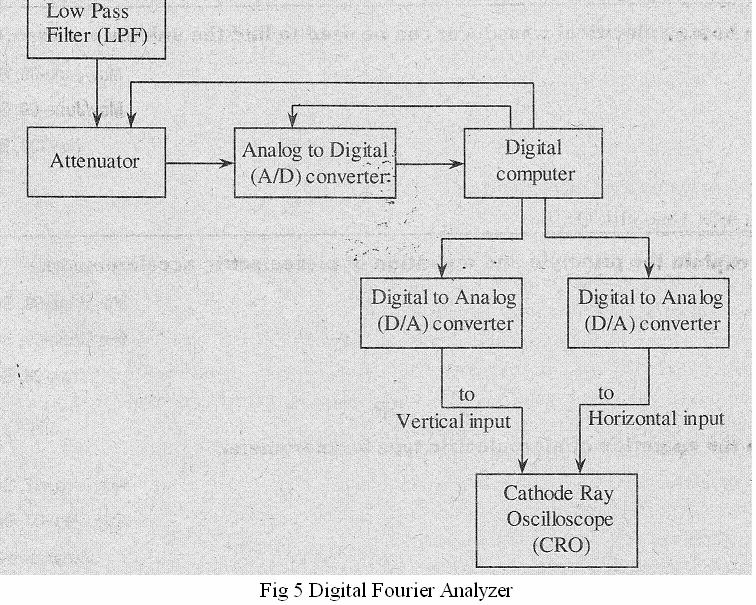
20 Basic Spectrum Analyzer Using Swept Receiver Design: Referring to the block diagram of fig. 4.2, the saw tooth generator provides the saw tooth voltage which drives the horizontal axis element of the scope and this saw tooth voltage is the frequency controlled element of the voltage tuned oscillator. As the oscillator sweeps from f min to fmax of its frequency band at a linear recurring rate, it beats with the frequency component of the input signal and produce an IF, whenever a frequency component is met during its sweep. The frequency component and voltage tuned oscillator frequency beats together to produce a difference frequency, i.e. The IF corresponding to the component is amplified and detected if necessary and then applied to the vertical plates of the CRO, producing a display of amplitude versus frequency. Digital Fourier analyzer: A spectrum analyzer, which uses computer algorithm and an analog to digital conversion phenomenon and produces spectrum of a signal applied at its input is known as digital Fourier or digital FFT or digital spectrum analyzer. Principle When the analog signal to be analyzed is applied, the A/D converter digitizes the analog signal (i.e., converts the analog signal into digital signal). The digitized signal, which is nothing but the set of digital numbers indicating the amplitude of the analog signal as a function of time is stored in the memory of the digital computer. From the stored digitized data, the spectrum of the signal is computed by means of computer
21 algorithm. Description: The block arrangement of a digital Fourier analyzer is illustrated in the figure above fig 5.The analog signal to be ana1ysed is applied to the low pass filter, which passes only low frequency signals and rejects high pass spurious signals. This filter section is used mainly, to prevent aliasing. The output of low pass filter is given to the attenuator. The attenuator is a voltage dividing network whose function is to set the input signal to the level of the A/D converter. The use of attenuator prevents the converter from overloading. The function of A/D converter is to convert the samples of analog data into digital i.e.., to digitize the analog signal. When the output of A/D converter is applied to the digital computer, the computer analyzes the digitized data and adjusts the attenuator setting accordingly in order to obtain the maximum output from the inverter without any overloading. As soon as the entire analog signal is sampled and digitized by the A/D converter) computer performs calculations on the data according to the programmed algorithm and the calculated spectral components are stored in the memory of the computer. If the spectral display is to be viewed on the oscilloscope, the digital values of spectral components stored in the computer memory are converted into analog by using D/A converters and then applied to the CRO. Thus the spectral display of the input waveform is obtained on the CRT screen. Advantages 1. The use of computer avoids most of the hardware circuitry such as electronic switches. Filters and PLLs. The use of less hardware reduces the cost of the analyzer. 2. More mathematical calculations can be carried-out on the spectral display. 3. The rate of sampling analog signal can be modified in order to obtain better spectral display.
22
23 UNIT-4 Basic Features of a CRT: Electrostatic CRTs are available in a number of types and sizes to suit individual requirements. The important features of these tubes are as follows. 1. Size: Size refers to the screen diameter. CRTs for oscilloscopes are available in sizes of 1, 2,3, 5, and 7 inches. 3 inches is most common for portable instruments For example a CRT having a number 5GPI. The first number 5 indicates that it is a 5 inch tube. Both round and rectangular CRTs are found in scopes today. The vertical viewing size is 8 cm and horizontal is l0 cm. 2. Phosphor: The screen is coated with a fluorescent material called phosphor. This material determines the color and persistence of the trace, both of which are indicated by the phosphor. The trace colors in electrostatic CRTs for oscilloscopes ale blue, green and But green. White is used in TVs. and blue-white, orange, and yellow are used for radar Persistence is expressed as short, medium and long. This refers to the length of time the trace remains on the screen after the signal has ended. The phosphor of the oscilloscope is designated as follows. Pl --Green medium P2--Blue green medium P5--Blue very short P11--Blue short These designations are combined in the tube type number. Hence 5GPl is a 5 inch tube with a medium persistence green trace. Medium persistence traces are mostly used for general purpose applications Long persistence traces are used for transients, since they keep the fast transient on the screen for observation after the transient has disappeared. Short persistence is needed for extremely high speed phenomena, to prevent smearing and interference
24 caused when one image persists and overlaps with the next one. P11 phosphor is considered the best for photographing from the CRT screen. 3. Operating Voltages: the CRT requires a heater voltage of 6'3 volts ac or dc at 600mA. Several dc voltages are listed below. The voltages vary with the type of tube used. (i) Negative grid (control) voltage 14 V to V. (ii) Positive anode no. 1 (focusing anode) -100 V to - ll00 V (iii) Positive anode no. 2 (accelerating anode) 600 V to 6000V (iv) Positive anode no. 3 (accelerating anode) 200 v to v 4. Deflection Voltages: Either ac or dc voltages will deflect the beam. The distance through which the spot moves on the screen is proportional to the dc, or peak ac amplitude. The deflection sensitivity of the tube is usually stated as the dc voltage (or peak ac voltage) required for each cm of deflection of the spot on the screen 5. Viewing Screen: The viewing screen is the glass face plate, the inside wall of which is coated with phosphor. The viewing screen is a rectangular screen having graticules marked on it. The standard size used nowadays is 8 cm x l0 cm (8 cm on the vertical and 10 cm on horizontal). Each centimeter on the graticule corresponds to one division (div). The standard phosphor color use d nowadays is blue Triggered Sweep CRO: The continuous sweep is of limited use in displaying periodic signals of constant frequency and amplitude. When attempting to display voice or music signals, the pattern falls in and out of sync as the frequency and amplitude of the music varies resulting in an unstable display. A triggered sweep can display such signals, and those of short duration, e.g. narrow pulses. In triggered mode, the input signal is used to generate substantial pulses that trigger the sweep. Thus ensuring that the sweep is always in step with the signal that drives it. As shown in Fig. 2.1.resistance R3 and R 4 form a voltage divider such that the voltage Vo at the cathode of the diode is below the peak voltage i/o for UJT conduction. When the circuit is switched on, the UJT is in the non-conducting stage, and C, charges exponentially through RT. towards VBB until the diode becomes forward biased and conducts; the capacitor voltage never reaches the peak voltage required for UJT conduction but is clamped at Vo. If now a ve pulse of sufficient amplitude is applied to the base and the peak voltage Vp is momentarily lowered, the UJT fires. As a result, capacitor C. discharges rapidly through the UJT until the maintaining voltage of the UJT is reached; at this point the UJT switches off and capacitor CT charges towards VBB, until it is clamped again at VD fig 2.2 shows the output waveform
25 Delay line in triggered sweep circuit: Fig 3.1 indicates the amplitude of the signal raise time and the relative position of the sweep generator output signal. The diagram shows that when the delay line is not used, the initial part of the signal is lost and only part of the signal is displayed. To counteract this disadvantage the signal is not applied directly to the vertical plates but is passed through a delay line circuit, as shown in Fig This gives time for the sweep to start at the horizontal plates before the signal has reached the vertical plates. The trigger pulse is picked off at a time t0 after the signal has passed through the main amplifier. The sweep generator delivers the sweep to the horizontal amplifier and the sweep starts at the HDP at time t ns. Hence the sweep starts well in time, since the signal arrives at the VDP at time t ns. Vertical amplifier and Horizontal deflecting system: The sensitivity (gain) and frequency bandwidth (B.W) response characteristics of the oscilloscope are mainly determine by the vertical amplifier.since the gain-b W. product is constant, to obtain a greater sensitivity the B.W. is narrowed, or vice-versa. Some oscilloscopes give two alternatives, switching
26 to a wide bandwidth position, and switching to a high sensitivity position. The vertical amplifier consists of several stages, with fixed overall sensitivity gain expressed in V/div. The advantage of fixed gain is that the amplifier can be more easily designed to meet the requirements of stability and B.W. The vertical amplifier is kept within its signal handling capability by proper selection the input attenuator switch. The first element of the pre-amplifier is the input stage, often consisting of a FET source follower whose high input impedance isolates the amplifier from the attenuator. This FET input stage is followed by a BJT emitter follower, to match the medium impedance of FET output with the low impedance input of the phase inverter. This phase inverter provides two anti phase output signals which are required operate the pushpull output amplifier. The push-pull output stage delivers equal signal voltages of opposite polarity to the vertical plates of the CRT. The advantages of push-pull operation in CRO are similar to those obtained from push-pull operation in other applications; better voltage cancellation ran the source or power supply (i.e. dc), even harmonic suppression, especially large 2nd harmonic is cancelled out, and greater power output per tube as a suit of even harmonic cancellation. In addition, a number of defocusing and non linear effects are reduced, because neither plate is at ground potential. HORIZONTAL DEFLETING SYSTEM: The horizontal deflecting system consist of a time base Generator and an output amplifier. Sweep or Time Base Generator A continuous sweep CRO using a UJT as a time base generator is shown in Fig The UJT is used to produce the sweep. When the power is first applied, the UJT is off and the CT charges exponentially through RT. The UJT emitter voltage VE rises towards VBB and when VE reaches the peak voltage VP, as shown in Fig. 4.3, the emitter to base '1' (B1) diode becomes forward biased and the UJT triggers ON. This provides a low resistance discharge path and the capacitor discharges rapidly. The emitter voltage VE reaches the minimum value rapidly and the UJT goes OFF. The capacitor recharges and the cycle repeats. To improve sweep linearity, two separate voltage supplies are used, a low voltage supply for UJT and a high voltage supply for the RTCT circuit.rt is used for continuous control of frequency within a range and CT is varied or changed in steps for range changing. They are sometimes called as timing resistor and timing capacitor respectively. The sync pulse enables the sweep frequency to be exactly equal to the input signal frequency, so that the signal is locked on the screen and does not drift.
27 Basic principal involved in Signal Display Unit: The amplitude of a voltage may be directly measured on a calibrated viewing screen from the length of the straight line trace it produces.this is entirely satisfactory for dc voltage. But the straight line tells little, or practically nothing, about the waveform of an ac voltage, pulsating voltage or transient. What is required is a graph of the voltage traced on the screen by the ac spot (a graph of amplitude versus time).to obtain such a display the signal voltage is applied to the vertical plates (directly or through the vertical amplifier) and it moves the spot vertically I positions, corresponding to the instantaneous values of the signal. Simultaneous the spot is moved horizontally by a sweep voltage applied to the horizontal plates.the combined action of these two voltages causes the spot to produce a trace on the screen. The horizontal sweep voltage produces the time base by moving the spot horizontally with time, while the signal moves the spot vertically in proportional to the voltage at a particular instant of time. There are two important sweep generator requirements: 1. The sweep must be linear (the sweep voltage must rise linearly to the maximum value required for full screen horizontal deflection of the spot). 2. The spot must move in one direction only, i.e. from left to right only, else the signal will be traced backwards during the return sweep. This means that the sweep voltage must drop suddenly after reaching its maximum value. These requirements call for a sweep voltage having a linear saw tooth waveform 1. Recurrent Sweep: When the saw tooth, being an ac voltage alternates rapidly, re display occurs repetitively, so that a lasting image is seen by the eye. This -treated operation is recurrent sweep. 2. Single Sweep: The signal under study produces a trigger signal, which in turn produces a single sweep. 3. Driven Sweep: The saw tooth oscillator is a free running generator when p crated independently. There is a chance that the sweep cycle may start after the signal cycle, thereby missing a part of the signal. Driven sweep removes this possibility because it is fixed by the signal itself. The sweep and signal cycles start at the same time. 4. Triggered Sweep: In a recurrent mode, the pattern is repeated again and again. In this mode the voltage rises to a maximum and then suddenly falls to a minimum. Electron beam moves slowly from left to right, retraces rapidly to the left and I, pattern is repeated. The horizontal sweep action takes place whether the input signal is applied to the oscilloscope or not, and a horizontal line is displayed on the scope screen. A triggered sweep, on the other hand, does not start unless initiated by a trigger voltage, generally derived from an incoming signal. In the absence of the input signal the sweep is held off and the CRT screen is blanked. The continuous or recurrent sweep uses a free running multi vibrator (m/v) which covers a wide frequency range and can be locked into synchronization by input signal. Sync takes place when the sweep frequency and the input signal frequency are the same or when the former is a multiple of the latter. A triggered scope does not use a continuous or recurrent sweep, but uses a mono stable multi vibrator which is in its off state until a trigger pulse arrives; hence there is no deflection on the screen. When an input signal is applied, a trigger pulse is generated and applied to the multi vibrator, which switches on and produces a sweep signal, and a trace appears on the screen. After a specific voltage, depending on the CRT beam arriving on the RHS, the multi vibrator switches back to its off state, causing the beam to return rapidly to the LHS. (The basic difference between recurrent and triggered
28 scopes is that the recurrent sweep locks at the frequency of the input signal, while the triggered scope displays a trace for a specific period of time. Hence, the triggered scope is ON during a specific time interval and will display a waveform or a segment of waveform (e.g. a one shot waveform) regardless of the signal frequency. Hence transients or single clamped oscillations can be observed on the screen.) Most triggered scopes use a convenient feature of calibrating the sweep speed, in time per cm or division. Sweep frequency is the reciprocal of the time period. 5. Intensity Modulation In some applications an ac signal is applied to the control electrode of the CRT. This causes the intensity of the beam to vary in step with signal alternations. As a result, the trace is brightened during the +ve half cycles and diminished or darkened during ve half cycles. This process is called intensity modulation or Z-axis modulation (in contrast to X- axis for horizontal and y- axis for vertical). It produces bright segments or dots on the trace in response to positive peak or dim segments or holes in response to negative peaks. Measurement of frequency using CRO: The frequency of a signal is measured using oscilloscope in two methods. They are, 1. Using calibrated oscilloscope 2. Using uncelebrated oscilloscope. Measurement of Frequency using Calibrated Oscilloscope It is the indirect method of measurement of frequency. In this method, the frequency of unknown signal is measured by measuring its time period. Initially, the unknown frequency signal is applied to the vertical inputs of the CRO. Now the horizontal sweep is turned ON and the display appealing on the screen is adjusted by varying different control knobs provided on the front panel of CRO, till the signal is suitably displayed on the screen. After obtaining the display of good deflection, count the number of horizontal division for a complete cycle. From the counted horizontal divisions, the time period is computed as, Where m=number of division in one complete cycle n=setting of time base =Time/Division T=m*n From the measured time period of the signal, the unknown frequency is calculated as, f =1/T 2. Measurement of Frequency using Uncelebrated Oscilloscope It is the direct method of measurement of frequency. In this method, initially a signal whose frequency is known is applied to the horizontal input terminals whereas a signal whose frequency is to be known is applied to the vertical input terminals of CRO. Now different control knobs provided on the CRO are adjusted till a pattern of loops appear on the CRT screen. Here, the displayed pattern of loops cut by
29 horizontal line and also vertical line. The number of loops that are cut by horizontal line gives the frequency of signal applied to vertical plate (fv), whereas, the number of loops cut by vertical line gives the frequency of signal applied to horizontal plates (fh). Therefore we have. f v / fh = Number of loops cut by horizontal line/number of loops cut by vertical line If the frequency of the signal applied to the horizontal input is 100 Hz. For the 100 Hz frequency signal, say the number of loops cut by horizontal line is 1 and the numbers of loops cut by vertical line are 2. Deflection of the vertical axis of an oscilloscope is actually the deflection of electron beam in the vertical direction. To deflect the electron beam vertically, a pair of parallel plates is used. One vertical deflection plate (V1) is placed above the electron beam and the other vertical deflection plate is placed below the electron beam. The vertical axis is deflected by applying vertical deflection voltages to the vertical deflection plates. The vertical deflection voltage is derived from the input signal to be analyzed by the oscilloscope. Usually, high Voltages are required to drive the deflection plates. Hence, a vertical amplifier is used to amplify the input signal to such an extent that it can deflect the electron beam. The vertical amplifier amplifies the input signal and produces a two ended signal i.e., two signal voltages of equal amplitude but of opposite polarities. These two signal voltages are fed to the vertical deflection plates V1 and V2 (Y-plates) of CRO. The electron beam is a negatively charged beam because it contains electrons (negative charge particles). When the voltage at V1 is negative then the voltage at V2 will be positive. The positive deflection voltage at V1 attracts the electron beam to V2 and the negative voltage at V2 repels the electron beam from V1. As a result the electron beam is deflected vertically downwards (i.e., towards V2 plate). When the voltage at V1 is positive, then the voltage at V2 will be negative. The positive voltage at V1 attracts the beam to V1 and the negative voltage at V2 repels the beam from V2. As a result the electron beam is deflected vertically upwards (i.e., towards V1). The horizontal axis of an oscilloscope is deflected by applying horizontal deflection voltage to the horizontal deflection plates. The horizontal deflection voltage is derived from a saw-tooth signal. A pair of parallel plates (H1, and H2) placed vertically on either side of the electron beam in the CRT, serve as horizontal deflection plates (X-plates). One plate H1 is kept on left side and other plate R2 is kept on right side of the electron beam. A saw-tooth signal is amplified by the horizontal amplifier (identical to the vertical amplifier). The horizontal amplifier also produces two signal voltages of equal amplitude but of opposite polarities. These two voltages are fed to the horizontal deflection plates. When the deflection voltage at H1 is negative then the deflection voltage at H2 will be positive. The positive voltage at H2 attracts the electron beam to H2 and the negative voltage at H1 repels the electron beam from H1. As a result, the beam is deflected horizontally to the right. Similarly, the beam is deflected horizontally to the left when the voltage at H1 is positive and the voltage at H2 is negative. The difference in the deflection of vertical and horizontal axis lies in the
30 voltages that drive the respective deflection plates. The vertical deflection plates are driven by the amplified input signal whereas the horizontal deflection plates are driven by an amplified saw-tooth signal which serves as a time-base signal. Advantages of General Purpose Oscilloscope: 1. It provides a graphical display of the amplitude of a signal as a function of time. Hence, it is used to measure various electrical parameters. 2. Amplitude of signals like voltage, current, power etc., can be measured by the oscilloscope. 3. Apart from amplitude measurement, it can measure frequency, phase angle, time delay of the signal, time between two events, and relative timing of two related signals. 4. It has an advantage over electro-mechanical measuring devices that it can respond very well to high frequency signals because it is completely an electronic device. 5. General purpose CRO's are used for maintenance of electronic equipment and laboratory work. 6. It can also be used to measure capacitance, inductance, etc. General purpose oscilloscope: A general purpose oscilloscope consists of following parts. 1. Cathode ray tube 2. Vertical amplifier 3. Delay line 4. Time base circuit 5. Horizontal amplifier 6. Trigger circuit 7. Power supply. 1. Cathode Ray Tube It is the heart of the oscilloscope. When the electrons emitted by the electron gun strikes the phosphor screen of the CRT, a visual signal is displayed on the CRT. 2. Vertical Amplifier The input signals are amplified by the vertical amplifier. Usually, the vertical amplifier is a wide band amplifier which passes the entire band of frequencies. 3. Delay Line As the name suggests that, this circuit is used to, delay the signal for a period of time in the vertical section of CRT. The input signal is not applied directly to the vertical plates because the part of the signal gets lost, when the delay Time not used. Therefore, the input signal is delayed by a period of time. 4. Time Base Circuit Time base circuit uses a uni junction transistor, which is used to produce the sweep. The saw tooth voltage produced by the time base circuit is required to deflect the beam in the horizontal section. The spot
31 is deflected by the saw tooth voltage at a constant time dependent rate. 5. Horizontal Amplifier The saw tooth voltage produce by the time base circuit is amplified by the horizontal amplifier before it is applied to horizontal deflection plates 6. Trigger Circuit The signals which are used to activate the trigger circuit are converted to trigger pulses for the precision sweep operation whose amplitude is uniform. Hence input signal and the sweep frequency can be synchronized. 7. Power supply: The voltages require by CRT, horizontal amplifier and vertical amplifier are provided by the power supply block. Power supply block of oscilloscope is classified in to two types (1) Negative high voltage supply (2) Positive low voltage supply The voltages of negative high voltage supply is from -1000V to -1500V.The range of positive voltage supply is from 300V to 400V Advantages of dual beam for multiple trace oscilloscopes 1. A multiple trace oscilloscope making use of dual beam provides a simultaneous display of the two input waveforms on the CRO screen. Hence dual beam CRO is used to compare one signal with another signal. 2. It can capture two fast transient events. 3. It also provides a continuous display of the signals, whereas the display of the two signals provided by a dual trace oscilloscope consists of small gaps in the trace. 4. It has two separate vertical channels for two input signals. 5. It can also have two separate time base circuits (i.e. horizontal deflection systems). Hence, in dual beam CRO two input signals can be swept horizontally at different rates. Due to this feature, a fast signal can be graphically compared with a slow signal simultaneously on the CRO screen.
32 UNIT-5 Storage oscilloscope: Storage targets can be distinguished from standard phosphor targets by their ability to retain a waveform pattern for a long time, independent of phosphor persistence.
33 Two Storage techniques are used in oscilloscope CRTs, mesh storage and phosphor storage. A mesh storage CRT, shown in Fig. 1.1, contains a dielectric material deposed on a storage mesh, a collector mesh, flood guns and a collimator, in addition BO all the elements of a standard CRT. The storage target, a thin deposition of a dielectric material such as Magnesium Fluoride on the storage mesh, makes use of a property known as secondary emission. The writing gun etches a positively charged pattern on the storage mesh or target by knocking off secondary emiss ion electrons. Because of the excellent insulating property of the Magnesium fluoride coating, this positively charged pattern remains exactly in the position where it is deposited. In order to make a pattern visible, a special electron gun, called the flood gun, is switched on (even after many hours). The electron paths ire adjusted by the collimator electrode, which constitutes a low voltage electrostatic lens system (to focus the electron beam), as shown in Fig Most of the electrons are stopped and collected by the collector mesh. Only electrons near the stored positive charge are pulled to the storage target with sufficient force to hit the phosphor screen. The CRT will now display the signal and it will remain visible as long as the flood guns operate. To erase the pattern on the storage mesh, a negative voltage is applied to neutralize the stored positive charge.

34 Since the storage mesh makes use of secondary emission, between the first and second crossover more electrons are emitted than are absorbed by the material, and hence a net positive charge results. Below the first crossover a net negative charge results, since the impinging electrons do not have sufficient energy to force an equal number to be emitted. In order to store a trace, assume that the storage surface is uniformly charge; and write gun (beam emission gun) will hit the storage target. Those areas of the storage surface hit by the deflecting beam lose electrons, which are collects by the collector mesh. Hence, the write beam deflection pattern is traced on the storage surface as a positive charge pattern. Since the insulation of the dielectric material is high enough to prevent any loss of charge for a considerable length of time, the pattern is stored. To view, the stored trace, a flood gun is used when the write gun is turned off. The flood gun, biased very near the storage mesh potential, emits a flood of electrons which move towards the collector mesh, since it is biased slightly more positive than the deflection region. The collimator,a conductive coating on the CRT envelope with an applied potential, helps t o align the flood electrons so that they approach the storage target perpendicularly When the electrons penetrate beyond the collector mesh, they encounter either a positively charged region on the storage surface or a negatively charged region where no trace has been stored. The positively charged areas allow the electrons to pass through to the post accelerator region and the display target phosphor. The negatively charged region repels the flood electrons back to the collector mesh. Thus the charge pattern on the storage surface appears reproduced on the CRT display phosphor just as though it were being traced with a deflected beam. Dual Trace Oscilloscope: Figure 2.1 shows the block diagram of dual trace oscilloscope which consist of following steps, 1. Single electron gun 2. Two separate vertical input channels 3. Attenuators and pre-amplifiers 4. Electronic switch.

35 With the help of electronic switching the two separate input signals can be applied to single electron gun. Produces a dual trace display.each separate vertical input channel uses separate attenuators and preamplifier stages, so, that the amplitude of each signal can be independently controlled. Output of the preamplifiers is given to the electronic switch, which passes one signal at a time into the main vertical amplifier of the oscilloscope. The time base-generator is similar to that of single input oscilloscope. By using switch S 2 the circuit can be triggered on either A or B channel, waveforms, or an external signal, or on line frequency. The horizontal amplifier can be fed from sweep generator or from channel B by switching S1. When switch S, is in channel B, its oscilloscope operates in the X- Y mode in which channel A acts as the vertical input signal and channel B as the horizontal input signal. From the front panel several operating modes can be selected for display, like channel B only, channel A only, channels B and A as two traces, and signals A + B, A - B, B ~ A or - (A + B) as a single trace. Two types of common operating mode are there for the electronic switch, namely, 1. Alternate mode 2. Chop mode. 1. Alternate Mode In case of alternate mode, electronic switch alternately connects the main vertical amplifier to channel A and B and adds a different D.C. component to each signal. Due to this D.C. component the beam alternately goes to the upper and lower half of the screen. Switching is carried out at the start of each new sweep of the time base generator. To obtain the cathode ray tube spot it traces the channel A signal on one sweep and the channel B signal on the succeeding sweep. The switching rate of the electronic switch is synchronized to the sweep rate. The alternate mode cannot be used for displaying very low frequency signals.

36 2. Chop Mode In chop mode electronic switch runs at a very high frequency of the order of khz. This results in connecting small segment of waveform A and waveform B, alternately to vertical amplifier to display it on the screen. The display will be a continuous line for each channel when chopping rate much faster than horizontal sweep rate. In case when the chopping rate is slow the continuity of the display is lost hence it is preferable to use alternate mode of operation. /ECE Digital Storage Oscilloscope: Storage cathode ray tube has several limitations. They are as follows, 1. There is a short duration of time, in which it can preserve a stored waveform, so the waveform may lose. 2. Trace of storage tube is not as fine as that of a normal CRT. 3. Writing rate of the storage tube is less than that of a conventional CRT which in turn limits the speed of the analog storage oscilloscope. 4. It is more expensive than a conventional CRT and requires additional power supplies. 5. Only one image can be stored. For comparing two traces they are to be superimposed on the same and displayed together. Digital storage oscilloscope is used to limit these limitations. In DSO, the waveform to be stored is digitized, stored in a digital memory and retrieved for display on the storage oscilloscope.

37 Stored waveform is continuously displayed by repeatedly scanning it. Therefore a conventional CRT can also be used for the display. The stored display can be displayed continuously as long as the power is applied to the memory which can be supplied from a small battery. Digitized waveform can be analyzed by oscilloscope or by reading the contents of the memory into the computer. Display of the stored data is possible in both amplitude versus time and x-y modes. In DSO, fast memory readout is used for CRT display in addition to this a slow readout is also possible which is used for development of hard copy externally. Figure shows the block diagram of DSO which consists of, 1. Data acquisition 2. Storage 3. Data display. Data acquisition is earned out with the help of both analog to digital and digital to analog converters, which is used for digitizing, storing and displaying analog waveforms. Overall operation is controlled by control circuit which is usually consists of microprocessor. Data acquisition portion of the system consist of a Sample-and-Hold (S/H) circuit and an analog to digital converter (ADC) which continuously samples and digitizes the input signal at a rate determined by the sample clock and transmit the digitized data to memory for storage. The control circuit determines whether the successive data points are stored in successive memory location or not, which is done by continuously updating the memories. When the memory is full, the next data point from the ADC is stored in the first memory location writing over the old data. The data acquisition and the storage process is continues till the control circuit receive a trigger signal from either the input waveform or an external trigger source. When the triggering occurs, the system stops and enters into the display mode of operation in which all or some part of the memory data is repetitively displayed on the cathode ray tube. In display operation, two DACs are used which gives horizontal and vertical deflection voltage for the CRT Data from the memory gives the vertical deflection of the electron beam, while the time base counter gives the horizontal deflection in the form of staircase sweep signal. The screen display consist of discrete dots representing the various data points but the number of dot is very large as 1000 or more that
38 they tend to blend together and appear to be a smooth continuous waveform. The display operation ends when the operator presses a front-panel button and commands the digital storage oscilloscope to begin a new data acquisition cycle. SAMPLING OSCILLOSCOPE An ordinary oscilloscope has a B.W. of 10 MHz the HF performance can be improved by means of sampling the input waveform and reconstructing its shape from the sample, i.e. the signal to be observed is sampled and after a few cycles sampling point is advanced and another sample is taken. The shape of the wave form is reconstructed by joining the sample levels together. The sampling frequency may be as low as 1/10th of the input signal frequency (if the input signal frequency is 100 MHz, the bandwidth of the CRO vertical amplifier can be as low as 10 MHz). As many as 1000 samples are used to reconstruct the original waveform. Fig 4.1 shows a block diagram of a sampling oscilloscope. The input is applied to the sampling gate. The input waveform is sampled whenever a sampling pulse opens the sampling gate. The sampling must be synchronized with the input signal frequency. The signal is delayed in the vertical amplifier, allowing the horizontal sweep to be initiated by the input signal. The waveforms are shown in fig 4.2 At the beginning of each sampling cycle, the trigger pulse activates an oscillator and a linear ramp voltage is generated. This ramp voltage is applied to a voltage comparator which compares the ramp voltage to a staircase generate-when the two voltages are equal in amplitude, the staircase advances one step and a sampling pulse is generated, which opens the sampling gate for a sample of input voltage.
39 The resolution of the final image depends upon the size of the steps of the staircase generator. The smaller the size of the steps the larger the number o f samples and higher the resolution of the image. Difference between digital storage oscilloscope and conventional storage oscilloscope: Digital Storage Oscilloscope (DSO) 1. It can store the given signal indefinitely as long as the small amount of power is supplied to the memory. 2. It always collects the data and stops when triggered. 3. It employs normal CRT, hence the cost of the tube is much cheaper than the storage tube used in ASO. 4. It can produce bright image even for high frequency signals. 5. In this oscilloscope, time base is generated, by a crystal clock. 6. It has higher resolution than ASO. 7. It has less operating speed than ASO. Phase Measurement: Conventional Storage Oscilloscope (Analog Storage Oscilloscope (ASO)) 1. In this oscilloscope heavy amount-of power is to be supplied to the storage CRT. 2. It collects the data only after triggering. 3. The cost of the tube is costlier than the storage tube used in DSO. 4. It cannot produce bright image for high frequency signals. 5. In this oscilloscope, time base is generated by a ramp circuit. 6. It has lower resolution than DSO. 7. It has high operating speed than DSO. When sinusoidal voltages simultaneously applied to vertical and horizontal plates, the pattern, appearing on the CRT is called as Lissajous pattern in this method the standard known frequency is applied to X-plate or horizontal plate. The resulting pattern appeared on the screen depends on phase relationship between the two frequencies.


40 Equal voltages of same frequency but of different phase angles- cause the pattern to vary from a straight diagonal line to ellipses of different eccentricities. The sine of the phase angle between the voltages is given by equation, Sinφ = y1 /y2 = x1/x2 As shown in figure 6. 1 the gains of horizontal or vertical amplifiers are adjusted so that ellipse fits exactly into a square marked by lines on the screen. Frequency Measurement Lissajous pattern also helps to measure frequency. The signal whose frequency is to be measured is given I F-plates or vertical plates and the signal whose frequency is given to X-plates or horizontal plates. Now the
, Let, fv - Unknown frequency signal applied to vertical plates. fh - Known frequency signal applied to horizontal plates.")
41 know frequency or standard frequency is adjusted so Lissajous patterns can be obtained on the screen which depends on the ratio of two frequencies. In the given figure (2), Let, fv - Unknown frequency signal applied to vertical plates. fh - Known frequency signal applied to horizontal plates. Two lines are drawn, one vertical and one horizontal so that they do not pass through any intersection o Lissajous pattern. Then the number of intersections of the horizontal and vertical lines with the Lissajous patterns and counted separately. So after finding the tangencies if we know vertical plate. we can easily calculate the unknown frequency applied to All electronic circuits in the oscilloscope like attenuators, time base generators, amplifiers cause some amount of time delay while transmitting signal voltage to deflection plates. We also know that horizontal signal is initiated or triggered by some portion of output signal applied to vertical plates of CRT. So the delay line is used to delay the signal for some time in the vertical section of CRT. Logic of a time base of a frequency counter: The logic diagram of a time base for a frequency counter is shown in figure, the expected output from the time base are, (i) Reset pulse (ii) Gating pulse (iii) Store pulse. The above pulses must be produced without overlap. If the wanted gate pulse duration is larger than the frequency period of the crystal then the frequency of crystal oscillator is divided by powers of ten. The binary counter consist of 1 6 states since it is a 4 bit counter The reset pulse is provided by the decoded zero state of the binary counter. To produce open gate pulse the 2 nd state of the binary counter is decoded. To
42 produce a delay period after the reset pulse the 1 st state of the binary counter was not.used. The gate remains, open In between 2 n state and 1 2 l ' state of the binary counter. Therefore, the close gate pulse is produced by the decoded 1 2 state of the binary counter. To produce a delay before storing the counter is latch during 14 th state of the binary counter; the 1 3 ' state i» not decoded The non overlap between the reset and store pulses can provided-by the non decoded 15 th state of the binary counter. A switch is used i n this arrangement, to select the, gate time intervals of the frequency counter. In the above figure 1 sec, 0.1 sec, 0.01 sec are the available gate time intervals and 1 Hz, 1 0 Hz, 100 Hz are the available input frequencies ATTENUATORS Attenuators are designed to change the magnitude of the input signal seen at input stage, while presenting constant impedance on all ranges at the attenuator input. A compensated RC attenuator is required to attenuate all frequencies equal without this compensation, HF signal measurements would always have to take the input circuit RC time constant into account. The input attenuator must provide the correct sequence while maintaining a constant input impedance, as well as maintain both the input impedance a: attenuation over the frequency range for which the oscilloscope is designed. Uncompensated Attenuators The circuit diagram shown in Fig. 8.1 gives a resistive divider attenuator connected to an amplifier with a 10 pf input capacitance. If the input impedance of the amplifier is high, the input impedance of the attenuator is relatively constant immaterial of the switch setting of the attenuator. The input impedance, as seen by the amplifier, changes greatly depending on the setting of the attenuator. Because of this, the RC time constant and frequency response of the amplifier are dependent on the setting of the attenuator, which an undesirable feature. Simple Compensated Attenuator The diagram in Fig.8.1 shows an attenuator with both resistive and capacitive voltage dividers. The capacitive voltage dividers improve the HF response of the attenuator. This combination of capacitive and resistive voltage dividers is known as a compensated attenuator. For oscilloscopes where the frequency range
43 extends to 100 MHz and beyond, more complex dividers are used. Fig 8.2 shows an attenuator divider between the input and output of the vertical deflection preamplifier. If a probe were connected to the oscilloscope, the input impedance at the probe tip would have a greater capacitance because of the added capacitance of the probe assembly and of the connecting shielded cable. If it is desired for HF oscilloscopes to have an input capacitance of much less than pf, an attenuator probe is used. Figure 8.1 shows a 10 to 1 attenuator probe connected to the input of the oscilloscope. Within the probe tip is a 9MΩ resistor and shunted across this resistor is a capacitor.this capacitor is adjusted so that the ratio of the shunt capacitance to the series capacitance is exactly 10 to 1. The attenuator probe often called a 10 to 1 probe provides an approximately 10 to1 reduction in the input capacitance. However, it is also gives a 10 to 1 reduction in overall oscilloscope sensitivity. The input capacitance is not constant from one oscilloscope to another hence the probe is provided with an adjustable compensating capacitor.if the ratio of the series to shunt is not adjusted precisely to 10 to 1; the frequency response of the oscilloscope will be flat. Digital read out oscilloscope: The digital read out oscilloscope instrument has a CRT display and a counter display. The diagram shown is of an instrument where the counter measures the time (Fig. 9.1)
44 The input waveform is sampled and the sampling circuit advances the sampling position in fixed increments, a process called strobing. The equivalent me between each sample depends on the numbers of sample taken per cm and the sweep time/cm, e.g. a sweep rate of 1 nano-sec/cm and a sampling rate of J samples/cm gives a time of 10 pico-sec/sample. Figure 9.1 shows a block diagram of a digital read out oscilloscope when measuring voltage. Two intensified portions of the CRT trace identify 0% and 100% zones position. Each zone can be shifted to any part of the display. The voltage divider Bps between the 0% and 100% memory voltage are set for start and stop timing, The coincidence of any of the input waveforms with the selected percentage point is sensed by this voltage comparator. The numbers of the clock pulse which correspond to the actual sample taken are read out digitally in a Nixie display tube in ns, µs, ms or seconds. Figure 9.2 shows a block diagram of a digital readout CRO when used for voltage to time conversion. The CRT display is obtained by sampling the 0% reference voltage as chosen by the memory circuit. A linear ramp generator produces a voltage; when the ramp voltage equals the 0% reference the gate opens. When the ramp equals 100% reference the gate closes. The number of clock pulses that activate the counter is directly proportional to the voltage between the selected references and is read out in mv or volts by the Nixie tube display. i) A and B Chopped Display Mode In chopped display mode of dual-trace oscilloscope, the electronic switch switches between the channels A and B at very high frequency (usually at khz). Due to very fast switching between the input channels, small segments (of about 1 us duration) of each input waveform get coupled

45 alternately to the vertical amplifier and get traced on the screen. Thus, the display of input signal waveform will be a dashed-line trace of the actual input waveform, with small gaps between its segments. The continuity of the trace of the waveform depends on chopping (i.e., switching) frequency and the frequency of the input signal. Usually, the chopping frequency must be higher than the input signal frequency and sweep frequency. In chop mode, the traces of high frequency signals do not appear continuously as shown in fig Whereas in case of low frequency signals, the gaps between the segments are so small that the trace of low frequency signal appears to be a continuous waveform. Hence, chop mode display is usually preferred for low frequency signals. (ii) A and B Alternate Display Mode The alternate display mode also involves alternate switching of the input signals to the vertical amplifier with the help of an electronic switch but at low switching rates. In this mode, the electronic switch is allowed to switch between the input channels at a frequency equal to the sweep frequency. Due to this, the signal on channel A gets connected to the vertical amplifier and is traced on the CRO screen during one sweep. Similarly, the signal on channel B gets traced during the succeeding sweep, as shown in fig As the two input waveforms are traced at different times, they do not appear to be displayed simultaneously on the screen. The alternate mode is preferred for high frequency signals (rather than low frequency signals) because the waveform traces appear to be continuous and displayed simultaneously due to high repetition frequency.
46 Unit-6 Maxwell s Bridge: Maxwell's bridge, shown in Fig. 1.1, measures an unknown inductance in of standard arm offers the advantage of compactness and easy shielding. The capacitor is almost a loss-less component. One arm has a resistance R x in parallel with C u and hence it is easier to write the balance equation using the admittance of arm 1 instead of the impedance.
47 The general equation for bridge balance is Maxwell's bridge is limited to the measurement of low Q values (1-10).The measurement is independent of the excitation frequency. The scale of the resistance can be calibrated to read inductance directly. The Maxwell bridge using a fixed capacitor has the disadvantage that there an interaction between the resistance and reactance balances. This can be avoids: by varying the capacitances, instead of R 2 and ft, to obtain a reactance balance. However, the bridge can be made to read directly in Q. The bridge is particularly suited for inductances measurements, since comparison on with a capacitor is more ideal than with another inductance. Commercial bridges measure from H. With ± 2% error. (If the Q is very becomes excessively large and it is impractical to obtain a satisfactory variable standard resistance in the range of values required). Wien s Bridge: Wien Bridge shown in Fig. 2.1 has a series RC combination in one and a parallel combination in the adjoining arm. Wien's bridge in its basic form is designed to measure f r e q u ency. It can also be used for the instrument of an unknown capacitor with great accuracy,
48 The impedance of one arm is The admittance of the parallel arm is Using the bridge balance equation, we have
49 The two conditions for bridge balance, (1.1) and (1.3), result in an expression determining the required resistance ratio R 2 /R 4 and another express determining the frequency of the applied voltage. If we satisfy Eq. (1.1) an also excite the bridge with the frequency of Eq. (1.3), the bridge will be balanced. In most Wien bridge circuits, the components are chosen such that R 1 = R 3 = R and C 1 = C 3 = C. Equation (1.1) therefore reduces to R 2 IR 4 =2 at Eq. (1.3) t o f= 1/2ПRC, which is the general equation for the frequency of fl bridge circuit. The bridge is used for measuring frequency in the audio range. Resistances R 1 and R 3 can be ganged together to have identical values. Capacitors C 1 and C 3 are normally of fixed values. The audio range is normally divided into k - 20 khz range In this case, the resistances can be used for range changing and capacitors, and C 3 for fine frequency control within the range. The bridge can also be use for measuring capacitances. In that case, the frequency of operation must be known. The bridge is also used in a harmonic distortion analyzer, as a Notch filter, an in audio frequency and radio frequency oscillators as a frequency determine element. An accuracy of 0.5% - 1% can be readily obtained using this bridge. Because it is frequency sensitive, it is difficult to balance unless the waveform of the applied voltage is purely sinusoidal. Wheat stone s Bridge: Whetstone s bridge is the most accurate method available for measuring resistances and is popular for laboratory use. The circuit diagram of a Wheatstone bridge is given in Fig. The source of emf, a sensitive current indicating meter, the galvanometer, is connected to points 1 and 2. The galvanometer is a sensitive micro ammeter a zero center scale. When there is no current through the meter, the galvanometer pointer rests at 0, i.e. mid scale. Current in one direction causes the points deflect on one side and current in the opposite direction to the other side.
50 When SW 1 is closed, current flows and divides into the two arms i.e. I 1 and I 2. The bridge is balanced when there is no current through the galvanometer, or when the potential difference at points 1 and 2 is equal, i.e. the potential across the galvanometer is zero. To obtain the bridge balance equation, we have from the fig, For the galvanometer current to be zero, the following conditions should be satisfied By substitution in the first equation, This is the equation for the bridge to be balanced. In a practical Whetstone s bridge, at least one of the resistance is made adjustable, to permit balancing. When the bridge is balanced, the unknown resistance (normally connected at R 4 ) may be determined from the setting of the adjustable resistor, which is called a standard resistor because it is a precision device having very small tolerance. Errors in PMMC Ammeters The accuracy in a moving coil instruments example, an ammeter is dictated by the following sources of errors. (i) Weakening of permanent magnets due to ageing and temperature effects.
51 (ii) The weakening of springs due to regular usage and temperature effects. (iii) Variation in Resistance of moving coil with temperature. The copper wire wound has a temperature coefficient of about 0.004/ C. When this instrument used for measurement of very small currents in the milli-amp or micro-amp range, the moving coil is directly connected to the output terminals of the instrument. The indication would then decrease by 0.04% per C rise in temperature for a constant current. Errors in Wheatstone bridge Measurements The accuracy of measurement of resistance in a Wheatstone bridge is affected by the following sources. (i) Resistance of connecting leads and contact resistance. (ii) Thermo electric effects. The galvanometer deflection is affected by thermo electric emfs which are often present in the measuring circuit. (iii) Temperature effects: The change in resistance due to variation of temperature causes serious errors in measurement. The error are more predominant in the case of resistors are made up of materials having high temperature coefficients. In the case of copper having a temperature coefficient of 0.004/ C, a change in temperature of ±1 C causes an error of about ±0.4%. Applications of Wheatstone bridge 1. The basic application of a Wheatstone bridge is measurement of resistance. It is used to measure medium resistance values. 2. It can also be used to measure inductance and capacitance values. 3. Various industrial applications involve measurement of physical quantities (such as temperature, pressure, displacement etc) in terms of electrical resistance. The various industrial applications in which a Wheatstone bridge is used are. (i) Temperature measurement systems involving electrical resistance thermometers as temperature sensors. (ii) Pressure measurement systems involving strain gauge as secondary transducer. (iii) Measurement of static and dynamic strains. (iv) It is used with explosive meter to measure the amount of combustible gases in a sample. (v) Temperature measurement systems involving electrical resistance thermometers as temperature sensors. (vi) Pressure measurement systems involving strain gauge as secondary transducer. 4. Measurement of static and dynamic strains. 5. It is used with explosive meter to measure the amount of combustible gases in a sample. Limitations of Wheatstone bridge
52 1. Wheatstone bridge is not suitable for measuring low resistances because the resistance of leads and contacts of the bridge cause errors in the value measured by the Wheatstone bridge and thus affects the measurement of low resistances. 2. Wheatstone bridge cannot be used for measurement of high resistance also, because a galvanometer is not sensitive to the imbalance of the bridge caused by the high resistance of the bridge. This problem can be overcome by replacing the galvanometer with a Vacuum Type Volt Meter (VTVM) and by replacing the battery with a power supply. Andersons Bridge: The Anderson Bridge is a very important and useful modification of the Maxwell-Wein bridge as shown in the fig 6.1 (a) The balance condition for this bridge can be easily obtained by converting the mesh impedance C,R 3,R 5 to a equivalent star with the star point 0 as shown in fig 6.1 (b) by using star/delta transformation As per delta to star transformation
53 Hence with reference to fig 6.1(b) it can be seen that For balance bridge condition, Simplifying, Equating the real terms and imaginary terms,


54 Therefore, This method is capable of precise measurement of inductance and a wide range of values from a few µh to several Henry. Q-meter: The instrument which measures some of the electrical properties of coils and capacitors is referred as Q- meter. The working principle of a Q-meter depends on the characteristics of a series resonance circuits, i.e., the voltage drop across the coil or capacitors is equal to the applied voltage times the Q factor of the circuit. Thus if the circuit subjected to a fixed voltage, the voltmeter connected across the capacitor is calibrated to indicate the Q value directly. A series resonance circuit and its voltage and current relationship at resonance conditions are illustrated in figure 8.1 (i) and fig 8.1 (ii) respectively. At resonance condition, X L = X C E C = I X L= IX C E = I R
55 Where, X C = Capacitive reactance X L= Inductive reactance I = Current flowing through the circuit E = Applied voltage R = Resistance of the coil The Q factor or the magnification of the circuit is defined as, From the above equation it is clear that if the voltage E is maintained at a fixed level, the voltmeter across the capacitor can be calibrated in terms of Q directly. The circuit arrangement of basic and practical Q-meter is shown below. The oscillator is a wide range RF oscillator that supplies the oscillations whose frequency lies between 50 khz to 50 MHz and delivers current to R sh which is a shunt resistance of low value, and is typically around 0.02Q. Therefore the R sh introduces very negligible (almost no resistance) resistance into the oscillator circuit. Thus it represents a voltage source of magnitude E with a very low internal resistance. The voltage across R sh is measured using a thermocouple meter that is marked as 'multiply Q by meter. The voltage drop across the tuning capacitor or resonating capacitor EC is measured by means of an electronic voltmeter. The scale of this electronic voltmeter is calibrated in terms of Q values directly. To carry out the measurement the unknown components is connected across the test terminals and the circuit is adjusted to resonance using any one of the two methods given below.by setting the frequency of the oscillator to a certain given value and adjusting the tuning capacitor.

56 By presetting the capacitor to a required value and varying the frequency of oscillator. The Q value indicate on the output meter should be multiplied by the index setting of the 'multiply Q by meter to get actual, or accurate Q value.the indicated value of Q on the output meter is known as 'circuit Q' since it includes the losses of volt- meter tuning capacitor and insertion resistor. The effective Q value of the measured coil will be higher than indicated Q or circuit Q. This difference is small therefore it can be neglected. However this difference is large if the resistance of the coil is small compared to the insertion resistor value. The inductance of the coil can be found from the known values of c (resonating capacitance) and / (frequency). Since X C =X L 2 П fl = 1 / 2 П f C Therefore, L = 1 / ( 2 П f) 2 C Henry
57 Transducer: UNIT 7 A measuring device which measures and converts nonelectrical variable into electrical variable is known as transducer. Transducers are classified into several types. However, these can be categorized into five types. They are, 1. Classification on the basis of transduction principle used. 2. Active and passive transducers 3. Analog and digital transducers 4. Primary and secondary transducers 5. Transducers and inverse transducers. 1. Classification on the Basis of Transduction Principle Used This classification is done depending on the transduction principle i.e., how the input variable is being converted into capacitance, resistance and inductance values. (These are named as capacitive transducer, resistive transducer and inductive transducer respectively). Examples of Capacitive Transducer Applications
58 1. Dielectric gauge. 2. Capacitor Microphone. Examples of Resistive Transducer 1. It is used to measure, (i) Thickness and (ii) Liquid level. 2. It is used to measure, (i) Noise (ii) Speech and Music Applications Examples of Active Transducer 1. Photo voltaic cell. 2. Thermocouple. Applications 1. (i) Used in light meters (ii) Used in solar cells. 2. Used to measure, (i)temperature (ii) Radiation and (iii) Heat flow. Examples of Inductive Transducer 1. Reluctance pick up. 2. Magnetostriction gauge. 1. Resistance thermometer. 2. Potentiometer device. Applications 1. It is used to measure, (i) Pressure (ii) Vibrations (iii) Position and ( iv) Displacement. 2. It is used to measure, (i) Sound (ii) Force (iii) Pressure. 1. Used in the measurement or, (i) Temperature and (ii) Radiant heat. 2. (i) Used in displacement measurement and (ii) Used in pressure measurement. Active Transducers: Passive Transducer The transducer which requires an external excitation to provide their output is referred as passive
59 transducer. Examples of Passive Transducer 1. Capacitive transducers. 2. Resistive transducers. 3. Inductive transducers. Applications 1. Used to measure liquid level, noise, thickness etc. 2. Used to measure temperature, pressure, displacement etc. 3.Used to measure pressure, vibration, position, displacement etc. Analog Transdu cer The transduce r which produces their outputs in analog form or a form which is a continuous function of time is referred as analog transducer. Examples of Analog Transducer 1.Strain gauge 2. Thermistor Applications 1. Used to measure, (i) Displacement (ii) Force and (iii) Torque. 2.Used to measure, (i) Temperature and (ii) Flow. s their outputs in digital form or a form of pulses is referred as digital transducers. Digital Transduc er The transduc er which produce Examples of Digital Transducer Turbine meter Secondary Transducers Primary Transducer Applications Used in flow measurement. Primary and The transducer which sends the measurement and converts them into another variables (like displacement, strain etc.) And whose output forms the input of another transducer is called as primary transducer. Examples of Primary Transducer 1. Bourdon tube 2. Strain gauge Applications 1. Used in pressure 2. Used in measurements Secondar y Transdu cer The transducer which converts the output of first transducer into an electrical output called secondary transducer. Examples of Secondary Transducer LVDT Applications Used to measure, (i) Displacement J (ii) Force (iii) Pressure and (iv) Position 5. Transduc ers and Inverse Transdu cers
60 A measuring device which measures and converts nonelectrical variable into electrical variable is known as transducer. Example of Transducer Applications Thermocouple Used to measure, j Inverse (i) Temperature Transdu (ii) Radiation cer and (iii) Heat A measurin g device which measures and converts an electrical variable into nonelectrical variable is known as inverse transducer. Example of Inverse Transducers Piezo-electric crystal Applications Used to measure, (i) Pressure (ii) Vibration and acceleration Parameters considered in selecting a transducer: Parameters to be considered in the selection of a transducer for a particular application are. 1. Operating Principle Basically the transducers are selected based on their operating principle. Examples of operating principles used by the transducers are resistive, capacitive, piezoelectric, inductive, up to electronic principle etc. 2. Operating Range This factor is considered so that the transducer should be able to function within the specified range with good resolution. Every transducer should be provided with some rating within which there will be breakdown in its function. 3. Accuracy It is one of the most desired characteristic of any transducer. If the transducer doesn't needs frequent calibration, it must have high degree of accuracy and repeatability. Because errors may occur due to the sensitivity of the transducer to other stimulations. 4. Sensitivity It is also a desired characteristic of a transducer. Every transducer should be sufficiently sensitive to provide some output that can be sufficient and detectable. 5. Stability and Reliability The transducer should have high degree of stability during its function and also storage life. It should also have a high degree of reliability. 6. Usage and Ruggedness The ruggedness, size and weight of a transducer should be chosen depending on the application in which it is used. 7. Transient Response and Frequency Response The transducer should have required time domain specifications such as, settling time, rise time, peak over shoot and small dynamic error etc. 8. Loading Effects The transducers should undergo minimum loading effect so that if can provide accurate measurement. The parameters of a transducer are that, which characterize the loading effect is its input and output

61 impedances.lt is considered in order to get minimum loading effects (Which can be neglected). For minimum loading effect the transducer should have low output impedance and high input impedance. 9. Electrical Parameters The type and length of cable required, signal to noise ratio in case the transducer is used with amplifiers and frequency response limitations should also be considered. 10. Ability to be insensitive to unwanted signals (or the ability to be sensitive to desired signals). 11. Environmental compatibility. 12. Static Characteristics The selected transducer should have low hysteresis, high linearity and high resolution. Strain gauge: A typical semiconductor strain gauge is formed by the semiconductor technology i.e., the semiconducting wafers or filaments of length varying from 2 mm to 10 mm and thickness of 0.05 mm are bonded on suitable insulating substrates (for example Teflon). The gold leads are usually e m p l o y e d f o r m a k i n g e l e c t r i c a l c o n t a c t s. The e l e c t r o d e s a r e f o r m e d b y v a p o u r deposition. The assembly is placed in a protective box as shown in the figure below. Advantages of Semiconductor Strain Gauge 1. The gauge factor of semiconductor strain gauge is very high, about ± They are useful in measurement of very small strains of the order of 0.01 micro-strains due to their high gauge factor. 3. Semiconductor strain gauge exhibits very low hysteresis i.e., less than 0.05%. 4. The semiconductor strain gauge has much higher output, but it is as stable as a metallic strain gauge. 5. It possesses a high frequency response of Hz. 6. It has a large fatigue life i.e., 10 x 10 6 operations can be performed. 7. They can be manufactured in very small sizes, their lengths ranging from 0.7 to 7.0 mm. Piezo-electric effect: When some pressure or stress is applied to the surface of the piezo-electric crystal, the dimensions of the crystal change and an electric charge voltage will be developed across certain surfaces of the piezo-electric crystal.


62 Conversely, when an electric charge voltage or potential is applied to the crystal, the crystal get deformed and hence, the dimensions of it will change. This effect is referred as piezo- electric effect. All the piezo-electric transducers work on the principle of piezo-electric effect. The piezo- electric materials or the materials used in the construction of piezoelectric crystal are quartz, rochelle salt, dipotassium titrate, lithium sulphate, barium titanate, potassium dihydrogen phosphate, ammonium dihydrogen phosphate etc. A piezoelectric crystal subjected to force is illustrated in figure 6.1. LVDT Linear Variable Differential Transformer (LVDT) consists of one primary winding (P) and two secondary windings (51 and S2).with equal number of turns wound on a cylindrical former. The two secondary windings are connected in series opposition and are placed identically on either side of primary winding to which an AC excitation voltage is connected. A movable soft iron core is placed within the cylindrical former. When the displacement to be measured is applied to the arm of the core, the LVDT converts this displacement into an Electrical s i g n a l. The c o n s t r u c t i o n o f L V D T i s illustrated in figure (5.1). The operating principle of LVDT depends on mutual inductance. When the primary winding is supplied with A.C. Supply voltage, it generates alternating magnetic field. Due to this magnetic field an alternating voltage will be induced in the two secondary windings. In the figure (5.2) es1 is the output voltage of secondary winding S1 and es2 is the output voltage of secondary winding S2 In order to get single differential output voltage two secondary windings are connected in series opposition. Thus the
63 differential output voltage is given by, Es0=es1-es2 When the core is placed symmetrically with respect to two secondary windings an equal amount of voltage will be induced in both windings. Therefore esl - es2 and the output voltage is '0'. Hence, this position is known as null position. Now if the core is moved towards up from null position, more magnetic field links with secondary winding S1, and small field links with secondary winding S2. Therefore more voltage will be induced in S 1 a nd less i n S 2 i. e., e s1 will be larger than e s2. Hence the differential output voltage is e0=es1-es2 and is in phase with primary voltage. But when the core is moved towards down from null position more magnetic field links with secondary winding S2 and small field links with secondary winding S1. Therefore more voltage will be induced in S2 and less in S1, i.e.,es2 will be larger than es1. Hence, the differential output voltage is e0 = es2 es1 and is 180 out of phase with primary voltage. Thus the output voltage e0 position of the core and hence the displacement applied to the arm of the core. UNIT 8 FORCE: Force may be defined as a cause that produces resistance or obstruction to any moving body, or changes the motion of a body, or tends to produce these effects. Force is given as F=ma Where, F: force(n), m: mass in kg, a: acceleration in kg/m2. Principle of force summing device: Force summing devices (P RES S URE SENS ING ELEME NT S) serve as primary transducers and convert the pressure applied at the input into displacement, which then can be measured by means of secondary transducer. The lists of most widely used force summing devices are 1. Diaphragms 2. Bellows 3. Bourdon tubes 1. Diaphragms Any thin metal whose ends are fixed between two parallel plates is referred to as diaphragm. It is one of the pressure measuring elements. The operating principle is the applied pressure is converted into proportional displacement. The materials used to make diaphragms are phosphor bronze, nickel, beryllium copper, stainless steel, etc. These can be available in flat or corrugated shapes.


64 When two corrugated diaphragms are joined together at their ends a capsule is formed. When compared to flat diaphragms corrugated diaphragms produce greater displacements. Since the capsule is a combination of two diaphragms it generates more displacement which is twice that of the single corrugated diaphragm. This generated displacement is proportional to the applied pressure. 2. Bellows Bellows, the pressure measuring elements are formed by the series combination of capsules. The working principle of bellows is same as that of diaphragms i.e., the applied displacement is converted into proportionate mechanical displacement. The materials used to construct bellows are beryllium copper, brass, Monel, stainless steel and nickel.


65 Whenever the pressure to be measured is applied the sealed end of bellow suffers displacement. The generated displacement can be known by attaching a pointer scale arrangement to the sealed end or by transmitting the displacement to the secondary transducer. 3. Bourdon Tubes The bourdon tubes are available in different shapes such as spiral, helical, twisted and C shaped. However all the tubes have non-circular cross-section. Also the materials used and working of all these types are same. The materials used in the construction of bourdon tubes are brass, steel and rubber. The working principle of bourdon tube is same as that of diaphragms and bellows i.e., the applied pressure is converted into mechanical displacement. The displacement generated by the above force summing devices can be converted into electrical form by transmitting it to LVDT. The output voltage generated by LVDT is proportional to displacement and hence applied pressure. Data Acquisition System (DAS) : What Is Data Acquisition? Data acquisition (DAQ) is the process of measuring an electrical or physical phenomenon such as voltage, current, temperature, pressure, or sound with a computer. A DAQ system consists of sensors, DAQ measurement hardware, and a computer with programmable software. Compared to traditional measurement systems, PC-based DAQ systems exploit the processing power, productivity, display, and connectivity capabilities of industry-standard computers providing a more powerful, flexible, and cost-effective measurement solution. The block diagram of a general Data Acquisition System (DAS) is shown in the figure below. It consists of the following elements. GRIET/ECE 1. Transducer 2. Signal conditioner 3. Multiplexer
66 4. Analog to Digital Converter 5. Recorders and Display devices 1. Transducer A transducer is used to convert the physical parameters corning from the field into electrical Signals or it is used to measure directly the electrical quantities such as resistance, voltage, Frequency, etc. 2. Signal Conditioner Usually the output signals of the transducer will be of very low level (weak) signals which cannot be used for further processing. In order to make the signals strong enough to drive the other elements signal conditioners such as amplifiers, modifiers, filters etc., are used. 3. Multiplexer The function of the multiplexer is to accept multiple analog inputs (after signal conditioning) and provide a single output sequentially according to the requirements. 4. A/D Converter The analog-to-digital (A/D) converter is generally used to convert the analog data into digital form. The digital data is used for the purpose of easy processing, transmission, digital display and storage. Processing involves various operations on data such as comparison, mathematical manipulations, data is collected, converted into useful form and utilized for various purposes like for control operation and display etc. The transmission of data in digital form is possible over short distances as well as long distances of and has advantages over transmission in analog form. The data can be stored permanently or temporarily and can be displayed on a CRT or digital panel. 5. Recorders and Display Devices In display devices the data is displayed in a suitable form in order to monitor the input signals. Examples of display devices are oscilloscopes, numerical displays, panel meters, etc.

67 In order to have either a temporary or permanent record of the useful data recorders are used. The analog data can be recorded either graphically or on a magnetic tape. Optical recorders, ultraviolet recorders, styles-and-ink recorders are some of its examples. The digital data can be recorded through digital recorders. The digital data is first converted into a suitable form for recording by means of a coupling unit and then recorded on a magnetic tape, punched cards or a perforated paper tape. VELOCITY: Velocity is also defined as rate of change of displacement (v)=dx/dt= Aω cos ωt (m/sec.) Types: 1.linear velocity 2.Angular velocity The arrangement of capacitive transducer in the arrangement of angular velocity is shown figure The main components of a capacitive tachometer arrangement are given as follows, 1. Fixed capacitor plates 2. A vane attached to one of the two ends of a shaft 3. A pulse shaper and amplifier circuit 4. An electronic counter or frequency meter. The vane is placed between the two fixed plates of capacitor and the free end of the shaft is connected to the source whose angular velocity is to be determined. Therefore the shaft rotates along with the source, which in turn rotates the vane between the plates. Due to this the capacitance of the capacitor changes. For every rotation of the vane a change in capacitance takes place and for every changed capacitance value, a voltage pulse is induced. The number of times the capacitance value changes per unit time gives the angular velocity of the rotating shaft. The induced pulses are applied to pulse shaper and amplifier circuit which shapes the pulses into accurate pulses and then amplifies the pulses. These shaped and amplified pulses are then applied to electronic counter which counts the number of pulses. The counted number of pulses directly gives the value of angular velocity. Limitations: 1. Capacitive t r a n s d u c e r s a r e h i gh l y s e n s i t i v e t o t e m p e r a t u r e. Therefore a n y va r i a t io n i n temperature affects the performance of the instrument. 2. High output impedance of capacitive transducers lead to loading effects. 3. The presence of duct particles, moisture, etc., changes the capacitance of the capacitor. Due to this
 to measure the velocity.")
68 error occurs in the output. Velocity transducer: The main elements of a velocity transducer are coil and a permanent magnet. In such type of transducers velocity is measured based upon electromagnetic induction principle. These two elements can be arranged in two different configurations (i.e., electrodynamics and electromagnetic) to measure the velocity. In electrodynamics velocity transducer, moving coil scheme is employed. In this configuration the coil and the magnet are arranged in housing such that the magnet is attached to the base of the housing and the coil is attached to the other side (top) of the housing with the help of a spring so that the coil is suspended in the magnetic field as shown in the figure below. The body whose velocity is too measured is connected to the base of the housing. Due to the displacement of the body, the housing also gets displaced which in turn caused a displacement of the coil in the magnetic field. This movement of the coil causes a change in the flux linkages between the Magnet and the coil, and thus according to the electromagnetic induction principle an electrical voltage gets induced in the coil.
UNIT 2. Q.1) Describe the functioning of standard signal generator. Ans. Electronic Measurements & Instrumentation
 Describe the functioning of standard signal generator. Ans. Electronic Measurements & Instrumentation") UNIT 2 Q.1) Describe the functioning of standard signal generator Ans. STANDARD SIGNAL GENERATOR A standard signal generator produces known and controllable voltages. It is used as power source for the
UNIT 2 Q.1) Describe the functioning of standard signal generator Ans. STANDARD SIGNAL GENERATOR A standard signal generator produces known and controllable voltages. It is used as power source for the
UNIT-3. Electronic Measurements & Instrumentation
 UNIT-3 1. Draw the Block Schematic of AF Wave analyzer and explain its principle and Working? ANS: The wave analyzer consists of a very narrow pass-band filter section which can Be tuned to a particular
Electronic Measurements & Instrumentation UNIT What are the basic performance characteristics of a system?
 UNIT-1 1. What are the basic performance characteristics of a system? Ans: STATIC CHARACTE RISTICS The static characteristics of an instrument are, in general, considered for instruments which are used
Table of Contents...2. About the Tutorial...6. Audience...6. Prerequisites...6. Copyright & Disclaimer EMI INTRODUCTION Voltmeter...
 1 Table of Contents Table of Contents...2 About the Tutorial...6 Audience...6 Prerequisites...6 Copyright & Disclaimer...6 1. EMI INTRODUCTION... 7 Voltmeter...7 Ammeter...8 Ohmmeter...8 Multimeter...9
Definitions. Spectrum Analyzer
 SIGNAL ANALYZERS Spectrum Analyzer Definitions A spectrum analyzer measures the magnitude of an input signal versus frequency within the full frequency range of the instrument. The primary use is to measure
MAHARASHTRA STATE BOARD OF TECHNICAL EDUCATION (Autonomous) (ISO/IEC Certified) SUMMER 14 EXAMINATION Model Answer
 (ISO/IEC Certified) SUMMER 14 EXAMINATION Model Answer") MAHARASHTRA STATE BOARD OF TECHNICAL EDUCATION (Autonomous) (ISO/IEC 27001 2005 Certified) SUMMER 14 EXAMINATION Model Answer Subject Code : 17317 Page No: 1 Important Instructions to examiners: 1) The
MAHARASHTRA STATE BOARD OF TECHNICAL EDUCATION (Autonomous) (ISO/IEC 27001 2005 Certified) SUMMER 14 EXAMINATION Model Answer Subject Code : 17317 Page No: 1 Important Instructions to examiners: 1) The
Laboratory Exercise 6 THE OSCILLOSCOPE
 Introduction Laboratory Exercise 6 THE OSCILLOSCOPE The aim of this exercise is to introduce you to the oscilloscope (often just called a scope), the most versatile and ubiquitous laboratory measuring
4. Digital Measurement of Electrical Quantities
 4.1. Concept of Digital Systems Concept A digital system is a combination of devices designed for manipulating physical quantities or information represented in digital from, i.e. they can take only discrete
Summer 2015 Examination
 Summer 2015 Examination Subject Code: 17445 Model Answer Important Instructions to examiners: 1) The answers should be examined by key words and not as word-to-word as given in the model answer scheme.
Name Date: Course number: MAKE SURE TA & TI STAMPS EVERY PAGE BEFORE YOU START EXPERIMENT 10. Electronic Circuits
 Laboratory Section: Last Revised on September 21, 2016 Partners Names: Grade: EXPERIMENT 10 Electronic Circuits 1. Pre-Laboratory Work [2 pts] 1. How are you going to determine the capacitance of the unknown
EE ELECTRICAL ENGINEERING AND INSTRUMENTATION
 EE6352 - ELECTRICAL ENGINEERING AND INSTRUMENTATION UNIT V ANALOG AND DIGITAL INSTRUMENTS Digital Voltmeter (DVM) It is a device used for measuring the magnitude of DC voltages. AC voltages can be measured
LINEAR IC APPLICATIONS
 1 B.Tech III Year I Semester (R09) Regular & Supplementary Examinations December/January 2013/14 1 (a) Why is R e in an emitter-coupled differential amplifier replaced by a constant current source? (b)
MAHALAKSHMI ENGINEERING COLLEGE TIRUCHIRAPALLI UNIT III TUNED AMPLIFIERS PART A (2 Marks)
") MAHALAKSHMI ENGINEERING COLLEGE TIRUCHIRAPALLI-621213. UNIT III TUNED AMPLIFIERS PART A (2 Marks) 1. What is meant by tuned amplifiers? Tuned amplifiers are amplifiers that are designed to reject a certain
MAHALAKSHMI ENGINEERING COLLEGE TIRUCHIRAPALLI-621213. UNIT III TUNED AMPLIFIERS PART A (2 Marks) 1. What is meant by tuned amplifiers? Tuned amplifiers are amplifiers that are designed to reject a certain
MAHARASHTRA STATE BOARD OF TECHNICAL EDUCATION (Autonomous) (ISO/IEC Certified) MODEL ANSWER
 (ISO/IEC Certified) MODEL ANSWER") MODEL ANSWER SUMMER 17 EXAMINATION Subject Title: Electronic Instruments and Measurements Subject Code: Important Instructions to examiners: 1) The answers should be examined by key words and not as word-to-word
MODEL ANSWER SUMMER 17 EXAMINATION Subject Title: Electronic Instruments and Measurements Subject Code: Important Instructions to examiners: 1) The answers should be examined by key words and not as word-to-word
Oscillators. An oscillator may be described as a source of alternating voltage. It is different than amplifier.
 Oscillators An oscillator may be described as a source of alternating voltage. It is different than amplifier. An amplifier delivers an output signal whose waveform corresponds to the input signal but
MAHARASHTRA STATE BOARD OF TECHNICAL EDUCATION (Autonomous) (ISO/IEC Certified) SUMMER 2013 EXAMINATION
 (ISO/IEC Certified) SUMMER 2013 EXAMINATION") MAHARASHTRA STATE BOARD OF TECHNICAL EDUCATION (Autonomous) (ISO/IEC 27001 2005 Certified) SUMMER 2013 EXAMINATION Subject Code: 12117 Model Answer Page No: 1 Important Instructions to examiners: 1) The
MAHARASHTRA STATE BOARD OF TECHNICAL EDUCATION (Autonomous) (ISO/IEC 27001 2005 Certified) SUMMER 2013 EXAMINATION Subject Code: 12117 Model Answer Page No: 1 Important Instructions to examiners: 1) The
SUMMER 15 EXAMINATION
 SUMMER 15 EXAMINATION Subject Code: 17317 Model Answer Important Instructions to examiners: 1) The answers should be examined by key words and not as word-to-word as given in the model answer scheme. 2)
LBI-30398N. MAINTENANCE MANUAL MHz PHASE LOCK LOOP EXCITER 19D423249G1 & G2 DESCRIPTION TABLE OF CONTENTS. Page. DESCRIPTION...
 MAINTENANCE MANUAL 138-174 MHz PHASE LOCK LOOP EXCITER 19D423249G1 & G2 LBI-30398N TABLE OF CONTENTS DESCRIPTION...Front Cover CIRCUIT ANALYSIS... 1 MODIFICATION INSTRUCTIONS... 4 PARTS LIST AND PRODUCTION
Basic Electronics Learning by doing Prof. T.S. Natarajan Department of Physics Indian Institute of Technology, Madras
 Basic Electronics Learning by doing Prof. T.S. Natarajan Department of Physics Indian Institute of Technology, Madras Lecture 38 Unit junction Transistor (UJT) (Characteristics, UJT Relaxation oscillator,
Operational Amplifiers
 Operational Amplifiers Table of contents 1. Design 1.1. The Differential Amplifier 1.2. Level Shifter 1.3. Power Amplifier 2. Characteristics 3. The Opamp without NFB 4. Linear Amplifiers 4.1. The Non-Inverting
DLVP A OPERATOR S MANUAL
 DLVP-50-300-3000A OPERATOR S MANUAL DYNALOAD DIVISION 36 NEWBURGH RD. HACKETTSTOWN, NJ 07840 PHONE (908) 850-5088 FAX (908) 908-0679 TABLE OF CONTENTS INTRODUCTION...3 SPECIFICATIONS...5 MODE SELECTOR
SHRI ANGALAMMAN COLLEGE OF ENGINEERING & TECHNOLOGY (An ISO 9001:2008 Certified Institution) SIRUGANOOR,TRICHY
 SIRUGANOOR,TRICHY") SHRI ANGALAMMAN COLLEGE OF ENGINEERING & TECHNOLOGY (An ISO 9001:2008 Certified Institution) SIRUGANOOR,TRICHY-621105. DEPARTMENT OF ELECTRICAL AND ELECTRONICS ENGINEERING EI 1306-MEASUREMENT AND INSTRUMENTATION
SHRI ANGALAMMAN COLLEGE OF ENGINEERING & TECHNOLOGY (An ISO 9001:2008 Certified Institution) SIRUGANOOR,TRICHY-621105. DEPARTMENT OF ELECTRICAL AND ELECTRONICS ENGINEERING EI 1306-MEASUREMENT AND INSTRUMENTATION
ERICSSONZ LBI-30398P. MAINTENANCE MANUAL MHz PHASE LOCKED LOOP EXCITER 19D423249G1 & G2 DESCRIPTION TABLE OF CONTENTS
 MAINTENANCE MANUAL 138-174 MHz PHASE LOCKED LOOP EXCITER 19D423249G1 & G2 TABLE OF CONTENTS Page DESCRIPTION... Front Cover CIRCUIT ANALYSIS...1 MODIFICATION INSTRUCTIONS...4 PARTS LIST...5 PRODUCTION
The steeper the phase shift as a function of frequency φ(ω) the more stable the frequency of oscillation
 the more stable the frequency of oscillation") It should be noted that the frequency of oscillation ω o is determined by the phase characteristics of the feedback loop. the loop oscillates at the frequency for which the phase is zero The steeper the
It should be noted that the frequency of oscillation ω o is determined by the phase characteristics of the feedback loop. the loop oscillates at the frequency for which the phase is zero The steeper the
332:223 Principles of Electrical Engineering I Laboratory Experiment #2 Title: Function Generators and Oscilloscopes Suggested Equipment:
 RUTGERS UNIVERSITY The State University of New Jersey School of Engineering Department Of Electrical and Computer Engineering 332:223 Principles of Electrical Engineering I Laboratory Experiment #2 Title:
NTE7047 Integrated Circuit TV Color Small Signal Sub System
 NTE7047 Integrated Circuit TV Color Small Signal Sub System Features: Vision IF Amplifier with Synchronous Demodulator Automatic Gain Control (AGC) Detector Suitable for Negative Modulation AGC Tuner Automatic
Gechstudentszone.wordpress.com
 8.1 Operational Amplifier (Op-Amp) UNIT 8: Operational Amplifier An operational amplifier ("op-amp") is a DC-coupled high-gain electronic voltage amplifier with a differential input and, usually, a single-ended
Small signal Amplifier stages. Figure 5.2 Classification of power amplifiers
 5.1 Introduction When the power requirement to drive the load is in terms of several Watts rather than mili-watts the power amplifiers are used. Power amplifiers form the last stage of multistage amplifiers.
Let us consider the following block diagram of a feedback amplifier with input voltage feedback fraction,, be positive i.e. in phase.
 P a g e 2 Contents 1) Oscillators 3 Sinusoidal Oscillators Phase Shift Oscillators 4 Wien Bridge Oscillators 4 Square Wave Generator 5 Triangular Wave Generator Using Square Wave Generator 6 Using Comparator
FREQUENCY AGILE FM MODULATOR INSTRUCTION BOOK IB
 FMT615C FREQUENCY AGILE FM MODULATOR INSTRUCTION BOOK IB1215-02 TABLE OF CONTENTS SECTION SUBJECT 1.0 Introduction 2.0 Installation & Operating Instructions 3.0 Specification 4.0 Functional Description
Exam Booklet. Pulse Circuits
 Exam Booklet Pulse Circuits Pulse Circuits STUDY ASSIGNMENT This booklet contains two examinations for the six lessons entitled Pulse Circuits. The material is intended to provide the last training sought
MAHARASHTRA STATE BOARD OF TECHNICAL EDUCATION (Autonomous) (ISO/IEC Certified)
 (ISO/IEC Certified)") Q. No. WINTER 16 EXAMINATION (Subject Code: 17317) Model Answer Important Instructions to examiners: 1) The answers should be examined by key words and not as word-to-word as given in the model answer
Q. No. WINTER 16 EXAMINATION (Subject Code: 17317) Model Answer Important Instructions to examiners: 1) The answers should be examined by key words and not as word-to-word as given in the model answer
TONE DECODER / PHASE LOCKED LOOP PIN FUNCTION 1 OUTPUT FILTER 2 LOW-PASS FILTER 3 INPUT 4 V + 5 TIMING R 6 TIMING CR 7 GROUND 8 OUTPUT
 TONE DECODER / PHASE LOCKED LOOP GENERAL DESCRIPTION The NJM567 tone and frequency decoder is a highly stable phase locked loop with synchronous AM lock detection and power output circuitry. Its primary
Op Amp Booster Designs
 Op Amp Booster Designs Although modern integrated circuit operational amplifiers ease linear circuit design, IC processing limits amplifier output power. Many applications, however, require substantially
Experiment 1: Instrument Familiarization (8/28/06)
") Electrical Measurement Issues Experiment 1: Instrument Familiarization (8/28/06) Electrical measurements are only as meaningful as the quality of the measurement techniques and the instrumentation applied
Electrical Measurement Issues Experiment 1: Instrument Familiarization (8/28/06) Electrical measurements are only as meaningful as the quality of the measurement techniques and the instrumentation applied
OPERATIONAL AMPLIFIER PREPARED BY, PROF. CHIRAG H. RAVAL ASSISTANT PROFESSOR NIRMA UNIVRSITY
 OPERATIONAL AMPLIFIER PREPARED BY, PROF. CHIRAG H. RAVAL ASSISTANT PROFESSOR NIRMA UNIVRSITY INTRODUCTION Op-Amp means Operational Amplifier. Operational stands for mathematical operation like addition,
Lab 1: Basic Lab Equipment and Measurements
 Abstract: Lab 1: Basic Lab Equipment and Measurements This lab exercise introduces the basic measurement instruments that will be used throughout the course. These instruments include multimeters, oscilloscopes,
TUNED AMPLIFIERS 5.1 Introduction: Coil Losses:
 TUNED AMPLIFIERS 5.1 Introduction: To amplify the selective range of frequencies, the resistive load R C is replaced by a tuned circuit. The tuned circuit is capable of amplifying a signal over a narrow
Oscilloscope Measurements
 PC1143 Physics III Oscilloscope Measurements 1 Purpose Investigate the fundamental principles and practical operation of the oscilloscope using signals from a signal generator. Measure sine and other waveform
b) State the types of standards of measurement. 2M
 State the types of standards of measurement. 2M") MODEL ANSWER WINTER 17 EXAMINATION Subject Title: Electronic Instruments & Measurements Subject Code: 17317 I m p o r t a n t I n s t r u c t i o n s t o e x a m i n e r s : 1) The answers should be examined
MODEL ANSWER WINTER 17 EXAMINATION Subject Title: Electronic Instruments & Measurements Subject Code: 17317 I m p o r t a n t I n s t r u c t i o n s t o e x a m i n e r s : 1) The answers should be examined
LM13600 Dual Operational Transconductance Amplifiers with Linearizing Diodes and Buffers
 LM13600 Dual Operational Transconductance Amplifiers with Linearizing Diodes and Buffers General Description The LM13600 series consists of two current controlled transconductance amplifiers each with
Experiment 1: Instrument Familiarization
 Electrical Measurement Issues Experiment 1: Instrument Familiarization Electrical measurements are only as meaningful as the quality of the measurement techniques and the instrumentation applied to the
ELC224 Final Review (12/10/2009) Name:
 Name:") ELC224 Final Review (12/10/2009) Name: Select the correct answer to the problems 1 through 20. 1. A common-emitter amplifier that uses direct coupling is an example of a dc amplifier. 2. The frequency
ELC224 Final Review (12/10/2009) Name: Select the correct answer to the problems 1 through 20. 1. A common-emitter amplifier that uses direct coupling is an example of a dc amplifier. 2. The frequency
Chapter 2 Analog-to-Digital Conversion...
 Chapter... 5 This chapter examines general considerations for analog-to-digital converter (ADC) measurements. Discussed are the four basic ADC types, providing a general description of each while comparing
Acknowledgments Introduction
 Acknowledgments Introduction xiii xi 1 Electronic meters 1 1.1 Digital meters 2 1.2 Nondigital (analog) meters 6 1.3 Differential meters 14 1.4 Digital meter displays and ranges 16 1.5 Nondigital meter
CRO AIM:- To study the use of Cathode Ray Oscilloscope (CRO).
.") 1. 1 To study CRO. CRO AIM:- To study the use of Cathode Ray Oscilloscope (CRO). Apparatus: - C.R.O, Connecting probe (BNC cable). Theory:An CRO is easily the most useful instrument available for testing
1. 1 To study CRO. CRO AIM:- To study the use of Cathode Ray Oscilloscope (CRO). Apparatus: - C.R.O, Connecting probe (BNC cable). Theory:An CRO is easily the most useful instrument available for testing
User s Manual for Integrator Short Pulse ISP16 10JUN2016
 User s Manual for Integrator Short Pulse ISP16 10JUN2016 Specifications Exceeding any of the Maximum Ratings and/or failing to follow any of the Warnings and/or Operating Instructions may result in damage
INDEX IEC:
 60050-300 IEC:2001 173 INDEX A absolute absolute error... 311-01-05 (absolute) frequency deviation... 314-08-07 accessory accessory (of a measuring instrument)... 312-03-01 accessory of limited interchangeability...
Electronic Measurements & Instrumentation. 1. Draw the Maxwell s Bridge Circuit and derives the expression for the unknown element at balance?
 UNIT -6 1. Draw the Maxwell s Bridge Circuit and derives the expression for the unknown element at balance? Ans: Maxwell's bridge, shown in Fig. 1.1, measures an unknown inductance in of standard arm offers
Chapter.8: Oscillators
 Chapter.8: Oscillators Objectives: To understand The basic operation of an Oscillator the working of low frequency oscillators RC phase shift oscillator Wien bridge Oscillator the working of tuned oscillator
UNDERSTANDING HORIZONTAL OUTPUT STAGES OF COMPUTER MONITORS
 UNDERSTANDING HORIZONTAL OUTPUT STAGES OF COMPUTER MONITORS Today's computer, medical, security, design and industrial video display monitors operate at a host of different horizontal resolutions or scanning
Spectrum analyzer for frequency bands of 8-12, and MHz
 EE389 Electronic Design Lab Project Report, EE Dept, IIT Bombay, November 2006 Spectrum analyzer for frequency bands of 8-12, 12-16 and 16-20 MHz Group No. D-13 Paras Choudhary (03d07012)
VALLIAMMAI ENGINEERING COLLEGE
 VALLIAMMAI ENGINEERING COLLEGE SRM Nagar, Kattankulathur 603 203 DEPARTMENT OF ELECTRONICS AND INSTRUMENTATION ENGINEERING QUESTION BANK VI SEMESTER EI6601 Modern Electronic Instrumentation Regulation
Television and video engineering
 Television and video engineering Unit-4 Television Receiver systems Objectives: To learn the requirements of TV receiver Study of monochrome and Colour TV receivers. To learn functions of Tuning circuits
Chapter 2. The Fundamentals of Electronics: A Review
 Chapter 2 The Fundamentals of Electronics: A Review Topics Covered 2-1: Gain, Attenuation, and Decibels 2-2: Tuned Circuits 2-3: Filters 2-4: Fourier Theory 2-1: Gain, Attenuation, and Decibels Most circuits
CHAPTER 6 DIGITAL INSTRUMENTS
 CHAPTER 6 DIGITAL INSTRUMENTS 1 LECTURE CONTENTS 6.1 Logic Gates 6.2 Digital Instruments 6.3 Analog to Digital Converter 6.4 Electronic Counter 6.6 Digital Multimeters 2 6.1 Logic Gates 3 AND Gate The
Emitter base bias. Collector base bias Active Forward Reverse Saturation forward Forward Cut off Reverse Reverse Inverse Reverse Forward
 SEMICONDUCTOR PHYSICS-2 [Transistor, constructional characteristics, biasing of transistors, transistor configuration, transistor as an amplifier, transistor as a switch, transistor as an oscillator] Transistor
multiplier input Env. Det. LPF Y (Vertical) VCO X (Horizontal)
 VCO X (Horizontal)") Spectrum Analyzer Objective: The aim of this project is to realize a spectrum analyzer using analog circuits and a CRT oscilloscope. This interface circuit will enable to use oscilloscopes as spectrum
Spectrum Analyzer Objective: The aim of this project is to realize a spectrum analyzer using analog circuits and a CRT oscilloscope. This interface circuit will enable to use oscilloscopes as spectrum
EET 223 RF COMMUNICATIONS LABORATORY EXPERIMENTS
 EET 223 RF COMMUNICATIONS LABORATORY EXPERIMENTS Experimental Goals A good technician needs to make accurate measurements, keep good records and know the proper usage and limitations of the instruments
electrical noise and interference, environmental changes, instrument resolution, or uncertainties in the measurement process itself.
 MUST 382 / EELE 491 Spring 2014 Basic Lab Equipment and Measurements Electrical laboratory work depends upon various devices to supply power to a circuit, to generate controlled input signals, and for
DE59 ELECTRONIC INSTRUMENTATION & MEASUREMENT 2012
 Q.2 a. Define the terms: Ans. (i) Accuracy: It is the closeness with which an instrument reading approaches the true value of the quantity being measured. Accuracy (in percent) =100 - %ε r (ii) (iii) (iv)
Dev Bhoomi Institute Of Technology Department of Electronics and Communication Engineering PRACTICAL INSTRUCTION SHEET REV. NO. : REV.
 Dev Bhoomi Institute Of Technology Department of Electronics and Communication Engineering PRACTICAL INSTRUCTION SHEET LABORATORY MANUAL EXPERIMENT NO. ISSUE NO. : ISSUE DATE: July 200 REV. NO. : REV.
BASIC ELECTRONICS PROF. T.S. NATARAJAN DEPT OF PHYSICS IIT MADRAS
 BASIC ELECTRONICS PROF. T.S. NATARAJAN DEPT OF PHYSICS IIT MADRAS LECTURE-12 TRANSISTOR BIASING Emitter Current Bias Thermal Stability (RC Coupled Amplifier) Hello everybody! In our series of lectures
SIDDHARTH GROUP OF INSTITUTIONS :: PUTTUR Siddharth Nagar, Narayanavanam Road QUESTION BANK (DESCRIPTIVE) UNIT I
 UNIT I") SIDDHARTH GROUP OF INSTITUTIONS :: PUTTUR Siddharth Nagar, Narayanavanam Road 517583 QUESTION BANK (DESCRIPTIVE) Subject with Code : EMI(16EC416) Year & Sem: III B.Tech & I Sem Course & Branch: B.Tech
SIDDHARTH GROUP OF INSTITUTIONS :: PUTTUR Siddharth Nagar, Narayanavanam Road 517583 QUESTION BANK (DESCRIPTIVE) Subject with Code : EMI(16EC416) Year & Sem: III B.Tech & I Sem Course & Branch: B.Tech
The Oscilloscope. Vision is the art of seeing things invisible. J. Swift ( ) OBJECTIVE To learn to operate a digital oscilloscope.
 OBJECTIVE To learn to operate a digital oscilloscope.") The Oscilloscope Vision is the art of seeing things invisible. J. Swift (1667-1745) OBJECTIVE To learn to operate a digital oscilloscope. THEORY The oscilloscope, or scope for short, is a device for drawing
The Oscilloscope Vision is the art of seeing things invisible. J. Swift (1667-1745) OBJECTIVE To learn to operate a digital oscilloscope. THEORY The oscilloscope, or scope for short, is a device for drawing
GATE: Electronics MCQs (Practice Test 1 of 13)
") GATE: Electronics MCQs (Practice Test 1 of 13) 1. Removing bypass capacitor across the emitter leg resistor in a CE amplifier causes a. increase in current gain b. decrease in current gain c. increase
GATE: Electronics MCQs (Practice Test 1 of 13) 1. Removing bypass capacitor across the emitter leg resistor in a CE amplifier causes a. increase in current gain b. decrease in current gain c. increase
TEST EQUIPMENT AND MEASUREMENTS
 Reading 39 Ron Bertrand VK2DQ http://www.radioelectronicschool.com SSB MEASUREMENTS Why use a two-tone test signal? TEST EQUIPMENT AND MEASUREMENTS The two-tone test signal is the standard modulating signal
THE BENEFITS OF DSP LOCK-IN AMPLIFIERS
 THE BENEFITS OF DSP LOCK-IN AMPLIFIERS If you never heard of or don t understand the term lock-in amplifier, you re in good company. With the exception of the optics industry where virtually every major
Exp. #2-6 : Measurement of the Characteristics of,, and Circuits by Using an Oscilloscope
 PAGE 1/14 Exp. #2-6 : Measurement of the Characteristics of,, and Circuits by Using an Oscilloscope Student ID Major Name Team No. Experiment Lecturer Student's Mentioned Items Experiment Class Date Submission
State the application of negative feedback and positive feedback (one in each case)
") (ISO/IEC - 700-005 Certified) Subject Code: 073 Model wer Page No: / N Important Instructions to examiners: ) The answers should be examined by key words and not as word-to-word as given in the model answer
(ISO/IEC - 700-005 Certified) Subject Code: 073 Model wer Page No: / N Important Instructions to examiners: ) The answers should be examined by key words and not as word-to-word as given in the model answer
Test No. 1. Introduction to Scope Measurements. Report History. University of Applied Sciences Hamburg. Last chance!! EEL2 No 1
 University of Applied Sciences Hamburg Group No : DEPARTMENT OF INFORMATION ENGINEERING Laboratory for Instrumentation and Measurement L: in charge of the report Test No. Date: Assistant A2: Professor:
Difference between BJTs and FETs. Junction Field Effect Transistors (JFET)
") Difference between BJTs and FETs Transistors can be categorized according to their structure, and two of the more commonly known transistor structures, are the BJT and FET. The comparison between BJTs
Difference between BJTs and FETs Transistors can be categorized according to their structure, and two of the more commonly known transistor structures, are the BJT and FET. The comparison between BJTs
Chapter 2 Signal Conditioning, Propagation, and Conversion
 09/0 PHY 4330 Instrumentation I Chapter Signal Conditioning, Propagation, and Conversion. Amplification (Review of Op-amps) Reference: D. A. Bell, Operational Amplifiers Applications, Troubleshooting,
An active filter offers the following advantages over a passive filter:
 ACTIVE FILTERS An electric filter is often a frequency-selective circuit that passes a specified band of frequencies and blocks or attenuates signals of frequencies outside this band. Filters may be classified
Glossary of VCO terms
 Glossary of VCO terms VOLTAGE CONTROLLED OSCILLATOR (VCO): This is an oscillator designed so the output frequency can be changed by applying a voltage to its control port or tuning port. FREQUENCY TUNING
GATE SOLVED PAPER - IN
 YEAR 202 ONE MARK Q. The i-v characteristics of the diode in the circuit given below are : v -. A v 0.7 V i 500 07 $ = * 0 A, v < 0.7 V The current in the circuit is (A) 0 ma (C) 6.67 ma (B) 9.3 ma (D)
Sirindhorn International Institute of Technology Thammasat University at Rangsit
 Sirindhorn International Institute of Technology Thammasat University at Rangsit School of Information, Computer and Communication Technology COURSE : ECS 210 Basic Electrical Engineering Lab INSTRUCTOR
Department of Electrical and Computer Engineering. Laboratory Experiment 1. Function Generator and Oscilloscope
 Department of Electrical and Computer Engineering Laboratory Experiment 1 Function Generator and Oscilloscope The purpose of this first laboratory assignment is to acquaint you with the function generator
Sine waves by far the most important form of alternating quantity important properties are shown below
 AC DC METERS 1 Sine waves by far the most important form of alternating quantity important properties are shown below 2 Average value of a sine wave average value over one (or more) cycles is clearly zero
User s Manual for Integrator Long Pulse ILP8 22AUG2016
 User s Manual for Integrator Long Pulse ILP8 22AUG2016 Contents Specifications... 3 Packing List... 4 System Description... 5 RJ45 Channel Mapping... 8 Customization... 9 Channel-by-Channel Custom RC Times...
InstrumentationTools.com
 Author: Instrumentation Tools Categories: Multiple Choice Questions Measurement and Instrumentation Objective Questions Part 4 Measurement and Instrumentation Objective Questions 1. The decibel is a measure
Testing and Stabilizing Feedback Loops in Today s Power Supplies
 Keywords Venable, frequency response analyzer, impedance, injection transformer, oscillator, feedback loop, Bode Plot, power supply design, open loop transfer function, voltage loop gain, error amplifier,
CHAPTER 1 DIODE CIRCUITS. Semiconductor act differently to DC and AC currents
 CHAPTER 1 DIODE CIRCUITS Resistance levels Semiconductor act differently to DC and AC currents There are three types of resistances 1. DC or static resistance The application of DC voltage to a circuit
Introduction. In the frequency domain, complex signals are separated into their frequency components, and the level at each frequency is displayed
 SPECTRUM ANALYZER Introduction A spectrum analyzer measures the amplitude of an input signal versus frequency within the full frequency range of the instrument The spectrum analyzer is to the frequency
Communication Circuit Lab Manual
 German Jordanian University School of Electrical Engineering and IT Department of Electrical and Communication Engineering Communication Circuit Lab Manual Experiment 3 Crystal Oscillator Eng. Anas Alashqar
Lab 4. Crystal Oscillator
 Lab 4. Crystal Oscillator Modeling the Piezo Electric Quartz Crystal Most oscillators employed for RF and microwave applications use a resonator to set the frequency of oscillation. It is desirable to
OBJECTIVE TYPE QUESTIONS
 OBJECTIVE TYPE QUESTIONS Q.1 The breakdown mechanism in a lightly doped p-n junction under reverse biased condition is called (A) avalanche breakdown. (B) zener breakdown. (C) breakdown by tunnelling.
EE 201 Function / Arbitrary Waveform Generator and Oscilloscope Tutorial
 EE 201 Function / Arbitrary Waveform Generator and Oscilloscope Tutorial 1 This is a programmed learning instruction manual. It is written for the Agilent DSO3202A Digital Storage Oscilloscope. The prerequisite
Table of Contents Lesson One Lesson Two Lesson Three Lesson Four Lesson Five PREVIEW COPY
 Oscillators Table of Contents Lesson One Lesson Two Lesson Three Introduction to Oscillators...3 Flip-Flops...19 Logic Clocks...37 Lesson Four Filters and Waveforms...53 Lesson Five Troubleshooting Oscillators...69
Tone decoder/phase-locked loop
 NE/SE DESCRIPTION The NE/SE tone and frequency decoder is a highly stable phase-locked loop with synchronous AM lock detection and power output circuitry. Its primary function is to drive a load whenever
UNIT - 1 OPERATIONAL AMPLIFIER FUNDAMENTALS
 UNIT - 1 OPERATIONAL AMPLIFIER FUNDAMENTALS 1.1 Basic operational amplifier circuit- hte basic circuit of an operational amplifier is as shown in above fig. has a differential amplifier input stage and
Lecture 19 - Single-phase square-wave inverter
 Lecture 19 - Single-phase square-wave inverter 1. Introduction Inverter circuits supply AC voltage or current to a load from a DC supply. A DC source, often obtained from an AC-DC rectifier, is converted
EE LINEAR INTEGRATED CIRCUITS & APPLICATIONS
 UNITII CHARACTERISTICS OF OPAMP 1. What is an opamp? List its functions. The opamp is a multi terminal device, which internally is quite complex. It is a direct coupled high gain amplifier consisting of
Experiment 5 The Oscilloscope
 Experiment 5 The Oscilloscope Vision is the art of seeing things invisible. J. Swift (1667-1745) OBJECTIVE To learn to operate a cathode ray oscilloscope. THEORY The oscilloscope, or scope for short, is
(Refer Slide Time: 00:03:22)
") Analog ICs Prof. K. Radhakrishna Rao Department of Electrical Engineering Indian Institute of Technology, Madras Lecture - 27 Phase Locked Loop (Continued) Digital to Analog Converters So we were discussing
Analog ICs Prof. K. Radhakrishna Rao Department of Electrical Engineering Indian Institute of Technology, Madras Lecture - 27 Phase Locked Loop (Continued) Digital to Analog Converters So we were discussing
Type Ordering Code Package TDA Q67000-A5168 P-DIP-18-5
 Video Modulator for FM-Audio TDA 5666-5 Preliminary Data Bipolar IC Features FM-audio modulator Sync level clamping of video input signal Controlling of peak white value Continuous adjustment of modulation
(i) Determine the admittance parameters of the network of Fig 1 (f) and draw its - equivalent circuit.
 Determine the admittance parameters of the network of Fig 1 (f) and draw its - equivalent circuit.") I.E.S-(Conv.)-1995 ELECTRONICS AND TELECOMMUNICATION ENGINEERING PAPER - I Some useful data: Electron charge: 1.6 10 19 Coulomb Free space permeability: 4 10 7 H/m Free space permittivity: 8.85 pf/m Velocity
I.E.S-(Conv.)-1995 ELECTRONICS AND TELECOMMUNICATION ENGINEERING PAPER - I Some useful data: Electron charge: 1.6 10 19 Coulomb Free space permeability: 4 10 7 H/m Free space permittivity: 8.85 pf/m Velocity
Capacitive Touch Sensing Tone Generator. Corey Cleveland and Eric Ponce
 Capacitive Touch Sensing Tone Generator Corey Cleveland and Eric Ponce Table of Contents Introduction Capacitive Sensing Overview Reference Oscillator Capacitive Grid Phase Detector Signal Transformer
EE301 ELECTRONIC CIRCUITS CHAPTER 2 : OSCILLATORS. Lecturer : Engr. Muhammad Muizz Bin Mohd Nawawi
 EE301 ELECTRONIC CIRCUITS CHAPTER 2 : OSCILLATORS Lecturer : Engr. Muhammad Muizz Bin Mohd Nawawi 2.1 INTRODUCTION An electronic circuit which is designed to generate a periodic waveform continuously at
Application Note (A12)
") Application Note (A2) The Benefits of DSP Lock-in Amplifiers Revision: A September 996 Gooch & Housego 4632 36 th Street, Orlando, FL 328 Tel: 47 422 37 Fax: 47 648 542 Email: sales@goochandhousego.com
Application Note (A2) The Benefits of DSP Lock-in Amplifiers Revision: A September 996 Gooch & Housego 4632 36 th Street, Orlando, FL 328 Tel: 47 422 37 Fax: 47 648 542 Email: sales@goochandhousego.com