ELECTRONIC MEASUREMENTS AND INSTRUMENTATION
|
|
|
- Scot Peters
- 5 years ago
- Views:
Transcription
1 ELECTRONIC MEASUREMENTS AND INSTRUMENTATION Prepared By Ms. C.Deepthi, Asst. Prof, Dept of ECE Ms.L.Shruthi, Asst. Prof, Dept of ECE Mr. S.Rambabu, Asst. Prof, Dept of ECE Mr. M.Lakshmi Ravi Teja, Asst. Prof, Dept of ECE
2 UNIT I Block Schematics of Measuring Systems


3 Typical Measurement System Architecture Noise and Interference Process or Test Sensor or Transducer Amp Signal Conditioner Proces s and control over the process or experiment OUR TOPIC IS HERE Controller ADC Converter PC comp and data storage
4 INTRODUCTION Instrumentation is a technology of measurement which serves sciences, engineering, medicine and etc. Measurement is the process of determining the amount, degree or capacity by comparison with the accepted standards of the system units being used. Instrument is a device for determining the value or magnitude of a quantity or variable. Electronic instrument is based on electrical or electronic principles for its measurement functions.
5 FUNCTION AND ADVANTAGES The 3 basic functions of instrumentation :- Indicating visualize the process/operation Recording observe and save the measurement reading Controlling to control measurement and process Advantages of electronic measurement Results high sensitivity rating the use of amplifier Increase the input impedance thus lower loading effects Ability to monitor remote signal
6 PERFORMANCE CHARACTERISTICS Performance Characteristics - characteristics that show the performance of an instrument. Eg: accuracy, precision, resolution, sensitivity. Allows users to select the most suitable instrument for a specific measuring jobs. Two basic characteristics : Static measuring a constant process condition. Dynamic - measuring a varying process condition.
7 PERFORMANCE CHARACTERISTICS Accuracy the degree of exactness (closeness) of measurement compared to the expected (desired) value. Resolution the smallest change in a measurement variable to which an instrument will respond. Precision a measure of consistency or repeatability of measurement, i.e successive reading do not differ. Sensitivity ratio of change in the output (response) of instrument to a change of input or measured variable. Expected value the design value or the most probable value that expect to obtain. Error the deviation of the true value from the desired value.
8 ERROR IN MEASUREMENT Measurement always introduce error Error may be expressed either as absolute or percentage of error Absolute error, e = Y n X n where Y n expected value Xn measured value % error = Y n X n 100 Y n
9 Relative accuracy, ERROR IN MEASUREMENT A 1 Y n X n Y n % Accuracy, a = 100% - % error = A 100 Precision, P = 1 X n X n X n where X n -value of the n th measurement - average set of measurement X n
10 PRECISION The precision of a measurement is a quantitative or numerical indication of the closeness with which a repeated set of measurement of the same variable agree with the average set of measurements.
11 Example Given expected voltage value across a resistor is 80V. The measurement is 79V. Calculate, i. The absolute error ii. The % of error iii. The relative accuracy iv. The % of accuracy
12 Solution (Example 1.1) Given that, expected value = 80V measurement value = 79V i. Absolute error, e =Yn Xn = 80V 79V = 1V ii. % error = Y n X n 1=00 80 = 1.25% Y n iii. Relative accuracy, A 1 Y n X n = Y n iv. % accuracy, a = A x 100% = x 100%=98.75%
13 Example 1.2 From the value in table 1.1 calculate the precision of 6 th measurement? Solution the average of measurement value X n the 6 th reading Precision = Table 1.1 No X n
14 LIMITING ERROR The accuracy of measuring instrument is guaranteed within a certain percentage (%) of full scale reading E.g manufacturer may specify the instrument to be accurate at 2 % with full scale deflection For reading less than full scale, the limiting error increases
15 LIMITING ERROR (cont) Example 1.6 Given a 600 V voltmeter with accuracy 2% full scale. Calculate limiting error when the instrument is used to measure a voltage of 250V? Solution The magnitude of limiting error, 0.02 x 600 = 12V Therefore, the limiting error for 250V = 12/250 x 100 = 4.8%
16 LIMITING ERROR (cont) Example 1.7 Given for certain measurement, a limiting error for voltmeter at 70V is 2.143% and a limiting error for ammeter at 80mA is 2.813%. Determine the limiting error of the power. Solution The limiting error for the power = 2.143% % = 4.956%
17 Exercise A voltmeter is accurate 98% of its full scale reading. i. If the voltmeter reads 200V on 500V range, what is the absolute error? ii. What is the percentage error of the reading in (i).
18 Significant Figures Significant figures convey actual information regarding the magnitude and precision of quantity More significant figure represent greater precision of measurement Example 1.3 Find the precision value of X 1 and X 2? X n 101 X 1 98 ===>> 2 s.f X ===>> 3 s.f
19 Solution (Example 1.3) X n 101 X 1 98===>> 2 s.f X 2 98.=5==>> 3 s.f X 1 Pr ecision = X 2 Precision = = ==>more precise
20 TYPES OF STATIC ERROR Types of static error 1) Gross error/human error 2) Systematic Error 3) Random Error
21 TYPES OF STATIC ERROR 1) Gross Error cause by human mistakes in reading/using instruments may also occur due to incorrect adjustment of the instrument and the computational mistakes cannot be treated mathematically cannot eliminate but can minimize Eg: Improper use of an instrument. This error can be minimized by taking proper care in reading and recording measurement parameter. In general, indicating instruments change ambient conditions to some extent when connected into a complete circuit. Therefore, several readings (at three readings) must be taken to minimize the effect of ambient condition changes.
22 TYPES OF STATIC ERROR (cont) 2) Systematic Error - due to shortcomings of the instrument (such as defective or worn parts, ageing or effects of the environment on the instrument) In general, systematic errors can be subdivided into static and dynamic errors. Static caused by limitations of the measuring device or the physical laws governing its behavior. Dynamic caused by the instrument not responding very fast enough to follow the changes in a measured variable.
23 TYPES OF STATIC ERROR (cont) 3 types of systematic error :- (i) Instrumental error (ii) Environmental error (iii) Observational error
24 TYPES OF STATIC ERROR (cont) (i) Instrumental error Inherent while measuring instrument because of their mechanical structure (eg: in a D Arsonval meter, friction in the bearings of various moving component, irregular spring tension, stretching of spring, etc) Error can be avoid by: (a) selecting a suitable instrument for the particular measurement application (b) apply correction factor by determining instrumental error (c) calibrate the instrument against standard
25 (ii) TYPES OF STATIC ERROR (cont) Environmental error - due to external condition effecting the measurement including surrounding area condition such as change in temperature, humidity, barometer pressure, etc - to avoid the error :- (a) use air conditioner (b) sealing certain component in the instruments (c) use magnetic shields (iii) Observational error - introduce by the observer - most common : parallax error and estimation error (while reading the scale) - Eg: an observer who tend to hold his head too far to the left while reading the position of the needle on the scale.
26 TYPES OF STATIC ERROR (cont) 3) Random error - due to unknown causes, occur when all systematic error has accounted - accumulation of small effect, require at high degree of accuracy - can be avoid by (a) (b) increasing number of reading use statistical means to obtain best approximation of true value
27 Dynamic Characteristics Dynamic measuring a varying process condition. Instruments rarely respond instantaneously to changes in the measured variables due to such things as mass, thermal capacitance, fluid capacitance or electrical capacitance. Pure delay in time is often encountered where the instrument waits for some reaction to take place. Such industrial instruments are nearly always used for measuring quantities that fluctuate with time. Therefore, the dynamic and transient behavior of the instrument is important.
28 Dynamic Characteristics The dynamic behavior of an instrument is determined by subjecting its primary element (sensing element) to some unknown and predetermined variations in the measured quantity. The three most common variations in the measured quantity: Step change Linear change Sinusoidal change
29 Dynamic Characteristics Step change-in which the primary element is subjected to an instantaneous and finite change in measured variable. Linear change-in which the primary element is following the measured variable, changing linearly with time. Sinusoidal change-in which the primary element follows a measured variable, the magnitude of which changes in accordance with a sinusoidal function of constant amplitude.
30 Dynamic Characteristics The dynamic performance characteristics of an instrument are: Speed of response- The rapidity with which an instrument responds changes in measured quantity. Dynamic error-the difference between the true and measured value with no static error. Lag delay in the response of an instrument to changes in the measured variable. Fidelity the degree to which an instrument indicates the changes in the measured variable without dynamic error (faithful reproduction).
31 ELECTRONIC INSTRUMENT Basic elements of an electronics instrument Transducer Signal Modifier Indicating Device 1) Transducer - convert a non electrical signal into an electrical signal - e.g: a pressure sensor detect pressure and convert it to electricity for display at a remote gauge. 2) Signal modifier - convert input signal into a suitable signal for the indicating device 3) Indicating device - indicates the value of quantity being measure
32 INSTRUMENT APPLICATION GUIDE Selection, care and use of the instrument :- Before using an instrument, students should be thoroughly familiar with its operation ** read the manual carefully Select an instrument to provide the degree of accuracy required (accuracy + resolution + cost) Before used any selected instrument, do the inspection for any physical problem Before connecting the instrument to the circuit, make sure the function switch and the range selector switch has been set-up at the proper function or range

33 INSTRUMENT APPLICATION GUIDE Analog Multimeter

34 INSTRUMENT APPLICATION GUIDE Digital Multimeter
35 DC AND AC METER 35
36 D ARSORVAL METER MOVEMENT Also called Permanent-Magnet Moving Coil (PMMC). Based on the moving-coil galvanometer constructed by Jacques d Arsonval in Can be used to indicate the value of DC and AC quantity. Basic construction of modern PMMC can be seen in Figure. 36
37 Operation of D Arsonval Meter When current flows through the coil, the core will rotate. Amount of rotation is proportional to the amount of current flows through the coil. The meter requires low current (~50uA) for a full scale deflection, thus consumes very low power ( uw). Its accuracy is about 2% -5% of full scale deflection 37

38 Pointer Permanent magnet Core Coil Air Gap Fig: Modern D Arsonval Movement 38
39 DC AMMETER The PMMC galvanometer constitutes the basic movement of a dc ammeter. The coil winding of a basic movement is small and light, so it can carry only very small currents. A low value resistor (shunt resistor) is used in DC ammeter to measure large current. Basic DC ammeter: 39
40 + _ I Ish Im Rsh + Rm _ D Arsonval Movement Figure : Basic DC Ammeter 40
41 Referring to Fig. Rm = internal resistance of the movement Rsh = shunt resistance Ish =shunt current Im = full scale deflection current of the movement I = full scale current of the ammeter + shunt (i.e. total current) 41
42 I sh R sh I m R m I sh I I m R sh I mr m I I m 42
43 EXAMP LE A 1mA meter movement with an internal resistance of 100Ω is to be converted into a ma. Calculate the value of shunt resistance required. (ans: 1.01Ω) 43
44 MULTIRANGE AMMETER The range of the dc ammeter is extended by a number of shunts, selected by a range switch. The resistors is placed in parallel to give different current ranges Switch S (multi-position switch) protects the meter movement from being damage during range changing. Increase cost of the meter. 44
45 + + R1 R2 R3 R4 S Rm _ D Arsonval Movement _ Figure : Multirange Ammeter 45
46 Aryton shunt or universal shunt Aryton shunt eliminates the possibility of having the meter in the circuit without a shunt. Reduce cost Position of the switch: a) 1 : Ra parallel with series combination of Rb, Rc and the meter movement. Current through the shunt is more than the current through the meter movement, thereby protecting the meter movement and reducing its sensitivity. b) 2 : Ra and Rb in parallel with the series combination of Rc and the meter movement. The current through the meter is more than the current through the shunt resistance. c) 3 : Ra, Rb and Rc in parallel with the meter. Maximum current flows through the meter movement and very little through the shunt. This will increase the sensitivity. 46
47 Rc Rb + Rm _ D Arsonval Meter Ra _ Figure : Aryton Shunt 47
48 EXAMPLE Design an Aryton shunt to provide an ammeter with a current range of 0-1 ma, 10 ma, 50 ma and 100 ma. AD Arsonval movement with an internal resistance of 100Ω and full scale current of 50 ua is used. 1mA + R4 10mA 50mA 100mA R3 R2 + _ D Arsonval Movement R1 _ 48
49 REQUIREMENT OF A SHUNT 1) Minimum Thermal Dielectric Voltage Drop Soldering of joint should not cause a voltage drop. 2) Solderability -never connect an ammeter across a source of e.m.f -observe the correct polarity -when using the multirange meter, first use the highest current range. 49
50 BASIC METER AS ADC VOLTMETER To use the basic meter as a dc voltmeter, must know the amount of current (I fsd ) required to deflect the basic meter to full scale. The sensitivity is based on the fact that the full scale current should results whenever a certain amount of resistance is present in the meter circuit for each voltage applied. S 1 I fsd 50
51 EXAMP LE Calculate the sensitivity of a 200 ua meter movement which is to be used as a dc voltmeter. Solution: S 1 I fsd 1 200uA 5k /V 51
52 DC VOLTMETER A basic D Arsonval movement can be converted into a DC voltmeter by adding a series resistor (multiplier) as shown in Figure. V + R s Multiplier _ Figure : Basic DC Voltmeter Im Rm Im =full scale deflection current of the movement (Ifsd) Rm=internal resistance of the movement V Rs =multiplier resistance =full range voltage of the instrument 52
53 From the circuit of Figure V I m (R s R m ) R s V I R I m m m V R I m m R V R s I m m 53
54 EXAMP A basic D Arsonval LEmovement with a full-scale deflection of 50 ua and internal resistance of 500Ω is used as a DC voltmeter. Determine the value of the multiplier resistance needed to measure a voltage range of 0-10V. Solution: R V s R m I m 10V k 50uA 54
55 Sensitivity and voltmeter range can be used to calculate the multiplier resistance, Rs of a DC voltmeter. Rs=(S x Range) - Rm From example 2.4: Im= 50uA, Rm=500Ω, Range=10V Sensitivity, S uA I m 20k /V So, Rs = (20kΩ/V x 10V) 500 Ω = kω 55
56 MULTI-RANGE VOLTMETER DC voltmeter can be converted into a multi-range voltmeter by connecting a number of resistors (multipliers) in series with the meter movement. A practical multi-range DC voltmeter is shown in Figure R1 R2 R3 R4 Im V1 V2 V3 Rm + V4 _ Figure: Multirange voltmeter 56
57 EXAMPLE Convert a basic D Arsonval movement with an internal resistance of 50Ω and a full scale deflection current of 2 ma into a multirange dc voltmeter with voltage ranges of 0-10V, 0-50V, 0-100V and 0-250V. 57
58 VOLTMETER LOADING EFFECTS When a voltmeter is used to measure the voltage across a circuit component, the voltmeter circuit itself is in parallel with the circuit component. Total resistance will decrease, so the voltage across component will also decrease. This is called voltmeter loading. The resulting error is called a loading error. The voltmeter loading can be reduced by using a high sensitivity voltmeter. How about ammeter?? 58
59 AMMETER INSERTION EFFECTS Inserting Ammeter in a circuit always increases the resistance of the circuit and, thus always reduces the current in the circuit. The expected current: E I e R Placing the meter in series with R1 causes the current to reduce to a value equal to: 1 I m R 1 E R m 59
60 AMMETER INSERTION EFFECTS Dividing equation 1 by 2 yields: I m R 1 I e R 1 R m The Ammeter insertion error is given by : Insertion Error 1 I m I e X
61 OHMMETER (Series Type) Current flowing through meter movements depends on the magnitude of the unknown resistance. The meter deflection is non-linearly related to the value of the unknown Resistance, R x. A major drawback as the internal voltage decreases, reduces the currentand meter will not get zero Ohm. R 2 counteracts the voltage drop to achieve zero ohm. How do you get zero Ohm? R 1 and R 2 are determined by the value of R x = R h where R h = half of full scale deflection resistance. R h R 1 ( R 2 // R m ) R 1 R 2 R m R R 2 m The total current of the circuit, It=V/R h The shunt current through R2 is I 2 =I t -I fsd 61
62 OHMMETER (Series Type) The voltage across the shunt, Vsh= Vm So, Since Then, I 2 R 2 =I fsd R m I 2 =I t -I fsd R 2 I t fsd I I R m fsd Since So, I t =V/R h I fsd R m R h R 2 R V I fsd R 1 R h h V I fsd R m R h 62

63 Figure : Measuring circuit resistance with an ohmmeter 63
64 Example: 1) A 50µA full scale deflection current meter movementis to be used in an Ohmmeter. The meter movement has an internal resistance R m = 2kΩ and a 1.5V battery is used in the circuit. Determine R z at full scale deflection. 2) A 100Ω basic movement is to be used as an ohmmeter requiring a full scale deflection of 1mA and internal battery voltage of 3V. Ahalf scale deflection marking of 2k is desired. Calculate: i. value of R1 and R2 ii. the maximum value of R2 to compensate for a 5% drop in battery voltage 64
65 MULTIMETER Multimeter consists of an ammeter, voltmeter and ohmmeter in one unit. It has a function switch to connect the appropriate circuit to the D Arsonval movement. Fig.4.33 (in text book) shows DC miliammeter, DC voltmeter, AC voltmeter, microammeter and ohmmeter. 65
66 AC VOLTMETER USING HALF-WAVE RECTIFIER The D Arsonval meter movement can be used to measure alternating current by the use of a diode rectifier to produce unidirectional current flow. In case of a half wave rectifier, if given input voltage, Ein = 10 Vrms, then: Peak voltage, Average voltage, E p 10V rms V E ave E dc E p 8.99V o Since the diode conducts only during the positive half cycle as shown in Fig 4.18(in text book), the average voltage is given by: E ave / 2=4.5V 66
67 AC VOLTMETER USING HALF-WAVE RECTIFIER Therefore, the pointer will deflect for a full scale if 10 Vdc is applied and only 4.5 V when a 10 Vrms sinusoidal signal is applied. The DC voltmeter sensitivity is given by: S dc 1 1 1k /V I 1mA m For the circuit in Figure 4.18, the AC voltmeter sensitivity is given by: S ac 0.45S dc 0.45k /V This means that an AC voltmeter is not as sensitive as a DC voltmeter. 67
68 AC VOLTMETER USING HALF-WAVE RECTIFIER To get the multiplier resistor, Rs value: E dc 0.45 E rms R s E I dc dc R m 0.45 E o The AC meter scale is usually calibrated to give the RMS value of analternating sine wave input. A more general AC voltmeter circuit is shown in Fig (in text book) A shunt resistor, Rsh is used to draw more current from the diode D1 to move its operating point to a linear region. Diode D2 is used to conduct the current during the negative half cycle. The sensitivity of AC voltmeter can be doubled by using a full wave rectifier. 68 I dc rms R m
69 Important statistical definitions Deviation d n X n X Average deviation N X n X D N n N Standard deviations N N 1 (X n X ) 2 N n 1 X Signal-to-noise Ratio SNR X X N X 1 (X n X ) 2 N n 1 SNR improves as N X SNR N X
70 Sensitivity, Span, Precision Sensitivity is a parameter extracted from the instrument response (based on the assumption that the response is linear). If input quantity changes by Q INP, resulting in the output quantity change of Q OUT, then the sensitivity is S Q out Q inp Span of the Instrument is the difference between the upper and the lower limits of operation span = Upper Lower Precision Measurement requires a measurement system capable of resolving very small signals, (say, one part in 10 7). In other words, the precise measurement is such for which Span / Resolution» 1
71 Signal Analyzers UNIT-II
72 INTRODUCTION In the CRO we discussed measurement techniques in the time domain, that is, measurement of parameters that vary with time. Electrical signals contain a great deal of interesting and valuable information in the frequency domain as well. Analysis of signals in the frequency domain is called spectrum analysis, which is defined as the study of the distribution of a signal's energy as a function of frequency.
73 INTRODUCTION This analysis provides both electrical and physical system information which is very useful in performance testing of both mechanical and electrical systems. This chapter discusses the basic theory and applications of the principal instruments used for frequency domain analysis: distortion analyzers. wave analyzers. spectrum analyzers, and Fourier analyzers Each of these instruments quantifies the magnitude of the signal of interest through a specific bandwidth, but each measurement technique is different as will be seen in the discussion that follows.
74 DISTORTION The extent to which the output waveform of an - amplifier differs RS ANALYZE from the waveform at the input is a measure of the distortion introduced by the inherent nonlinear characteristics of active devices such as bipolar or field-effect transistors or by passive circuit components. The amount of distortion can be measured with a distortion analyzer. Applying a sinusoidal signal to the input of an ideal linear amplifier will produce a sinusoidal output waveform. However, in most cases the output waveform is not an exact replica of the input signal because of various types of distortion
75 DISTORTION ANALYZERS When an amplifier is not operating in a linear fashion, the output signal will be distorted. Distortion caused by nonlinear operation is called amplitude distortion or harmonic distortion. It can be shown mathematically that an amplitude-distorted sine wave is made up of pure sine-wave components including the fundamental frequency f of the input signal and harmonic multiples of the fundamental frequency, 2f, 3f, 4f..., and so on.
76 DISTORTION ANALYZERS When harmonics are present in considerable amount, their presence can be observed with an oscilloscope. The waveform displayed will either have unequal positive and negative peak values or will exhibit a change in shape. In either case, the oscilloscope will provide a qualitative check of harmonic distortion. However. the distortion must be fairly severe (around 10%) to be noted by an untrained observer.
77 DISTORTION ANALYZERS In addition, most testing situations require a better quantitative measure of harmonic distortion. Harmonic distortion can be quantitatively measured very accurately with a harmonic distortion analyzer, which is generally referred to simply as a distortion analyzer.
78 DISTORTION ANALYZERS A block diagram for a fundamental-suppression harmonic analyzer is shown in Fig. 1. When the instrument is used. switch S, is set to the "set level" position, the band pass filter is adjusted to the fundamental frequency and the attenuator network is adjusted to obtain a full-scale voltmeter reading. Fig. 1 Block diagram of a distortion analyzer.
79 DISTORTION ANALYZERS Switch S, is then set to the "distortion" position, the rejection f:1ter is turned to the fundamental frequency, and the attenuator is adjusted for a maximum reading on the voltmeter. The total harmonic distortion (THD). which is frequently expressed as a percentage, is defined as the ratio of the rms value of all the harmonics to the rms value of the fundamental, or THD (harmonics) 2 fundamental
80 DISTORTION ANALYZERS This defining equation is somewhat inconvenient from the standpoint of measurement. An alternative working equation expresses total harmonic distortion as the ratio of the rms value of all the harmonics to the rms value of the total signal including distortion. That is, (2) THD (harmonics) 2 ( funsamental) 2 (harmonics) 2
81 DISTORTION ANALYZERS On the basis of the assumption that any distortion caused by the components within the analyzer itself or by the oscillator signal are small enough to be neglected. Eq. 2 can be expressed as 2 2 E E 2 2 E... 3 n (3) THD E where f THD = the total harmonic distortion E f = the amplitude of the fundamental frequency including the harmonics E 2 E 3 E n = the amplitude of the individualharmonics THD = E(harmonics) fundamental
82 DISTORTION ANALYZERS EXAMPLE 1: Compute the total harmonic distortion of a signal that contains a fundamental signal with an rms value of 10 V, a second harmonic with an rms value of 3 V, a third harmonic with an rms value of 1.5 V, and a fourth harmonic with an rms value of 0.6V. SOLUTION: THD % 10

83 DISTORTION ANALYZERS A typical laboratory-quality distortion analyzer is shown in Fig. 2. The instrument shown, a Hewlett-Packard Model 334A. is capable of measuring total distortion as small as 0.1% of full scale at any frequency between 5 Hz and 600 khz. Harmonics up to 3 MHz can be measured. Fig Laboratory-quality distortion analyzer. (Courtesy Hewlett Packard Company)
84 WAVE ANALYZERS Harmonic distortion analyzers measure the total harmonic content in waveforms. It is frequently desirable to measure the amplitude of each harmonic individually. This is the simplest form of analysis in the frequency domain and can be performed with a set of tuned filters and a voltmeter.
85 WAVE ANALYZERS Such analyzes have various names, including frequency-selective voltmeters, carrier frequency voltmeters selective level meters and wave analyzers. Any of these names is quite descriptive of the instrument s primary function and mode of operation. Fig. 3 Basic wave analyzer circuit
86 WAVE ANALYZERS A very basic wave analyzer is shown in Fig. 3. The primary detector is a simple LC circuit which is adjusted for resonance at the frequency of the particular harmonic component to be measured. The intermediate stage is a full-wave rectifier, and the indicating device may be a simple do voltmeter that has been calibrated to read the peak value of a sinusoidal input voltage.
87 WAVE ANALYZERS Since the LC filter in Fig. 3 passes only the frequency to which it is tuned and provides a high attenuation to all other frequencies. many tuned filters connected to the indicating device through a selector switch would be required for a useful wave analyzer.
88 Since wave analyzers sample successive portions of the frequency spectrum through a movable "window." as shown in Fig. 4, they are called non-real-time analyzers. However. if the signal being sampled is a periodic waveform. its energy distribution as a function of frequency does not change with time. Therefore, this sampling technique is completely satisfactory. Rather than using a set of tuned filters, the heterodyne wave analyzer shown in Fig. 5 uses a single. tunable, narrowbandwidth filter, which may be regarded as the window through which a small portion of the frequency spectrum is examined at any one time.
89 WAVE ANALYZERS In this system, the signal from the internal, variable-frequency oscillator will heterodyne with the input signal to produce output signals having frequencies equal to the sum and difference of the oscillator frequency f o and the input frequency f i. Fig Wave analyzer tunable filter or "window."
90 Heterodyne-type wave analyzer In a typical heterodyne wave analyzer, the band pass filter is tuned to a frequency higher than the maximum oscillator frequency. Therefore, the "sum frequency" signal expressed as is passed by the filter to the amplifier. F s = f o +f i
91 Heterodyne-type wave analyzer As the frequency of the oscillator is decreased from its maximum frequency. a point will be reached where f o + f i is within the band of frequencies that the band pass filter will pass. The signal out of the filter is amplified and rectified.
92 Heterodyne-type wave The indicated quantity is amplified and rectified. The indicated analyzer quantity is then proportional to the peak amplitude of the fundamental component of the input signal. As the frequency of the oscillator is further decreased, the second harmonic and higher harmonics will be indicated. The bandwidth of the filter is very narrow, typically about 1 % of the frequency of interest. The attenuation characteristics of a typical commercial audio-frequency analyzer is shown in Fig. As can be seen, at 0.5f and at 2f, attenuation is approximately 75 db. The bandwidth of a heterodyne wave analyzer is usually constant.
93 An introduction to RF Spectrum Analysers
94 What is a RF Spectrum Analyser? The name says it all it is an instrument that enables the analysis of a spectrum. In our case this is the Radio Frequency (RF) spectrum. In its simplest form, a Spectrum Analyser is simply a radio receiver with a calibrated S meter.
95 Spectrum analysers are widely used to measure the frequency response, noise and distortion characteristics of all kinds of RF circuits by comparing the input and output spectra. In telecommunications applications, spectrum analysers can be used to determine the occupied bandwidth and track interference sources. In EMC testing applications, a spectrum analyser can be used for basic pre-compliance testing (detecting radiated and conducted emissions). With suitable additions, such as a Tracking Generator and a VSWR Bridge, RF filters and band limited functions can be easily checked and transmission line losses/impedance mismatches plus antenna matching measurements at multiple frequencies is simply achieved.
96 A spectrum analyser may be used to determine if a wireless transmitter is working according to licence defined standards for purity of emissions. Output signals at frequencies other than the intended communications frequency (harmonics) will be apparent on the display. The analyser may also be used to determine, by direct observation, the bandwidth of a digital or analogue signal.
97 A spectrum analyser interface is a device that connects to a wireless receiver or a personal computer to allow visual detection and analysis of electromagnetic signals over a defined band of frequencies. This is called panoramic reception and it is used to determine the frequencies of sources of interference to wireless networking equipment, such as Wi-Fi and wireless routers. Spectrum analysers can also be used to assess RF shielding. This is particularly important for high RF power devices such as transmitters, where poor shielding can lead to unwanted cross coupling between units, or even danger to nearby personnel.
98 Difference between a Spectrum Analyser and an Oscilloscope Both items enable measurement of the level of a signal, but, An RF Spectrum Analyser measures a signal with respect to frequency, i.e. in the FREQUENCY DOMAIN An Oscilloscope measures a signal with respect to time, i.e. in the TIME DOMAIN An RF Spectrum Analyser usually presents a terminated input to the signal to be measured at a defined impedance usually 50Ω An Oscilloscope usually presents a high impedance input to the signal being measured (usually 1MΩ) but can be set to 50Ω as well for some instruments.

99 Signal Analysis, frequency and time domains

100 Oscilloscope Display, amplitude modulated signal
101 Spectrum Analyser Display, amplitude modulated signa l
102 Spectrum Analyser Display, Harmonic Distortion

103 Spectrum Analyser Display, data signal
104 Spectrum Analyser types Spectrum analyser types are defined by the methods used to obtain the spectrum of a signal. Fundamentally, there are swept-tuned and FFT (Fast Fourier Transform) based spectrum analysers Older instruments tend to be swept-tuned, whilst modern day instruments are usually FFT based, which take advantage of modern signal processing techniques.
105 Swept Tuned Spectrum Analyser A swept-tuned spectrum analyser uses a super hetrodyne receiver to down convert all, or a portion of the input signal spectrum, using a voltage controlled oscillator (VCO) and a mixer to the centre frequency of a band pass filter. With this super heterodyne architecture, the VCO is swept through a range of frequencies, as selected by the instrument s SPAN control. The bandwidth of the band pass filter dictates the resolution bandwidth, which is related to the minimum bandwidth detectable by the instrument.
106 FFT Spectrum Analyser A FFT spectrum analyser computes the Discrete Fourier Transform (DFT), a mathematical process that transforms the input signal waveform into the components of its frequency spectrum. Some spectrum analysers, such as real-time spectrum analysers, use a hybrid technique where the incoming signal is first down converted to a lower frequency using super heterodyne techniques and then analysed using Fast Fourier Transformation (FFT) techniques.
107 Spectrum Analyser, typical Block Diagram
108 Terminology, Centre Frequency & Span In a typical spectrum analyser there are options to set the start, stop, and centre frequency. The frequency halfway between the stop and start frequencies on a spectrum analyser display is known as the centre frequency. This is the frequency that is in the middle of the display s frequency axis. The Span specifies the range between the start and stop frequencies. These two parameters allow for adjustment of the display within the frequency range of the instrument to enhance the visibility of the spectrum being measured.
109 Terminology, resolution bandwidth The bandwidth of the band pass filter dictates the resolution bandwidth, which is related to the minimum bandwidth detectable by the instrument. However, there is a trade-off between how quickly the display can update the full frequency span being examined and the frequency resolution presented, which is relevant for distinguishing frequency components that are close together. Here, selecting a slower rate (longer time) to traverse the selected frequency span enhances the achieved resolution.
110 Spectrum Analyzer

111 INTRODUCTION A spectrum in the practical sense is a collection of sine waves, when combined properly produces the required time domain signal. The frequency domain also has its measurement strengths. The frequency domain is better for determining the harmonic content of a signal. Amplitude (power) Time domain Measurements Frequency Domain Measurements

112 A spectrum analyzer is a device used to examine the spectral composition of some electrical, acoustic, or optical waveform. Mostly it finds application in measurement of power spectrum.
 through the range of frequencies of which the spectrum is to be measured or a super")
, a mathematical process that transforms a waveform")
113 Analog & Digital An analog spectrum analyzer uses either a variable band pass filter whose mid-frequency is automatically tuned (shifted, swept) through the range of frequencies of which the spectrum is to be measured or a super heterodyne receiver where the local oscillator is swept through a range of frequencies.a digital spectrum analyzer computes the Fast Fourier transform (FFT), a mathematical process that transforms a waveform into the components of its frequency spectrum
114 Spectrum Analysis In various field operations involving signals there is need to ascertain the nature of the signal at several points. Signal characteristics affect the parameters of operation of a system. Spectrum analysis mostly involves study of the signal entering a system or that produced by it. Spectrum analyzers usually display raw, unprocessed signal information such as voltage, power, period, wave shape, sidebands, and frequency. They can provide you with a clear and precise window into the frequency spectrum.


115 The basic types FFT Spectrum Analyzer The Fourier analyzer basically takes a time-domain signal, digitizes it using digital sampling, and then performs the mathematics required to convert it to the frequency domain, and display the resulting spectrum. Swept Spectrum Analyzer The most common type of spectrum analyzer is the swept-tuned receiver. It is the most widely accepted, general-purpose tool for frequencydomain measurements. The technique most widely used is super heterodyne. A Parallel filters measuredsimultaneously f1 f2 f Filter 'sweeps' over range ofinterest
116 FFT Spectrum Analyzer THE MEASUREMENT SYSTEM The analyzer is looking at the entire frequency range at the same time using parallel filters measuring simultaneously. It is actually capturing the time domain information which contains all the frequency information in it. With its real-time signal analysis capability, the Fourier analyzer is able to capture periodic as well as random and transient events. It also can provide significant speed improvement over the more traditional swept analyzer and can measure phase as well as magnitude.
117 Swept Spectrum Analyzer Very basically, these analyzers "sweep" across the frequency range of interest, displaying all the frequency components present. The swept-tuned analyzer works just like the AM radio in your home except that on your radio, the dial controls the tuning and instead of a display, your radio has a speaker. The swept receiver technique enables frequency domain measurements to be made over a large dynamic range and a wide frequency range. It has significant contributions to frequency-domain signal analysis for numerous applications, including the manufacture and maintenance of microwave communications links, radar, telecommunications equipment, cable TV systems, and broadcast equipment; mobile communication systems; EMI diagnostic testing; component testing; and signal surveillance.
118 Theory of Operation Spectrum Analyzer Block Diagram Input signal RF input attenuator Pre-Selector Or Low Pass Filter local oscillator mixer IF gain IFfilter sweep generator Log Amp detector video filter Crystal Reference CRTdisplay
119 The major components in a spectrum analyzer are the RF input attenuator, mixer, IF (Intermediate Frequency) gain, IF filter, detector, video filter local oscillator, sweep generator CRT display.
120 Theory ofoperation Mixer input MIXER f sig RF IF LO f sig f LO -f sig f LO f LO + f sig f LO
121 MIXER A mixer is a device that converts a signal from one frequency to another. It is sometimes called a frequency-translation device. A mixer is a non-linear device (frequencies are present at the output that were not present at the input). The output of a mixer consists of the two original signals (f sig and f LO ) as well as the sum (f LO +f sig ) and difference (f LO -f sig ) frequencies of these two signals. In a spectrum analyzer, the difference frequency is actually the frequency of interest. The mixer has converted our RF input signal to an IF (Intermediate Frequency) signal that the analyzer can now filter, amplify and detect for the purpose of displaying the signal on the screen.
122 Theory ofoperation IFFilter IF FILTER Input Spectrum IF Bandwidth (RBW) Display
123 IF FILTER The IF filter is a band pass filter which is used as the "window" for detecting signals. It's bandwidth is also called the resolution bandwidth (RBW) of the analyzer and can be changed via the front panel of the analyzer. By giving a broad range of variable resolution bandwidth settings, the instrument can be optimized for the sweep and signal conditions, letting trade-off frequency selectivity (the ability to resolve signals), signal-to-noise ratio (SNR), and measurement speed. As RBW is narrowed, selectivity is improved (we are able to resolve the two input signals). This will also often improve SNR.
124 Theory ofoperation Detector DETECTOR amplitude "bins" Positive detection: largest value in bindisplayed Negative detection: smallestvalue in bindisplayed Sample detection: last value in bindisplayed
125 Continued... In sample detection mode, a random value for each "bin" of data (also called a trace element) is produced. This detector mode is best for computing the rms value of noise or noise-like signals, but it may miss the peaks of burst signals and narrowband signals when the RBW is narrower than the frequency spacing of the bins. For displaying both signals and noise, a detector mode called the normal detector mode
126 DETECTOR The analyzer must convert the IF signal to a baseband or video signal so it can be viewed on the instrument's display. This is accomplished with an envelope detector which then deflects the CRT beam on the y-axis, or amplitude axis. Many modern spectrum analyzers have digital displays which first digitize the video signal with an analog-to-digital converter (ADC). The positive-peak detector mode captures and displays the peak value of the signal over the duration of one trace element The negative-peak detector mode captures the minimum value of the signal for each bin.
127 Theory ofoperation VideoFilter VIDEOFILTER
128 VIDEO FILTER The video filter is a low-pass filter that is located after the envelope detector and before the ADC. This filter determines the bandwidth of the video amplifier, and is used to average or smooth the trace seen on the screen. By changing the video bandwidth (VBW) setting, we can decrease the peak-topeak variations of noise.
129 Theory ofoperation Other Components LO SWEEPGEN RFINPUT ATTENUATOR IFGAIN frequency CRTDISPLAY
130 THE AUXILLARIES The local oscillator is a Voltage Controlled Oscillator (VCO) which in effect tunes the analyzer. The sweep generator actually tunes the LO so that its frequency changes in proportion to the ramp voltage. This also deflects the CRT beam horizontally across the screen from left to right, creating the frequency domain in the x-axis. The RF input attenuator is a step attenuator located between the input connector and the first mixer. It is also called the RF attenuator. This is used to adjust the level of the signal incident upon the first mixer. This is important in order to prevent mixer gain compression and distortion due to high-level and/or broadband signals.
131 Continued... The IF gain is located after the mixer but before the IF, or RBW, filter. This is used to adjust the vertical position of signals on the display without affecting the signal level at the input mixer. When it changed, the value of the reference level is changed accordingly. The IF gain will automatically be changed to compensate for input attenuator changes, so signals remain stationary on the CRT display, and the reference level is not changed.
132 f s Theory ofoperation How it all workstogether SignalRange LORange (GHz) f LO -f s f s f LO f LO +f s IF filter input mixer 0 1 f s detector 3.6 sweepgenerator f IF A LO f LO (GHz) CRTdisplay 3(GHz) f
133 First of all, the signal to be analyzed is connected to the input of the spectrum analyzer. This input signal is then combined with the LO through the mixer, to convert (or translate) it to an intermediate frequency (IF).These signals are then sent to the IF filter. The output of this filter is detected, indicating the presence of a signal component at the analyzer's tuned frequency. The output voltage of the detector is used to drive the vertical axis (amplitude) of the analyzer display. The sweep generator provides synchronization between the horizontal axis of the display (frequency) and tuning of the LO. The resulting display shows amplitude versus frequency of spectral components of each incoming signal. The horizontal arrows are intended to illustrate the "sweeping" of the analyzer. Starting with LO at 3.6 GHz, the output of the mixer has four signals, one of which is at 3.6 GHz (f LO ).
134 IF filter is also at 3.6 GHz (it's shape has been imposed onto the frequency graph for clarity). Therefore, we expect to see this signal on the display. At 0 Hz on the CRT, we do indeed see a signal - this is called "LO Feedthrough". Sweep generator moving to the right, causes the LO to sweep upward in frequency. As the LO sweeps, so two will three of the mixer output signals (the input signal is stationary). As the LO Feedthrough moves out of the IF filter bandwidth, we see it taper off on the display. As soon as the difference frequency (f LO -f s ) comes into the envelop of the IF filter, we start to see it. When it is at the center (e.g. 3.6 GHz) we see the full amplitude of this signal on the display. And, as it moves further to the right, it leaves the filter envelop, and no signal is seen on the display. The signal is being swept through the fixed IF filter, and properly displayed on the analyzer screen.
")
135 SPECTRUM ANALYZER 9 khz GHz Theory ofoperation Front PanelOperation Primary functions (Frequency, Amplitude,Span) Softkeys 8563A Control functions (RBW, sweep time,vbw) RFInput Numeri c

136 SIGNAL CONVENTIONAL GENERATORS SIGNAL GENERATOR:

137
138 Highest freq. ranges are provided by RF Oscillator (34MHz 80MHz). Lowest freq. ranges are obtained by using frequency divider. 34MHz 80MHz divided by 512 (2 9 ) Æ 67kHz 156kHz. Buffer amplifiers (B 1, B 2, B 3 ) provide isolation between the master oscillator and power amplifier. Eliminates frequency effects (signal distortion) between input and output circuits.
139 Compared to conventional std. signal gen, modern signal generator uses same oscillator on all bands. Eliminates range switching effects. Master oscillator is tuned by a capacitor. motor driven variable Coarse freq. tuning 7% frequency changes per second. Fine tuning at 0.01% of the main dial. Modulation process is done at the power amplifier stage. Two internally generated signal are used (400Hz &1kHz) for modulation.
140 FUNCTION GENERATOR A function generator produces different waveforms of adjustable frequency. The common output waveforms are the sine, square, triangular. The block diagram of a function generator is shown in Figure 3. Freq. Control regulates two currents sources (control the freq). Upper current source supplies constant current to the integrator, produces an output voltage. Lower current source supplies a reverse current to the integrator so that its output decreases linearly with time.

141 FUNCTION GENERATOR
142 t Frequency is controlled by varying upper and lower currents. An increase or decrease in the current will increase or decrease the slope of the output voltage, hence controls the frequency. The voltage comparator changes states at a pre-determined maximum and minimum level of the integrator output voltage. When the pre-determined level is reached, it changes the state and switches the current source. Produces a square wave.
143 The integrator output is a triangular waveform whose frequency is determined by the magnitude of the constant current sources. he comparator output delivers a square wave of the same frequency. The resistance diode network produces a sine wave from the triangular wave with less than 1% distortion.
144 PULSE GENERATOR Pulse generators are instruments that produce a rectangular waveform similar to a square wave but with a different duty cycle. Duty cycle = pulse width/pulse period A square wave generator has a 50% duty cycle. The basic circuit for pulse generation is the asymmetrical multivibrator. Figure. shows block diagram of a pulse generator.

145 PULSE GENERATOR
146 The duty cycle can be varied from 25 to 75% Two independent outputs: 50Ω - supplies pulses with a rise and fall time of 5ns at 5Vp. 600Ω-supplies pulses with a rise and fall time of 70ns at 30Vp. The instrument can operate as a free-running or can be Basic generating loop consists of the current sources, the ramp capacitor, the Schmitt trigger, and the current switching circuit
147 PULSE GENERATOR
148 PULSE GENERATOR Upper current source supplies a constant current to the ramp capacitor and the capacitor voltage increases linearly. When the positive slope of the ramp reaches the upper limit Schmitt trigger will change a state Reverses the condition of the current switch. Capacitor discharges linearly. (lower current source takes part) When the negative slope of the ramp reaches the lower limit, upper current will control the circuit. The process is repeated. The ratio i 1 /i 2 determines the duty cycle, and is controlled by symmetry control.the sum of i 1 and i 2 determines the frequency. The size of the capacitor is selected by the multiplier switch.
149 SWEEP GENERATOR Sweep frequency generators are instruments that provide a sine wave in the RF range. Its frequency can be varied smoothly and continuously over an entire frequency band. Figure 8 shows the block diagram of the sweep generator. The frequency sweeper provides a varying sweep voltage for synchronization to drive the horizontal deflection plates of the CRO. A sweep rate can be of the order of 20 sweeps/sec. Figure 9 shows the modulated sinewave by a voltage- controlled oscillator (VCO). 22

150 SWEEP GENERATOR
151 Radio Frequency Generator Radio frequency generators are designed to provide an output signal over a wide range of frequencies from approximately 30 khz to nearly 3000 MHz. Contain a precision output attenuator network that permits selection of output voltages from 1 uv to 3V in precise steps. output impedance= 50Ω. Figure. shows a block diagram for a basic RF signal generator. The frequency range is selected with the band selector and exact freq. is selected with the Vernier freq. selector. Broadband amplifier provides buffering between the oscillator and the load connected to the output terminal. The output of the attenuator is monitored by the output meter.
152 UNIT- OSCILLOSCOPES III
153 Objectives: This final chapter discusses the key instruments of electronic measurement with special emphasis on the most versatile instrument of electronic measurement the cathode-ray oscilloscope (CRO). The objective of this book will remain unrealized without a discussion on the CRO. The chapter begins with the details of construction of the CRO, and proceeds to examine the active and passive mode input output waveforms for filter circuits and lead-lag network delay. This will be followed by a detailed study of the dual beam CRO and its uses in op-amp circuit integrator, differentiator, inverting and noninverting circuits, comparative waveform study, and accurate measurement with impeccable visual display. In addition to the CRO, the chapter also examines the sweep frequency generator, the function generator, the sine wave generator, the square wave generator and the AF signal generator.
154 INTRODUCTION: The cathode-ray oscilloscope (CRO) is a multipurpose display instrument used for the observation, measurement, and analysis of waveforms by plotting amplitude along y-axis and time along x- axis. CRO is generally an x-y plotter; on a single screen it can display different signals applied to different channels. It can measure amplitude, frequencies and phase shift of various signals. Many physical quantities like temperature, pressure and strain can be converted into electrical signals by the use of transducers, and the signals can be displayed on the CRO. A moving luminous spot over the screen displays the signal. CROs are used to study waveforms, and other time-varying phenomena from very low to very high frequencies. The central unit of the oscilloscope is the cathode-ray tube (CRT), and the remaining part of the CRO consists of the circuitry required to operate the cathode-ray tube.
155 Block diagram of a cathode-ray oscilloscope:
156 COMPONENTS OF THE CATHODE-RAY OSCILLOSCOPE: The CRO consists of the following: (i) CRT (ii) Vertical amplifier (iii) Delay line (iv) Horizontal amplifier (v) Time-base generator (vi) Triggering circuit (vii) Power supply
157 CATHODE-RAY TUBE: The electron gun or electron emitter, the deflecting system and the fluorescent screen are the three major components of a general purpose CRT. A detailed diagram of the cathode-ray oscilloscope is given in Fig
158 Electron Gun: In the electron gun of the CRT, electrons are emitted, converted into a sharp beam and focused upon the fluorescent screen. The electron beam consists of an indirectly heated cathode, a control grid, an accelerating electrode and a focusing anode. The electrodes are connected to the base pins. The cathode emitting the electrons is surrounded by a control grid with a fine hole at its center. The accelerated electron beam passes through the fine hole. The negative voltage at the control grid controls the flow of electrons in the electron beam, and consequently, the brightness of the spot on the CRO screen is controlled.
159 Deflection Systems: Electrostatic deflection of an electron beam is used in a general purpose oscilloscope. The deflecting system consists of a pair of horizontal and vertical deflecting plates. Let us consider two parallel vertical deflecting plates P1 and P2. The beam is focused at point O on the screen in the absence of a deflecting plate voltage. If a positive voltage is applied to plate P1 with respect to plate P2, the negatively charged electrons are attracted towards the positive plate P1, and these electrons will come to focus at point Y1 on the fluorescent screen.
160 Deflection Systems: The deflection is proportional to the deflecting voltage between the plates. If the polarity of the deflecting voltage is reversed, the spot appears at the point Y2, as shown in Fig.
161 Deflection Systems: To deflect the beam horizontally, an alternating voltage is applied to the horizontal deflecting plates and the spot on the screen horizontally, as shown in Fig. 14-3(b). The electrons will focus at point X2. By changing the polarity of voltage, the beam will focus at point X1. Thus, the horizontal movement is controlled along X1OX2 line.
162 Spot Beam Deflection Sensitivity:
163 Electrostatic Deflection:
164 Electrostatic Deflection:
165 Electrostatic Deflection:
166 Electrostatic Deflection:
167 Fluorescent Screen: Phosphor is used as screen material on the inner surface of a CRT. Phosphor absorbs the energy of the incident electrons. The spot of light is produced on the screen where the electron beam hits. The bombarding electrons striking the screen, release secondary emission electrons. These electrons are collected or trapped by an aqueous solution of graphite called Aquadag which is connected to the second anode. Collection of the secondary electrons is necessary to keep the screen in a state of electrical equilibrium. The type of phosphor used, determines the color of the light spot. The brightest available phosphor isotope, P31, produces yellow green light with relative luminance of 99.99%.
168 Display waveform on the screen: Figure 14-5(a) shows a sine wave applied to vertical deflecting plates and a repetitive ramp or saw-tooth applied to the horizontal plates. The ramp waveform at the horizontal plates causes the electron beam to be deflected horizontally across the screen. If the waveforms are perfectly synchronized then the exact sine wave applied to the vertical display appears on the CRO display screen.
169 Triangular waveform: Similarly the display of the triangular waveform is as shown in Fig. 14-5(b).
170 TIME-BASE GENERATORS: The CRO is used to display a waveform that varies as a function of time. If the wave form is to be accurately reproduced, the beam should have a constant horizontal velocity. As the beam velocity is a function of the deflecting voltage, the deflecting voltage must increase linearly with time. A voltage with such characteristics is called a ramp voltage. If the voltage decreases rapidly to zero with the waveform repeatedly produced, as shown in Fig we observe a pattern which is generally called a saw-tooth waveform. The time taken to return to its initial value is known as fly back or return time.
171 Simple saw-tooth generator & associated waveforms: The circuit shown in Fig. 14-7(a) is a simple sweep circuit, in which the capacitor C charges through the resistor R. The capacitor discharges periodically through the transistor T1, which causes the waveform shown in Fig. 14-7(b) to appear across the capacitor. The signal voltage, Vi which must be applied to the base of the transistor to turn it ON for short time intervals is also shown in Fig. 14-7(b).
172 Time-base generator using UJT: The continuous sweep CRO uses the UJT as a time-base generator. When power is first applied to the UJT, it is in the OFF state and CT changes exponentially through RT. The UJT emitter voltage VE rises towards VBB and VE reaches the plate voltage VP. The emitter-to-base diode becomes forward biased and the UJT triggers ON. This provides a low resistance discharge path and the capacitor discharges rapidly. When the emitter voltage VE reaches the minimum value rapidly, the UJT goes OFF. The capacitor recharges and the cycles repeat. To improve the sweep linearity, two separate voltage supplies are used; a low voltage supply for the UJT and a high voltage supply for the RTCT circuit. This circuit is as shown in Fig. 14-7(c). RT is used for continuous control of frequency within a range and CT is varied or changed in steps. They are sometimes known as timing resistor and timing capacitor.
173 Oscilloscope Amplifiers: The purpose of an oscilloscope is to produce a faithful representation of the signals applied to its input terminals. Considerable attention has to be paid to the design of these amplifiers for this purpose. The oscillographic amplifiers can be classified into two major categories. (i) AC-coupled amplifiers (ii) DC-coupled amplifiers The low-cost oscilloscopes generally use ac-coupled amplifiers. The ac amplifiers, used in oscilloscopes, are required for laboratory purposes. The dc-coupled amplifiers are quite expensive. They offer the advantage of responding to dc voltages, so it is possible to measure dc voltages as pure signals and ac signals superimposed upon the dc signals. DC-coupled amplifiers have another advantage. They eliminate the problems of low-frequency phase shift and waveform distortion while observing low-frequency pulse train. The amplifiers can be classified according to bandwidth use also: (i) Narrow-bandwidth amplifiers (ii) Broad-bandwidth amplifiers
174 Vertical Amplifiers: Vertical amplifiers determines the sensitivity and bandwidth of an oscilloscope. Sensitivity, which is expressed in terms of V/cm of vertical deflection at the mid-band frequency. The gain of the vertical amplifier determines the smallest signal that the oscilloscope can satisfactorily measure by reproducing it on the CRT screen. The sensitivity of an oscilloscope is directly proportional to the gain of the vertical amplifier. So, as the gain increases the sensitivity also increases. The vertical sensitivity measures how much the electron beam will be deflected for a specified input signal. The CRT screen is covered with a plastic grid pattern called a graticule. The spacing between the grids lines is typically 10 mm. Vertical sensitivity is generally expressed in volts per division. The vertical sensitivity of an oscilloscope measures the smallest deflection factor that can be selected with the rotary switch.
175 Frequency response: The bandwidth of an oscilloscope detects the range of frequencies that can be accurately reproduced on the CRT screen. The greater the bandwidth, the wider is the range of observed frequencies. The bandwidth of an oscilloscope is the range of frequencies over which the gain of the vertical amplifier stays within 3 db of the mid-band frequency gain, as shown in Fig Rise time is defined as the time required for the edge to rise from 10 90% of its maximum amplitude. An approximate relation is given as follows:
176 MEASUREMENTS USING THE CATHODE-RAY OSCILLOSCOPE: 1) Measurement of Frequency:
177 2) Measurement of Phase: 3 Measurement of Phase Using Lissajous Figures:
178 Measurement of Phase Using Lissajous Figures:
179 Measurement of Phase Using Lissajous Figures:
180 Measurement of Phase Using Lissajous Figures:
181 Measurement of Phase Using Lissajous Figures:
182 TYPES OF THE CATHODE-RAY OSCILLOSCOPES: The categorization of CROs is done on the basis of whether they are digital or analog. Digital CROs can be further classified as storage oscilloscopes. 1. Analog CRO: In an analog CRO, the amplitude, phase and frequency are measured from the displayed waveform, through direct manual reading. 2. Digital CRO: A digital CRO offers digital read-out of signal information, i.e., the time, voltage or frequency along with signal display. It consists of an electronic counter along with the main body of the CRO. 3. Storage CRO: A storage CRO retains the display up to a substantial amount of time after the first trace has appeared on the screen. The storage CRO is also useful for the display of waveforms of low-frequency signals. 4. Dual-Beam CRO: In the dual-beam CRO two electron beams fall on a single CRT. The dual-gun CRT generates two different beams. These two beams produce two spots of light on the CRT screen which make the simultaneous observation of two different signal waveforms possible. The comparison of input and its corresponding output becomes easier using the dual-beam CRO.

183 SWEEP FREQUENCY GENERATOR: A sweep frequency generator is a signal generator which can automatically vary its frequency smoothly and continuously over an entire frequency range. Figure shows the basic block diagram of a sweep frequency generator. The sweep frequency generator has the ramp generator and the voltage-tuned oscillator as its basic components.
184 Applications of the Sweep Frequency Generator:
185 Lissajous Figures Lissajous figure can be displayed by applying two a.c. signals simultaneously to the X-plates and Y-plates of an oscilloscope. As the frequency, amplitude and phase difference are altered, different patterns are seen on the screen of the CRO.
186 Lissajous Figures Same amplitude but different frequencies
 insufficient range of input voltage? No problem. Usually within range limited bandwidth?")
187 Rise t iamlsecieantnifidcinbstraunmednwtshidavtehlimoitafticonrso Limitations of oscilloscope systems probes inadequate sensitivity Usually no problem because except most sensitive digital network, we are well above the minimum sensitivity (analogue system is more sensitive) insufficient range of input voltage? No problem. Usually within range limited bandwidth? some problems because all veridical amplifier and probe have a limited bandwidth Two probes having different bandwidth will show different response. Using faster probe Using slower probe (6 MHz) High-speed logic: Measurement (v.9a) 187
188 Oscil o C s o c m o po p ne e nt p so r f o os b ci e lo s scope systems Input signal Probe Vertical amplifier We assume a razor thin rising edge. Both probe and vertical amplifier degrade the rise time of the input signals. High-speed logic: Measurement (v.9a) 188
189 Combined effects: approximation Serial delay The frequency response of a probe, being a combination of several random filter poles near each other in frequency, is Gaussian. 1 T (T 2 T 2 T 2 ) 2 rise_ composite 1 2 N Rise time is 10-90% rise time When figuring a composite rise time, the squares of 10-90% rise times add Manufacturer usually quotes 3-db bandwidth F 3db approximations T = 0.338/F 3dB for each stage (obtained by simulation) High-speed logic: Measurement (v.9a) 189
190 Exampl e: Given: Bandwidth of probe and scope = 300 MHz Tr signal = 2.0ns Tr scope = 0.338/300 MHz = 1.1 ns Tr probe = 0.338/300 MHz = 1.1 ns T displayed = ( ) 1/2 = 2.5 ns For the same system, if T displayed = 2.2 ns, what is the actual rise time? T actual = ( ) 1/2 = 1.6 ns High-speed logic: Measurement (v.9a) 190
191 Self-ind uacptriamnarycfeactoor fdeagrapdinrgothbeepergformoauncne d loop Current into the probe must traverse the ground loop on the way back to source The equivalent circuit of the probe is a RC circuit The self-inductance of the ground loop, represented on our schematic by series inductance L1, impedes these current. High-speed logic: Measurement (v.9a) 191
192 Typically, 3 inches (of 0.02 Gauge wire loop) wire on ground plane equals to (approx) 200 nh Input C = 10pf T LC = (LC) 1/2 =1.4ns T = 3.4 T LC =4.8ns This will slow down the response a lot. High-speed logic: Measurement (v.9a) 192
193 Estimation of circuit Q Output resistance of source combine with the loop inductance & input capacitance is a ringing circuit. Where Q (L / C) 1/ 2 R s Q is the ratio of energy stored in the loop to energy lost per radian during resonant decay. Fast digital signals will exhibit overshoots. We need the right R s to damp the circuit. On the other hand, it slows down the response. High-speed logic: Measurement (v.9a) 193
194 Impact: probe having ground wires, when using to view very fast signals from low-impedance source, will display artificial ringing and overshoot. A 3 ground wire used with a 10 pf probe induces a 2.8 ns 10-90% rise time. In addition, the response will ring when driven from a lowimpedance source. High-speed logic: Measurement (v.9a) 194
195 Remed y Try to minimize the earth loop wire Grounding the probe close to the signal source Back to page 29 High-speed logic: Measurement (v.9a) 195
196 Spurious signal pickup from probe ground loops Mutual inductance between Signal loop A and Loop B L 5.08 A 1 A 2 M r 3 where A1 (A2) = areas of loops r = separation of loops Refer to figure for values. In this example, L M = 0.17nH Typically IC outputs max dl/dt = 7.0 * 10 7 A/s Vnoise L di M (0.17nh)( V / s) 12mV dt 12mV is not a lot until you have a 32-bit bus; must try to minimize loop area High-speed logic: Measurement (v.9a) 196
197 A Magn e M ti a c k f e ie a ld m d ag e n te et c i t c o f r ield detector to test for noise High-speed logic: Measurement (v.9a) 197
198 How probes load down a circuit Common experience Circuit works when probe is inserted. It fails when probe is removed. Effect is due to loading effect, impendence of the circuit has changed. The frequency response of the circuit will change as a result. To minimize the effect, the probe should have no more than 10% effect on the circuit under test. E.g. the probe impedance must be 10 times higher than the source impedance of the circuit under test. High-speed logic: Measurement (v.9a) 198
199 An experiment showing the probe loading effect A 10 pf probe loading a 25 ohm circuit A 10 pf probe looks like 100 ohms to a 3 ns rising edge Less probe capacitance means less circuit loading and better measurements. High-speed logic: Measurement (v.9a) 199
200 Special probing fixtures Typical probes with 10 pf inputs and one 3 to 6 ground wire are not good enough for anything with faster than 2ns rising edges Three possible techniques to attack this problem Shop built 21:1 probe Fixtures for a low-inductance ground loop Embedded Fixtures for probing High-speed logic: Measurement (v.9a) 200
201 Shop-b ui M lt a 2 ke 1: f 1 rom pr o o r b d e inary 50 ohm coaxial cable Soldered to both the signal (source) and local ground Terminates at the scope into a 50-ohm BNC connector Total impedance = 1K + 50 ohms; if the scope is set to 50 mv/divison, the measured value is = 50 * (1050/50) = 1.05 V/division High-speed logic: Measurement (v.9a) 201
202 Advantages of the 21:1 probe High input impedance = 1050 ohm Shunt capacitance of a 0.25 W 1K resistor is around 0.5 pf, that is small enough. But when the frequency is really high, this shunt capacitance may create extra loading to the signal source. Very fast rise time, the signal source is equivalent to connecting to a 1K load, the L/R rise time degradation is much smaller than connecting the signal to a standard 10 pf probe. High-speed logic: Measurement (v.9a) 202
203 Fixtures R fo e r fe a rt l o o f w ig - u i r n e d o u n c p ta ag n e c 1 e 9 ground loop Tektronix manufactures a probe fixture specially designed to connect a probe tip to a circuit under test. High-speed logic: Measurement (v.9a) 203
204 Embe d R d e m d o F v i a x b tu le re pr f o b r e P s ro bing disturb a circuit under test. Why not having a permanent probe fixture? The example is a very similar to the 21:1 probe. It has a very low parasitic capacitance of the order 1 pf, much better than the 10 pf probe. Use the jumper to select external probe or internal terminator. High-speed logic: Measurement (v.9a) 204
205 Avoidng pickup from probe shield i curren t s Shield is also part of a current path. Voltage difference exists between logic ground and scope chassis; current will flow. This shield current * shield resistance R shield will produce noise V shield High-speed logic: Measurement (v.9a) 205
206 V Shield is proportional to shield resistance, not to shield inductance because the shield and the centre conductor are magnetically coupled. Inductive voltage appear on both signal and shield wires. To observe V Shield Connect your scope tip and ground together Move the probe near a working circuit without touching anything. At this point you see only the magnetic pickup from your probe sense loop Cover the end of the probe with Al foil, shorting the tip directly to the probe s metallic ground shield. This reduces the magnetic pickup to near zero. Now touch the shorted probe to the logic ground. You should see only the V Shield High-speed logic: Measurement (v.9a) 206
207 Solving V LSohwieeldr p sh r i o el b d l r e e m sistance(not possible with standard probes) Add a shunt impedance between the scope and logic ground. Not always possible because of difficulties in finding a good grounding point Turn off unused part during observation to reduce voltage difference Not easy Use a big inductance (magnetic core) in series with the shield Good for high frequency noise. But your inductor may deteriorate at very high frequency. Redesign board to reduced radiated field. Use more layers Disconnect the scope safety ground Not safe High-speed logic: Measurement (v.9a) 207
208 Use a 1:1 probe to avoid the 10 time magnification when using 10X probe Use a differential probe arrangement High-speed logic: Measurement (v.9a) 208
209 Viewing J a it s e e r r o ia b l se d r a ve ta d d tr u a e n t s o m in i t s e s r i s o ym n b s o y l s i t n e te m rference and additive noise. To study signal, probe point D and use this as trigger as well. High-speed logic: Measurement (v.9a) 209
210 No jitter at trigger point due to repeated syn with positive-going edge. This could be misleading For proper measurement, trigger with the source clock The jitter is around half of the previous one. If source clock is not available, trigger on the source data signal point A or B (where is minimal jitter) High-speed logic: Measurement (v.9a) 210
211 Slowing Down the System clock Not easy to observe high speed digital signals which include ringing, crosstalk and other noises. Trigger on a slower clock (divide the system clock) allows better observations because it allows all signals to decay before starting the next cycle. It will help debugging timing problems. High-speed logic: Measurement (v.9a) 211
212 Observ in C g ro c s r s o ta s l s k t w al il k l Reduce logic margins due to ringing Affect marginal compliance with setup and hold requirements Reduce the number of lines that can be packed together Use a 21:1 probe to check crosstalk Connect probe and turn off machine; measure and make sure there is minimal environment noise. Select external trigger using the suspected noise source Then turn on machine to observe the signal which is a combination of primary signal, ringing due to primary signal, crosstalk and the noise present in our measurement system High-speed logic: Measurement (v.9a) 212
213 High-speed logic: Measurement (v.9a) 213
214 Try one of the followings to observe the cross talk Turn off primary signal (or short the bus drivers) Varying the possible noise source signal (e.g. signal patterns for thebus) Compare signals when noise source is on and off Talk photos with the suspected noise source ON and source OFF. The difference is the crosstalk Generating artificial crosstalk Turn off, disabled, short the driving end of the primary signal. Induce a step edge of know rise time on the interfering trace and measure the induced voltage. Useful technique when measuring empty board without components. High-speed logic: Measurement (v.9a) 214
215 POINTS TO REMEMBER: 1. CRO is used to study waveforms. 2. CRT is the main component of a CRO. 3. Prosperous P31 is used for the fluorescent screen of a CRO. 4. A CRO has the following components: (a) Electron gun (b) Deflecting system (c) Florescent screen 5. Lissajous figures are used to measure frequency and phase of the waves under study. 6. A time-base generator produces saw-tooth voltage. 7. An oscilloscope amplifier is used to provide a faithful representation of input signal applied to its input terminals.
216 IMPORTANT FORMULAE:
217 SPECIAL PURPOSE OSCILLOSCOPES
218 DUAL BEAM OSCILLOSCOPE
219 This is the Another method of studying two voltages simultaneously on the screen is to use special cathode ray Tube having two separate electron guns generating two separate beam Each electron beam has its Own vertical deflection plates. But the two beams are deflected horizontally by the common set of horizontal plate\ The time base circuit may be same or different. Such an oscilloscope is called Dual Beam Oscilloscope. The oscilloscope has two vertical deflection plates and two separate channels A and B for the two separate input signals. Each channel consists of a preamplifier and an attenuator. A delay line, main vertical amplifier and a set of vertical deflection plates together forms a single channel. There is a single set of horizontal plates and single time base circuit.
220 The sweep generator drives the horizontal amplifier which in turn drives the plates. The' horizontal plates sweep both the beams across the screen at the same rate. The sweep generator can be triggered internally by the channel A signal or.channel B signal. Similarly it' can also be triggered from an external signal or line frequency signal. This is possible with the help of trigger selector switch, a front panel control. Such an oscilloscope may have separate time base circuit for separate channel. This allows different sweep rates for the two channels but increases the size and weight of the oscilloscope.
221 DUAL TRACE OSCILLOSCOPE
222 The comparison of two or more voltages is very much,necessary in the analysis and study of many electronic circuits and systems. This is possible by using more than one oscilloscope but in such a case it is difficult to trigger the sweep of each oscilloscope precisely at the same time. A common and less costly method to solve this problem is to use dual trace or multi trace oscilloscopes. In this method, the same electron beam is used to generate two traces which can be deflected from two independent vertical sources. The methods are used to generate two independent traces which the alternate sweep method and other is chop method.

223 DIGITAL STORAGE OSCILLOSCOPE
224 The input signal is digitized and stored in memory in digital form. In this state it is capable of being analyzed to produce a varietyof different information. To view the display on the CRT the data from memory is reconstructed in analog form. The analog input voltage is sampled at adjustable rates (up to 100,000 samples per second) and data points are read onto the memory.
225 If the memory is read out rapidly and repetitively, an input event which is a single shot transient becomes a repetitive or continuous waveform that can be observed easily on an ordinary scope (not a storage scope). The digital memory also may be read directly (without going through DAC) to, say, a computer where a stored program can manipulate the data in almost any way desired

226 COMPLETE BLOCK DIAGRAM OF DSO
227 SAMPLING OSCILLOSCOPE
228
229 An ordinary oscilloscope has a B.W. of 10 MHz the HF performance can be improved by means of sampling the input waveform and reconstructing its shape from the sample, i.e. the signal to be observed is sampled and after a few cycles sampling point is advanced and another sample is taken. The shape of the wave form is reconstructed by joining the sample levels together. The sampling frequency may be as low as 1/10th of the input signal frequency (if the input signal frequency is 100 MHz, the bandwidth of the CRO vertical amplifier can be as low as 10 MHz). As many as 1000 samples are used to reconstruct the original waveform.
230 The input is applied to the sampling gate. The input waveform is sampled whenever a sampling pulse opens the sampling gate. The sampling must be synchronized with the input signal frequency. The signal is delayed in the vertical amplifier, allowing the horizontal sweep to be initiated by the input signal. At the beginning of each sampling cycle, the trigger pulse activates an oscillator and a linear ramp voltage is generated.
231 This ramp voltage is applied to a voltage comparator which compares the ramp voltage to a staircase generate-when the two voltages are equal in amplitude, the staircase advances one step and a sampling pulse is generated, which opens the sampling gate for a sample of input voltage. The resolution of the final image depends upon the size of the steps of the staircase generator. The smaller the size of the steps the larger the number of samples and higher the resolution of the image.


232 UNIT-4 TRANSDUCERS
233 INTRODUCTION OF TRANSDUCERS A transducer is a device that convert one form of energy to other form. It converts the measurand to a usable electrical signal. In other word it is a device that is capable of converting the physical quantity into a proportional electrical quantity such as voltage or current. Pressure Voltage
234 BLOCK DIAGRAM OF TRANSDUCERS Transducer contains two parts that are closely related to each other i.e. the sensing element and transduction element. The sensing element is called as the sensor. It is device producing measurable response to change in physical conditions. The transduction element convert the sensor output to suitable electrical form.
235 CHARACTERISTICS OF TRANSDUCERS 1. Ruggedness 2. Linearity 3. Repeatability 4. Accuracy 5. High stability and reliability 6. Speed of response 7. Sensitivity 8. Small size
236 TRANSDUCERS SELECTION FACTORS 1. Operating Principle: The transducer are many times selected on the basis of operating principle used by them. The operating principle used may be resistive, inductive, capacitive, optoelectronic, piezo electric etc. 2. Sensitivity: The transducer must be sensitive enough to produce detectable output. 3. Operating Range: The transducer should maintain the range requirement and have a good resolution over the entire range. 4. Accuracy: High accuracy is assured. 5. Cross sensitivity: It has to be taken into account when measuring mechanical quantities. There are situation where the actual quantity is being measured is in one plane and the transducer is subjected to variation in another plan. 6. Errors: The transducer should maintain the expected inputoutput relationship as described by the transfer function so as to avoid errors.
237 Contd. 7. Transient and frequency response : The transducer should meet the desired time domain specification like peak overshoot, rise time, setting time and small dynamic error. 8. Loading Effects: The transducer should have a high input impedance and low output impedance to avoid loading effects. 9. Environmental Compatibility: It should be assured that the transducer selected to work under specified environmental conditions maintains its input- output relationship and does not break down. 10. Insensitivity to unwanted signals: The transducer should be minimally sensitive to unwanted signals and highly sensitive to desired signals.
238 CLASSIFICATION OFTRANSDUCERS The transducers can be classified as: I. Active and passive transducers. II. Analog and digital transducers. III. On the basis of transduction principle used. IV. Primary and secondary transducer V. Transducers and inverse transducers.
239 ACTIVE AND PASSIVE TRANSDUCERS Active transducers : These transducers do not need any external source of power for their operation. Therefore they are also called as self generating type transducers. I. The active transducer are self generating devices which operate under the energy conversion principle. II. As the output of active transducers we get an equivalent electrical output signal e.g. temperature or strain to electric potential, without any external source of energy being used.
240 Piezoelectric er Transduc
241 CLASSIFICATION OF ACTIVE TRANSDUCERS
242 Passive Transducers : I. These transducers need external source of power for their operation. So they are not self generating type transducers. II. ACTIVE AND PASSIVE TRANSDUCERS A DC power supply or an audio frequency generator is used as an external power source. III. These transducers produce the output signal in the form of variation in resistance, capacitance, inductance or some other electrical parameter in response to the quantity to be measured.
243 CLASSIFICATION OF PASSIVE TRANSDUCERS
244 PRIMARY AND SECONDARY TRANSDUCERS Some transducers contain the mechanical as well as electrical device. The mechanical device converts the physical quantity to be measured into a mechanical signal. Such mechanical device are called as the primary transducers, because they deal with the physical quantity to be measured. The electrical device then convert this mechanical signal into a corresponding electrical signal. Such electrical device are known as secondary transducers.
245 CONTD Ref fig in which the diaphragm act as primary transducer. It convert pressure (the quantity to be measured) into displacement(the mechanical signal). The displacement is then converted into change in resistance using strain gauge. Hence strain gauge acts as the secondary transducer.
246 CLASSIFICATION OF TRANSDUCERS According to Transduction Principle

 C is")
247 CLASSIFICATION OF TRANSDUCERS According to Transduction Principle CAPACITIVE TRANSDUCER: In capacitive transduction transducers the measurand is converted to a change in the capacitance. A typical capacitor is comprised of two parallel plates of conducting material separated by an electrical insulating material called a dielectric. The plates and the dielectric may be either flattened or rolled. The purpose of the dielectric is to help the two parallel plates maintain their stored electrical charges. The relationship between the capacitance and the size of capacitor plate, amount of plate separation, and the dielectric is given by C = ε0 εr A / d d is the separation distance of plates (m) C is the capacitance (F, Farad) ε0 : absolute permittivity of vacuum εr : relative permittivity A is the effective (overlapping) area of capacitor plates (m2) d Area=A Either A, d or ε can be varied.

248 CLASSIFICATION OF TRANSDUCERS According to Transduction Principle ELECTROMAGNETIC TRANSDUCTION: In electromagnetic transduction, the measurand is converted to voltage induced in conductor by change in the magnetic flux, in absence of excitation. The electromagnetic transducer are self generating active transducers The motion between a piece of magnet and an electromagnet is responsible for the change in flux

249 Current induced in a coil.

250
251 CLASSIFICATION OF TRANSDUCERS According to Transduction Principle INDUCTIVE TRANSDUCER: In inductive transduction, the measurand is converted into a change in the self inductance of a single coil. It is achieved by displacing the core of the coil that is attached to a mechanical sensing element
252 CLASSIFICATION OF TRANSDUCERS According to Transduction Principle PIEZO ELECTRIC INDUCTION : In piezoelectric induction the measurand is converted into a change in electrostatic charge q or voltage V generated by crystals when mechanically it is stressed as shown in fig.


253 CLASSIFICATION OF TRANSDUCERS According to Transduction Principle PHOTOVOLTAIC TRANSDUCTION : In photovoltaic transduction the measurand is converted to voltage generated when the junction between dissimilar material is illuminated as shown in fig.
254 Physics of Photovoltaic Generation n-type semiconductor Depletion Zone p-type semiconductor
255 CLASSIFICATION OF TRANSDUCERS According to Transduction Principle PHOTO CONDUCTIVE TRANSDUCTION : In photoconductive transduction the measurand is converted to change in resistance of semiconductor material by the change in light incident on the material.
256 CLASSIFICATION OF TRANSDUCERS Transducer and Inverse Transducer TRANSDUCER: Transducers convert non electrical quantity to electrical quantity. INVERSE TRANSDUCER: Inverse transducers convert electrical quantity to a non electrical quantity
257 PASSIVE TRANSDUCERS Resistive transducers : Resistive transducers are those transducers in which the resistance change due to the change in some physical phenomenon. The resistance of a metal conductor is expressed by a simple equation. R = ρl/a Where R = resistance of conductor in Ω L = length of conductor in m A = cross sectional area of conductor in m 2 ρ = resistivity of conductor material in Ω-m.
258 RESISTIVE TRANSDUCER There are 4 type of resistive transducers. 1. Potentiometers (POT) 2. Strain gauge 3. Thermistors 4. Resistance thermometer


259 POTENTIOMETER The potentiometer are used for voltage division. They consist of a resistive element provided with a sliding contact. The sliding contact is called aswiper. The contact motion may be linear or rotational or combination of the two. The combinational potentiometer have their resistive element in helix form and are called helipots. Fig shows a linear pot and a rotary pot.
260 STRAIN GAUGE The strain gauge is a passive, resistive transducer which converts the mechanical elongation and compression into a resistance change. This change in resistance takes place due to variation in length and cross sectional area of the gauge wire, when an external force acts on it.
261 TYPES OF STRAIN GAUGE The type of strain gauge are as 1. Wire gauge a) Unbonded b) Bonded c) Foil type 2. Semiconductor gauge
262 UNBONDED STRAIN GAUGE An unbonded meter strain gauge is shown in fig This gauge consist of a wire stretched between two point in an insulating medium such as air. The wires may be made of various copper, nickel, crome nickle or nickle iron alloys. In fig the element is connected via a rod to diaphragm which is used for sensing the pressure. The wire are tensioned to avoid buckling when they experience the compressive force.
263 The unbounded meter wire gauges used almost exclusively in transducer application employ preloaded resistance wire connected in Wheatstone bridge as shown in fig. At initial preload the strain and resistance of the four arms are nominally equal with the result the output voltage of the bridge is equal to zero. Application of pressure produces a small displacement, the displacement increases a tension in two wire and decreases it in the other two thereby increase the resistance of two wire which are in tension and decreasing the resistance of the remaining two wire. This causes an unbalance of the bridge producing an output voltage which is proportional to the input displacement and hence to the applied pressure.
264
265 BONDED STRAIN GAUGE The bonded metal wire strain gauge are used for both stress analysis and for construction of transducer. A resistance wire strain gauge consist of a grid of fine resistance wire. The grid is cemented to carrier which may be a thin sheet of paper Bakelite or Teflon. The wire is covered on top with a thin sheet of material so as to prevent it from any mechanical damage. The carrier is bonded with an adhesive material to the specimen which permit a good transfer of strain from carrier to grid of wires.

266
267 BONDED METAL FOIL STRAIN GAUGE It consist of following parts: 1. Base (carrier) Materials: several types of base material are used to support the wires. Impregnated paper is used for room temp. applications. 2. Adhesive: The adhesive acts as bonding materials. Like other bonding operation, successful strain gauge bonding depends upon careful surface preparation and use of the correct bonding agent. In order that the strain be faithfully transferred on to the strain gauge, the bond has to be formed between the surface to be strained and the plastic backing material on which the gauge is mounted..

268
269 It is important that the adhesive should be suited to this backing and adhesive material should be quick drying type and also insensitive to moisture. 3. Leads: The leads should be of such materials which have low and stable resistivity and also a low resistance temperature coefficient.
270 Contd. This class of strain gauge is only an extension of the bonded metal wire strain gauges. The bonded metal wire strain gauge have been completely superseded by bonded metal foil strain gauges. Metal foil strain gauge use identical material to wire strain gauge and are used for most general purpose stress analysis application and for many transducers.

271
272 SEMICONDUCTOR GAUGE Semiconductor gauge are used in application where a high gauge factor is desired. A high gauge factor means relatively higher change in resistance that can be measured with good accuracy. The resistance of the semiconductor gauge change as strain is applied to it. The semiconductor gauge depends for their action upon the piezo-resistive effect i.e. change in value of resistance due to change in resistivity. Silicon and germanium are used as resistive material for semiconductor gauges.
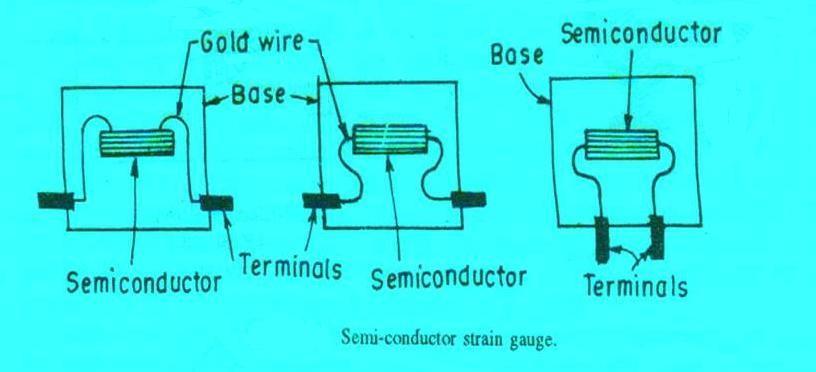
273
274 RESISTANCE THERMOMETER Resistance of metal increase with increases in temperature. Therefore metals are said to have a positive temperature coefficient of resistivity. Fig shows the simplest type of open wire construction of platinum résistance thermometer. The platinum wire is wound in the form of spirals on an insulating material such as mica or ceramic. This assembly is then placed at the tip of probe This wire is in direct contact with the gas or liquid whose temperature is to be measured.


275
276 The resistance of the platinum wire changes with the change in temperature of the gas or liquid This type of sensor have a positive temperature coefficient of resistivity as they are made from metals they are also known as resistance temperature detector Resistance thermometer are generally of probe type for immersion in medium whose temperature is to be measured or controlled.
277 THERMISTOR Thermistor is a contraction of a term thermal resistor. Thermistor are temperature dependent resistors. They are made of semiconductor material which have negative temperature coefficient of resistivity i.e. their resistance decreases with increase of temperature. Thermistor are widely used in application which involve measurement in the range of 0-60º Thermistor are composed of sintered mixture of metallic oxides such as manganese, Nickle, cobalt, copper, iron and uranium.
278

279 Contd. The thermistor may be in the form of beads, rods and discs. The thermistor provide a large change in resistance for small change in temperature. In some cases the resistance of thermistor at room temperature may decreases as much as 6% for each 1ºC rise in temperature.
280 Thermocouples See beck Effect When a pair of dissimilar metals are joined at one end, and there is a temperature difference between the joined ends and the open ends, thermal emf is generated, which can be measured in the open ends. This forms the basis of thermocouples.
281 VARIABLE-INDUCTANCE TRANSDUCERS An inductive electromechanical transducer is a transducer which converts the physical motion into the change in inductance. Inductive transducers are mainly used for displacement measurement.
282 The inductive transducers are of the self generating or the passive type. The self generating inductive transducers use the basic generator principle i.e. the motion between a conductor and magnetic field induces a voltage in the conductor. The variable inductance transducers work on the following principles. Variation in self inductance Variation in mutual inductance
283 PRINCIPLE OF VARIATION OF SELF INDUCTANCE Let us consider an inductive transducer having N turns and reluctance R. when current I is passed through the transducer, the flux produced is Φ = Ni / R Differentiating w.r.t. to t, dφ/dt = N/R * di/dt The e.m.f. induced in a coil is given by e = N * dφ/dt
284 e = N * N/R * di/dt e = N 2 / R * di/dt Self inductance is given by L = e/di/dt = N 2 / R The reluctance of the magnetic circuit is R = Ɩ/μA i. ii. iii. Therefore L = N 2 / Ɩ/μA = N 2 μa / Ɩ From eqn we can see that the self inductance may vary due to Change in number of turns N Change in geometric configuration Change in permeability of magnetic circuit
285 CHANGE IN SELF INDUCTANCE WITH CHANGE IN NUMBER OF TURNS N From eqn we can see the output may vary with the variation in the number of turns. As inductive transducers are mainly used for displacement measurement, with change in number of turns the self inductance of the coil changes in-turn changing the displacement Fig shows transducers used for linear and angular displacement fig a shows an air cored transducer for the measurement of linear displacement and fig b shows an iron cored transducer used for angular displacement measurement.

286
287
288 CHANGE IN SELF INDUCTANCE WITH CHANGE IN PERMEABILITY An inductive transducer that works on the principle of change in self inductance of coil due to change in the permeability is shown in fig As shown in fig the iron core is surrounded by a winding. If the iron core is inside the winding then the permeability increases otherwise permeability decreases. This cause the self inductance of the coil to increase or decrease depending on the permeability. The displacement can be measured using this transducer Ferromagnetic former displacement coil
289 VARIABLE RELUCTANCE INDUCTIVE TRANSDUCER Fig shows a variable reluctance inductive transducer. As shown in fig the coil is wound on the ferromagnetic iron. The target and core are not in direct contact with each other. They are separated by an air gap. The displacement has to be measured is applied to the ferromagnetic core The reluctance of the magnetic path is found by the size of the air gap. The self inductance of coil is given by L = N 2 / R = N 2 / Ri + Ra N : number of turns R : reluctance of coil Ri : reluctance of iron path Ra : reluctance of air gap
290 CONTD. The reluctance of iron path is negligible L = N 2 / Ra Ra = la / μoa Therefore L œ 1 / la i.e. self inductance of the coil is inversely proportional to the air gap la. When the target is near the core, the length is small. Hence the self inductance is large. But when the target is away from the core, the length is large. So reluctance is also large. This result in decrease in self inductance i.e. small self inductance. Thus inductance is function of the distance of the target from the core. Displacement changes with the length of the air gap, the self inductance is a function of the displacement.
291 PRINCIPLE OF CHANGE IN MUTUAL INDUCTANCE Multiple coils are required for inductive transducers that operate on the principle of change in mutual inductance. The mutual inductance between two coils is given by M = KsqrtL1L2 Where M : mutual inductance K : coefficient of coupling L1:self inductance of coil 1 L2 : self inductance of coil 2 By varying the self inductance or the coefficient of coupling the mutual inductance can be varied
292
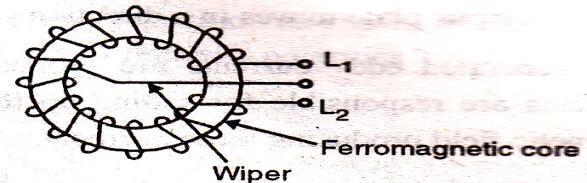
293
294 DIFFERENTIAL OUTPUT TRANSDUCERS Usually the change in self inductance ΔL for inductive transducers is insufficient for the detection of stages of an instrumentation system. The differential arrangement comprises of a coil that is divided in two parts as shown in fig a and b. In response to displacement, the inductance of one part increases from L to L+ΔL while the inductance of the other part decreases from L to L- ΔL. The difference of two is measured so to get output 2 ΔL. This will increase the sensitivity and minimize error..
295 Fig c shows an inductive transducer that provides differential output. Due to variation in the reluctance, the self inductance of the coil changes. This is the principle of operation of differential output inductive transducer
296


297 LINEAR VARIABLE DIFFERENTIAL TRANSFORMER(LVDT) AN LVDT transducer comprises a coil former on to which three coils are wound. The primary coil is excited with an AC current, the secondary coils are wound such that when a ferrite core is in the central linear position, an equal voltage is induced in to each coil. The secondary are connected in opposite so that in the central position the outputs of the secondary cancels each other out.
298 LVDT contd The excitation is applied to the primary winding and the armature assists the induction of current in to secondary coils. When the core is exactly at the center of the coil then the flux linked to both the secondary winding will be equal. Due to equal flux linkage the secondary induced voltages (eo1 & eo2) are equal but they have opposite polarities. Output voltage eo is therefore zero. This position is called null position
299
300 Now if the core is displaced from its null position toward sec1 then flux linked to sec1 increases and flux linked to sec2 decreases. Therefore eo1 > eo2 and the output voltage of LVDT eo will be positive Similarly if the core is displaced toward sec2 then the eo2 > eo1 and the output voltage of LVDT eo will be negative.
301 Transduce rs 301
 or digital (e.g. digital tachometer) Sensor Actuator 302")
302 Terminolog Transducers y convert one form of energy into another Sensors/Actuators are input/output transducers Sensors can be passive (e.g. change in resistance) or active (output is a voltage or current level) Sensors can be analog (e.g. thermocouples) or digital (e.g. digital tachometer) Sensor Actuator 302
303 Transducer types Quantity being Measured Light Level Temperature Force/Pressur e Position Speed Sound Input Device (Sensor) Light Dependant Resistor (LDR), Photodiode, Phototransistor, Solar Cell Thermocouple, Thermistor, Thermostat, Resistive temperature detectors (RTD) Strain Gauge, Pressure Switch, Load Cells Potentiometer, Encoders, Reflective/Slotted Opto-switch, LVDT Tacho-generator, Reflective/Slotted Opto-coupler, Doppler Effect Sensors Carbon Microphone, Piezo-electric Crystal Output Device (Actuator) Lights & Lamps, LED's & Displays, Fiber Optics Heater, Fan, Peltier Elements Lifts & Jacks, Electromagnetic, Vibration Motor, Solenoid, Panel Meters AC and DC Motors, Stepper Motor, Brake Bell, Buzzer, Loudspeaker 303

304 Positional Sensors: potentiometer Can be Linear or Rotational Processing circuit 304
305 Positional Sensors: LVDT Linear Variable Differential Transformer 305
 Used in traffic lights (inductive loop buried under the road). Sense objects in dirty environment.")
306 Positional Sensors: Inductive Proximity Switch Detects the presence of metallic objects (non-contact) via changing inductance Sensor has 4 main parts: field producing Oscillator via a Coil; Detection Circuit which detects change in the field; and Output Circuit generating a signal (NO or NC) Used in traffic lights (inductive loop buried under the road). Sense objects in dirty environment. Does not work for non-metallic objects. Omni-directional. 306


307 Positional Sensors: Rotary Encoders Incremental and absolute types Incremental encoder needs a counter, loses absolute position between power glitches, must be re-homed Absolute encoders common in CD/DVD drives 307
; Platinum Resistance")
308 Temperature Sensors Bimetallic switch (electro-mechanical) used in thermostats. Can be creep or snap action. Creep-action: coil or spiral that unwinds or coils with changing temperature Thermistors (thermally sensitive resistors); Platinum Resistance Thermometer (PRT), very high accuracy. 308
309 Thermocoupl es Two dissimilar metals induce voltage difference (few mv per 10K) electro-thermal or Seebeck effect Use op-amp to process/amplify the voltage Absolute accuracy of 1K is difficult 309

310 310
311 Light sensors: photoconductive cells Light dependent resistor (LDR) cell 311
312 Light level sensitive switch 312
313 Photojunction devices photodiode phototransistor 313
314 Photovoltaic Solar Cells Can convert about 20% of light power into electricity Voltage is low (diode drop, ~0.6V) Solar power is 1.4kW/m^2 314
 Acts as a current source electrons")
315 Photomultiplier tubes (PMT) Most sensitive of light sensors (can detect individual photons) Acts as a current source electrons 315

316 Motion sensors/transducers Switches, solenoids, relays, motors, etc. Motors DC Brushed/brushless Servo Stepper motors AC Stepper motor Brushed motor permanent magnets on armature, rotor acts as electromagnet Brushless motor permanent magnet on the rotor, electromagnets on armature are switched 316
317 Sound transducers microphone speaker Note: voice coil can also be used to generate fast motion 317

318 Piezo transducers Detect motion (high and low frequency) Sound (lab this week), pressure, fast motion Cheap, reliable but has a very limited range of motion 318
319 UNIT-V Bridges, Measurement of Physical parameters
320 Introduction to Bridge. Bridge circuits are the instrument s for making comparisons measurements, are widely used to measure resistance, inductance, capacitance and impedance. Bridge circuits operate on a null-indication principle, the indication is independent of the calibration of the indicating device or any characteristics of it. It is very accurate.
321 The Wheatstone Bridge. The Wheatstone bridge consists of two parallel resistance branches with each branch containing two series resistor elements. A DC voltage source is connected across the resistance network to provide a source of current through the resistance network. A null detector is the galvanometer which is connected between the parallel branches to detect the balance condition. The Wheatstone bridge is an accurate and reliable instrument and heavily used in the industries.
the bridge is in balance condition, the voltage across resistor R 3 is equal to the voltage drop across R 4. At balance the voltage drop at R 1 and R 2 must be equalto.")
322 The Wheatstone Bridge. Operation (i)we want to know the value of R 4, vary one of the remaining resistor until the current through the null detector decreases to zero. (ii)the bridge is in balance condition, the voltage across resistor R 3 is equal to the voltage drop across R 4. At balance the voltage drop at R 1 and R 2 must be equalto. I 3 R 3 I 4 R 4
323 Cont d No current go through the galvanometer G, the bridge is in balance so, I 1 R 1 I 2 R 2 I 2 I 4 I 1 I 3 This equation, R 1 R 4 = R 2 R 3, states the condition for a balance Wheatstone bridge and can be used to compute the value of unknown resistor. I 1 R 3 I 2 R 4 R 1 R 2 R 3 R 4 or R 1 R 4 R 2 R 3

324 Example 5.1: Wheatstone Bridge. Determine the value of unknown resistor, Rx in the circuit. assuming a null exist ; current through the galvanometer is zero. Solution: From the circuit, the product of the resistance in opposite arms of the bridge is balance, so solving for R x R x R 1 R 2 R 3 R x R 2 R 3 R 1 15K *32K 40K 12K
325 Sensitivity of the Wheatstone Bridge. When the bridge is in unbalance condition, current flows through the galvanometer causing a deflection of its pointer. The amount of deflection is a function of the sensitivity of the galvanometer. Sensitivity is the deflection per unit current. The more sensitive the galvanometer will deflect more with the same amount of current. S milimeters degrees radian μα μα μα Total deflection, D SI

326 Unbalanced Wheatstone Bridge. The current flows through the galvanometer can determine by using Thevenin theorem. R Th R ab R 1 // R 3 R 2 // R 4 R R V 3 4 Th V ab E R E R 1 R 3 2 R 4
327 Unbalanced Wheatstone Bridge. The deflection current in the galvanometer is I g V th R th R g R g = the internal resistance in the galvanometer
328 Kelvin Bridge. The Kelvin Bridge is the modified version of the Wheatstone Bridge. The modification is done to eliminate the effect of contact and lead resistance when measuring unknown low resistance. By using Kelvin bridge, resistor within the range of 1 to approximately 1 can be measured with high degree of accuracy. Figure below is the basic Kelvin bridge. The resistor R ic represent the lead and contact resistance present in the Wheatstone bridge.
329 Cont d Full Wave Bridge Rectifier Used in AC Voltmeter Circuit. The second set of R a and R b compensates for this relatively low lead contact resistance At balance the ratio of R a and R b must be equalto the ratio of R 1 to R 3. R x R 2 R 3 R R x R 3 R 2 R 1 1 R x R 3 R b R 2 R 1 R a

330 Example : Kelvin Bridge. Figure below is the Kelvin Bridge, the ratio of R a to R b is R 1 is 5 Ohm and R 1 =0.5 R 2. Solution: Find the value of R x. Calculate the resistance of R x, R x R b 1 R 2 R a 1000 R 1 =0.5 R 2, so calculate R 2 R2 R Calculate the value of R x 1 R R x
331 Introduction to AC Bridge. AC bridge are used to measure impedances. All the AC bridges are based on the Wheatstone bridge. In the AC bridge the bridge circuit consists of four impedances and an ac voltage source. The impedances can either be pure resistance or complex impedance.
332 Cont d When the specific circuit conditions apply, the detector current becomes zero, which is known as null or balance zero. bridge circuits can be constructed to measure about any device value desired, be it capacitance, inductance, resistance the unknown component's value can be determined directly from the setting of the calibrated standard value
333 A simple bridge circuits are shown below; inductance capacitance
334 Similar angle Bridge. used to measure the impedance of a capacitance circuit. Sometimes called the capacitance comparison bridge or series resistance capacitance bridge R x C x R R R R R C 3 3
335 Opposite angle Bridge. From similar angle bridge, capacitor is replaced by inductance used to measure the impedance of a inductive circuit. Sometimes called a Hay bridge 2 R R R C 2 R x R 2 C L x R 2 R 3 C R 2 C 2 1 1
336 Wien Bridge. uses a parallel capacitor-resistor standard impedance to balance out an unknown series capacitor-resistor combination. All capacitors have some amount of internal resistance. R s R 1 x R R 1 2 R C 2 2 x x C s R R 1 1 R C 2 2 x x C x 2 1 R x C x R 2 Rs 2 R1 1 R R 1 Cs R 2 2 s C 1 2 s R C s s

337 Maxwell-Wien Bridge. used to measure unknown inductances in terms of calibrated resistance and capacitance. Because the phase shifts of inductors and capacitors are exactly opposite each other, a capacitive impedance can balance out an inductive impedance if they are located in opposite legs of a bridge Sometimes called a Maxwell bridge R R R 2 3 x 3 Rs Please L x R 2 R 3 C s prove it!!! 2
338 Measurement of Physical parameters 338
339 Transduc er Transducer is defined as a device which convert energy or information from one form to another. Transducer may be mechanical, electrical, magnetic, optical, chemical, thermal or combination of two or more of these. 339
340 Electrical Transducers Most quantities to be measured are non-electrical such as temperature, pressure, displacement, humidity, fluid flow, speed, ph, etc., but these quantities cannot be measured directly. Hence such quantities are required to be sensed and changed into some other form of quantities. Therefore, for measurement of non-electrical quantities these are to be converted into electrical quantities (because these are easily measurable). This conversion is done by device called Electrical Transducer 340
341 Classification of transducers 1. Based on principle of transduction 2. Active & passive 3. Analog & digital 4. Inverse transducer 341
342 Based on principle used Thermo electric Magneto resistive Electro kinetic Optical 342
343 Passive transducer Device which need external power for transduction from auxiliary power source Eg : resistive, inductive, capacitive Without power they will not work 343
344 Active transducer No extra power required. Self generating Draw power from input applied Eg. Piezo electric x tal used for acceleration measurement 344
345 Resistive Transducer In this transducer, the resistance of the output terminal of the transducer gets varied according to the measurand. Some resistive transducers are:- Potentiometer Strain gauge Resistance Thermometer 345
346 RESISTIVITE POTENTIOMETERS A resistance element provided with a movable contact. This is very simple and cheap form of transducer and is widely used. It convert linear or rotational displacement into a voltage. The contact motion can be Linear rotation combination of the two such as helical 346
347 347
348 Strain Gauges It is a device which is used for measuring mechanical surface strain and one of the most extensively used electrical transducer. It can detect and convert force or small mechanical displacement into electrical signal. Many other quantities such as torque, pressure, weight and tension etc, which involve the effect of force or displacement can be measured with string gauge. Gauge Factor (G) = Change in resistance per unit strain. Strain Gauge can be of four types:- 1. Wire strain gauge 2. Foil strain gauge 3. Thin film strain gauge 4. Semiconductor strain gauge 348
349 INDUCTIVE TRANSDUCERS Inductive transducers are those in which SELF INDUCTANCE of a coil or the MUTUAL INDUCTANCE of a pair of coil is altered due to variation in the measurand. Change in inductance L is measured. The self inductance of a coil refers to the flux linkage within the coil due to current in the same coil. Mutual inductance refers to the flux linkages in a coil due to current in adjacent coil. 349

350 350
351 CAPACITIVE TRANSDUCERS A capacitor is an electrical component which essentially consists of two plates separated by an insulator. The property of a capacitor to store an electric charge when its plates are at different potential is referred to as capacitance. 351
352 Capacitance C = Q V If the capacitance is large, more charge is needed to establish a given voltage difference. The capacitance plates of area between two parallel metallic. C 0 r A d F m

353 353
354 354

355 Linear Variable Differential Transformer (LVDT) 355
356 356
357 There is one primary winding connected to an ac source (50 Hz 20 khz), excitation 3 15 V rms. Core is made of high permeability soft iron or nickel iron. Two secondary windings are connected in series opposition 357
358 358
359 Geometric centre of coil arrangement is called the NULL position. The output voltage at the null position is ideally zero. However it is small but nonzero (null voltage). Why? 1.Harmonics in the excitation voltage and stray capacitance coupling between the primary and the secondary 2. Manufacturingdefects. 359
360 Advantages 1. Wide range of displacement from µm to cm. 2. Frictionless and electrical isolation. 3. High output. 4. High sensitivity [sensitivity is expressed in mv (output voltage)/ mm (input core displacement)]. 360
361 Disadvantages 1. Sensitive to stray magnetic fields. 2. Affected by vibrations. 3. Dynamic response is limited mechanically by the mass of core and electrically by frequency of excitation voltage. 361
362 Pressure Measurement The measurement of force or pressure can be done by converting the applied force or pressure into displacement by elastic element ( such as diaphragam, capsule, bellows or bourdon tube) which act as primary transducer. This displacement, which is function of pressure is measured by transducer which act as secondary transducer (these may be potentiometer, strain gauge, LVDT, piezoelectric,etc.). 362
363 Output of LVDT 363
364 Bourdon Tube Pressure Gauge Perhaps the most common device around today is the pressure gauge which utilizes a bourdon tube as its sensing elements. Bourdon : A bourdon tube is a curved, hollow tube with the process pressure applied to the fluid in the tube. The pressure in the tube causes the tube to deform or uncoil. The pressure can be determined from the mechanical displacement of the pointer connected to the Bourdon tube. Typical shapes for the tube are C (normally for local display), spiral and helical. 5/9/2012 PUNJAB EDUSAT SOCIETY 364


365 Bourdon Tube Pressure Gauge Bourdon tubes are generally are of three types; 1. C-type 2. Helical type 3. Spiral type 5/9/2012 PUNJAB EDUSAT SOCIETY 365
366 Thermocouple 1 2 The thermocouple is one of the most commonly used method for measuring the process temperature. The operation is based on seebeck effect. Thermo-couple consists of two dissimilar metals joined together as shown. It forms two junctions 1 and 2 in which one junction is hot and other is cold. Due to this difference in temperature, an e.m.f. is generated and electric current flow in circuit. 366
367 Flow Measurement Electromagnetic Flow meter:- This is suitable for measurement of slurries, sludge and any electrical conducting liquid. flow 367
368 Electromagnetic flow meter consist of insulated electrodes pair buried in opposite sides of non conducting pipe placed in magnetic field of electromagnet. The voltage induced across electrodes is E=Blv volts 368
369 Liquid Level Measurement Gamma Ray Method Geiger Muller tube Source of Gamma rays The liquid level can be measured with ultrasonic method and by using float also 369
370 PIEZOELECTRIC AND HALL EFFECT TRANSDUCERS 370
371 Piezoelectricity Phenomenon of generating an electric charge in a material when subjecting it to a mechanical stress (direct effect). and Generating a mechanical strain in response to an applied electric field (converse effect). Piezoelectric materials are Anisotropic Electrical and mechanical properties differ along different directions 371
372 372
373 There are two families of constants: g constants and d constants. In the constants the first subscript refers to the direction of electrical effect and the second to that of the mechanical effect according to the axis systems. 373

374 374

375 375
376 Commercially available Hall generators made of : Bulk Indium Arsenide (InAs) Thin Film InAs Gallium Arsenide (GaAs) Indium Antimonide (InSb). 376
377 RESISTANCE TEMPERATURE DETECTOR (RTD) Resistance temperature detector (RTD) devices are conductors used for temperature sensing. They can be used in bridge method as well as ohmmeter method to take the output. The change in resistance of material per unit change in temperature should be as large as possible. 5/9/2012 PUNJAB EDUSAT SOCIETY 377
378 RESISTANCE TEMPERATURE DETECTOR (RTD) The material should have high value of resistivity to get required value in less space. Resistance and temperature relation should be continuous and stable. Platinum, nickel and copper are the most commonly used. Tungsten and nickel alloy are also used. 5/9/2012 PUNJAB EDUSAT SOCIETY 378
379 APPLICATIONS OF RTD They can be used in average and differential temp. measurement. Differential temp. sensing to an accuracy of 0.05º have been accomplished in a nuclear reactor coolant heat rise application. 5/9/2012 PUNJAB EDUSAT SOCIETY 379
380 Humidity Measurement Humidity is the amount of water vapour in the air and Humidity Measurement is a measure of relative amount of water vapour present in the air or a gas. The humidity can be expressed in different ways: Absolute Humidity Relative Humidity Dew Point 5/9/2012 PUNJAB EDUSAT SOCIETY 380
381 Humidity Measurement Devices that indirectly measure humidity by sensing changes in physical or electrical properties in materials due to their moisture content are called hygrometers. The three major instruments used for measuring humidity in industry are: The Electrical Hygrometer The Psychrometer The Dew Point Meter 5/9/2012 PUNJAB EDUSAT SOCIETY 381

382 Humidity Measurement 5/9/2012 PUNJAB EDUSAT SOCIETY 382
383 Resistance Hygrometer This is an electrical hygrometer. It is an active transducer. These instruments are suitable for measuring moisture levels between 15% and 95%. It has typical measurement uncertainty of 3%. Atmospheric contaminates and operation in saturation conditions both cause characteristics drift. 5/9/2012 PUNJAB EDUSAT SOCIETY 383
384 Principle Of Resistance Hygrometer Some Hygroscopic Salts exhibit a change in resistivity with humidity. Resistive hygrometer humidity sensors use the change in resistance of a hygroscopic material between two electrodes on an insulating substrate. The hygroscopic salt is deposited between two electrodes. The resistance of the element changes when it is exposed to variations in humidity. 5/9/2012 PUNJAB EDUSAT SOCIETY 384
385 Resistance Hygrometer The Resistance Hygrometer should not be exposed to conditions of 100% humidity as the resulting condensation may damage the device. These are accurate to within ± 2.5 % or ± 1.5 % in some cases. Response times are typically of the order of a few seconds. 5/9/2012 PUNJAB EDUSAT SOCIETY 385
386 APPLICATI ONS Humidity sensors can be used not only to measure the humidity in an atmosphere but also to automatically control: -> Humidifiers -> Dehumidifiers -> Air conditioners for adjustment. 5/9/2012 PUNJAB EDUSAT SOCIETY 386
387 Data Acquisition System
388 PC-based Data Acquisition System Overview In the last few years, industrial PC I/O interface products have become increasingly reliable, accurate and affordable. PC-based data acquisition and control systems are widely used in industrial and laboratory applications like monitoring, control, data acquisition and automated testing. Selecting and building a DA&C (Data Acquisition and Control) system that actually does what you want it to do requires some knowledge of electrical and computer engineering. Transducers and actuators Signal conditioning Data acquisition and control hardware Computer systems software
389 Data Acquisition System Introduction I A data acquisition system consists of many components that are integrated to: Sense physical variables (use of transducers) Condition the electrical signal to make it readable by an A/D board
390 Data Acquisition System Introduction II Convert the signal into a digital format acceptable by a computer Process, analyze, store, and display the acquired data with the help of software

391 Data Acquisition System Block Diagram
392 Transduce rs Sense physical phenomena and translate it into electric signal. Temperature Pressure Light Force Displacement Level Electric signals ON/OFF switch
393 Transducers and Actuators A transducer converts temperature, pressure, level, length, position, etc. into voltage, current, frequency, pulses or other signals. An actuator is a device that activates process control equipment by using pneumatic, hydraulic or electrical power. For example, a valve actuator opens and closes a valve to control fluid rate.
394 Signal Conditioning Signal conditioning circuits improve the quality of signals generated by transducers before they are converted into digital signals by the PC's data-acquisition hardware. Examples of signal conditioning are signal scaling, amplification, linearization, cold-junction compensation, filtering, attenuation, excitation, common-mode rejection, and so on.
395 Signal Conditioning One of the most common signal conditioning functions is amplification. For maximum resolution, the voltage range of the input signals should be approximately equal to the maximum input range of the A/D converter. Amplification expands the range of the transducer signals so that they match the input range of the A/D converter. For example, a x10 amplifier maps transducer signals which range from 0 to 1 V into the range 0 to 10 V before they go into the A/D converter.
396 Signal Conditioning Electrical signals are conditioned so they can be used by an analog input board. The following features may be available: Amplification Isolation Filtering Linearization
397 Data Acquisition Data acquisition and control hardware generally performs one or more of the following functions: analog input, analog output, digital input, digital output and counter/timer functions.
398 Analog Inputs (A/D) Analog to digital (A/D) conversion changes analog voltage or current levels into digital information. The conversion is necessary to enable the computer to process or store the signals.
399 Analog Inputs (A/D) The most significant criteria when selecting A/D hardware are: 1. Number of input channels 2. Single-ended or differential input signals 3. Sampling rate (in samples per second) 4. Resolution (usually measured in bits of resolution) 5. Input range (specified in full-scale volts) 6. Noise and nonlinearity
400 Analog to Digital (A/D) Converter Input signal Sampling rate Throughput Resolution Range Gain
401 A/D Input Signal Converter: Analog Signal is continuous Example: strain gage. Most of transducers produce analog signals Digital Signal is either ON or OFF Example: light switch.


402 A/D Converter: Sampling Rate Determines how often conversions take place. The higher the sampling rate, the better. Analog Input 16 Samples/cycle 8 Samples/cycle
403 A/D Sampling Rate Converter: Aliasing. Acquired signal gets distorted if sampling rate is too small.
404 A/D Throughput Converter: Effective rate of each individual channel is inversely proportional to the number of channels sampled. Example: 100 KHz maximum. 16 channels. 100 KHz/16 = 6.25 KHz per channel.
405 A/D Converter: Range Minimum and maximum voltage levels that the A/D converter can quantize Ranges are selectable (either hardware or software) to accurately measure the signal

406 A/D Converter: Resolution
Table of Contents...2. About the Tutorial...6. Audience...6. Prerequisites...6. Copyright & Disclaimer EMI INTRODUCTION Voltmeter...
 1 Table of Contents Table of Contents...2 About the Tutorial...6 Audience...6 Prerequisites...6 Copyright & Disclaimer...6 1. EMI INTRODUCTION... 7 Voltmeter...7 Ammeter...8 Ohmmeter...8 Multimeter...9
UNIT 2. Q.1) Describe the functioning of standard signal generator. Ans. Electronic Measurements & Instrumentation
 Describe the functioning of standard signal generator. Ans. Electronic Measurements & Instrumentation") UNIT 2 Q.1) Describe the functioning of standard signal generator Ans. STANDARD SIGNAL GENERATOR A standard signal generator produces known and controllable voltages. It is used as power source for the
UNIT 2 Q.1) Describe the functioning of standard signal generator Ans. STANDARD SIGNAL GENERATOR A standard signal generator produces known and controllable voltages. It is used as power source for the
MAHARASHTRA STATE BOARD OF TECHNICAL EDUCATION (Autonomous) (ISO/IEC Certified) SUMMER 14 EXAMINATION Model Answer
 (ISO/IEC Certified) SUMMER 14 EXAMINATION Model Answer") MAHARASHTRA STATE BOARD OF TECHNICAL EDUCATION (Autonomous) (ISO/IEC 27001 2005 Certified) SUMMER 14 EXAMINATION Model Answer Subject Code : 17317 Page No: 1 Important Instructions to examiners: 1) The
MAHARASHTRA STATE BOARD OF TECHNICAL EDUCATION (Autonomous) (ISO/IEC 27001 2005 Certified) SUMMER 14 EXAMINATION Model Answer Subject Code : 17317 Page No: 1 Important Instructions to examiners: 1) The
Definitions. Spectrum Analyzer
 SIGNAL ANALYZERS Spectrum Analyzer Definitions A spectrum analyzer measures the magnitude of an input signal versus frequency within the full frequency range of the instrument. The primary use is to measure
Electronic Measurements & Instrumentation UNIT What are the basic performance characteristics of a system?
 UNIT-1 1. What are the basic performance characteristics of a system? Ans: STATIC CHARACTE RISTICS The static characteristics of an instrument are, in general, considered for instruments which are used
UNIT-3. Electronic Measurements & Instrumentation
 UNIT-3 1. Draw the Block Schematic of AF Wave analyzer and explain its principle and Working? ANS: The wave analyzer consists of a very narrow pass-band filter section which can Be tuned to a particular
4. Digital Measurement of Electrical Quantities
 4.1. Concept of Digital Systems Concept A digital system is a combination of devices designed for manipulating physical quantities or information represented in digital from, i.e. they can take only discrete
Introduction. In the frequency domain, complex signals are separated into their frequency components, and the level at each frequency is displayed
 SPECTRUM ANALYZER Introduction A spectrum analyzer measures the amplitude of an input signal versus frequency within the full frequency range of the instrument The spectrum analyzer is to the frequency
Sine waves by far the most important form of alternating quantity important properties are shown below
 AC DC METERS 1 Sine waves by far the most important form of alternating quantity important properties are shown below 2 Average value of a sine wave average value over one (or more) cycles is clearly zero
Laboratory Exercise 6 THE OSCILLOSCOPE
 Introduction Laboratory Exercise 6 THE OSCILLOSCOPE The aim of this exercise is to introduce you to the oscilloscope (often just called a scope), the most versatile and ubiquitous laboratory measuring
MAHARASHTRA STATE BOARD OF TECHNICAL EDUCATION (Autonomous) (ISO/IEC Certified)
 (ISO/IEC Certified)") Q. No. WINTER 16 EXAMINATION (Subject Code: 17317) Model Answer Important Instructions to examiners: 1) The answers should be examined by key words and not as word-to-word as given in the model answer
Q. No. WINTER 16 EXAMINATION (Subject Code: 17317) Model Answer Important Instructions to examiners: 1) The answers should be examined by key words and not as word-to-word as given in the model answer
SIDDHARTH GROUP OF INSTITUTIONS :: PUTTUR Siddharth Nagar, Narayanavanam Road QUESTION BANK (DESCRIPTIVE) UNIT I
 UNIT I") SIDDHARTH GROUP OF INSTITUTIONS :: PUTTUR Siddharth Nagar, Narayanavanam Road 517583 QUESTION BANK (DESCRIPTIVE) Subject with Code : EMI(16EC416) Year & Sem: III B.Tech & I Sem Course & Branch: B.Tech
SIDDHARTH GROUP OF INSTITUTIONS :: PUTTUR Siddharth Nagar, Narayanavanam Road 517583 QUESTION BANK (DESCRIPTIVE) Subject with Code : EMI(16EC416) Year & Sem: III B.Tech & I Sem Course & Branch: B.Tech
MAHARASHTRA STATE BOARD OF TECHNICAL EDUCATION (Autonomous) (ISO/IEC Certified) SUMMER 2013 EXAMINATION
 (ISO/IEC Certified) SUMMER 2013 EXAMINATION") MAHARASHTRA STATE BOARD OF TECHNICAL EDUCATION (Autonomous) (ISO/IEC 27001 2005 Certified) SUMMER 2013 EXAMINATION Subject Code: 12117 Model Answer Page No: 1 Important Instructions to examiners: 1) The
MAHARASHTRA STATE BOARD OF TECHNICAL EDUCATION (Autonomous) (ISO/IEC 27001 2005 Certified) SUMMER 2013 EXAMINATION Subject Code: 12117 Model Answer Page No: 1 Important Instructions to examiners: 1) The
SUMMER 15 EXAMINATION
 SUMMER 15 EXAMINATION Subject Code: 17317 Model Answer Important Instructions to examiners: 1) The answers should be examined by key words and not as word-to-word as given in the model answer scheme. 2)
Electronic Measurements & Instrumentation. 1. Draw the Maxwell s Bridge Circuit and derives the expression for the unknown element at balance?
 UNIT -6 1. Draw the Maxwell s Bridge Circuit and derives the expression for the unknown element at balance? Ans: Maxwell's bridge, shown in Fig. 1.1, measures an unknown inductance in of standard arm offers
b) State the types of standards of measurement. 2M
 State the types of standards of measurement. 2M") MODEL ANSWER WINTER 17 EXAMINATION Subject Title: Electronic Instruments & Measurements Subject Code: 17317 I m p o r t a n t I n s t r u c t i o n s t o e x a m i n e r s : 1) The answers should be examined
MODEL ANSWER WINTER 17 EXAMINATION Subject Title: Electronic Instruments & Measurements Subject Code: 17317 I m p o r t a n t I n s t r u c t i o n s t o e x a m i n e r s : 1) The answers should be examined
ELECTRONIC MEASUREMENTS & INSTRUMENTATION UNIT-I
 SHRI VISHNU ENGINEERING COLLEGE FOR WOMEN :: BHIMAVARAM DEPARTMENT OF ELECTRONICS & COMMUNICATION ENGINEERING ELECTRONIC MEASUREMENTS & INSTRUMENTATION PERFORMANCE CHARACTERISTICS: UNIT-I Static characteristics:
RF/IF Terminology and Specs
 RF/IF Terminology and Specs Contributors: Brad Brannon John Greichen Leo McHugh Eamon Nash Eberhard Brunner 1 Terminology LNA - Low-Noise Amplifier. A specialized amplifier to boost the very small received
MAHARASHTRA STATE BOARD OF TECHNICAL EDUCATION (Autonomous) (ISO/IEC Certified) MODEL ANSWER
 (ISO/IEC Certified) MODEL ANSWER") MODEL ANSWER SUMMER 17 EXAMINATION Subject Title: Electronic Instruments and Measurements Subject Code: Important Instructions to examiners: 1) The answers should be examined by key words and not as word-to-word
MODEL ANSWER SUMMER 17 EXAMINATION Subject Title: Electronic Instruments and Measurements Subject Code: Important Instructions to examiners: 1) The answers should be examined by key words and not as word-to-word
SHRI ANGALAMMAN COLLEGE OF ENGINEERING & TECHNOLOGY (An ISO 9001:2008 Certified Institution) SIRUGANOOR,TRICHY
 SIRUGANOOR,TRICHY") SHRI ANGALAMMAN COLLEGE OF ENGINEERING & TECHNOLOGY (An ISO 9001:2008 Certified Institution) SIRUGANOOR,TRICHY-621105. DEPARTMENT OF ELECTRICAL AND ELECTRONICS ENGINEERING EI 1306-MEASUREMENT AND INSTRUMENTATION
SHRI ANGALAMMAN COLLEGE OF ENGINEERING & TECHNOLOGY (An ISO 9001:2008 Certified Institution) SIRUGANOOR,TRICHY-621105. DEPARTMENT OF ELECTRICAL AND ELECTRONICS ENGINEERING EI 1306-MEASUREMENT AND INSTRUMENTATION
Lab 1: Basic Lab Equipment and Measurements
 Abstract: Lab 1: Basic Lab Equipment and Measurements This lab exercise introduces the basic measurement instruments that will be used throughout the course. These instruments include multimeters, oscilloscopes,
EE ELECTRICAL ENGINEERING AND INSTRUMENTATION
 EE6352 - ELECTRICAL ENGINEERING AND INSTRUMENTATION UNIT V ANALOG AND DIGITAL INSTRUMENTS Digital Voltmeter (DVM) It is a device used for measuring the magnitude of DC voltages. AC voltages can be measured
Utilizzo del Time Domain per misure EMI
 Utilizzo del Time Domain per misure EMI Roberto Sacchi Measurement Expert Manager - Europe 7 Giugno 2017 Compliance EMI receiver requirements (CISPR 16-1-1 ) range 9 khz - 18 GHz: A normal +/- 2 db absolute
Signal Detection with EM1 Receivers
 Signal Detection with EM1 Receivers Werner Schaefer Hewlett-Packard Company Santa Rosa Systems Division 1400 Fountaingrove Parkway Santa Rosa, CA 95403-1799, USA Abstract - Certain EM1 receiver settings,
Electronic Instrument Disadvantage of moving coil meter Low input impedance High loading error for low-voltage range voltmeter
 EIE 240 Electrical and Electronic Measurement Class 6, February 20, 2015 1 Electronic Instrument Disadvantage of moving coil meter Low input impedance High loading error for low-voltage range voltmeter
FREQUENCY AGILE FM MODULATOR INSTRUCTION BOOK IB
 FMT615C FREQUENCY AGILE FM MODULATOR INSTRUCTION BOOK IB1215-02 TABLE OF CONTENTS SECTION SUBJECT 1.0 Introduction 2.0 Installation & Operating Instructions 3.0 Specification 4.0 Functional Description
SC5307A/SC5308A 100 khz to 6 GHz RF Downconverter. Datasheet SignalCore, Inc.
 SC5307A/SC5308A 100 khz to 6 GHz RF Downconverter Datasheet 2017 SignalCore, Inc. support@signalcore.com P RODUCT S PECIFICATIONS Definition of Terms The following terms are used throughout this datasheet
RADIO AMATEUR EXAM GENERAL CLASS
 RAE-Lessons by 4S7VJ 1 CHAPTER-7 RADIO AMATEUR EXAM GENERAL CLASS MEASURMENTS By 4S7VJ 7.1 TEST EQUIPMENT & MEASUREMENTS Correct operation of amateur radio equipment involves measurements to ensure optimum
8 Hints for Better Spectrum Analysis. Application Note
 8 Hints for Better Spectrum Analysis Application Note 1286-1 The Spectrum Analyzer The spectrum analyzer, like an oscilloscope, is a basic tool used for observing signals. Where the oscilloscope provides
Using Circuits, Signals and Instruments
 Using Circuits, Signals and Instruments To be ignorant of one s ignorance is the malady of the ignorant. A. B. Alcott (1799-1888) Some knowledge of electrical and electronic technology is essential for
LINEAR IC APPLICATIONS
 1 B.Tech III Year I Semester (R09) Regular & Supplementary Examinations December/January 2013/14 1 (a) Why is R e in an emitter-coupled differential amplifier replaced by a constant current source? (b)
EE Chapter 7 Measuring Instruments
 EE 2145230 Chapter 7 Measuring Instruments 7.1 Meter Movements The basic principle of many electric instruments is that of the galvanometer. This is a device which reacts to minute electromagnetic influences
An Introduction to Spectrum Analyzer. An Introduction to Spectrum Analyzer
 1 An Introduction to Spectrum Analyzer 2 Chapter 1. Introduction As a result of rapidly advancement in communication technology, all the mobile technology of applications has significantly and profoundly
8 Hints for Better Spectrum Analysis. Application Note
 8 Hints for Better Spectrum Analysis Application Note 1286-1 The Spectrum Analyzer The spectrum analyzer, like an oscilloscope, is a basic tool used for observing signals. Where the oscilloscope provides
SC5407A/SC5408A 100 khz to 6 GHz RF Upconverter. Datasheet. Rev SignalCore, Inc.
 SC5407A/SC5408A 100 khz to 6 GHz RF Upconverter Datasheet Rev 1.2 2017 SignalCore, Inc. support@signalcore.com P R O D U C T S P E C I F I C A T I O N S Definition of Terms The following terms are used
Agilent Spectrum Analysis Basics. Application Note 150
 Agilent Spectrum Analysis Basics Application Note 150 Table of Contents Chapter 1 Introduction.......................................................4 Frequency domain versus time domain.......................................4
ANALOG COMMUNICATION
 ANALOG COMMUNICATION TRAINING LAB Analog Communication Training Lab consists of six kits, one each for Modulation (ACL-01), Demodulation (ACL-02), Modulation (ACL-03), Demodulation (ACL-04), Noise power
Understanding Mixers Terms Defined, and Measuring Performance
 Understanding Mixers Terms Defined, and Measuring Performance Mixer Terms Defined Statistical Processing Applied to Mixers Today's stringent demands for precise electronic systems place a heavy burden
electrical noise and interference, environmental changes, instrument resolution, or uncertainties in the measurement process itself.
 MUST 382 / EELE 491 Spring 2014 Basic Lab Equipment and Measurements Electrical laboratory work depends upon various devices to supply power to a circuit, to generate controlled input signals, and for
Rayat Shikshan Sanstha s Karmaveer Bhaurao Patil Polytechnic, Satara. Sub: Electrical Engineering Assignment No: 1
 Assignment No: 1 1) Define Precision and Dead zone 2) Define 1) Speed of response 2) Lag 3) Fidelity 4)dynamic error 3) Define Standard and State its classification 4) What is Calibration & State its necessity
multiplier input Env. Det. LPF Y (Vertical) VCO X (Horizontal)
 VCO X (Horizontal)") Spectrum Analyzer Objective: The aim of this project is to realize a spectrum analyzer using analog circuits and a CRT oscilloscope. This interface circuit will enable to use oscilloscopes as spectrum
Spectrum Analyzer Objective: The aim of this project is to realize a spectrum analyzer using analog circuits and a CRT oscilloscope. This interface circuit will enable to use oscilloscopes as spectrum
Elements of Communication System Channel Fig: 1: Block Diagram of Communication System Terminology in Communication System
 Content:- Fundamentals of Communication Engineering : Elements of a Communication System, Need of modulation, electromagnetic spectrum and typical applications, Unit V (Communication terminologies in communication
Name Date: Course number: MAKE SURE TA & TI STAMPS EVERY PAGE BEFORE YOU START EXPERIMENT 10. Electronic Circuits
 Laboratory Section: Last Revised on September 21, 2016 Partners Names: Grade: EXPERIMENT 10 Electronic Circuits 1. Pre-Laboratory Work [2 pts] 1. How are you going to determine the capacitance of the unknown
MEASUREMENTS & INSTRUMENTATION ANALOG AND DIGITAL METERS
 MEASUREMENTS & INSTRUMENTATION ANALOG AND DIGITAL METERS ANALOG Metering devices Provides monotonous (continuous) movement. ELECTRICAL MEASURING INSTRUMENTS ANALOG METERS A d Arsonval galvanometer (Moving
Spectrum Analysis - Elektronikpraktikum
 Spectrum Analysis Introduction Why measure a spectra? In electrical engineering we are most often interested how a signal develops over time. For this time-domain measurement we use the Oscilloscope. Like
SC5306B 1 MHz to 3.9 GHz RF Downconverter Core Module. Datasheet SignalCore, Inc.
 SC5306B 1 MHz to 3.9 GHz RF Downconverter Core Module Datasheet 2015 SignalCore, Inc. support@signalcore.com SC5306B S PECIFICATIONS Definition of Terms The following terms are used throughout this datasheet
Basic Communication Laboratory Manual. Shimshon Levy&Harael Mualem
 Basic Communication Laboratory Manual Shimshon Levy&Harael Mualem September 2006 CONTENTS 1 The oscilloscope 2 1.1 Objectives... 2 1.2 Prelab... 2 1.3 Background Theory- Analog Oscilloscope...... 3 1.4
Keysight Technologies 8 Hints for Making Better Measurements Using RF Signal Generators. Application Note
 Keysight Technologies 8 Hints for Making Better Measurements Using RF Signal Generators Application Note 02 Keysight 8 Hints for Making Better Measurements Using RF Signal Generators - Application Note
For the filter shown (suitable for bandpass audio use) with bandwidth B and center frequency f, and gain A:
 with bandwidth B and center frequency f, and gain A:") Basic Op Amps The operational amplifier (Op Amp) is useful for a wide variety of applications. In the previous part of this article basic theory and a few elementary circuits were discussed. In order to
Basic Op Amps The operational amplifier (Op Amp) is useful for a wide variety of applications. In the previous part of this article basic theory and a few elementary circuits were discussed. In order to
HF Receivers, Part 2
 HF Receivers, Part 2 Superhet building blocks: AM, SSB/CW, FM receivers Adam Farson VA7OJ View an excellent tutorial on receivers NSARC HF Operators HF Receivers 2 1 The RF Amplifier (Preamp)! Typical
RADIO RECEIVERS ECE 3103 WIRELESS COMMUNICATION SYSTEMS
 RADIO RECEIVERS ECE 3103 WIRELESS COMMUNICATION SYSTEMS FUNCTIONS OF A RADIO RECEIVER The main functions of a radio receiver are: 1. To intercept the RF signal by using the receiver antenna 2. Select the
Receiver Design. Prof. Tzong-Lin Wu EMC Laboratory Department of Electrical Engineering National Taiwan University 2011/2/21
 Receiver Design Prof. Tzong-Lin Wu EMC Laboratory Department of Electrical Engineering National Taiwan University 2011/2/21 MW & RF Design / Prof. T. -L. Wu 1 The receiver mush be very sensitive to -110dBm
MODERN ACADEMY FOR ENGINEERING & TECHNOLOGY IN MAADI
 MODERN ACADEMY FOR ENGINEERING & TECHNOLOGY IN MAADI 1 2/25/2018 ELECTRONIC MEASUREMENTS ELC_314 2 2/25/2018 Text Books David A. Bell, A. Foster Chin, Electronic Instrumentation & Measurements, 2 nd Ed.,
Television and video engineering
 Television and video engineering Unit-4 Television Receiver systems Objectives: To learn the requirements of TV receiver Study of monochrome and Colour TV receivers. To learn functions of Tuning circuits
RF Fundamentals Part 2 Spectral Analysis
 Spectral Analysis Dec 8, 2016 Kevin Nguyen Keysight Technologies Agenda Overview Theory of Operation Traditional Spectrum Analyzers Modern Signal Analyzers Specifications Features Wrap-up Page 2 Overview
Measurement of Digital Transmission Systems Operating under Section March 23, 2005
 Measurement of Digital Transmission Systems Operating under Section 15.247 March 23, 2005 Section 15.403(f) Digital Modulation Digital modulation is required for Digital Transmission Systems (DTS). Digital
A year and a half after the first introduction of the PXA, Agilent is now introducing the world s highest performance mmw signal analyzer in April
 1 This presentation is intended to be a beginning tutorial on signal analysis. Vector signal analysis includes but is not restricted to spectrum analysis. It is written for those who are unfamiliar with
VALLIAMMAI ENGINEERING COLLEGE
 VALLIAMMAI ENGINEERING COLLEGE SRM Nagar, Kattankulathur 603 203 DEPARTMENT OF ELECTRONICS AND INSTRUMENTATION ENGINEERING QUESTION BANK VI SEMESTER EI6601 Modern Electronic Instrumentation Regulation
ELEC3242 Communications Engineering Laboratory Amplitude Modulation (AM)
") ELEC3242 Communications Engineering Laboratory 1 ---- Amplitude Modulation (AM) 1. Objectives 1.1 Through this the laboratory experiment, you will investigate demodulation of an amplitude modulated (AM)
ELEC3242 Communications Engineering Laboratory 1 ---- Amplitude Modulation (AM) 1. Objectives 1.1 Through this the laboratory experiment, you will investigate demodulation of an amplitude modulated (AM)
P a g e 1 ST985. TDR Cable Analyzer Instruction Manual. Analog Arts Inc.
 P a g e 1 ST985 TDR Cable Analyzer Instruction Manual Analog Arts Inc. www.analogarts.com P a g e 2 Contents Software Installation... 4 Specifications... 4 Handling Precautions... 4 Operation Instruction...
DIPLOMA COURSE IN ELECTRONICS AND COMMUNICATION ENGINEERING
 Department of Technical Education DIPLOMA COURSE IN ELECTRONICS AND COMMUNICATION ENGINEERING Third Semester ELECTRONIC MEASUREMENTS AND INSTRUMENTATION Contact Hours/Week : 04 Contact Hours/Semester :
APPENDIX D DISCUSSION OF ELECTRONIC INSTRUMENTS
 APPENDIX D DISCUSSION OF ELECTRONIC INSTRUMENTS DC POWER SUPPLIES We will discuss these instruments one at a time, starting with the DC power supply. The simplest DC power supplies are batteries which
Notes on Noise Reduction
 Notes on Noise Reduction When setting out to make a measurement one often finds that the signal, the quantity we want to see, is masked by noise, which is anything that interferes with seeing the signal.
ECE 440L. Experiment 1: Signals and Noise (1 week)
") ECE 440L Experiment 1: Signals and Noise (1 week) I. OBJECTIVES Upon completion of this experiment, you should be able to: 1. Use the signal generators and filters in the lab to generate and filter noise
ECE 440L Experiment 1: Signals and Noise (1 week) I. OBJECTIVES Upon completion of this experiment, you should be able to: 1. Use the signal generators and filters in the lab to generate and filter noise
Spectrum Analyzer. EMI Receiver
 Challenges in Testing by Werner Schaefer Narrowband and Broadband Discrimination with a Spectrum Analyzer or EMI Receiver photo provided by Agilent 26 Conformity December 2007 In the field of EMC, the
The Discussion of this exercise covers the following points:
 Exercise 3-2 Frequency-Modulated CW Radar EXERCISE OBJECTIVE When you have completed this exercise, you will be familiar with FM ranging using frequency-modulated continuous-wave (FM-CW) radar. DISCUSSION
Understanding RF and Microwave Analysis Basics
 Understanding RF and Microwave Analysis Basics Kimberly Cassacia Product Line Brand Manager Keysight Technologies Agenda µw Analysis Basics Page 2 RF Signal Analyzer Overview & Basic Settings Overview
New Features of IEEE Std Digitizing Waveform Recorders
 New Features of IEEE Std 1057-2007 Digitizing Waveform Recorders William B. Boyer 1, Thomas E. Linnenbrink 2, Jerome Blair 3, 1 Chair, Subcommittee on Digital Waveform Recorders Sandia National Laboratories
Spectrum analyzer for frequency bands of 8-12, and MHz
 EE389 Electronic Design Lab Project Report, EE Dept, IIT Bombay, November 2006 Spectrum analyzer for frequency bands of 8-12, 12-16 and 16-20 MHz Group No. D-13 Paras Choudhary (03d07012)
Synchronous Machines Study Material
 Synchronous machines: The machines generating alternating emf from the mechanical input are called alternators or synchronous generators. They are also known as AC generators. All modern power stations
CHAPTER 2 A SERIES PARALLEL RESONANT CONVERTER WITH OPEN LOOP CONTROL
 14 CHAPTER 2 A SERIES PARALLEL RESONANT CONVERTER WITH OPEN LOOP CONTROL 2.1 INTRODUCTION Power electronics devices have many advantages over the traditional power devices in many aspects such as converting
ECE 53A: Fundamentals of Electrical Engineering I
 ECE 53A: Fundamentals of Electrical Engineering I Laboratory Assignment #1: Instrument Operation, Basic Resistor Measurements and Kirchhoff s Laws Fall 2007 General Guidelines: - Record data and observations
SENSOR AND MEASUREMENT EXPERIMENTS
 SENSOR AND MEASUREMENT EXPERIMENTS Page: 1 Contents 1. Capacitive sensors 2. Temperature measurements 3. Signal processing and data analysis using LabVIEW 4. Load measurements 5. Noise and noise reduction
Q.1 a) Attempt any SIX of the following: 12M. (i) Give comparison between active transducer and passive transducer. Ans:- (Any Two) 1M each
 Attempt any SIX of the following: 12M. (i) Give comparison between active transducer and passive transducer. Ans:- (Any Two) 1M each") Page 1 of 26 Important Instructions to examiners: 1) The answers should be examined by key words and not as word-to-word as given in the Model answer scheme. 2) The model answer and the answer written
Page 1 of 26 Important Instructions to examiners: 1) The answers should be examined by key words and not as word-to-word as given in the Model answer scheme. 2) The model answer and the answer written
Hints. for making. Better. Spectrum Analyzer. Measurements. Application Note
 Hints for making Better Spectrum Analyzer Measurements Application Note 1286-1 The Heterodyne Spectrum Analyzer The spectrum analyzer, like an oscilloscope, is a basic tool used for observing signals.
Keysight Technologies Spectrum Analysis Basics. Application Note 150
 Keysight Technologies Spectrum Analysis Basics Application Note 150 2 Keysight Spectrum Analysis Basics Application Note 150 Keysight Technologies. Inc. dedicates this application note to Blake Peterson.
RECOMMENDATION ITU-R SM Method for measurements of radio noise
 Rec. ITU-R SM.1753 1 RECOMMENDATION ITU-R SM.1753 Method for measurements of radio noise (Question ITU-R 1/45) (2006) Scope For radio noise measurements there is a need to have a uniform, frequency-independent
Signal Processing for Digitizers
 Signal Processing for Digitizers Modular digitizers allow accurate, high resolution data acquisition that can be quickly transferred to a host computer. Signal processing functions, applied in the digitizer
LBI-30398N. MAINTENANCE MANUAL MHz PHASE LOCK LOOP EXCITER 19D423249G1 & G2 DESCRIPTION TABLE OF CONTENTS. Page. DESCRIPTION...
 MAINTENANCE MANUAL 138-174 MHz PHASE LOCK LOOP EXCITER 19D423249G1 & G2 LBI-30398N TABLE OF CONTENTS DESCRIPTION...Front Cover CIRCUIT ANALYSIS... 1 MODIFICATION INSTRUCTIONS... 4 PARTS LIST AND PRODUCTION
Question Bank SENSORS AND INSTRUMENTATION [EE-305/405]
![Question Bank SENSORS AND INSTRUMENTATION [EE-305/405]](/thumbs/95/124646158.jpg "Question Bank SENSORS AND INSTRUMENTATION [EE-305/405]") UNIT-1 1. Discuss liquid in glass thermometers? 2. Write a short note on strain gauges. 3. Mention the various temperature scales and relation between them. 4. An experiment is conducted to calibrate a
UNIT-1 1. Discuss liquid in glass thermometers? 2. Write a short note on strain gauges. 3. Mention the various temperature scales and relation between them. 4. An experiment is conducted to calibrate a
1. Explain how Doppler direction is identified with FMCW radar. Fig Block diagram of FM-CW radar. f b (up) = f r - f d. f b (down) = f r + f d
 = f r - f d. f b (down) = f r + f d") 1. Explain how Doppler direction is identified with FMCW radar. A block diagram illustrating the principle of the FM-CW radar is shown in Fig. 4.1.1 A portion of the transmitter signal acts as the reference
1. Explain how Doppler direction is identified with FMCW radar. A block diagram illustrating the principle of the FM-CW radar is shown in Fig. 4.1.1 A portion of the transmitter signal acts as the reference
Half-wave Rectifier AC Meters
 Note-4 1 Half-wave Rectifier AC Meters Disadvantages: 1. In negative half-cycle, reverse current flows through the circuit reduces average value of current meter reads lower than actual. 2. High peak inverse
332:223 Principles of Electrical Engineering I Laboratory Experiment #2 Title: Function Generators and Oscilloscopes Suggested Equipment:
 RUTGERS UNIVERSITY The State University of New Jersey School of Engineering Department Of Electrical and Computer Engineering 332:223 Principles of Electrical Engineering I Laboratory Experiment #2 Title:
Systematical measurement errors
 Systematical measurement errors Along the lines of the rule formulated by Schrödinger that a system can influenced even by observing, an EUT can be influenced by a normal measurements. If the measurement
B.Tech II Year II Semester (R13) Supplementary Examinations May/June 2017 ANALOG COMMUNICATION SYSTEMS (Electronics and Communication Engineering)
 Supplementary Examinations May/June 2017 ANALOG COMMUNICATION SYSTEMS (Electronics and Communication Engineering)") Code: 13A04404 R13 B.Tech II Year II Semester (R13) Supplementary Examinations May/June 2017 ANALOG COMMUNICATION SYSTEMS (Electronics and Communication Engineering) Time: 3 hours Max. Marks: 70 PART A
Code: 13A04404 R13 B.Tech II Year II Semester (R13) Supplementary Examinations May/June 2017 ANALOG COMMUNICATION SYSTEMS (Electronics and Communication Engineering) Time: 3 hours Max. Marks: 70 PART A
Time Matters How Power Meters Measure Fast Signals
 Time Matters How Power Meters Measure Fast Signals By Wolfgang Damm, Product Management Director, Wireless Telecom Group Power Measurements Modern wireless and cable transmission technologies, as well
Receiver Architecture
 Receiver Architecture Receiver basics Channel selection why not at RF? BPF first or LNA first? Direct digitization of RF signal Receiver architectures Sub-sampling receiver noise problem Heterodyne receiver
MAKING TRANSIENT ANTENNA MEASUREMENTS
 MAKING TRANSIENT ANTENNA MEASUREMENTS Roger Dygert, Steven R. Nichols MI Technologies, 1125 Satellite Boulevard, Suite 100 Suwanee, GA 30024-4629 ABSTRACT In addition to steady state performance, antennas
Tuned Radio Frequency Receiver (TRF) The most elementary receiver design, consisting of RF amplifier stages, detector and audio amplifier stages.
 The most elementary receiver design, consisting of RF amplifier stages, detector and audio amplifier stages.") Figure 3-1 Simple radio receiver block diagram. Tuned Radio Frequency Receiver (TRF) The most elementary receiver design, consisting of RF amplifier stages, detector and audio amplifier stages. Jeffrey
Figure 3-1 Simple radio receiver block diagram. Tuned Radio Frequency Receiver (TRF) The most elementary receiver design, consisting of RF amplifier stages, detector and audio amplifier stages. Jeffrey
Outline. Communications Engineering 1
 Outline Introduction Signal, random variable, random process and spectra Analog modulation Analog to digital conversion Digital transmission through baseband channels Signal space representation Optimal
ERICSSONZ LBI-30398P. MAINTENANCE MANUAL MHz PHASE LOCKED LOOP EXCITER 19D423249G1 & G2 DESCRIPTION TABLE OF CONTENTS
 MAINTENANCE MANUAL 138-174 MHz PHASE LOCKED LOOP EXCITER 19D423249G1 & G2 TABLE OF CONTENTS Page DESCRIPTION... Front Cover CIRCUIT ANALYSIS...1 MODIFICATION INSTRUCTIONS...4 PARTS LIST...5 PRODUCTION
Laboratory 3 (drawn from lab text by Alciatore)
") Laboratory 3 (drawn from lab text by Alciatore) The Oscilloscope Required Components: 1 10 resistor 2 100 resistors 2 lk resistors 1 2k resistor 2 4.7M resistors 1 0.F capacitor 1 0.1 F capacitor 1 1.0uF
Laboratory 3 (drawn from lab text by Alciatore) The Oscilloscope Required Components: 1 10 resistor 2 100 resistors 2 lk resistors 1 2k resistor 2 4.7M resistors 1 0.F capacitor 1 0.1 F capacitor 1 1.0uF
INDEX IEC:
 60050-300 IEC:2001 173 INDEX A absolute absolute error... 311-01-05 (absolute) frequency deviation... 314-08-07 accessory accessory (of a measuring instrument)... 312-03-01 accessory of limited interchangeability...
ME 365 EXPERIMENT 1 FAMILIARIZATION WITH COMMONLY USED INSTRUMENTATION
 Objectives: ME 365 EXPERIMENT 1 FAMILIARIZATION WITH COMMONLY USED INSTRUMENTATION The primary goal of this laboratory is to study the operation and limitations of several commonly used pieces of instrumentation:
Wireless Communication
 Equipment and Instruments Wireless Communication An oscilloscope, a signal generator, an LCR-meter, electronic components (see the table below), a container for components, and a Scotch tape. Component
Lecture 6. Angle Modulation and Demodulation
 Lecture 6 and Demodulation Agenda Introduction to and Demodulation Frequency and Phase Modulation Angle Demodulation FM Applications Introduction The other two parameters (frequency and phase) of the carrier
Summer 2015 Examination
 Summer 2015 Examination Subject Code: 17445 Model Answer Important Instructions to examiners: 1) The answers should be examined by key words and not as word-to-word as given in the model answer scheme.
The steeper the phase shift as a function of frequency φ(ω) the more stable the frequency of oscillation
 the more stable the frequency of oscillation") It should be noted that the frequency of oscillation ω o is determined by the phase characteristics of the feedback loop. the loop oscillates at the frequency for which the phase is zero The steeper the
It should be noted that the frequency of oscillation ω o is determined by the phase characteristics of the feedback loop. the loop oscillates at the frequency for which the phase is zero The steeper the
Amplitude Modulated Systems
 Amplitude Modulated Systems Communication is process of establishing connection between two points for information exchange. Channel refers to medium through which message travels e.g. wires, links, or
Test No. 1. Introduction to Scope Measurements. Report History. University of Applied Sciences Hamburg. Last chance!! EEL2 No 1
 University of Applied Sciences Hamburg Group No : DEPARTMENT OF INFORMATION ENGINEERING Laboratory for Instrumentation and Measurement L: in charge of the report Test No. Date: Assistant A2: Professor: