PLANET SURFACE REFLECTANCE PRODUCT
|
|
|
- Joseph Edwards
- 6 years ago
- Views:
Transcription


1 PLANET SURFACE REFLECTANCE PRODUCT FEBRUARY 2018 PLANET.COM VERSION 1.0
2 TABLE OF CONTENTS 3 Product Description 3 Atmospheric Correction Methodology 5 Product Limitations 6 Product Assessment 6 Conclusions 10 Contact 10 TABLES Table 1: SR product metadata keys and descriptions 3 Table 2: 6sv2.1 inputs to generate LUTs and value ranges for each input 5 FIGURES Figure 1: Planet SR product visual comparison 5 Figure 2: Planet SR product visual reference: Sacramento Valley 6 Figure 3: Planet SR NDVI and EVI atmospheric correction comparison 6 Figure 4: Planet SR product and Landsat 8 SR comparison 7 Figure 5: Planet and Landsat 8 crossover imagery comparison 7 Figure 6: Planet SR and Landsat 8 SR crossover comparison: NDVI and EVI 8 Figure 7: Planet and Landsat 8 imagery spectra comparison 8 Figure 8: Planet and Landsat 8 imagery spectra comparison: Corrected reflectance 9 Disclaimer This document is provided without cost and for informational purposes only. The document is provided on an as-is basis only. Planet Labs does not make any warranties, express, implied or otherwise, regarding the effectiveness, accuracy, or completeness of the document. Planet Labs shall have no liability or responsibility for errors or omissions resulting from the use of the document, or any decisions made by company in reliance on or use of the document. Planet Labs reserves the right to make changes to or completely discontinue this document without notice Planet Labs, Inc. All rights reserved. Page 2
3 ALAN COLLISON & NICK WILSON The Planet Surface Reflectance (SR) Product is derived from the standard Planet Analytic Product (Radiance) and is processed to top of atmosphere reflectance and then atmospherically corrected to bottom of atmosphere reflectance. This product ensures consistency across localized atmospheric conditions, minimizing uncertainty in spectral response across time and location. Surface Reflectance is available for all 4-band orthorectified scenes produced by radiometrically calibrated sunsynchronous orbit Dove satellites. The Surface Reflectance product is available in the API as the analytic_sr asset under the PsScene4Band Itemtype. PRODUCT DESCRIPTION The SR product is provided as a 16-bit GeoTIFF image with reflectance values scaled by 10,000. Associated metadata describing inputs to the correction is included in a GeoTIFF TIFFTAG_IMAGEDESCRIPTION metadata header as a JSON encoded string. The following table lists the values stored in the GeoTIFF header: Table 1: SR product metadata keys and descriptions SR GeoTIFF Metadata Key Description Example aerosol_model 6S aerosol model used continental aot_coverage aot_method aot_mean_quality Percentage overlap between MODIS data and the scene being corrected Method used to derive AOD value(s) for an image. Currently only fixed is used, indicating a single value for the entire image Average MODIS AOD quality value for the overlapping NRT data in the range This is set to 127 when no data is available fixed 1.0 aot_source Source of the AOD data used for the correction mod09cma_nrt aot_std aot_status aot_used atmospheric_correction_ algorithm Standard deviation of the averaged MODIS AOD data A text string indicating state of AOD retrieval. If no data exists from the source used, a default value is used Aerosol optical depth used for the correction The algorithm used to generate LUTs Missing Data - Using Default AOT 6SV2.1 atmospheric_model Custom model or 6S atmospheric model used water_vapor_and_ ozone luts_version Version of the LUTs used for the correction 3 ozone_coverage ozone_mean_quality ozone_method Percentage overlap between MODIS data and the scene being corrected Average MODIS ozone quality value for the overlapping NRT data. This will always be 255 if data is present Method used to derive ozone value(s) for an image. Currently only 'fixed' is used, indicating a single value for the entire image fixed ozone_source Source of the ozone data used for the correction mod09cmg_nrt Page 3
4 SR GeoTIFF Metadata Key Description Example ozone_status A text string indicating state of ozone retrieval. If no ozone data is available for the scene being corrected, the corrections falls back to a 6SV built-in atmospheric model Data Found ozone_std Standard deviation of the averaged MODIS ozone data. 0 ozone_used Ozone concentration used for the correction, in cm-atm satellite_azimuth_angle Always defined to be 0.0 degrees and solar zenith angle measured relative to it 0.0 satellite_zenith_angle Satellite zenith angle, fixed to nadir pointing 0.0 solar_azimuth_angle Sun azimuth angle relative to satellite, in degrees solar_zenith_angle Solar zenith angle in degrees sr_version Version of the correction applied. 1.0 water_vapor_coverage water_vapor_mean_quality water_vapor_method Percentage overlap between MODIS data and the scene being corrected Average MODIS ozone quality value for the overlapping NRT data in the range This is set to 127 when no data is available Method used to derive water vapor value(s) for an image. Currently only fixed is used, indicating a single value for the entire image fixed water_vapor_source Source of the water vapor data used for the correction mod09cma_nrt water_vapor_status A text string indicating state of water vapor retrieval. If no water vapor data is available for the scene being corrected, the corrections falls back to a 6SV built-in atmospheric model Data Found water_vapor_std Standard deviation of the averaged MODIS AOD data water_vapor_used Water vapor concentration used for the correction in g/cm^ Example of the metadata JSON: { atmospheric_correction : { aerosol_model : continental, aot_coverage : , aot_mean_quality : , aot_method : fixed, aot_source : mod09cma_nrt, aot_status : Data Found, aot_std : , aot_used : , atmospheric_correction_algorithm : 6Sv2.1, atmospheric_model : water_vapor_and_ozone, luts_version : 3, ozone_coverage : , ozone_mean_quality : 255.0, ozone_method : fixed, ozone_source : mod09cmg_nrt, ozone_status : Data Found, ozone_std : 0.0, ozone_used : , satellite_azimuth_angle : 0.0, satellite_zenith_angle : 0.0, Page 4
5 } } solar_azimuth_angle : , solar_zenith_angle : , sr_version : 1.0, water_vapor_coverage : , water_vapor_mean_quality : , water_vapor_method : fixed, water_vapor_source : mod09cma_nrt, water_vapor_status : Data Found, water_vapor_std : , water_vapor_used : ATMOSPHERIC CORRECTION METHODOLOGY Surface reflectance is determined from top of atmosphere (TOA) reflectance, calculated using coefficients supplied with the Planet Radiance product. Calculating SR is a pixel-by-pixel operation using lookup tables (LUTs) that have been generated using the 6SV2.1 radiative transfer code1. The LUTs map TOA reflectance to bottom of atmosphere (BOA) reflectance for all combinations of selected ranges of physical conditions relevant for Planet imagery. A separate set of LUTs are used for each satellite sensor type using its individual spectral response. The following table lists the inputs to the 6s atmospheric model and the ranges of values used: Table 2: 6sv2.1 inputs to generate LUTs and value ranges for each input LUT Inputs Input Values Notes Atmospheric Conditions H2O, O3, pressure and temperature profile Water vapor and ozone concentrations or one of the following built-in atmospheric models: midlatitude_summer, midlatitude_ winter, tropical, subarctic_ summer, subarctic_winter Internal models provided by 6S Aerosol type continental Internal model provided by 6S Aerosol optical depth (AOD) 0.02, 0.04, 0.06, 0.07, 0.08, 0.09, 0.1, 0.12, 0.14, 0.16, 0.18, 0.2, 0.22, 0.25, 0.3, 0.35, 0.4, 0.55, 0.75 Geometry Solar Zenith Angle 10, 20, 30, 40, 50, 60, 70, 80 Zenith angle for the center of the scene footprint is used Satellite Zenith Angle nadir pointing (0) Azimuth angle difference 0-180, 10 degree increments Difference in azimuth angle - between sun and satellite Target Elevation sea level Surface Conditions Reflectance Type Lambertian Corrections for BDRF effects would be applied to the SR product Reflectance Values 0-1.0, increments of Spectral Conditions Bands VNIR B: nm G: nm R: nm NIR: nm Spectral Response Defined for each sensor type Every Planet satellite with the same sensor type uses the same set of LUTs 1 Page 5

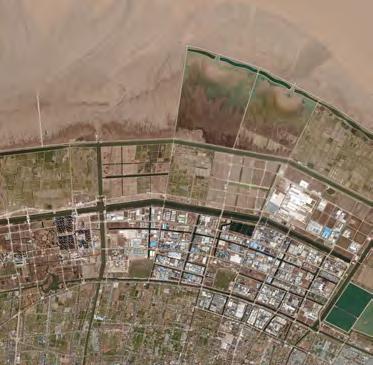
6 When converting an image to surface reflectance, water vapor and ozone inputs are retrieved from MODIS near-real-time (NRT) 2 data for same day collects. In the event that there is no overlapping data, a 6S atmospheric model is chosen based on the local latitude and time of year of the image acquisition following the scheme used by the FLAASH atmospheric correction tool 3. The AOD input for a scene is determined from MODIS NRT 4 aerosol data, finding an overlapping region and using the average of the AOD values within that region. When looking up reflectance values from the LUTs, tables with the closest matching values of water vapor and ozone concentrations are used. Tables built with the two closest solar zenith angles are interpolated between and a linear interpolation is performed for AOD and TOA reflectance. Since Planet satellites are nadir pointing, zenith angle is fixed at 0 degrees. PRODUCT LIMITATIONS The Planet Surface Reflectance V1 product corrects for the effects of the Earth s atmosphere, accounting for the molecular composition and variation with altitude along with aerosol content. Combining the use of standard atmospheric models with the use of MODIS water vapor, ozone and aerosol data, this provides reliable and consistent surface reflectance scenes over Planet s varied constellation of satellites as part of our normal, on-demand data pipeline. However, there are some limitations to the corrections performed: In some instances there is no MODIS data overlapping a Planet scene or the area nearby. In those cases, AOD is set to a value of which corresponds to a clear sky visibility of 23km, the aot_quality is set to the MODIS no data value of 127, and aot_status is set to Missing Data - Using Default AOT. If there is no overlapping water vapor or ozone data, the correction falls back to a predefined 6SV internal model. The effects of haze and thin cirrus clouds are not corrected for. Aerosol type is limited to a single, global model. All scenes are assumed to be at sea level and the surfaces are assumed to exhibit Lambertian scattering - no BRDF effects are accounted for. Stray light and adjacency effects are not corrected for. PRODUCT ASSESSMENT With Planet s constellation of satellites, farming regions can be revisited on a nearly daily basis enabling real time monitoring of crop health and insights on day to day changes in the fields. Combined with the physics-based atmospheric correction methodology used to produce the Planet SR product, crops can be monitored with a high degree of precision. The following section details an assessment of the SR Product for temporal monitoring of crops and an assessment of the correction on derived indices and band reflectances as compared to the Landsat 8 SR product and vegetation spectra. In Figure 1, two adjacent scenes of farmland in the Sacramento Valley of California show the visual differences between a TOA reflectance image (bottom) and the atmospherically corrected SR product (top). Figure 1: A visual comparison of the SR product (top) and a TOA Reflectance image (bottom) in adjacent scenes captured by the same satellite. 2 Need links to water vapor and ozone data downloads 3 Based on scheme described at Page 6


 of this field are provided in Figure 3 for the")


7 By selecting an individual field and comparing the changes in the field through time, the stability of the SR product can be assessed. Figure 2 shows the field selected from a farmland area during the summer months in the Sacramento Valley of California. The thumbnails show the changes in the field for a one month interval, starting from harvesting of a mature crop at the end of June through replanting and growing to maturity again at the end of. Figure 2: Visual changes in a field over the summer months in the Sacramento Valley using the Planet SR Product June June A time series of the derived vegetation indices (NDVI and EVI) of this field are provided in Figure 3 for the summer months of Image collections were made by multiple Planet satellites and are displayed by capture date. Results for both TOA and surface reflectance are shown and highlight the significant effect the atmosphere has, even under clear sky conditions. Spikes in the curves generally represent clouds in or near the scene which cause additional atmospheric scattering that is not corrected for. The curves also illustrate the usefulness of daily collects where sharp drops in index value are evident during harvesting time with some collects captured in the middle of the process. Figure 3: Time series of NDVI and EVI of a field in the Sacramento Valley showing the effect of atmospheric correction as compared to using derived indices without correction. NDVI EVI Page 7


8 Planet surface reflectance measurements agree with other established SR products as shown in Figure 4. The figure displays the same Planet SR time series as in Figure 3, but adds a comparison with derived vegetation indices from the Landsat 8 SR product. There is good agreement between derived indices from the Planet SR product and the Landsat 8 SR product and illustrates the advantages of Planet s high frequency collection over the Landsat 8 revisit time of 16 days. Figure 4: Time series comparing NDVI and EVI derived from the Planet SR product and the Landsat 8 SR production. Note the good agreement in absolute values and frequent revisit of the Planet Dove satellites. NDVI EVI In Figure 5 below, a second field of the Sacramento Valley is shown during the 2017 growing season, with collects extending from early May to the start of August. Figure 5: A second field in the Sacramento Valley showing visual changes in the summer months of The thumbnails show the closest crossover images to Landsat 8 collects of this area May May June June August Page 8
9 In Figure 6 below, time series plots of NDVI and EVI from this field again show good agreement with Landsat 8 measurements. Absolute differences between the derived indices are likely explained by different spectral responses between the Dove and Landsat 8 sensors. In this comparison, Spectral Band Adjustment Factors (SBAF) are not applied to account for differences between sensors. Values are displayed as if the datasets were to be used interchangeably. Figure 6: Time series comparing NDVI and EVI from the Planet SR product and the Landsat 8 SR product. NDVI EVI In Figure 7 below, a comparison is provided showing average per-band surface reflectances for a field in the Sacramento Valley at different points of the growing season. Each plot is a single Planet scene and a corresponding Landsat 8 scene for the closest crossover date, all within one day of the Planet collect. As can be seen, the general shape of both the Planet and Landsat 8 spectra agree as the surface cover changes over the summer. Figure 7: A comparison of Planet and Landsat 8 spectra for a field in the Sacramento Valley for the summer of Corresponding colors are for scenes collected near the same time. Each Landsat 8 curve is labeled with the day number for when the scene was acquired. The Planet thumbnail is provided as a visual reference. Reflectance Reflectance Reflectance Wavelength (nm) Wavelength (nm) Page 9
10 A more direct comparison of surface reflectance requires adjusting for differences in sensor response. Figure 8 shows Planet and Landsat 8 spectra for a single collect of the field when the crop is near peak. The Planet and Landsat images were taken on the same cloud-free day and the Planet reflectance values have been corrected relative to Landsat using SBAF multipliers calculated using the spectra for grass taken from the JPL ASTER Spectral Library5. The Planet surface reflectance shape shows good agreement with both Landsat 8 and the reference spectrum with differences in NDVI and EVI of approximately 6% and 5%, respectively. Figure 8: A comparison of Planet and Landsat 8 spectra near crop peak over a single field. Reflectance values corrected relative to Landsat by applying SBAF multipliers calculated using grass spectra taken from the JPL ASTER Spectral Library. Reflectance Wavelength (nm) CONCLUSIONS Evaluation of the Planet Surface Reflectance product presented in this white paper shows that it is consistent with other industry standard surface reflectance datasets. Results demonstrate that the absolute SR values are closely aligned between coincident image products with Landsat 8, and temporal analysis of derived vegetation indices show the datasets are highly correlated. This analysis supports the use of the Planet SR product where accurate and consistent vegetation indices are required. Planet s unique global scale high cadence imagery now paired with accurate surface reflectance presents a solution to a wide range of monitoring applications. 5 GET IN TOUCH We re Here to Help Get answers to technical questions about Planet products support@planet.com Contact Us planet.com/contact-sales Start Exploring You can explore Planet s Surface Reflectance product at api.planet.com
Evaluation of FLAASH atmospheric correction. Note. Note no SAMBA/10/12. Authors. Øystein Rudjord and Øivind Due Trier
 Evaluation of FLAASH atmospheric correction Note Note no Authors SAMBA/10/12 Øystein Rudjord and Øivind Due Trier Date 16 February 2012 Norsk Regnesentral Norsk Regnesentral (Norwegian Computing Center,
Inter comparison of Terra and Aqua MODIS Reflective Solar Bands Using Suomi NPP VIIRS
 Inter comparison of Terra and Aqua Reflective Solar Bands Using Suomi NPP VIIRS Slawomir Blonski, * Changyong Cao, Sirish Uprety, ** and Xi Shao * NOAA NESDIS Center for Satellite Applications and Research
BV NNET User manual. V0.2 (Draft) Rémi Lecerf, Marie Weiss
 Rémi Lecerf, Marie Weiss") BV NNET User manual V0.2 (Draft) Rémi Lecerf, Marie Weiss 1. Introduction... 2 2. Installation... 2 3. Prerequisites... 2 3.1. Image file format... 2 3.2. Retrieving atmospheric data... 3 3.2.1. Using
BV NNET User manual V0.2 (Draft) Rémi Lecerf, Marie Weiss 1. Introduction... 2 2. Installation... 2 3. Prerequisites... 2 3.1. Image file format... 2 3.2. Retrieving atmospheric data... 3 3.2.1. Using
PLANET IMAGERY PRODUCT SPECIFICATIONS PLANET.COM
 PLANET IMAGERY PRODUCT SPECIFICATIONS SUPPORT@PLANET.COM PLANET.COM LAST UPDATED JANUARY 2018 TABLE OF CONTENTS LIST OF FIGURES 3 LIST OF TABLES 4 GLOSSARY 5 1. OVERVIEW OF DOCUMENT 7 1.1 Company Overview
Planet Labs Inc 2017 Page 2
 SKYSAT IMAGERY PRODUCT SPECIFICATION: ORTHO SCENE LAST UPDATED JUNE 2017 SALES@PLANET.COM PLANET.COM Disclaimer This document is designed as a general guideline for customers interested in acquiring Planet
Lecture 6: Multispectral Earth Resource Satellites. The University at Albany Fall 2018 Geography and Planning
 Lecture 6: Multispectral Earth Resource Satellites The University at Albany Fall 2018 Geography and Planning Outline SPOT program and other moderate resolution systems High resolution satellite systems
Application of GIS to Fast Track Planning and Monitoring of Development Agenda
 Application of GIS to Fast Track Planning and Monitoring of Development Agenda Radiometric, Atmospheric & Geometric Preprocessing of Optical Remote Sensing 13 17 June 2018 Outline 1. Why pre-process remotely
University of Texas at San Antonio EES 5053 Term Project CORRELATION BETWEEN NDVI AND SURFACE TEMPERATURES USING LANDSAT ETM + IMAGERY NEWFEL MAZARI
 University of Texas at San Antonio EES 5053 Term Project CORRELATION BETWEEN NDVI AND SURFACE TEMPERATURES USING LANDSAT ETM + IMAGERY NEWFEL MAZARI Introduction and Objectives The present study is a correlation
Railroad Valley Playa for use in vicarious calibration of large footprint sensors
 Railroad Valley Playa for use in vicarious calibration of large footprint sensors K. Thome, J. Czapla-Myers, S. Biggar Remote Sensing Group Optical Sciences Center University of Arizona Introduction P
I nnovative I maging & R esearch I 2. Assessing and Removing AWiFS Systematic Geometric and Atmospheric Effects to Improve Land Cover Change Detection
 I nnovative I maging & esearch Assessing and emoving AWiFS Systematic Geometric and Atmospheric Effects to Improve Land Cover Change Detection Mary Pagnutti obert E. yan Spring LCLUC Science Team Meeting
PLANET IMAGERY PRODUCT SPECIFICATION: PLANETSCOPE & RAPIDEYE
 PLANET IMAGERY PRODUCT SPECIFICATION: PLANETSCOPE & RAPIDEYE LAST UPDATED OCTOBER 2016 SALES@PLANET.COM PLANET.COM Table of Contents LIST OF FIGURES 3 LIST OF TABLES 3 GLOSSARY 5 1. OVERVIEW OF DOCUMENT
Sentinel-2 Products and Algorithms
 Sentinel-2 Products and Algorithms Ferran Gascon (Sentinel-2 Data Quality Manager) Workshop Preparations for Sentinel 2 in Europe, Oslo 26 November 2014 Sentinel-2 Mission Mission Overview Products and
Satellite data processing and analysis: Examples and practical considerations
 Satellite data processing and analysis: Examples and practical considerations Dániel Kristóf Ottó Petrik, Róbert Pataki, András Kolesár International LCLUC Regional Science Meeting in Central Europe Sopron,
PLANET IMAGERY PRODUCT SPECIFICATION: PLANETSCOPE & RAPIDEYE
 PLANET IMAGERY PRODUCT SPECIFICATION: PLANETSCOPE & RAPIDEYE LAST UPDATED FEBRUARY 2017 SALES@PLANET.COM PLANET.COM Table of Contents LIST OF FIGURES 3 LIST OF TABLES 3 GLOSSARY 5 1. OVERVIEW OF DOCUMENT
Ground Truth for Calibrating Optical Imagery to Reflectance
 Visual Information Solutions Ground Truth for Calibrating Optical Imagery to Reflectance The by: Thomas Harris Whitepaper Introduction: Atmospheric Effects on Optical Imagery Remote sensing of the Earth
Development of normalized vegetation, soil and water indices derived from satellite remote sensing data
 Development of normalized vegetation, soil and water indices derived from satellite remote sensing data Takeuchi, W. & Yasuoka, Y. IIS/UT, Japan E-mail: wataru@iis.u-tokyo.ac.jp Nov. 25th, 2004 ACRS2004
A Comparison of DG AComp, FLAASH and QUAC Atmospheric Compensation Algorithms Using WorldView-2 Imagery
 A Comparison of DG AComp, FLAASH and QUAC Atmospheric Compensation Algorithms Using WorldView-2 Imagery Michael J. Smith Department of Civil Engineering Master s Report University of Colorado Spring 2015
ENMAP RADIOMETRIC INFLIGHT CALIBRATION, POST-LAUNCH PRODUCT VALIDATION, AND INSTRUMENT CHARACTERIZATION ACTIVITIES
 ENMAP RADIOMETRIC INFLIGHT CALIBRATION, POST-LAUNCH PRODUCT VALIDATION, AND INSTRUMENT CHARACTERIZATION ACTIVITIES A. Hollstein1, C. Rogass1, K. Segl1, L. Guanter1, M. Bachmann2, T. Storch2, R. Müller2,
- Regridding / Projection - Compositing for Sentinel-2 & Landsat 8 merged products
 - Regridding / Projection - Compositing for Sentinel-2 & Landsat 8 merged products Roy, D.P., Kovalskyy, V., Zhang, H.K., Yan, L., Kumar. S. Geospatial Science Center of Excellence South Dakota State University
Inter-Calibration of the RapidEye Sensors with Landsat 8, Sentinel and SPOT
 Inter-Calibration of the RapidEye Sensors with Landsat 8, Sentinel and SPOT Dr. Andreas Brunn, Dr. Horst Weichelt, Dr. Rene Griesbach, Dr. Pablo Rosso Content About Planet Project Context (Purpose and
ATCOR Workflow for IMAGINE 2018
 ATCOR Workflow for IMAGINE 2018 Version 1.1 User Manual Mai 2018 ATCOR Workflow for IMAGINE Page 2/73 The ATCOR trademark is owned by DLR German Aerospace Center D-82234 Wessling, Germany URL: www.dlr.de
Pléiades imagery for coastal and inland water applications
 Pléiades imagery for coastal and inland water applications Pléiades 2014-09-08 Quinten Vanhellemont & PONDER project 2017-10-20 dredging ship PONDER SR/00/325 «Ocean colour remote sensing» Remote sensing
Introduction to Remote Sensing Fundamentals of Satellite Remote Sensing. Mads Olander Rasmussen
 Introduction to Remote Sensing Fundamentals of Satellite Remote Sensing Mads Olander Rasmussen (mora@dhi-gras.com) 01. Introduction to Remote Sensing DHI What is remote sensing? the art, science, and technology
Remote Sensing for Rangeland Applications
 Remote Sensing for Rangeland Applications Jay Angerer Ecological Training June 16, 2012 Remote Sensing The term "remote sensing," first used in the United States in the 1950s by Ms. Evelyn Pruitt of the
NORMALIZING ASTER DATA USING MODIS PRODUCTS FOR LAND COVER CLASSIFICATION
 NORMALIZING ASTER DATA USING MODIS PRODUCTS FOR LAND COVER CLASSIFICATION F. Gao a, b, *, J. G. Masek a a Biospheric Sciences Branch, NASA Goddard Space Flight Center, Greenbelt, MD 20771, USA b Earth
Using Ground Targets for Sensor On orbit Calibration Support
 EOS Using Ground Targets for Sensor On orbit Calibration Support X. Xiong, A. Angal, A. Wu, and T. Choi MODIS Characterization Support Team (MCST), NASA/GSFC G. Chander SGT/USGS EROS CEOS Libya 4 Workshop,
35017 Las Palmas de Gran Canaria, Spain Santa Cruz de Tenerife, Spain ABSTRACT
 Atmospheric correction models for high resolution WorldView-2 multispectral imagery: A case study in Canary Islands, Spain. J. Martin* a F. Eugenio a, J. Marcello a, A. Medina a, Juan A. Bermejo b a Institute
Basic Hyperspectral Analysis Tutorial
 Basic Hyperspectral Analysis Tutorial This tutorial introduces you to visualization and interactive analysis tools for working with hyperspectral data. In this tutorial, you will: Analyze spectral profiles
ATCOR Workflow for IMAGINE 2016
 ATCOR Workflow for IMAGINE 2016 Version 1.0 Step-by-Step Guide January 2017 ATCOR Workflow for IMAGINE Page 2/24 The ATCOR trademark is owned by DLR German Aerospace Center D-82234 Wessling, Germany URL:
Radiometric Use of WorldView-3 Imagery. Technical Note. 1 WorldView-3 Instrument. 1.1 WorldView-3 Relative Radiance Response
 Radiometric Use of WorldView-3 Imagery Technical Note Date: 2016-02-22 Prepared by: Michele Kuester This technical note discusses the radiometric use of WorldView-3 imagery. The first two sections briefly
On the use of water color missions for lakes in 2021
 Lakes and Climate: The Role of Remote Sensing June 01-02, 2017 On the use of water color missions for lakes in 2021 Cédric G. Fichot Department of Earth and Environment 1 Overview 1. Past and still-ongoing
29 th Annual Louisiana RS/GIS Workshop April 23, 2013 Cajundome Convention Center Lafayette, Louisiana
 Landsat Data Continuity Mission 29 th Annual Louisiana RS/GIS Workshop April 23, 2013 Cajundome Convention Center Lafayette, Louisiana http://landsat.usgs.gov/index.php# Landsat 5 Sets Guinness World Record
3/31/03. ESM 266: Introduction 1. Observations from space. Remote Sensing: The Major Source for Large-Scale Environmental Information
 Remote Sensing: The Major Source for Large-Scale Environmental Information Jeff Dozier Observations from space Sun-synchronous polar orbits Global coverage, fixed crossing, repeat sampling Typical altitude
Chapter 5. Preprocessing in remote sensing
 Chapter 5. Preprocessing in remote sensing 5.1 Introduction Remote sensing images from spaceborne sensors with resolutions from 1 km to < 1 m become more and more available at reasonable costs. For some
Sensor resolutions from space: the tension between temporal, spectral, spatial and swath. David Bruce UniSA and ISU
 Sensor resolutions from space: the tension between temporal, spectral, spatial and swath David Bruce UniSA and ISU 1 Presentation aims 1. Briefly summarize the different types of satellite image resolutions
Satellite Imagery and Remote Sensing. DeeDee Whitaker SW Guilford High EES & Chemistry
 Satellite Imagery and Remote Sensing DeeDee Whitaker SW Guilford High EES & Chemistry whitakd@gcsnc.com Outline What is remote sensing? How does remote sensing work? What role does the electromagnetic
SEN3APP Stakeholder Workshop, Helsinki Yrjö Rauste/VTT Kaj Andersson/VTT Eija Parmes/VTT
 Optical Products from Sentinel-2 and Suomi- NPP/VIIRS SEN3APP Stakeholder Workshop, Helsinki 19.11.2015 Yrjö Rauste/VTT Kaj Andersson/VTT Eija Parmes/VTT Structure of Presentation High-resolution data
GROßFLÄCHIGE UND HOCHFREQUENTE BEOBACHTUNG VON AGRARFLÄCHEN DURCH OPTISCHE SATELLITEN (RAPIDEYE, LANDSAT 8, SENTINEL-2)
") GROßFLÄCHIGE UND HOCHFREQUENTE BEOBACHTUNG VON AGRARFLÄCHEN DURCH OPTISCHE SATELLITEN (RAPIDEYE, LANDSAT 8, SENTINEL-2) Karsten Frotscher Produktmanager Landwirtschaft Slide 1 A Couple Of Words About The
GROßFLÄCHIGE UND HOCHFREQUENTE BEOBACHTUNG VON AGRARFLÄCHEN DURCH OPTISCHE SATELLITEN (RAPIDEYE, LANDSAT 8, SENTINEL-2) Karsten Frotscher Produktmanager Landwirtschaft Slide 1 A Couple Of Words About The
COMPATIBILITY AND INTEGRATION OF NDVI DATA OBTAINED FROM AVHRR/NOAA AND SEVIRI/MSG SENSORS
 COMPATIBILITY AND INTEGRATION OF NDVI DATA OBTAINED FROM AVHRR/NOAA AND SEVIRI/MSG SENSORS Gabriele Poli, Giulia Adembri, Maurizio Tommasini, Monica Gherardelli Department of Electronics and Telecommunication
1. What values did you use for bands 2, 3 & 4? Populate the table below. Compile the relevant data for the additional bands in the data below:
 Graham Emde GEOG3200: Remote Sensing Lab # 3: Atmospheric Correction Introduction: This lab teachs how to use INDRISI to correct for atmospheric haze in remotely sensed imagery. There are three models
DESIS Applications & Processing Extracted from Teledyne & DLR Presentations to JACIE April 14, Ray Perkins, Teledyne Brown Engineering
 DESIS Applications & Processing Extracted from Teledyne & DLR Presentations to JACIE April 14, 2016 Ray Perkins, Teledyne Brown Engineering 1 Presentation Agenda Imaging Spectroscopy Applications of DESIS
OPAL Optical Profiling of the Atmospheric Limb
 OPAL Optical Profiling of the Atmospheric Limb Alan Marchant Chad Fish Erik Stromberg Charles Swenson Jim Peterson OPAL STEADE Mission Storm Time Energy & Dynamics Explorers NASA Mission of Opportunity
High Latitude Drone Ecology Network Multispectral Flight Protocol and Guidance Document
 High Latitude Drone Ecology Network Multispectral Flight Protocol and Guidance Document By Jakob Assmann (j.assmann@ed.ac.uk), Jeff Kerby (jtkerb@gmail.com) and Isla Myers-Smith The University of Edinburgh,
GIS Data Collection. Remote Sensing
 GIS Data Collection Remote Sensing Data Collection Remote sensing Introduction Concepts Spectral signatures Resolutions: spectral, spatial, temporal Digital image processing (classification) Other systems
MERIS instrument. Muriel Simon, Serco c/o ESA
 MERIS instrument Muriel Simon, Serco c/o ESA Workshop on Sustainable Development in Mountain Areas of Andean Countries Mendoza, Argentina, 26-30 November 2007 ENVISAT MISSION 2 Mission Chlorophyll case
From Proba-V to Proba-MVA
 From Proba-V to Proba-MVA Fabrizio Niro ESA Sensor Performances Products and Algorithm (SPPA) ESA UNCLASSIFIED - For Official Use Proba-V extension in the Copernicus era Proba-V was designed with the main
LANDSAT 8 Level 1 Product Performance
 Réf: IDEAS-TN-10-CyclicReport LANDSAT 8 Level 1 Product Performance Cyclic Report Month/Year: May 2015 Date: 25/05/2015 Issue/Rev:1/0 1. Scope of this document On May 30, 2013, data from the Landsat 8
How to Access Imagery and Carry Out Remote Sensing Analysis Using Landsat Data in a Browser
 How to Access Imagery and Carry Out Remote Sensing Analysis Using Landsat Data in a Browser Including Introduction to Remote Sensing Concepts Based on: igett Remote Sensing Concept Modules and GeoTech
Multilook scene classification with spectral imagery
 Multilook scene classification with spectral imagery Richard C. Olsen a*, Brandt Tso b a Physics Department, Naval Postgraduate School, Monterey, CA, 93943, USA b Department of Resource Management, National
GEOSS Americas/Caribbean Remote Sensing Workshop November Lab 2 Investigating Cloud Phase, NDVI, Ocean Color and Sea Surface Temperatures
 GEOSS Americas/Caribbean Remote Sensing Workshop 26-30 November 2007 Lab 2 Investigating Cloud Phase, NDVI, Ocean Color and Sea Surface Temperatures Kathleen Strabala kathy.strabala@ssec.wisc.edu Table:
AVHRR 10-day Mosaic Composite Image Data Sets for Asian Region
 AVHRR 10-day Mosaic Composite Image Data Sets for Asian Region Ryuzo Yokoyama *, Liping Lei **, Ts. Purevdorj ** * Asian Center for Research on Remote Sensing (ACRoRS),Asian Institute of Technology P.
Two-linear-polarization measurement of O 2 A band with TANSO-FTS onboard GOSAT
 Remote sensing in the O 2 A band Two-linear-polarization measurement of O 2 A band with TANSO-FTS onboard GOSAT July 7, 2016, De Bilt Akihiko Kuze, Hiroshi Suto, Kei Shiomi, Nobuhiro Kikuchi, Makiko Hashimoto
PLANET: IMAGING THE EARTH EVERY DAY
 PLANET: IMAGING THE EARTH EVERY DAY Benjamin Trigona-Harany Mailiao Refinery, Taiwan May 31, 2016 To image the whole world every day, making change visible, accessible and actionable. HONG KONG January
Characterization of the atmospheric aerosols and the surface radiometric properties in the AGRISAR Campaign
 Characterization of the atmospheric aerosols and the surface radiometric properties in the AGRISAR Campaign V. Estellés Solar Radiation Unit Universitat de València T. Ruhtz, P. Zieger, S. Stapelberg Institute
Status of MODIS, VIIRS, and OLI Sensors
 Status of MODIS, VIIRS, and OLI Sensors Xiaoxiong (Jack) Xiong, Jim Butler, and Brian Markham Code 618.0 NASA/GSFC, Greenbelt, MD 20771, USA Acknowledgements: NASA MODIS Characterization Support Team (MCST)
Feedback on Level-1 data from CCI projects
 Feedback on Level-1 data from CCI projects R. Hollmann, Cloud_cci Background Following this years CMUG meeting & Science Leader discussion on Level 1 CCI projects ingest a lot of level 1 satellite data
Atmospheric Correction (including ATCOR)
") Technical Specifications Atmospheric Correction (including ATCOR) The data obtained by optical satellite sensors with high spatial resolution has become an invaluable tool for many groups interested in
Technical Specifications Atmospheric Correction (including ATCOR) The data obtained by optical satellite sensors with high spatial resolution has become an invaluable tool for many groups interested in
European Space Imaging. Your Partner for Very High-Resolution Satellite Imagery GEOGRAPHIC
 European Space Imaging Your Partner for Very High-Resolution Satellite Imagery XVII International User Conference of GeoInformation Systems & Remote Sensing European Space Imaging Your Partner for Very
NASA Missions and Products: Update. Garik Gutman, LCLUC Program Manager NASA Headquarters Washington, DC
 NASA Missions and Products: Update Garik Gutman, LCLUC Program Manager NASA Headquarters Washington, DC 1 JPSS-2 (NOAA) SLI-TBD Formulation in 2015 RBI OMPS-Limb [[TSIS-2]] [[TCTE]] Land Monitoring at
IKONOS High Resolution Multispectral Scanner Sensor Characteristics
 High Spatial Resolution and Hyperspectral Scanners IKONOS High Resolution Multispectral Scanner Sensor Characteristics Launch Date View Angle Orbit 24 September 1999 Vandenberg Air Force Base, California,
Observing Nightlights from Space with TEMPO James L. Carr 1,Xiong Liu 2, Brian D. Baker 3 and Kelly Chance 2
 Observing Nightlights from Space with TEMPO James L. Carr 1,Xiong Liu 2, Brian D. Baker 3 and Kelly Chance 2 September 27, 2016 1 Carr Astronautics Corp., Greenbelt, MD, USA jcarr@carrastro.com 2 Harvard-Smithsonian
Airborne hyperspectral data over Chikusei
 SPACE APPLICATION LABORATORY, THE UNIVERSITY OF TOKYO Airborne hyperspectral data over Chikusei Naoto Yokoya and Akira Iwasaki E-mail: {yokoya, aiwasaki}@sal.rcast.u-tokyo.ac.jp May 27, 2016 ABSTRACT Airborne
Impact toolbox. ZIP/DN to TOA reflectance. Principles and tutorial
 Impact toolbox ZIP/DN to TOA reflectance Principles and tutorial ZIP/DN to TOA reflectance principles RapidEye, Landsat and Sentinel 2 are distributed by their owner in a specific format. The file itself
See next page for full paper.
 Copyright 2018 Society of Photo-Optical Instrumentation Engineers (SPIE). One print or electronic copy may be made for personal use only. Systematic reproduction and distribution, duplication of any material
A broad survey of remote sensing applications for many environmental disciplines
 1 2 3 4 A broad survey of remote sensing applications for many environmental disciplines 5 6 7 8 9 10 1. First definition is very general and applies to many types of remote sensing. You use your eyes
USING THE LUNAR AUREOLE DERIVED FROM ALL-SKY CAMERAS FOR THE RETRIEVAL OF AEROSOL MICROPHYSICAL PROPERTIES
 USING THE LUNAR AUREOLE DERIVED FROM ALL-SKY CAMERAS FOR THE RETRIEVAL OF AEROSOL MICROPHYSICAL PROPERTIES R. Román, B. Torres, D. Fuertes, V.E. Cachorro, O. Dubovik, C. Toledano, A. Cazorla A. Barreto,
Atmospheric Correction for Coastal and Inland Waters Current Capabilities and Challenges
 Atmospheric Correction for Coastal and Inland Waters Current Capabilities and Challenges Nima Pahlevan Research Scientist NASA Goddard Space Flight Center Science Systems and Applications Inc. Outline
Geometric Validation of Hyperion Data at Coleambally Irrigation Area
 Geometric Validation of Hyperion Data at Coleambally Irrigation Area Tim McVicar, Tom Van Niel, David Jupp CSIRO, Australia Jay Pearlman, and Pamela Barry TRW, USA Background RICE SOYBEANS The Coleambally
Aral Sea profile Selection of area 24 February April May 1998
 250 km Aral Sea profile 1960 1960 1985 1986 1987 1988 1989 1990 1991 1992 1993 1994 1995 1996 1997 1998 2010? Selection of area Area of interest Kzyl-Orda Dried seabed 185 km Syrdarya river Aral Sea Salt
The studies began when the Tiros satellites (1960) provided man s first synoptic view of the Earth s weather systems.
 provided man s first synoptic view of the Earth s weather systems.") Remote sensing of the Earth from orbital altitudes was recognized in the mid-1960 s as a potential technique for obtaining information important for the effective use and conservation of natural resources.
Remote sensing of the Earth from orbital altitudes was recognized in the mid-1960 s as a potential technique for obtaining information important for the effective use and conservation of natural resources.
Japan's Greenhouse Gases Observation from Space
 1 Workshop on EC CEOS Priority on GHG Monitoring Japan's Greenhouse Gases Observation from Space 18 June, 2018@Ispra, Italy Masakatsu NAKAJIMA Japan Aerospace Exploration Agency Development and Operation
Lab 6: Multispectral Image Processing Using Band Ratios
 Lab 6: Multispectral Image Processing Using Band Ratios due Dec. 11, 2017 Goals: 1. To learn about the spectral characteristics of vegetation and geologic materials. 2. To experiment with vegetation indices
AVHRR/3 Operational Calibration
 AVHRR/3 Operational Calibration Jörg Ackermann, Remote Sensing and Products Division 1 Workshop`Radiometric Calibration for European Missions, 30/31 Aug. 2017`,Frascati (EUM/RSP/VWG/17/936014) AVHRR/3
Detecting Greenery in Near Infrared Images of Ground-level Scenes
 Detecting Greenery in Near Infrared Images of Ground-level Scenes Piotr Łabędź Agnieszka Ozimek Institute of Computer Science Cracow University of Technology Digital Landscape Architecture, Dessau Bernburg
Haze Detection and Removal in Sentinel 3 OLCI Level 1B Imagery Using a New Multispectral Data Dehazing Method
 Haze Detection and Removal in Sentinel 3 OLCI Level 1B Imagery Using a New Multispectral Data Dehazing Method Xinxin Busch Li, Stephan Recher, Peter Scheidgen July 27 th, 2018 Outline Introduction» Why
Introduction to Remote Sensing
 Introduction to Remote Sensing Spatial, spectral, temporal resolutions Image display alternatives Vegetation Indices Image classifications Image change detections Accuracy assessment Satellites & Air-Photos
Moderate Resolution Sensor Interoperability Framework
 Moderate Resolution Sensor Interoperability Framework Version 1.0 August 2017 Moderate Resolution Sensor Interoperability Framework Initiative Version 1.0; 30 August 2017 MRI Team: Gene Fosnight (USGS),
typical spectral signatures of photosynthetically active and non-photosynthetically active vegetation (Beeri et al., 2007)
") typical spectral signatures of photosynthetically active and non-photosynthetically active vegetation (Beeri et al., 2007) Xie, Y. et al. J Plant Ecol 2008 1:9-23; doi:10.1093/jpe/rtm005 Copyright restrictions
typical spectral signatures of photosynthetically active and non-photosynthetically active vegetation (Beeri et al., 2007) Xie, Y. et al. J Plant Ecol 2008 1:9-23; doi:10.1093/jpe/rtm005 Copyright restrictions
Image transformations
 Image transformations Digital Numbers may be composed of three elements: Atmospheric interference (e.g. haze) ATCOR Illumination (angle of reflection) - transforms Albedo (surface cover) Image transformations
MOVING FROM PIXELS TO PRODUCTS
 TRUE COLOR RGB MOSAIC, OSAKA, JAPAN MOVING FROM PIXELS TO PRODUCTS and data to insight AUTOMATED STRUCTURE IDENTIFICATION, OSAKA, JAPAN Table of Contents Moving from Pixels to Products 3 Doubling the Spectral
Future US Land Imaging. Harmonized Landsat/Sentinel-2 (HLS) Project
 Project") Future US Land Imaging Jeffrey Masek, NASA GSFC Harmonized Landsat/Sentinel-2 (HLS) Project Jeff Masek, Junchang Ju, Eric Vermote, NASA GSFC Martin NASA Agency Claverie, Update Jean-Claude CEOS Roger,
Future US Land Imaging Jeffrey Masek, NASA GSFC Harmonized Landsat/Sentinel-2 (HLS) Project Jeff Masek, Junchang Ju, Eric Vermote, NASA GSFC Martin NASA Agency Claverie, Update Jean-Claude CEOS Roger,
Looking at 637 nm VIIRS band, S-NPP
 Looking at 637 nm VIIRS band, S-NPP bguenther@stellarsolutions.com (Sharpening I1) B. GUENTHER STELLAR SOLUTIONS, INC NOAA-JPSS 1 I am looking at houses and have a desire to know how much living area this
An Introduction to Remote Sensing & GIS. Introduction
 An Introduction to Remote Sensing & GIS Introduction Remote sensing is the measurement of object properties on Earth s surface using data acquired from aircraft and satellites. It attempts to measure something
The New Rig Camera Process in TNTmips Pro 2018
 The New Rig Camera Process in TNTmips Pro 2018 Jack Paris, Ph.D. Paris Geospatial, LLC, 3017 Park Ave., Clovis, CA 93611, 559-291-2796, jparis37@msn.com Kinds of Digital Cameras for Drones Two kinds of
Advanced satellite image fusion techniques for estimating high resolution Land Surface Temperature time series
 COMECAP 2014 e-book of proceedings vol. 2 Page 267 Advanced satellite image fusion techniques for estimating high resolution Land Surface Temperature time series Mitraka Z., Chrysoulakis N. Land Surface
Radiometric normalization of high spatial resolution multi-temporal imagery: A comparison between a relative method and atmospheric correction
 Radiometric normalization of high spatial resolution multi-temporal imagery: A comparison between a relative method and atmospheric correction M. El Hajj* a, M. Rumeau a, A. Bégué a, O. Hagolle b, G. Dedieu
John P. Stevens HS: Remote Sensing Test
 Name(s): Date: Team name: John P. Stevens HS: Remote Sensing Test 1 Scoring: Part I - /18 Part II - /40 Part III - /16 Part IV - /14 Part V - /93 Total: /181 2 I. History (3 pts. each) 1. What is the name
Landsat 8, Level 1 Product Performance Cyclic Report July 2016
 Landsat 8, Level 1 Product Performance Cyclic Report July 2016 Author(s) : Sébastien Saunier (IDEAS+, Telespazio VEGA) Amy Northrop (IDEAS+, Telespazio VEGA) IDEAS+-VEG-OQC-REP-2647 Issue July 2016 1 September
Instrumental and Methodological Developments in UV Research
 Instrumental and Methodological Developments in UV Research Germar Bernhard Biospherical Instruments Inc, San Diego, CA Instrumental Developments Intercomparisons Correction Methods Methods for Interpreting
IDEAS+ WP3520 Calibration and data quality toolbox. July 2016 Steve Mackin James Warner
 IDEAS+ WP3520 Calibration and data quality toolbox July 2016 Steve Mackin James Warner Proposition : Every image contains the same information Railroad Valley, Nevada London, UK Rationale for the project
NON-PHOTOGRAPHIC SYSTEMS: Multispectral Scanners Medium and coarse resolution sensor comparisons: Landsat, SPOT, AVHRR and MODIS
 NON-PHOTOGRAPHIC SYSTEMS: Multispectral Scanners Medium and coarse resolution sensor comparisons: Landsat, SPOT, AVHRR and MODIS CLASSIFICATION OF NONPHOTOGRAPHIC REMOTE SENSORS PASSIVE ACTIVE DIGITAL
Lesson 3: Working with Landsat Data
 Lesson 3: Working with Landsat Data Lesson Description The Landsat Program is the longest-running and most extensive collection of satellite imagery for Earth. These datasets are global in scale, continuously
Evaluation of Sentinel-2 bands over the spectrum
 Evaluation of Sentinel-2 bands over the spectrum S.E. Hosseini Aria, M. Menenti, Geoscience and Remote sensing Department Delft University of Technology, Netherlands 1 outline ointroduction - Concept odata
Performance status of IASI on MetOp-A and MetOp-B
 Performance status of IASI on MetOp-A and MetOp-B E. Jacquette (1), E. Péquignot (1), J. Chinaud (1), C. Maraldi (1), D. Jouglet (1), S. Gaugain (1), L. Buffet (1), C. Villaret (1), C. Larigauderie (1),
remote sensing? What are the remote sensing principles behind these Definition
 Introduction to remote sensing: Content (1/2) Definition: photogrammetry and remote sensing (PRS) Radiation sources: solar radiation (passive optical RS) earth emission (passive microwave or thermal infrared
Landsat 8, Level 1 Product Performance Cyclic Report January 2017
 Landsat 8, Level 1 Product Performance Cyclic Report January 2017 Author(s) : Sébastien Saunier (IDEAS+, Telespazio VEGA) Amy Northrop (IDEAS+, Telespazio VEGA) IDEAS+-VEG-OQC-REP-2647 Issue January 2017
Atmospheric interactions; Aerial Photography; Imaging systems; Intro to Spectroscopy Week #3: September 12, 2018
 GEOL 1460/2461 Ramsey Introduction/Advanced Remote Sensing Fall, 2018 Atmospheric interactions; Aerial Photography; Imaging systems; Intro to Spectroscopy Week #3: September 12, 2018 I. Quick Review from
S3 Product Notice SLSTR
 S3 Product Notice SLSTR Mission Sensor Product S3-A SLSTR Level 2 Land Surface Temperature Product Notice ID S3A.PN-SLSTR-L2L.02 Issue/Rev Date 05/07/2017 Version 1.0 Preparation Approval This Product
Recent developments in Deep Blue satellite aerosol data products from NASA GSFC
 Recent developments in Deep Blue satellite aerosol data products from NASA GSFC Andrew M. Sayer, N. Christina Hsu (PI), Corey Bettenhausen, Myeong-Jae Jeong Climate & Radiation Laboratory, NASA Goddard
Preparing for the exploitation of Sentinel-2 data for agriculture monitoring. JACQUES Damien, DEFOURNY Pierre UCL-Geomatics Lab 2 octobre 2013
 Preparing for the exploitation of Sentinel-2 data for agriculture monitoring JACQUES Damien, DEFOURNY Pierre UCL-Geomatics Lab 2 octobre 2013 Agriculture monitoring, why? - Growing speculation on food