CHAPTER 3 NAUTICAL CHARTS
|
|
|
- Bonnie Wilkins
- 6 years ago
- Views:
Transcription


1 CHAPTER 3 NAUTICAL CHARTS CHART FUNDAMENTALS 300. Definitions A nautical chart represents part of the spherical earth on a plane surface. It shows water depth, the shoreline of adjacent land, prominent topographic features, aids to navigation, and other navigational information. It is a work area on which the navigator plots courses, ascertains positions, and views the relationship of the ship to the surrounding area. It assists the navigator in avoiding dangers and arriving safely at his destination. Originally hand-drawn on sheepskin, traditional nautical charts have for generations been printed on paper. Electronic charts consisting of a digital data base and a display system are in use and are replacing paper charts aboard many vessels. An electronic chart is not simply a digital version of a paper chart; it introduces a new navigation methodology with capabilities and limitations very different from paper charts. The electronic chart is the legal equivalent of the paper chart if it meets certain International Maritime Organization specifications. See Chapter 14 for a complete discussion of electronic charts. Should a marine accident occur, the nautical chart in use at the time takes on legal significance. In cases of grounding, collision, and other accidents, charts become critical records for reconstructing the event and assigning liability. Charts used in reconstructing the incident can also have tremendous training value Projections Because a cartographer cannot transfer a sphere to a flat surface without distortion, he must project the surface of a sphere onto a developable surface. A developable surface is one that can be flattened to form a plane. This process is known as chart projection. If points on the surface of the sphere are projected from a single point, the projection is said to be perspective or geometric. As the use of electronic charts becomes increasingly widespread, it is important to remember that the same cartographic principles that apply to paper charts apply to their depiction on video screens Selecting a Projection Each projection has certain preferable features. However, as the area covered by the chart becomes smaller, the differences between various projections become less noticeable. On the largest scale chart, such as of a harbor, all projections are practically identical. Some desirable properties of a projection are: 1. True shape of physical features 2. Correct angular relationships 3. Equal area (Represents areas in proper proportions) 4. Constant scale values 5. Great circles represented as straight lines 6. Rhumb lines represented as straight lines Some of these properties are mutually exclusive. For example, a single projection cannot be both conformal and equal area. Similarly, both great circles and rhumb lines cannot be represented on a single projection as straight lines Types of Projections The type of developable surface to which the spherical surface is transferred determines the projection s classification. Further classification depends on whether the projection is centered on the equator (equatorial), a pole (polar), or some point or line between (oblique). The name of a projection indicates its type and its principal features. Mariners most frequently use a Mercator projection, classified as a cylindrical projection upon a plane, the cylinder tangent along the equator. Similarly, a projection based upon a cylinder tangent along a meridian is called transverse (or inverse) Mercator or transverse (or inverse) orthomorphic. The Mercator is the most common projection used in maritime navigation, primarily because rhumb lines plot as straight lines. In a simple conic projection, points on the surface of the earth are transferred to a tangent cone. In the Lambert conformal projection, the cone intersects the earth (a secant cone) at two small circles. In a polyconic projection, a series of tangent cones is used. In an azimuthal or zenithal projection, points on the earth are transferred directly to a plane. If the origin of the 23
, an orthographic projection. The gnomonic, stereographic, and orthographic are perspective projections.")
2 24 NAUTICAL CHARTS projecting rays is the center of the earth, a gnomonic projection results; if it is the point opposite the plane s point of tangency, a stereographic projection; and if at infinity (the projecting lines being parallel to each other), an orthographic projection. The gnomonic, stereographic, and orthographic are perspective projections.in an azimuthal equidistant projection, which is not perspective, the scale of distances is constant along any radial line from the point of tangency. See Figure 303. Figure 303. Azimuthal projections: A, gnomonic; B, stereographic; C, (at infinity) orthographic. Cylindrical and plane projections are special conical projections, using heights infinity and zero, respectively. A graticule is the network of latitude and longitude lines laid out in accordance with the principles of any projection Cylindrical Projections If a cylinder is placed around the earth, tangent along the equator, and the planes of the meridians are extended, they intersect the cylinder in a number of vertical lines. See Figure 304. These parallel lines of projection are equidistant from each other, unlike the terrestrial meridians from which they are derived which converge as the latitude increases. On the earth, parallels of latitude are perpendicular to the meridians, forming circles of progressively smaller diameter as the latitude increases. On the cylinder they are shown perpendicular to the projected meridians, but because a cylinder is everywhere of the same diameter, the projected parallels are all the same size. If the cylinder is cut along a vertical line (a meridian) and spread out flat, the meridians appear as equally spaced vertical lines; and the parallels appear as horizontal lines. The parallels relative spacing differs in the various types of cylindrical projections. If the cylinder is tangent along some great circle other than the equator, the projected pattern of latitude and longitude lines appears quite different from that described above, since the line of tangency and the equator no longer coincide. These projections are classified as oblique or transverse projections. Figure 304. A cylindrical projection Mercator Projection Navigators most often use the plane conformal projection known as the Mercator projection. The Mercator projection is not perspective, and its parallels can be derived mathematically as well as projected geometrically. Its distinguishing feature is that both the meridians and parallels are expanded at the same ratio with increased latitude. The expansion is equal to the secant of the latitude, with a small correction for the ellipticity of the earth. Since the secant of 90 is infinity, the projection cannot include the poles. Since the projection is conformal, expansion is the same in all directions and angles are correctly shown. Rhumb lines appear as straight lines, the directions of which can be measured directly on the chart. Distances can also be measured directly if the spread of latitude is small. Great circles, except meridians and the equator, appear as curved lines concave to the equator. Small areas appear in their correct shape but of increased size unless they are near the equator Meridional Parts At the equator a degree of longitude is approximately equal in length to a degree of latitude. As the distance from the equator increases, degrees of latitude remain approximately the same, while degrees of longitude become

3 NAUTICAL CHARTS 25 Figure 306. A Mercator map of the world. progressively shorter. Since degrees of longitude appear everywhere the same length in the Mercator projection, it is necessary to increase the length of the meridians if the expansion is to be equal in all directions. Thus, to maintain the correct proportions between degrees of latitude and degrees of longitude, the degrees of latitude must be progressively longer as the distance from the equator increases. This is illustrated in Figure 306. The length of a meridian, increased between the equator and any given latitude, expressed in minutes of arc at the equator as a unit, constitutes the number of meridional parts (M) corresponding to that latitude. Meridional parts, given in Table 6 for every minute of latitude from the equator to the pole, make it possible to construct a Mercator chart and to solve problems in Mercator sailing. These values are for the WGS ellipsoid of Transverse Mercator Projections Constructing a chart using Mercator principles, but with the cylinder tangent along a meridian, results in a transverse Mercator or transverse orthomorphic projection. The word inverse is used interchangeably with transverse. These projections use a fictitious graticule similar to, but offset from, the familiar network of meridians and parallels. The tangent great circle is the fictitious equator. Ninety degrees from it are two fictitious poles. A group of great circles through these poles and perpendicular to the tangent great circle are the fictitious meridians, while a series of circles parallel to the plane of the tangent great circle form the fictitious parallels. The actual meridians and parallels appear as curved lines. A straight line on the transverse or oblique Mercator projection makes the same angle with all fictitious meridians, but not with the terrestrial meridians. It is therefore a fictitious rhumb line. Near the tangent great circle, a straight line closely approximates a great circle. The projection is most useful in this area. Since the area of minimum distortion is near a meridian, this projection is useful for charts covering a large band of latitude and extending a relatively short distance on each side of the tangent meridian. It is sometimes used for star charts showing the evening sky at various seasons of the year. See Figure 307.
 Grid The Universal Transverse Mercator (UTM) grid is a military grid superimposed upon a transverse Mercator graticule, or the representation of these grid lines")


4 26 NAUTICAL CHARTS as the latitude changes. Figure 309a. An oblique Mercator projection. Figure 307. A transverse Mercator map of the Western Hemisphere Universal Transverse Mercator (UTM) Grid The Universal Transverse Mercator (UTM) grid is a military grid superimposed upon a transverse Mercator graticule, or the representation of these grid lines upon any graticule. This grid system and these projections are often used for large-scale (harbor) nautical charts and military charts Oblique Mercator Projections A Mercator projection in which the cylinder is tangent along a great circle other than the equator or a meridian is called an oblique Mercator or oblique orthomorphic projection. See Figure 309a and Figure 309b. This projection is used principally to depict an area in the near vicinity of an oblique great circle. Figure 309c, for example, shows the great circle joining Washington and Moscow. Figure 309d shows an oblique Mercator map with the great circle between these two centers as the tangent great circle or fictitious equator. The limits of the chart of Figure 309c are indicated in Figure 309d. Note the large variation in scale Figure 309b. The fictitious graticule of an oblique Mercator projection.


5 NAUTICAL CHARTS 27 Figure 309c. The great circle between Washington and Moscow as it appears on a Mercator map. Figure 309d. An oblique Mercator map based upon a cylinder tangent along the great circle through Washington and Moscow. The map includes an area 500 miles on each side of the great circle. The limits of this map are indicated on the Mercator map of Figure 309c Rectangular Projection A cylindrical projection similar to the Mercator, but with uniform spacing of the parallels, is called a rectangular projection. It is convenient for graphically depicting information where distortion is not important. The principal navigational use of this projection is for the star chart of the Air Almanac, where positions of stars are plotted by rectangular coordinates representing declination (ordinate) and sidereal hour angle (abscissa). Since the meridians are parallel, the parallels of latitude (including the equator and the poles) are all represented by lines of equal length Conic Projections A conic projection is produced by transferring points from the surface of the earth to a cone or series of cones. This cone is then cut along an element and spread out flat to form the chart. When the axis of the cone coincides with the axis of the earth, then the parallels appear as arcs of circles, and the meridians appear as either straight or curved lines converging toward the nearer pole. Limiting the area covered to that part of the cone near the surface of the earth limits distortion. A parallel along which there is no distortion is called a standard parallel. Neither the transverse conic projection, in which the axis of the cone is in the equatorial plane, nor the oblique conic projection, in which the axis of the cone is oblique to the plane of the equator, is ordinarily used for navigation. They are typically used for illustrative maps. Using cones tangent at various parallels, a secant (intersecting) cone, or a series of cones varies the appearance and features of a conic projection Simple Conic Projection A conic projection using a single tangent cone is a simple conic projection (Figure 312a). The height of the cone increases as the latitude of the tangent parallel decreases. At the equator, the height reaches infinity and the cone be-

6 28 NAUTICAL CHARTS Figure 312a. A simple conic projection. comes a cylinder. At the pole, its height is zero, and the cone becomes a plane. Similar to the Mercator projection, the simple conic projection is not perspective since only the meridians are projected geometrically, each becoming an element of the cone. When this projection is spread out flat to form a map, the meridians appear as straight lines converging at the apex of the cone. The standard parallel, where the cone is tangent to the earth, appears as the arc of a circle with its center at the apex of the cone. The other parallels are concentric circles. The distance along any meridian between consecutive parallels is in correct relation to the distance on the earth, and, therefore, can be derived mathematically. The pole is represented by a circle (Figure 312b). The scale is correct along any meridian and along the standard parallel. All other parallels are too great in length, with the error increasing with increased distance from the standard parallel. Since the scale is not the same in all directions about every point, the projection is neither a conformal nor equal-area projection. Its non-conformal nature is its principal disadvantage for navigation. Since the scale is correct along the standard parallel and varies uniformly on each side, with comparatively little distortion near the standard parallel, this projection is useful for mapping an area covering a large spread of longitude and a comparatively narrow band of latitude. It was developed by Claudius Ptolemy in the second century A.D. to map just such an area: the Mediterranean Sea. Figure 312b. A simple conic map of the Northern Hemisphere.
7 NAUTICAL CHARTS Lambert Conformal Projection The useful latitude range of the simple conic projection can be increased by using a secant cone intersecting the earth at two standard parallels. See Figure 313. The area between the two standard parallels is compressed, and that beyond is expanded. Such a projection is called either a secant conic or conic projection with two standard parallels. The latitude limitations of the secant conic projection can be minimized by using a series of cones. This results in a polyconic projection. In this projection, each parallel is the base of a tangent cone. At the edges of the chart, the area between parallels is expanded to eliminate gaps. The scale is correct along any parallel and along the central meridian of the projection. Along other meridians the scale increases with increased difference of longitude from the central meridian. Parallels appear as nonconcentric circles; meridians appear as curved lines converging toward the pole and concave to the central meridian. The polyconic projection is widely used in atlases, particularly for areas of large range in latitude and reasonably large range in longitude, such as continents. However, since it is not conformal, this projection is not customarily used in navigation Azimuthal Projections Figure 313. A secant cone for a conic projection with two standard parallels. If in such a projection the spacing of the parallels is altered, such that the distortion is the same along them as along the meridians, the projection becomes conformal. This modification produces the Lambert conformal projection. If the chart is not carried far beyond the standard parallels, and if these are not a great distance apart, the distortion over the entire chart is small. A straight line on this projection so nearly approximates a great circle that the two are nearly identical. Radio beacon signals travel great circles; thus, they can be plotted on this projection without correction. This feature, gained without sacrificing conformality, has made this projection popular for aeronautical charts because aircraft make wide use of radio aids to navigation. Except in high latitudes, where a slightly modified form of this projection has been used for polar charts, it has not replaced the Mercator projection for marine navigation Polyconic Projection If points on the earth are projected directly to a plane surface, a map is formed at once, without cutting and flattening, or developing. This can be considered a special case of a conic projection in which the cone has zero height. The simplest case of the azimuthal projection is one in which the plane is tangent at one of the poles. The meridians are straight lines intersecting at the pole, and the parallels are concentric circles with their common center at the pole. Their spacing depends upon the method used to transfer points from the earth to the plane. If the plane is tangent at some point other than a pole, straight lines through the point of tangency are great circles, and concentric circles with their common center at the point of tangency connect points of equal distance from that point. Distortion, which is zero at the point of tangency, increases along any great circle through this point. Along any circle whose center is the point of tangency, the distortion is constant. The bearing of any point from the point of tangency is correctly represented. It is for this reason that these projections are called azimuthal. They are also called zenithal. Several of the common azimuthal projections are perspective Gnomonic Projection If a plane is tangent to the earth, and points are projected geometrically from the center of the earth, the result is a gnomonic projection. See Figure 316a. Since the projection is perspective, it can be demonstrated by placing a light at the center of a transparent terrestrial globe and holding a flat surface tangent to the sphere. In an oblique gnomonic projection the meridians appear as straight lines converging toward the nearer pole. The parallels, except the equator, appear as curves (Figure 316b). As in all azimuthal projections, bearings from the point of tangency are correctly represented. The distance scale, however, changes rapidly. The projection is neither conformal nor equal area. Distortion is so great that shapes, as well as distances and areas, are very poorly represented, except near the point of tangency.
. As in other azimuthal Figure 316a. An oblique gnomonic projection.")


8 30 NAUTICAL CHARTS The scale of the stereographic projection increases with distance from the point of tangency, but it increases more slowly than in the gnomonic projection. The stereographic projection can show an entire hemisphere without excessive distortion (Figure 317b). As in other azimuthal Figure 316a. An oblique gnomonic projection. The usefulness of this projection rests upon the fact Figure 317a. An equatorial stereographic projection. Figure 316b. An oblique gnomonic map with point of tangency at latitude 30 N, longitude 90 W. that any great circle appears on the map as a straight line, giving charts made on this projection the common name great-circle charts. Gnomonic charts are most often used for planning the great-circle track between points. Points along the determined track are then transferred to a Mercator projection. The great circle is then followed by following the rhumb lines from one point to the next. Computer programs which automatically calculate great circle routes between points and provide latitude and longitude of corresponding rhumb line endpoints are quickly making this use of the gnomonic chart obsolete Stereographic Projection A stereographic projection results from projecting points on the surface of the earth onto a tangent plane, from a point on the surface of the earth opposite the point of tangency (Figure 317a). This projection is also called an azimuthal orthomorphic projection. Figure 317b. A stereographic map of the Western Hemisphere.

.")
9 NAUTICAL CHARTS 31 projections, great circles through the point of tangency appear as straight lines. Other circles such as meridians and parallels appear as either circles or arcs of circles. The principal navigational use of the stereographic projection is for charts of the polar regions and devices for mechanical or graphical solution of the navigational triangle. A Universal Polar Stereographic (UPS) grid, mathematically adjusted to the graticule, is used as a reference system Orthographic Projection If terrestrial points are projected geometrically from infinity to a tangent plane, an orthographic projection results (Figure 318a). This projection is not conformal; nor does it result in an equal area representation. Its principal use is in navigational astronomy because it is useful for illustrating and solving the navigational triangle. It is also useful for illustrating celestial coordinates. If the plane is tangent at a point on the equator, the parallels (including the equator) appear as straight lines. The meridians would appear as ellipses, except that the meridian through the point of tangency would appear as a straight line and the one 90 away would appear as a circle (Figure 318b) Azimuthal Equidistant Projection An azimuthal equidistant projection is an azimuthal projection in which the distance scale along any great circle through the point of tangency is constant. If a pole is the point of tangency, the meridians appear as straight radial lines and the parallels as equally spaced concentric circles. If the plane is tangent at some point other than a pole, the concentric circles represent distances from the point of tangency. In this case, meridians and parallels appear as curves. The projection can be used to portray the entire earth, the point 180 from the point of tangency appearing as the largest of the concentric circles. The projection is not conformal, equal area, or perspective. Near the point of tangency distortion is small, increasing with distance until shapes near the opposite side of the earth are unrecognizable (Figure 319). The projection is useful because it combines the three features of being azimuthal, having a constant distance scale from the point of tangency, and permitting the entire earth to be shown on one map. Thus, if an important harbor or airport is selected as the point of tangency, the great-circle course, distance, and track from that point to any other point on the earth are quickly and accurately determined. For communication work with the station at the point of tangency, the path of an incoming signal is at once apparent if the direction of arrival has been determined and the direction to train a directional antenna can be determined easily. The projection is also used for polar charts and for the star finder, No. 2102D. Figure 318a. An equatorial orthographic projection. Figure 318b. An orthographic map of the Western Hemisphere.

10 32 NAUTICAL CHARTS Figure 319. An azimuthal equidistant map of the world with the point of tangency latitude 40 N, longitude 100 W. POLAR CHARTS 320. Polar Projections Special consideration is given to the selection of projections for polar charts because the familiar projections become special cases with unique features. In the case of cylindrical projections in which the axis of the cylinder is parallel to the polar axis of the earth, distortion becomes excessive and the scale changes rapidly. Such projections cannot be carried to the poles. However, both the transverse and oblique Mercator projections are used. Conic projections with their axes parallel to the earth s polar axis are limited in their usefulness for polar charts because parallels of latitude extending through a full 360 of longitude appear as arcs of circles rather than full circles. This is because a cone, when cut along an element and flattened, does not extend through a full 360 without stretching or resuming its former conical shape. The usefulness of such projections is also limited by the fact that the pole appears as an arc of a circle instead of a point. However, by using a parallel very near the pole as the higher standard parallel, a conic projection with two standard parallels can be made. This requires little stretching to complete the circles of the parallels and eliminate that of the pole. Such a projection, called a modified Lambert conformal or Ney s projection, is useful for polar charts. It is particularly familiar to those accustomed to using the ordinary Lambert conformal charts in lower latitudes. Azimuthal projections are in their simplest form when tangent at a pole. This is because the meridians are straight lines intersecting at the pole, and parallels are concentric circles with their common center at the pole. Within a few
11 NAUTICAL CHARTS 33 degrees of latitude of the pole they all look similar; however, as the distance becomes greater, the spacing of the parallels becomes distinctive in each projection. In the polar azimuthal equidistant it is uniform; in the polar stereographic it increases with distance from the pole until the equator is shown at a distance from the pole equal to twice the length of the radius of the earth; in the polar gnomonic the increase is considerably greater, becoming infinity at the equator; in the polar orthographic it decreases with distance from the pole (Figure 320). All of these but the last are used for polar charts. The projections commonly used for polar charts are the modified Lambert conformal, gnomonic, stereographic, and azimuthal equidistant. All of these projections are similar near the pole. All are essentially conformal, and a great circle on each is nearly a straight line. As the distance from the pole increases, however, the distinctive features of each projection become important. The modified Lambert conformal projection is virtually conformal over its entire extent. The amount of its scale distortion is comparatively little if it is carried only to about 25 or 30 from the pole. Beyond this, the distortion increases rapidly. A great circle is very nearly a straight line anywhere on the chart. Distances and directions can be measured directly on the chart in the same manner as on a Lambert conformal chart. However, because this projection is not strictly conformal, and on it great circles are not exactly represented by straight lines, it is not suited for highly accurate work. The polar gnomonic projection is the one polar projection on which great circles are exactly straight lines. However, a complete hemisphere cannot be represented upon a plane because the radius of 90 from the center would become infinity. The polar stereographic projection is conformal over its entire extent, and a straight line closely approximates a great circle. See Figure 321. The scale distortion is not excessive for a considerable distance from the pole, but it is greater than that of the modified Lambert conformal projection. Figure 320. Expansion of polar azimuthal projections Selection of a Polar Projection The principal considerations in the choice of a suitable projection for polar navigation are: 1. Conformality: When the projection represents angles correctly, the navigator can plot directly on the chart. 2. Great circle representation: Because great circles are more useful than rhumb lines at high altitudes, the projection should represent great circles as straight lines. 3. Scale variation: The projection should have a constant scale over the entire chart. 4. Meridian representation: The projection should show straight meridians to facilitate plotting and grid navigation 5. Limits: Wide limits reduce the number of projections needed to a minimum. Figure 321. Polar stereographic projection. The polar azimuthal equidistant projection is useful for showing a large area such as a hemisphere because there is
12 34 NAUTICAL CHARTS no expansion along the meridians. However, the projection is not conformal and distances cannot be measured accurately in any but a north-south direction. Great circles other than the meridians differ somewhat from straight lines. The equator is a circle centered at the pole. The two projections most commonly used for polar charts are the modified Lambert conformal and the polar stereographic. When a directional gyro is used as a directional reference, the track of the craft is approximately a great circle. A desirable chart is one on which a great circle is represented as a straight line with a constant scale and with angles correctly represented. These requirements are not met entirely by any single projection, but they are approximated by both the modified Lambert conformal and the polar stereographic. The scale is more nearly constant on the former, but the projection is not strictly conformal. The polar stereographic is conformal, and its maximum scale variation can be reduced by using a plane which intersects the earth at some parallel intermediate between the pole and the lowest parallel. The portion within this standard parallel is compressed, and that portion outside is expanded. The selection of a suitable projection for use in polar regions depends upon mission requirements. These requirements establish the relative importance of various features. For a relatively small area, any of several projections is suitable. For a large area, however, the choice is more difficult. If grid directions are to be used, it is important that all units in related operations use charts on the same projection, with the same standard parallels, so that a single grid direction exists between any two points. SPECIAL CHARTS 322. Plotting Sheets Position plotting sheets are charts designed primarily for open ocean navigation, where land, visual aids to navigation, and depth of water are not factors in navigation. They have a latitude and longitude graticule, and they may have one or more compass roses. The meridians are usually unlabeled, so a plotting sheet can be used for any longitude. Plotting sheets on Mercator projection are specific to latitude, and the navigator should have enough aboard for all latitudes for his voyage. Plotting sheets are less expensive than charts. A plotting sheet may be used in an emergency when charts have been lost or destroyed. Directions on how to construct plotting sheets suitable for emergency purposes are given in Chapter 26, Emergency Navigation Grids No system exists for showing the surface of the earth on a plane without distortion. Moreover, the appearance of the surface varies with the projection and with the relation of that surface area to the point of tangency. One may want to identify a location or area simply by alpha-numeric rectangular coordinates. This is accomplished with a grid. In its usual form this consists of two series of lines drawn perpendicularly on the chart, marked by suitable alpha-numeric designations. A grid may use the rectangular graticule of the Mercator projection or a set of arbitrary lines on a particular projection. The World Geodetic Reference System (GEOREF) is a method of designating latitude and longitude by a system of letters and numbers instead of by angular measure. It is not, therefore, strictly a grid. It is useful for operations extending over a wide area. Examples of the second type of grid are the Universal Transverse Mercator (UTM) grid, the Universal Polar Stereographic (UPS) grid, and the Temporary Geographic Grid (TGG). Since these systems are used primarily by military forces, they are sometimes called military grids. CHART SCALES 324. Types Of Scales The scale of a chart is the ratio of a given distance on the chart to the actual distance which it represents on the earth. It may be expressed in various ways. The most common are: 1. A simple ratio or fraction, known as the representative fraction. For example, 1:80,000 or 1/80,000 means that one unit (such as a meter) on the chart represents 80,000 of the same unit on the surface of the earth. This scale is sometimes called the natural or fractional scale. 2. A statement that a given distance on the earth equals a given measure on the chart, or vice versa. For example, 30 miles to the inch means that 1 inch on the chart represents 30 miles of the earth s surface. Similarly, 2 inches to a mile indicates that 2 inches on the chart represent 1 mile on the earth. This is sometimes called the numerical scale. 3. A line or bar called a graphic scale may be drawn at a convenient place on the chart and subdivided into nautical miles, meters, etc. All charts vary somewhat in scale from point to point, and in some projections the scale is not the same in all directions about a single
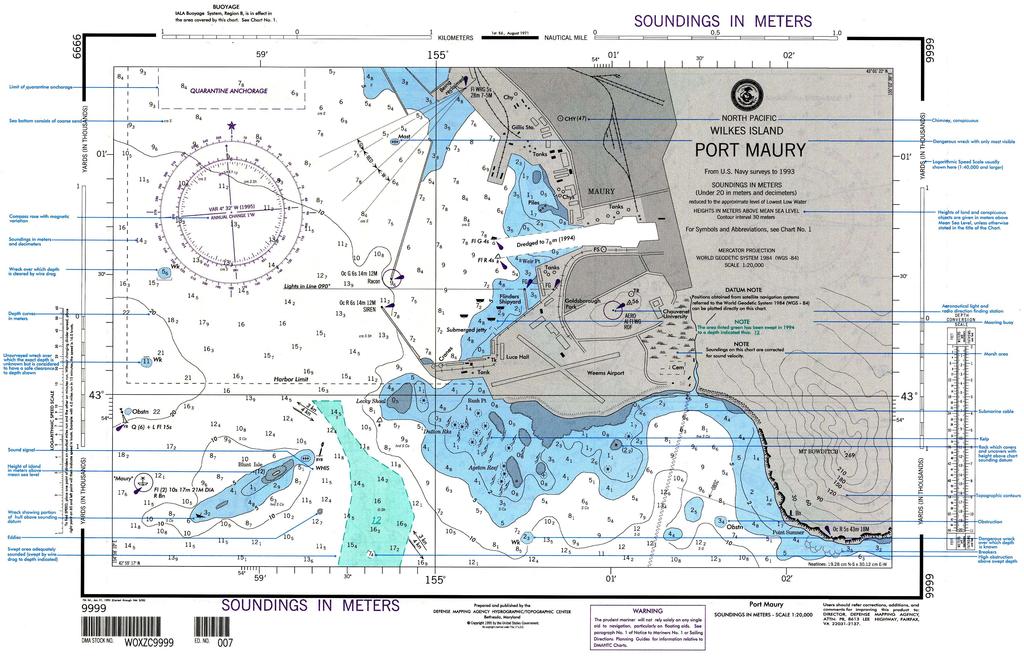
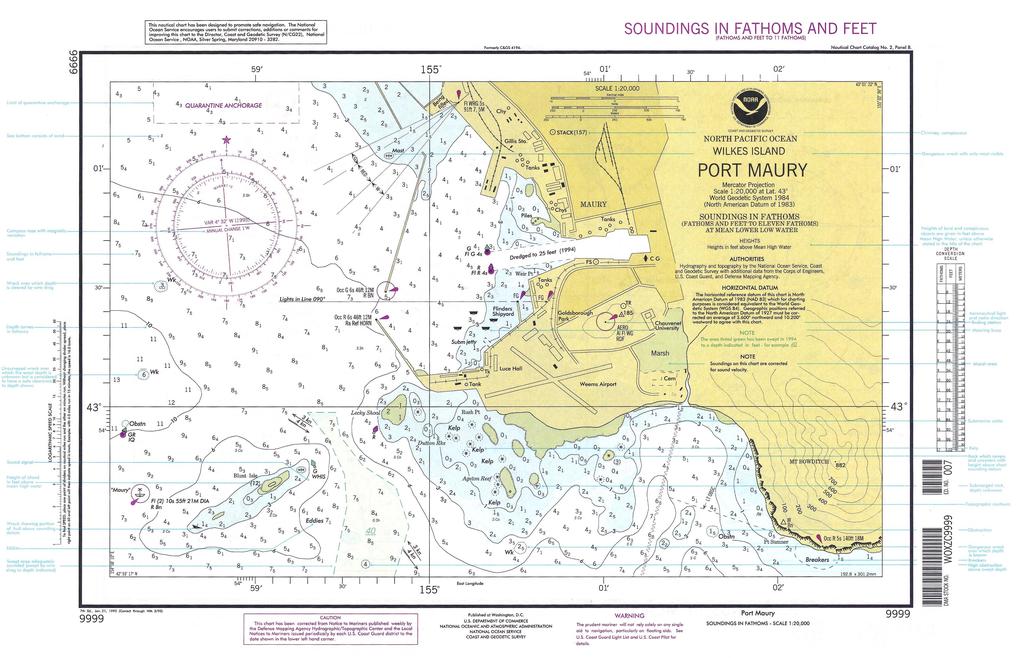
13 NAUTICAL CHARTS 35 point. A single subdivided line or bar for use over an entire chart is shown only when the chart is of such scale and projection that the scale varies a negligible amount over the chart, usually one of about 1:75,000 or larger. Since 1 minute of latitude is very nearly equal to 1 nautical mile, the latitude scale serves as an approximate graphic scale. On most nautical charts the east and west borders are subdivided to facilitate distance measurements. On a Mercator chart the scale varies with the latitude. This is noticeable on a chart covering a relatively large distance in a north-south direction. On such a chart the border scale near the latitude in question should be used for measuring distances. Of the various methods of indicating scale, the graphical method is normally available in some form on the chart. In addition, the scale is customarily stated on charts on which the scale does not change appreciably over the chart. The ways of expressing the scale of a chart are readily interchangeable. For instance, in a nautical mile there are about 72, inches. If the natural scale of a chart is 1:80,000, one inch of the chart represents 80,000 inches of the earth, or a little more than a mile. To find the exact amount, divide the scale by the number of inches in a mile, or 80,000/72, = Thus, a scale of 1:80,000 is the same as a scale of (or approximately 1.1) miles to an inch. Stated another way, there are: 72,913.39/80,000 = (approximately 0.9) inch to a mile. Similarly, if the scale is 60 nautical miles to an inch, the representative fraction is 1:(60 x 72,913.39) = 1:4,374,803. A chart covering a relatively large area is called a small-scale chart and one covering a relatively small area is called a large-scale chart. Since the terms are relative, there is no sharp division between the two. Thus, a chart of scale 1:100,000 is large scale when compared with a chart of 1:1,000,000 but small scale when compared with one of 1:25,000. As scale decreases, the amount of detail which can be shown decreases also. Cartographers selectively decrease the detail in a process called generalization when producing small scale charts using large scale charts as sources. The amount of detail shown depends on several factors, among them the coverage of the area at larger scales and the intended use of the chart Chart Classification by Scale Charts are constructed on many different scales, ranging from about 1:2,500 to 1:14,000,000. Small-scale charts covering large areas are used for route planning and for offshore navigation. Charts of larger scale, covering smaller areas, are used as the vessel approaches land. Several methods of classifying charts according to scale are used in various nations. The following classifications of nautical charts are used by the National Ocean Service. Sailing charts are the smallest scale charts used for planning, fixing position at sea, and for plotting the dead reckoning while proceeding on a long voyage. The scale is generally smaller than 1:600,000. The shoreline and topography are generalized and only offshore soundings, the principal navigational lights, outer buoys, and landmarks visible at considerable distances are shown. General charts are intended for coastwise navigation outside of outlying reefs and shoals. The scales range from about 1:150,000 to 1:600,000. Coastal charts are intended for inshore coastwise navigation, for entering or leaving bays and harbors of considerable width, and for navigating large inland waterways. The scales range from about 1:50,000 to 1:150,000. Harbor charts are intended for navigation and anchorage in harbors and small waterways. The scale is generally larger than 1:50,000. In the classification system used by NIMA, the sailing charts are incorporated in the general charts classification (smaller than about 1:150,000); those coast charts especially useful for approaching more confined waters (bays, harbors) are classified as approach charts. There is considerable overlap in these designations, and the classification of a chart is best determined by its use and by its relationship to other charts of the area. The use of insets complicates the placement of charts into rigid classifications. CHART ACCURACY 326. Factors Relating to Accuracy The accuracy of a chart depends upon the accuracy of the hydrographic surveys and other data sources used to compile it and the suitability of its scale for its intended use. One can sometimes estimate the accuracy of a chart s surveys from the source notes given in the title of the chart. If the chart is based upon very old surveys, use it with caution. Many early surveys were inaccurate because of the technological limitations of the surveyor. The number of soundings and their spacing indicates the completeness of the survey. Only a small fraction of the soundings taken in a thorough survey are shown on the chart, but sparse or unevenly distributed soundings indicate that the survey was probably not made in detail. See Figure 326a and Figure 326b. Large blank areas or absence of depth contours generally indicate lack of soundings in the area. Operate in an area with sparse sounding data only if required and then only with extreme caution. Run the echo sounder continuously and operate at a reduced speed.

14 36 NAUTICAL CHARTS Figure 326a. Part of a boat sheet, showing the soundings obtained in a survey. Figure 326b. Part of a nautical chart made from the boat sheet of Figure 326a. Compare the number of soundings in the two figures.
15 NAUTICAL CHARTS 37 Sparse sounding information does not necessarily indicate an incomplete survey. Relatively few soundings are shown when there is a large number of depth contours, or where the bottom is flat, or gently and evenly sloping. Additional soundings are shown when they are helpful in indicating the uneven character of a rough bottom. Even a detailed survey may fail to locate every rock or pinnacle. In waters where they might be located, the best method for finding them is a wire drag survey. Areas that have been dragged may be indicated on the chart by limiting lines and green or purple tint and a note added to show the effective depth at which the drag was operated. Changes in bottom contours are relatively rapid in areas such as entrances to harbors where there are strong currents or heavy surf. Similarly, there is sometimes a tendency for dredged channels to shoal, especially if they are surrounded by sand or mud, and cross currents exist. Charts often contain notes indicating the bottom contours are known to change rapidly. The same detail cannot be shown on a small-scale chart as on a large scale chart. On small-scale charts, detailed information is omitted or generalized in the areas covered by larger scale charts. The navigator should use the largest scale chart available for the area in which he is operating, especially when operating in the vicinity of hazards. Charting agencies continually evaluate both the detail and the presentation of data appearing on a chart. Development of a new navigational aid may render previous charts inadequate. The development of radar, for example, required upgrading charts which lacked the detail required for reliable identification of radar targets. After receiving a chart, the user is responsible for keeping it updated. Mariner s reports of errors, changes, and suggestions are useful to charting agencies. Even with modern automated data collection techniques, there is no substitute for on-sight observation of hydrographic conditions by experienced mariners. This holds true especially in less frequently traveled areas of the world. CHART READING 327. Chart Dates NOS charts have two dates. At the top center of the chart is the date of the first edition of the chart. In the lower left corner of the chart is the current edition number and date. This date shows the latest date through which Notice to Mariners were applied to the chart. Any subsequent change will be printed in the Notice to Mariners. Any notices which accumulate between the chart date and the announcement date in the Notice to Mariners will be given with the announcement. Comparing the dates of the first and current editions gives an indication of how often the chart is updated. Charts of busy areas are updated more frequently than those of less traveled areas. This interval may vary from 6 months to more than ten years for NOS charts. This update interval may be much longer for certain NIMA charts in remote areas. New editions of charts are both demand and source driven. Receiving significant new information may or may not initiate a new edition of a chart, depending on the demand for that chart. If it is in a sparsely-traveled area, other priorities may delay a new edition for several years. Conversely, a new edition may be printed without the receipt of significant new data if demand for the chart is high and stock levels are low. Notice to Mariners corrections are always included on new editions. NIMA charts have the same two dates as the NOS charts; the current chart edition number and date is given in the lower left corner. Certain NIMA charts are reproductions of foreign charts produced under joint agreements with a number of other countries. These charts, even though of recent date, may be based on foreign charts of considerably earlier date. Further, new editions of the foreign chart will not necessarily result in a new edition of the NIMA reproduction. In these cases, the foreign chart is the better chart to use Title Block The chart title block should be the first thing a navigator looks at when receiving a new edition chart. Refer to Figure 328. The title itself tells what area the chart covers. The chart s scale and projection appear below the title. The chart will give both vertical and horizontal datums and, if necessary, a datum conversion note. Source notes or diagrams will list the date of surveys and other charts used in compilation Shoreline The shoreline shown on nautical charts represents the line of contact between the land and water at a selected vertical datum. In areas affected by tidal fluctuations, this is usually the mean high-water line. In confined coastal waters of diminished tidal influence, a mean water level line may be used. The shoreline of interior waters (rivers, lakes) is usually a line representing a specified elevation above a

16 38 NAUTICAL CHARTS BALTIC SEA GERMANY NORTH COAST DAHMESHÖVED TO WISMAR From German Surveys SOUNDINGS IN METERS reduced to the approximate level of Mean Sea Level HEIGHTS IN METERS ABOVE MEAN SEA LEVEL MERCATOR PROJECTION EUROPEAN DATUM SCALE 1:50,000 Figure 328. A chart title block. selected datum. A shoreline is symbolized by a heavy line. A broken line indicates that the charted position is approximate only. The nature of the shore may be indicated. If the low water line differs considerably from the high water line, then a dotted line represents the low water line. If the bottom in this area is composed of mud, sand, gravel or stones, the type of material will be indicated. If the bottom is composed of coral or rock, then the appropriate symbol will be used. The area alternately covered and uncovered may be shown by a tint which is usually a combination of the land and water tint. The apparent shoreline shows the outer edge of marine vegetation where that limit would appear as shoreline to the mariner. It is also used to indicate where marine vegetation prevents the mariner from defining the shoreline. A light line symbolizes this shoreline. A broken line marks the inner edge when no other symbol (such as a cliff or levee) furnishes such a limit. The combined land-water tint or the land tint marks the area between inner and outer limits Chart Symbols Much of the information contained on charts is shown by symbols. These symbols are not shown to scale, but they indicate the correct position of the feature to which they refer. The standard symbols and abbreviations used on charts published by the United States of America are shown in Chart No. 1, Nautical Chart Symbols and Abbreviations. See Figure 330. Electronic chart symbols are, within programming and display limits, much the same as printed ones. The less expensive electronic charts have less extensive symbol libraries, and the screen s resolution may affect the presentation detail. Most of the symbols and abbreviations shown in U.S. Chart No. 1 agree with recommendations of the International Hydrographic Organization (IHO). The layout is explained in the general remarks section of Chart No. 1. The symbols and abbreviations on any given chart may differ somewhat from those shown in Chart No. 1.In addition, foreign charts may use different symbology. When using a foreign chart, the navigator should have available the Chart No. 1 from the country which produced the chart. Chart No. 1 is organized according to subject matter, with each specific subject given a letter designator. The general subject areas are General, Topography, Hydrography, Aids and Services, and Indexes. Under each heading, letter designators further define subject areas, and individual numbers refer to specific symbols. Information in Chart No. 1 is arranged in columns. The first column contains the IHO number code for the symbol in question. The next two columns show the symbol itself, in NOS and NIMA formats. If the formats are the same, the two columns are combined into one. The next column is a text description of the symbol, term, or abbreviation. The next column contains the IHO standard symbol. The last column shows certain symbols used on foreign reproduction charts produced by NIMA Lettering Except on some modified reproductions of foreign charts, cartographers have adopted certain lettering stan-
17 NAUTICAL CHARTS 39 Figure 330. Contents of U.S. Chart No. 1.
18 40 NAUTICAL CHARTS dards. Vertical type is used for features which are dry at high water and not affected by movement of the water; slanting type is used for underwater and floating features. There are two important exceptions to the two general rules listed above. Vertical type is not used to represent heights above the waterline, and slanting type is not used to indicate soundings, except on metric charts. Section 332 below discusses the conventions for indicating soundings. Evaluating the type of lettering used to denote a feature, one can determine whether a feature is visible at high tide. For instance, a rock might bear the title Rock whether or not it extends above the surface. If the name is given in vertical letters, the rock constitutes a small islet; if in slanting type, the rock constitutes a reef, covered at high water Soundings Charts show soundings in several ways. Numbers denote individual soundings. These numbers may be either vertical or slanting; both may be used on the same chart, distinguishing between data based upon different U.S. and foreign surveys, different datums, or smaller scale charts. Large block letters at the top and bottom of the chart indicate the unit of measurement used for soundings. SOUNDINGS IN FATHOMS indicates soundings are in fathoms or fathoms and fractions. SOUNDINGS IN FATHOMS AND FEET indicates the soundings are in fathoms and feet. A similar convention is followed when the soundings are in meters or meters and tenths. A depth conversion scale is placed outside the neatline on the chart for use in converting charted depths to feet, meters, or fathoms. No bottom soundings are indicated by a number with a line over the top and a dot over the line. This indicates that the spot was sounded to the depth indicated without reaching the bottom. Areas which have been wire dragged are shown by a broken limiting line, and the clear effective depth is indicated, with a characteristic symbol under the numbers. On NIMA charts a purple or green tint is shown within the swept area. Soundings are supplemented by depth contours, lines connecting points of equal depth. These lines present a picture of the bottom. The types of lines used for various depths are shown in Section I of Chart No. 1. On some charts depth contours are shown in solid lines; the depth represented by each line is shown by numbers placed in breaks in the lines, as with land contours. Solid line depth contours are derived from intensively developed hydrographic surveys. A broken or indefinite contour is substituted for a solid depth contour whenever the reliability of the contour is questionable. Depth contours are labeled with numerals in the unit of measurement of the soundings. A chart presenting a more detailed indication of the bottom configuration with fewer numerical soundings is useful when bottom contour navigating. Such a chart can be made only for areas which have undergone a detailed survey Shoal areas often are given a blue tint. Charts designed to give maximum emphasis to the configuration of the bottom show depths beyond the 100-fathom curve over the entire chart by depth contours similar to the contours shown on land areas to indicate graduations in height. These are called bottom contour or bathymetric charts. On electronic charts, a variety of other color schemes may be used, according to the manufacturer of the system. Color perception studies are being used to determine the best presentation. The side limits of dredged channels are indicated by broken lines. The project depth and the date of dredging, if known, are shown by a statement in or along the channel. The possibility of silting is always present. Local authorities should be consulted for the controlling depth. NOS Charts frequently show controlling depths in a table, which is kept current by the Notice to Mariners. The chart scale is generally too small to permit all soundings to be shown. In the selection of soundings, least depths are shown first. This conservative sounding pattern provides safety and ensures an uncluttered chart appearance. Steep changes in depth may be indicated by more dense soundings in the area. The limits of shoal water indicated on the chart may be in error, and nearby areas of undetected shallow water may not be included on the chart. Given this possibility, areas where shoal water is known to exist should be avoided. If the navigator must enter an area containing shoals, he must exercise extreme caution in avoiding shallow areas which may have escaped detection. By constructing a safety range around known shoals and ensuring his vessel does not approach the shoal any closer than the safety range, the navigator can increase his chances of successfully navigating through shoal water. Constant use of the echo sounder is also important. Abbreviations listed in Section J of Chart No. 1 are used to indicate what substance forms the bottom. The meaning of these terms can be found in the Glossary of this volume. While in ages past navigators might actually navigate by knowing the bottom characteristics of certain local areas, today knowing the characteristic of the bottom is most important when anchoring Depths and Datums Depths are indicated by soundings or explanatory notes. Only a small percentage of the soundings obtained in a hydrographic survey can be shown on a nautical chart. The least depths are generally selected first, and a pattern built around them to provide a representative indication of bottom relief. In shallow water, soundings may be spaced 0.2 to 0.4 inch apart. The spacing is gradually increased as water deepens, until a spacing of 0.8 to 1.0 inch is reached in deeper waters offshore. Where a sufficient number of soundings are available to permit adequate interpretation, depth curves are drawn in at selected intervals. All depths indicated on charts are reckoned from a selected level of the water, called the sounding datum, (sometimes referred to as the reference plane to distinguish this term from the geodetic datum). The various
19
20
21 NAUTICAL CHARTS 41 sounding datums are explained in Chapter 9, Tides and Tidal Currents. On charts produced from U.S. surveys, the sounding datum is selected with regard to the tides of the region. Depths shown are the least depths to be expected under average conditions. On charts compiled from foreign charts and surveys the sounding datum is that of the original authority. When it is known, the sounding datum used is stated on the chart. In some cases where the chart is based upon old surveys, particularly in areas where the range of tide is not great, the sounding datum may not be known. For most National Ocean Service charts of the United States and Puerto Rico, the sounding datum is mean lower low water. Most NIMA charts are based upon mean low water, mean lower low water, or mean low water springs. The sounding datum for charts published by other countries varies greatly, but is usually lower than mean low water. On charts of the Baltic Sea, Black Sea, the Great Lakes, and other areas where tidal effects are small or without significance, the sounding datum adopted is an arbitrary height approximating the mean water level. The sounding datum of the largest scale chart of an area is generally the same as the reference level from which height of tide is tabulated in the tide tables. The chart datum is usually only an approximation of the actual mean value, because determination of the actual mean height usually requires a longer series of tidal observations than is usually available to the cartographer. In addition, the heights of the tide vary over time. Since the chart datum is generally a computed mean or average height at some state of the tide, the depth of water at any particular moment may be less than shown on the chart. For example, if the chart datum is mean lower low water, the depth of water at lower low water will be less than the charted depth about as often as it is greater. A lower depth is indicated in the tide tables by a minus sign ( ) Heights The shoreline shown on charts is generally mean high water. A light s height is usually reckoned from mean sea level. The heights of overhanging obstructions (bridges, power cables, etc.) are usually reckoned from mean high water. A high water reference gives the mariner the minimum clearance expected. Since heights are usually reckoned from high water and depths from some form of low water, the reference levels are seldom the same. Except where the range of tide is very large, this is of little practical significance Dangers Dangers are shown by appropriate symbols, as indicated in Section K of Chart No. 1. A rock uncovered at mean high water may be shown as an islet. If an isolated, offlying rock is known to uncover at the sounding datum but to be covered at high water, the chart shows the appropriate symbol for a rock and gives the height above the sounding datum. The chart can give this height one of two ways. It can use a statement such as Uncov 2 ft., or it can indicate the number of feet the rock protrudes above the sounding datum, underline this value, and enclose it in parentheses (i.e. (2)). A rock which does not uncover is shown by an enclosed figure approximating its dimensions and filled with land tint. It may be enclosed by a dotted depth curve for emphasis. A tinted, irregular-line figure of approximately true dimensions is used to show a detached coral reef which uncovers at the chart datum. For a coral or rocky reef which is submerged at chart datum, the sunken rock symbol or an appropriate statement is used, enclosed by a dotted or broken line if the limits have been determined. Several different symbols mark wrecks. The nature of the wreck or scale of the chart determines the correct symbol. A sunken wreck with less than 11 fathoms of water over it is considered dangerous and its symbol is surrounded by a dotted curve. The curve is omitted if the wreck is deeper than 11 fathoms. The safe clearance over a wreck, if known, is indicated by a standard sounding number placed at the wreck. If this depth was determined by a wire drag, the sounding is underscored by the wire drag symbol. An unsurveyed wreck over which the exact depth is unknown but a safe clearance depth is known is depicted with a solid line above the symbol. Tide rips, eddies, and kelp are shown by symbol or legend. Piles, dolphins (clusters of piles), snags, and stumps are shown by small circles and a label identifying the type of obstruction. If such dangers are submerged, the letters Subm precede the label. Fish stakes and traps are shown when known to be permanent or hazardous to navigation Aids to Navigation Aids to navigation are shown by symbols listed in Sections P through S of Chart No. 1. Abbreviations and additional descriptive text supplement these symbols. In order to make the symbols conspicuous, the chart shows them in size greatly exaggerated relative to the scale of the chart. Position approximate circles are used on floating aids to indicate that they have no exact position because they move around their moorings. For most floating aids, the position circle in the symbol marks the approximate location of the anchor or sinker. The actual aid may be displaced from this location by the scope of its mooring. The type and number of aids to navigation shown on a chart and the amount of information given in their legends varies with the scale of the chart. Smaller scale charts may have fewer aids indicated and less information than larger scale charts of the same area. Lighthouses and other navigation lights are shown as black dots with purple disks or as black dots with purple flare symbols. The center of the dot is the position of the light. Some modified facsimile foreign charts use a small
22 42 NAUTICAL CHARTS star instead of a dot. On large-scale charts the legend elements of lights are shown in the following order: Legend Example Meaning Characteristic F1(2) group flashing; 2 flashes Color R red Period 10s 2 flashes in 10 seconds Height 80m 80 meters Range 19M 19 nautical miles Designation 6 light number 6 The legend for this light would appear on the chart: Fl(2) R 10s 80m 19M 6 As chart scale decreases, information in the legend is selectively deleted to avoid clutter. The order of deletion is usually height first, followed by period, group repetition interval (e.g. (2)), designation, and range. Characteristic and color will almost always be shown. Small triangles mark red daybeacons; small squares mark all others. On NIMA charts, pictorial beacons are used when the IALA buoyage system has been implemented. The center of the triangle marks the position of the aid. Except on Intracoastal Waterway charts and charts of state waterways, the abbreviation Bn is shown beside the symbol, along with the appropriate abbreviation for color if known. For black beacons the triangle is solid black and there is no color abbreviation. All beacon abbreviations are in vertical lettering. Radiobeacons are indicated on the chart by a purple circle accompanied by the appropriate abbreviation indicating an ordinary radiobeacon (R Bn) or a radar beacon (Ramark or Racon, for example). A variety of symbols, determined by both the charting agency and the types of buoys, indicate navigation buoys. IALA buoys (see Chapter 5, Short Range Aids to Navigation) in foreign areas are depicted by various styles of symbols with proper topmarks and colors; the position circle which shows the approximate location of the sinker is at the base of the symbol. A mooring buoy is shown by one of several symbols as indicated in Chart No. 1. It may be labeled with a berth number or other information. A buoy symbol with a horizontal line indicates the buoy has horizontal bands. A vertical line indicates vertical stripes; crossed lines indicate a checked pattern. There is no significance to the angle at which the buoy symbol appears on the chart. The symbol is placed so as to avoid interference with other features. Lighted buoys are indicated by a purple flare from the buoy symbol or by a small purple disk centered on the position circle. Abbreviations for light legends, type and color of buoy, designation, and any other pertinent information given near the symbol are in slanted type. The letter C, N, or S indicates a can, nun, or spar, respectively. Other buoys are assumed to be pillar buoys, except for special buoys such as spherical, barrel, etc. The number or letter designation of the buoy is given in quotation marks on NOS charts. On other charts they may be given without quotation marks or other punctuation. Aeronautical lights included in the light lists are shown by the lighthouse symbol, accompanied by the abbreviation AERO. The characteristics shown depend principally upon the effective range of other navigational lights in the vicinity and the usefulness of the light for marine navigation. Directional ranges are indicated by a broken or solid line. The solid line, indicating that part of the range intended for navigation, may be broken at irregular intervals to avoid being drawn through soundings. That part of the range line drawn only to guide the eye to the objects to be kept in range is broken at regular intervals. The direction, if given, is expressed in degrees, clockwise from true north. Sound signals are indicated by the appropriate word in capital letters (HORN, BELL, GONG, or WHIS) or an abbreviation indicating the type of sound. Sound signals of any type except submarine sound signals may be represented by three purple 45 arcs of concentric circles near the top of the aid. These are not shown if the type of signal is listed. The location of a sound signal which does not accompany a visual aid, either lighted or unlighted, is shown by a small circle and the appropriate word in vertical block letters. Private aids, when shown, are marked Priv on NOS charts. Some privately maintained unlighted fixed aids are indicated by a small circle accompanied by the word Marker, or a larger circle with a dot in the center and the word MARKER. A privately maintained lighted aid has a light symbol and is accompanied by the characteristics and the usual indication of its private nature. Private aids should be used with caution. A light sector is the sector or area bounded by two radii and the arc of a circle in which a light is visible or in which it has a distinctive color different from that of adjoining sectors. The limiting radii are indicated on the chart by dotted or dashed lines. Sector colors are indicated by words spelled out if space permits, or by abbreviations (W, R, etc.) if it does not. Limits of light sectors and arcs of visibility as observed from a vessel are given in the light lists, in clockwise order Land Areas The amount of detail shown on the land areas of nautical charts depends upon the scale and the intended purpose of the
23 NAUTICAL CHARTS 43 chart. Contours, form lines, and shading indicate relief. Contours are lines connecting points of equal elevation. Heights are usually expressed in feet (or in meters with means for conversion to feet). The interval between contours is uniform over any one chart, except that certain intermediate contours are sometimes shown by broken line. When contours are broken, their locations are approximate. Form lines are approximations of contours used for the purpose of indicating relative elevations. They are used in areas where accurate information is not available in sufficient detail to permit exact location of contours. Elevations of individual form lines are not indicated on the chart. Spot elevations are generally given only for summits or for tops of conspicuous landmarks. The heights of spot elevations and contours are given with reference to mean high water when this information is available. When there is insufficient space to show the heights of islets or rocks, they are indicated by slanting figures enclosed in parentheses in the water area nearby Cities and Roads Cities are shown in a generalized pattern that approximates their extent and shape. Street names are generally not charted except those along the waterfront on the largest scale charts. In general, only the main arteries and thoroughfares or major coastal highways are shown on smaller scale charts. Occasionally, highway numbers are given. When shown, trails are indicated by a light broken line. Buildings along the waterfront or individual ones back from the waterfront but of special interest to the mariner are shown on large-scale charts. Special symbols from Chart No. 1 are used for certain kinds of buildings. A single line with cross marks indicates both single and double track railroads. City electric railways are usually not charted. Airports are shown on small-scale charts by symbol and on large-scale charts by the shape of runways. The scale of the chart determines if single or double lines show breakwaters and jetties; broken lines show the submerged portion of these features Landmarks Landmarks are shown by symbols in Chart No. 1. A large circle with a dot at its center is used to indicate that the position is precise and may be used without reservation for plotting bearings. A small circle without a dot is used for landmarks not accurately located. Capital and lower case letters are used to identify an approximate landmark: Mon, Cup, or Dome. The abbreviation PA (position approximate) may also appear. An accurate landmark is identified by all capital type ( MON, CUP, DOME ). When only one object of a group is charted, its name is followed by a descriptive legend in parenthesis, including the number of objects in the group, for example (TALL- EST OF FOUR) or (NORTHEAST OF THREE) Miscellaneous Chart Features A measured nautical mile indicated on a chart is accurate to within 6 feet of the correct length. Most measured miles in the United States were made before 1959, when the United States adopted the International Nautical Mile. The new value is within 6 feet of the previous standard length of 6, feet. If the measured distance differs from the standard value by more than 6 feet, the actual measured distance is stated and the words measured mile are omitted. Periods after abbreviations in water areas are omitted because these might be mistaken for rocks. However, a lower case i or j is dotted. Commercial radio broadcasting stations are shown on charts when they are of value to the mariner either as landmarks or sources of direction-finding bearings. Lines of demarcation between the areas in which international and inland navigation rules apply are shown only when they cannot be adequately described in notes on the chart. Compass roses are placed at convenient locations on Mercator charts to facilitate the plotting of bearings and courses. The outer circle is graduated in degrees with zero at true north. The inner circle indicates magnetic north. On many NIMA charts magnetic variation is given to the nearest 1' by notes in the centers of compass roses. the annual change is given to the nearest 1' to permit correction of the given value at a later date. On NOS charts, variation is to the nearest 15', updated at each new edition if over three years old. The current practice of NIMA is to give the magnetic variation to the nearest 1', but the magnetic information on new editions is only updated to conform with the latest five year epoch. Whenever a chart is reprinted, the magnetic information is updated to the latest epoch. On some smaller scale charts, the variation is given by isogonic lines connecting points of equal variation; usually a separate line represents each degree of variation. The line of zero variation is called the agonic line. Many plans and insets show neither compass roses nor isogonic lines, but indicate magnetic information by note. A local magnetic disturbance of sufficient force to cause noticeable deflection of the magnetic compass, called local attraction, is indicated by a note on the chart. Currents are sometimes shown on charts with arrows giving the directions and figures showing speeds. The information refers to the usual or average conditions. According to tides and weather, conditions at any given time may differ considerably from those shown. Review chart notes carefully because they provide important information. Several types of notes are used. Those in the margin give such information as chart number, publication notes, and identification of adjoining charts. Notes in connection with the chart title include information on scale, sources of data, tidal information, soundings, and cautions. Another class of notes covers such topics as local magnetic disturbance, controlling depths of channels, haz-
24 44 NAUTICAL CHARTS ards to navigation, and anchorages. A datum note will show the geodetic datum of the chart (Do not confuse with the sounding datum. See Chapter 2, Geodesy and Datums in Navigation.) It may also contain instructions on plotting positions from the WGS 84 or NAD 83 datums on the chart if such a conversion is needed. Anchorage areas are labeled with a variety of magenta, black, or green lines depending on the status of the area. Anchorage berths are shown as purple circles, with the number or letter assigned to the berth inscribed within the circle. Caution notes are sometimes shown when there are specific anchoring regulations. Spoil areas are shown within short broken black lines. Spoil areas are tinted blue on NOS charts and labeled. These areas contain no soundings and should be avoided. Firing and bombing practice areas in the United States territorial and adjacent waters are shown on NOS and NIMA charts of the same area and comparable scale. Danger areas established for short periods of time are not charted but are announced locally. Most military commands charged with supervision of gunnery and missile firing areas promulgate a weekly schedule listing activated danger areas. This schedule is subjected to frequent change; the mariner should always ensure he has the latest schedule prior to proceeding into a gunnery or missile firing area. Danger areas in effect for longer periods are published in the Notice to Mariners. Any aid to navigation established to mark a danger area or a fixed or floating target is shown on charts. Traffic separation schemes are shown on standard nautical charts of scale 1:600,000 and larger and are printed in magenta. A logarithmic time-speed-distance nomogram with an explanation of its application is shown on harbor charts. Tidal information boxes are shown on charts of scales 1:200,000 and larger for NOS charts, and various scales on DMA charts, according to the source. See Figure 340a. Tabulations of controlling depths are shown on some National Ocean Service harbor and coastal charts. See Figure 340b. Study Chart No. 1 thoroughly to become familiar with all the symbols used to depict the wide variety of features on nautical charts. TIDAL INFORMATION Height above datum of soundings Position Place Mean High Water Mean Low Water N. Lat. E. Long. Higher Lower Lower Higher meters meters meters meters Olongapo ' ' Figure 340a. Tidal box. NANTUCKET HARBOR Tabulated from surveys by the Corps of Engineers - report of June 1972 and surveys of Nov Controlling depths in channels entering from seaward in feet at Mean Low Water Project Dimensions Left Middle Right Length Depth Date of Name of Channel outside half of outside Survey Width (feet) (naut. M. L. W. quarter channel quarter miles) (feet) Entrance Channel Note.-The Corps of Engineers should be consulted for changing conditions subsequent to the above. Figure 340b. Tabulations of controlling depths.
25 NAUTICAL CHARTS 45 REPRODUCTIONS OF FOREIGN CHARTS 341. Modified Facsimiles Modified facsimile charts are modified reproductions of foreign charts produced in accordance with bilateral international agreements. These reproductions provide the mariner with up-to-date charts of foreign waters. Modified facsimile charts published by NIMA are, in general, reproduced with minimal changes, as listed below: 1. The original name of the chart may be removed and replaced by an anglicized version. 2. English language equivalents of names and terms on the original chart are printed in a suitable glossary on the reproduction, as appropriate. 3. All hydrographic information, except bottom characteristics, is shown as depicted on the original chart. 4. Bottom characteristics are as depicted in Chart No. 1, or as on the original with a glossary. 5. The unit of measurement used for soundings is shown in block letters outside the upper and lower neatlines. 6. A scale for converting charted depth to feet, meters, or fathoms is added. 7. Blue tint is shown from a significant depth curve to the shoreline. 8. Blue tint is added to all dangers enclosed by a dotted danger curve, dangerous wrecks, foul areas, obstructions, rocks awash, sunken rocks, and swept wrecks. 9. Caution notes are shown in purple and enclosed in a box. 10. Restricted, danger, and prohibited areas are usually outlined in purple and labeled appropriately. 11. Traffic separation schemes are shown in purple. 12. A note on traffic separation schemes, printed in black, is added to the chart. 13. Wire dragged (swept) areas are shown in purple or green. 14. Corrections are provided to shift the horizontal datum to the World Geodetic System (1984). INTERNATIONAL CHARTS 342. International Chart Standards The need for mariners and chart makers to understand and use nautical charts of different nations became increasingly apparent as the maritime nations of the world developed their own establishments for the compilation and publication of nautical charts from hydrographic surveys. Representatives of twenty-two nations formed a Hydrographic Conference in London in That conference resulted in the establishment of the International Hydrographic Bureau (IHB) in Monaco in Today, the IHB s successor, the International Hydrographic Organization (IHO) continues to provide international standards for the cartographers of its member nations. (See Chapter 1, Introduction to Marine Navigation, for a description of the IHO.) Recognizing the considerable duplication of effort by member states, the IHO in 1967 moved to introduce the first international chart. It formed a committee of six member states to formulate specifications for two series of international charts. Eighty-three small-scale charts were approved; responsibility for compiling these charts has subsequently been accepted by the member states Hydrographic Offices. Once a Member State publishes an international chart, reproduction material is made available to any other Member State which may wish to print the chart for its own purposes. International charts can be identified by the letters INT before the chart number and the International Hydrographic Organization seal in addition to other national seals which may appear. CHART NUMBERING 343. The Chart Numbering System NIMA and NOS use a system in which numbers are assigned in accordance with both the scale and geographical area of coverage of a chart. With the exception of certain charts produced for military use only, one- to five-digit numbers are used. With the exception of onedigit numbers, the first digit identifies the area; the number of digits establishes the scale range. The one-digit numbers are used for certain products in the chart system which are not actually charts. Number of Digits Scale 1 No Scale 2 1:9 million and smaller 3 1:2 million to 1:9 million 4 Special Purpose 5 1:2 million and larger

26 46 NAUTICAL CHARTS Figure 343a. Ocean basins with region numbers. Two- and three-digit numbers are assigned to those small-scale charts which depict a major portion of an ocean basin or a large area. The first digit identifies the applicable ocean basin. See Figure 343a. Two-digit numbers are used for charts of scale 1:9,000,000 and smaller. Three-digit numbers are used for charts of scale 1:2,000,000 to 1:9,000,000. Due to the limited sizes of certain ocean basins, no charts for navigational use at scales of 1:9,000,000 and smaller are published to cover these basins. The otherwise unused two-digit numbers (30 to 49 and 70 to 79) are assigned to special world charts. One exception to the scale range criteria for threedigit numbers is the use of three-digit numbers for a series of position plotting sheets. They are of larger scale than 1:2,000,000 because they have application in ocean basins and can be used in all longitudes. Four-digit numbers are used for non-navigational and special purpose charts, such as chart 5090, Maneuvering Board. Five-digit numbers are assigned to those charts of scale 1:2,000,000 and larger that cover portions of the coastline rather than significant portions of ocean basins. These charts are based on the regions of the nautical chart index. See Figure 343b. The first of the five digits indicates the region; the second digit indicates the subregion; the last three digits indicate the geographical sequence of the chart within the subregion. Many numbers have been left unused so that any future charts may be placed in their proper geographical sequence. In order to establish a logical numbering system within the geographical subregions (for the 1:2,000,000 and larger-scale charts), a worldwide skeleton framework of coastal charts was laid out at a scale 1:250,000. This series was used as basic coverage except in areas where a coordinated series at about this scale already existed (such as the coast of Norway where a coordinated series of 1:200,000 charts was available). Within each region, the geographical subregions are numbered counterclockwise around the continents, and within each subregion the basic series also is numbered counterclockwise around the continents. The basic coverage is assigned generally every 20th digit, except that the first 40 numbers in each subregion are reserved for smaller-scale coverage. Charts with scales larger than the basic coverage are assigned one of the 19 numbers following the number assigned to the sheet within which it falls. Figure 343c shows the numbering sequence in Iceland. Note the sequence of numbers around the coast, the direction of numbering, and the numbering of larger scale charts within the limits of smaller scales. Five-digit numbers are also assigned to the charts produced by other hydrographic offices. This numbering system is applied to foreign charts so that they can be filed in logical sequence with the charts produced by the National Imagery and Mapping Agency and the National Ocean Service. Certain exceptions to the standard numbering system have been made for charts intended for the military. Bottom contour charts depict parts of ocean basins. They are identified with a letter plus four digits according to a scheme best shown in the catalog, and are not available to civilian navigators.

27 Figure 343b. Regions and subregions of the nautical chart index. NAUTICAL CHARTS 47
CHAPTER 3 NAUTICAL CHARTS
 CHAPTER 3 NAUTICAL CHARTS CHART FUNDAMENTALS 300. Definitions A nautical chart represents part of the spherical earth on a plane surface. It shows water depth, the shoreline of adjacent land, topographic
2. CHARTS. 2.1 Chart projections Mercator projections. Maps which are used for marine or aeronautical navigation are called charts.
 Maps which are used for marine or aeronautical navigation are called charts. In Canadian waters, mariners are required to carry the latest editions of the paper charts, at the largest scale available (see
CHAPTER 3 MARGINAL INFORMATION AND SYMBOLS
 CHAPTER 3 MARGINAL INFORMATION AND SYMBOLS A map could be compared to any piece of equipment, in that before it is placed into operation the user must read the instructions. It is important that you, as
Lecture # 7 Coordinate systems and georeferencing
 Lecture # 7 Coordinate systems and georeferencing Coordinate Systems Coordinate reference on a plane Coordinate reference on a sphere Coordinate reference on a plane Coordinates are a convenient way of
Land Navigation / Map Reading
 Land Navigation / Map Reading What is the Field Manual for map reading and land navigation? FM 3-25.26 What are the basic colors of a map, and what does each color represent? Black - Indicates cultural
ENVI.2030L Topographic Maps and Profiles
 Name ENVI.2030L Topographic Maps and Profiles I. Introduction A map is a miniature representation of a portion of the earth's surface as it appears from above. The environmental scientist uses maps as
Geodesy, Geographic Datums & Coordinate Systems
 Geodesy, Geographic Datums & Coordinate Systems What is the shape of the earth? Why is it relevant for GIS? 1/23/2018 2-1 From Conceptual to Pragmatic Dividing a sphere into a stack of pancakes (latitude)
UNIT 5a STANDARD ORTHOGRAPHIC VIEW DRAWINGS
 UNIT 5a STANDARD ORTHOGRAPHIC VIEW DRAWINGS 5.1 Introduction Orthographic views are 2D images of a 3D object obtained by viewing it from different orthogonal directions. Six principal views are possible
ENGINEERING GRAPHICS ESSENTIALS. (A Text and Lecture Aid) Second Edition. Kirstie Plantenberg University of Detroit Mercy SDC PUBLICATIONS
 Second Edition. Kirstie Plantenberg University of Detroit Mercy SDC PUBLICATIONS") ENGINEERING GRAPHICS ESSENTIALS (A Text and Lecture Aid) Second Edition Kirstie Plantenberg University of Detroit Mercy SDC PUBLICATIONS Schroff Development Corporation www.schroff.com www.schroff-europe.com
ENGINEERING GRAPHICS ESSENTIALS (A Text and Lecture Aid) Second Edition Kirstie Plantenberg University of Detroit Mercy SDC PUBLICATIONS Schroff Development Corporation www.schroff.com www.schroff-europe.com
Copyrighted Material. Copyrighted Material. Copyrighted. Copyrighted. Material
 Engineering Graphics ORTHOGRAPHIC PROJECTION People who work with drawings develop the ability to look at lines on paper or on a computer screen and "see" the shapes of the objects the lines represent.
Multi-View Drawing Review
 Multi-View Drawing Review Sacramento City College EDT 300/ENGR 306 EDT 300 / ENGR 306 - Chapter 5 1 Objectives Identify and select the various views of an object. Determine the number of views needed to
Mapping The Study Area
 While on the beach you will need to take some measurements to show where the study area is relative to the rest of the world and to show what is inside the study area. Once the measurements have been taken,
Chapter 2: Dimensioning Basic Topics Advanced Topics Exercises
 Chapter 2: Dimensioning Basic Topics Advanced Topics Exercises Dimensioning: Basic Topics Summary 2-1) Detailed Drawings 2-2) Learning to Dimension 2-3) Dimension Appearance and Techniques. 2-4) Dimensioning
CHAPTER 2 GEODESY AND DATUMS IN NAVIGATION
 CHAPTER 2 GEODESY AND DATUMS IN NAVIGATION GEODESY, THE BASIS OF CARTOGRAPHY 200. Definition Geodesy is the application of mathematics to model the size and shape of the physical earth, enabling us to
Introduction to Aerial Photographs and Topographic maps (Chapter 3)
") GEOLOGY 306 Laboratory Instructor: TERRY J. BOROUGHS NAME: Introduction to Aerial Photographs and Topographic maps (Chapter 3) For this assignment you will require: a calculator and metric ruler. Objectives:
GEOLOGY 306 Laboratory Instructor: TERRY J. BOROUGHS NAME: Introduction to Aerial Photographs and Topographic maps (Chapter 3) For this assignment you will require: a calculator and metric ruler. Objectives:
COPYRIGHTED MATERIAL. Contours and Form DEFINITION
 1 DEFINITION A clear understanding of what a contour represents is fundamental to the grading process. Technically defined, a contour is an imaginary line that connects all points of equal elevation above
Introduction to Aerial Photographs and Topographic maps (Chapter 7, 9 th edition) or (chapter 3, 8 th edition)
 or (chapter 3, 8 th edition)") GEOLOGY 306 Laboratory Instructor: TERRY J. BOROUGHS NAME: Introduction to Aerial Photographs and Topographic maps (Chapter 7, 9 th edition) or (chapter 3, 8 th edition) For this assignment you will require:
GEOLOGY 306 Laboratory Instructor: TERRY J. BOROUGHS NAME: Introduction to Aerial Photographs and Topographic maps (Chapter 7, 9 th edition) or (chapter 3, 8 th edition) For this assignment you will require:
Important Questions. Surveying Unit-II. Surveying & Leveling. Syllabus
 Surveying Unit-II Important Questions Define Surveying and Leveling Differentiate between Surveying and Leveling. Explain fundamental Principles of Surveying. Explain Plain and Diagonal Scale. What is
DOUBLE PROPORTION MADE COMPLEX
 DOUBLE PROPORTION MADE COMPLEX Jerry L. Wahl Branch of Cadastral Surveys Bureau of Land Management California State Office 2800 Cottage Way, E-2841 Sacramento, California 95825 ABSTRACT Our ever increasing
Contour An imaginary line on the ground surface joining the points of equal elevation is known as contour.
 Contour An imaginary line on the ground surface joining the points of equal elevation is known as contour. In other words, contour is a line in which the ground surface is intersected by a level surface
THE ELECTRONIC CHART DISPLAY AND INFORMATION SYSTEM (ECDIS) IN CHINA
 IN CHINA") International Hydrographic 'Review, Monaco, LXIX(2), September 1992 THE ELECTRONIC CHART DISPLAY AND INFORMATION SYSTEM (ECDIS) IN CHINA by The Research Group on ECDIS 1 Abstract This paper presents a
International Hydrographic 'Review, Monaco, LXIX(2), September 1992 THE ELECTRONIC CHART DISPLAY AND INFORMATION SYSTEM (ECDIS) IN CHINA by The Research Group on ECDIS 1 Abstract This paper presents a
Surveying & Measurement. Detail Survey Topographic Surveying
 Surveying & Measurement Detail Survey Topographic Surveying Introduction Mapping surveys are made to determine the relief of the earth s surface and locate critical points on it. to determine the locations
Chapter 3: Assorted notions: navigational plots, and the measurement of areas and non-linear distances
 : navigational plots, and the measurement of areas and non-linear distances Introduction Before we leave the basic elements of maps to explore other topics it will be useful to consider briefly two further
CHAPTER 01 PRESENTATION OF TECHNICAL DRAWING. Prepared by: Sio Sreymean
 CHAPTER 01 PRESENTATION OF TECHNICAL DRAWING Prepared by: Sio Sreymean 2015-2016 Why do we need to study this subject? Effectiveness of Graphics Language 1. Try to write a description of this object. 2.
UNITED STATES MARINE CORPS FIELD MEDICAL TRAINING BATTALION Camp Lejeune, NC
 UNITED STATES MARINE CORPS FIELD MEDICAL TRAINING BATTALION Camp Lejeune, NC 28542-0042 FMST 206 Land Navigation TERMINAL LEARNING OBJECTIVE 1. Given a military topographic map, protractor, and objective,
Civil Engineering Drawing
 Civil Engineering Drawing Third Angle Projection In third angle projection, front view is always drawn at the bottom, top view just above the front view, and end view, is drawn on that side of the front
Engineering Graphics Essentials with AutoCAD 2015 Instruction
 Kirstie Plantenberg Engineering Graphics Essentials with AutoCAD 2015 Instruction Text and Video Instruction Multimedia Disc SDC P U B L I C AT I O N S Better Textbooks. Lower Prices. www.sdcpublications.com
Student Name: Teacher: Date: District: Rowan. Assessment: 9_12 T and I IC61 - Drafting I Test 1. Description: Unit C - Sketching - Test 2.
 Student Name: Teacher: Date: District: Rowan Assessment: 9_12 T and I IC61 - Drafting I Test 1 Description: Unit C - Sketching - Test 2 Form: 501 1. The most often used combination of views includes the:
Engineering Working Drawings Basics
 Engineering Working Drawings Basics Engineering graphics is an effective way of communicating technical ideas and it is an essential tool in engineering design where most of the design process is graphically
Appendix III Graphs in the Introductory Physics Laboratory
 Appendix III Graphs in the Introductory Physics Laboratory 1. Introduction One of the purposes of the introductory physics laboratory is to train the student in the presentation and analysis of experimental
Hyperbolas Graphs, Equations, and Key Characteristics of Hyperbolas Forms of Hyperbolas p. 583
 C H A P T ER Hyperbolas Flashlights concentrate beams of light by bouncing the rays from a light source off a reflector. The cross-section of a reflector can be described as hyperbola with the light source
Essentials of Navigation
 Essentials of Navigation Latitudes & Longitudes, GPS, and more For Race Officers and Mark Boat Operators by Ed Bottrell eztrap Developer Glen Haven, Nova Scotia CANADA v13 email: info@bottrell.ca Website:
Introduction to Datums James R. Clynch February 2006
 Introduction to Datums James R. Clynch February 2006 I. What Are Datums in Geodesy and Mapping? A datum is the traditional answer to the practical problem of making an accurate map. If you do not have
Contents. Notes on the use of this publication
 Contents Preface xxiii Scope Notes on the use of this publication xxv xxvi 1 Layout of drawings 1 1.1 General 1 1.2 Drawing sheets 1 1.3 Title block 2 1.4 Borders and frames 2 1.5 Drawing formats 2 1.6
CE 100 Civil Engineering Drawing Sessional (Lab Manual)
") CE 100 Civil Engineering Drawing Sessional (Lab Manual) Department of Civil Engineering Ahsanullah University of Science and Technology November, 2017 1 Preface This course is designed to provide civil
CE 100 Civil Engineering Drawing Sessional (Lab Manual) Department of Civil Engineering Ahsanullah University of Science and Technology November, 2017 1 Preface This course is designed to provide civil
MAP REPRODUCTION GLASS NEGATIVE ENGRAVING
 MAP REPRODUCTION GLASS NEGATIVE ENGRAVING b y D. P. B a r n e t t e, Reproduction Branch U. S. Coast and Geodetic Survey. ( Extracts ) The maimer and method of reproducing on the printed sheet the results
PHOTOGRAMMETRY STEREOSCOPY FLIGHT PLANNING PHOTOGRAMMETRIC DEFINITIONS GROUND CONTROL INTRODUCTION
 PHOTOGRAMMETRY STEREOSCOPY FLIGHT PLANNING PHOTOGRAMMETRIC DEFINITIONS GROUND CONTROL INTRODUCTION Before aerial photography and photogrammetry became a reliable mapping tool, planimetric and topographic
Lab #4 Topographic Maps and Aerial Photographs
 Lab #4 Topographic Maps and Aerial Photographs Purpose To familiarize you with using topographic maps. Visualizing the shape of landforms from topographic maps is an essential skill in geology. Proficiency
16 Chart 1 - Symbols, Abbreviations, and Terms. Nautical Charts. John C. Kelly, 2003
 16 Chart 1 - Symbols, Abbreviations, and Terms GENERAL A. Chart Number, Title, Marginal Notes B. Positions, Distances, Directions, Compass TOPOGRAPHY C. Natural Features D. Cultural Features E. Landmarks
Geometric Dimensioning and Tolerancing
 Geometric dimensioning and tolerancing (GDT) is Geometric Dimensioning and Tolerancing o a method of defining parts based on how they function, using standard ASME/ANSI symbols; o a system of specifying
ENGINEERING GRAPHICS ESSENTIALS
 ENGINEERING GRAPHICS ESSENTIALS with AutoCAD 2012 Instruction Introduction to AutoCAD Engineering Graphics Principles Hand Sketching Text and Independent Learning CD Independent Learning CD: A Comprehensive
Engineering Graphics, Class 8 Orthographic Projection. Mohammad I. Kilani. Mechanical Engineering Department University of Jordan
 Engineering Graphics, Class 8 Orthographic Projection Mohammad I. Kilani Mechanical Engineering Department University of Jordan Multi view drawings Multi view drawings provide accurate shape descriptions
Suveying Lectures for CE 498
 Suveying Lectures for CE 498 SURVEYING CLASSIFICATIONS Surveying work can be classified as follows: 1- Preliminary Surveying In this surveying the detailed data are collected by determining its locations
Geometric Dimensioning and Tolerancing
 Geometric Dimensioning and Tolerancing (Known as GDT) What is GDT Helps ensure interchangeability of parts. Use is dictated by function and relationship of the part feature. It does not take the place
Chapter 5 SECTIONS OF SOLIDS 5.1 INTRODUCTION
 Chapter 5 SECTIONS OF SOLIDS 5.1 INTRODUCTION We have studied about the orthographic projections in which a 3 dimensional object is detailed in 2-dimension. These objects are simple. In engineering most
1 ISOMETRIC PROJECTION SECTION I: INTRODUCTION TO ISOMETRIC PROJECTION
 1 ISOMETRIC PROJECTION SECTION I: INTRODUCTION TO ISOMETRIC PROJECTION Orthographic projection shows drawings of an object in a two-dimensional format, with views given in plan, elevation and end elevation
CHAPTER 3. BASIC GEODESY
 CHAPTER 3. BASIC GEODESY SECTION I. THE GEODETIC SYSTEM A geodetic system serves as a framework for determining coordinates on the Earth s surface with respect to a reference ellipsoid and the geoid. It
ENGINEERING GRAPHICS ESSENTIALS
 ENGINEERING GRAPHICS ESSENTIALS Text and Digital Learning KIRSTIE PLANTENBERG FIFTH EDITION SDC P U B L I C AT I O N S Better Textbooks. Lower Prices. www.sdcpublications.com ACCESS CODE UNIQUE CODE INSIDE
Earth Sciences 089G Short Practical Assignment #4 Working in Three Dimensions
 Earth Sciences 089G Short Practical Assignment #4 Working in Three Dimensions Introduction Maps are 2-D representations of 3-D features, the developers of topographic maps needed to devise a method for
ENGINEERING DRAWING LECTURE 4
 ENGINEERING DRAWING LECTURE 4 Conventions Convention or Code: The representation of any matter by some sign or mark on the drawing is known as convention or code. The convention make the drawing simple
CHAPTER 2 GEODESY AND DATUMS IN NAVIGATION
 CHAPTER 2 GEODESY AND DATUMS IN NAVIGATION GEODESY, THE BASIS OF CARTOGRAPHY 200. Definition Geodesy is the science concerned with the exact positioning of points on the surface of the earth. It also involves
PART XII: TOPOGRAPHIC SURVEYS
 PART XII: TOPOGRAPHIC SURVEYS 12.1 Purpose and Scope The purpose of performing topographic surveys is to map a site for the depiction of man-made and natural features that are on, above, or below the surface
Trade of Metal Fabrication. Module 6: Fabrication Drawing Unit 13: Parallel Line Development Phase 2
 Trade of Metal Fabrication Module 6: Fabrication Drawing Unit 13: Parallel Line Development Phase 2 Table of Contents List of Figures... 4 List of Tables... 5 Document Release History... 6 Module 6 Fabrication
Laboratory 7: Properties of Lenses and Mirrors
 Laboratory 7: Properties of Lenses and Mirrors Converging and Diverging Lens Focal Lengths: A converging lens is thicker at the center than at the periphery and light from an object at infinity passes
CanImage. (Landsat 7 Orthoimages at the 1: Scale) Standards and Specifications Edition 1.0
 Standards and Specifications Edition 1.0") CanImage (Landsat 7 Orthoimages at the 1:50 000 Scale) Standards and Specifications Edition 1.0 Centre for Topographic Information Customer Support Group 2144 King Street West, Suite 010 Sherbrooke, QC
CanImage (Landsat 7 Orthoimages at the 1:50 000 Scale) Standards and Specifications Edition 1.0 Centre for Topographic Information Customer Support Group 2144 King Street West, Suite 010 Sherbrooke, QC
Study Unit. Auxiliary Views. This sneak preview of your study material has been prepared in advance of the book's actual online release.
 Study Unit Auxiliary Views This sneak preview of your study material has been prepared in advance of the book's actual online release. iii Preview You re entering now into another subject area in your
Chapter 1 Overview of an Engineering Drawing
 Chapter 1 Overview of an Engineering Drawing TOPICS Graphics language Engineering drawing Projection methods Orthographic projection Drawing standards TOPICS Traditional Drawing Tools Lettering Freehand
ECDIS ENC Accuracy. Contents. Introduction LOSS PREVENTION BRIEFING FOR NORTH MEMBER SHIPS / MAY Introduction... 1
 LOSS PREVENTION BRIEFING FOR NORTH MEMBER SHIPS / MAY 2017 ECDIS ENC Accuracy Contents Introduction... 1 ECDIS Specific Familiarisation... 2 IHO S-57... 2 ENC Data Source... 2 CATZOC and M_QUAL... 2 CATZOC
ENGINEERING GRAPHICS 1.0 Introduction Engineering Graphics Drawing as an art Artist Graphic design Engineering graphics engineering drawing
 ENGINEERING GRAPHICS 1.0 Introduction Engineering is the profession in which the knowledge of mathematics and science gained by study, experience and practice is applied with good judgment to develop a
REFLECTIONS AND STANDING WAVE RATIO
 Page 1 of 9 THE SMITH CHART.In the last section we looked at the properties of two particular lengths of resonant transmission lines: half and quarter wavelength lines. It is possible to compute the impedance
BACKGROUND INFORMATION
 Build an Island INTRODUCTION For this assignment, you will be creating a topographic map and three-dimensional model of a fictional island that you have designed. You will start by exploring some basic
DFTG-1305 Technical Drafting Prof. Francis Ha
 DFTG-1305 Technical Drafting Prof. Francis Ha Session 5 Dimensioning Geisecke s textbook: 14 th Ed. Chapter 10 p. 362 15 th Ed. Chapter 11 p. 502 Update: 17-0508 Dimensioning Part 1 of 2 Dimensioning Summary
Volume 1 - Module 6 Geometry of Aerial Photography. I. Classification of Photographs. Vertical
 RSCC Volume 1 Introduction to Photo Interpretation and Photogrammetry Table of Contents Module 1 Module 2 Module 3.1 Module 3.2 Module 4 Module 5 Module 6 Module 7 Module 8 Labs Volume 1 - Module 6 Geometry
AutoCAD 2016 for Civil Engineering Applications
 Introduction to AutoCAD 2016 for Civil Engineering Applications Learning to use AutoCAD for Civil Engineering Projects Nighat Yasmin Ph.D. SDC P U B L I C AT I O N S Better Textbooks. Lower Prices. www.sdcpublications.com
1 st Subject: Types and Conventions of Dimensions and Notes
 Beginning Engineering Graphics 7 th Week Lecture Notes Instructor: Edward N. Locke Topic: Dimensions, Tolerances, Graphs and Charts 1 st Subject: Types and Conventions of Dimensions and Notes A. Definitions
ENGINEERING GRAPHICS 1E9
 Lecture 3 Monday, 15 December 2014 1 ENGINEERING GRAPHICS 1E9 Lecture 3: Isometric Projections Lecture 3 Monday, 15 December 2014 2 What is ISOMETRIC? It is a method of producing pictorial view of an object
ANALYSIS OF SRTM HEIGHT MODELS
 ANALYSIS OF SRTM HEIGHT MODELS Sefercik, U. *, Jacobsen, K.** * Karaelmas University, Zonguldak, Turkey, ugsefercik@hotmail.com **Institute of Photogrammetry and GeoInformation, University of Hannover,
47 CFR Ch. I ( Edition)
") 73.684 should decrease more rapidly with distance beyond the horizon than for Channels 2 6, and modification of the curves for Channels 14 69 may be expected as a result of measurements to be made at a
73.684 should decrease more rapidly with distance beyond the horizon than for Channels 2 6, and modification of the curves for Channels 14 69 may be expected as a result of measurements to be made at a
Legal Description & Site Plan Requirements and Layouts
 Legal Description & Site Plan Requirements and Layouts Plot Plan * A plot plan shows the location of a house from an aerial view. * The site plan, also known as a plot or lot plan includes: 1. Site plan
CHART STANDARDIZATION & PAPER CHART WORKING GROUP (CSPCWG)
") INTERNATIONAL HYDROGRAPHIC ORGANIZATION ORGANISATION HYDROGRAPHIQUE INTERNATIONALE CHART STANDARDIZATION & PAPER CHART WORKING GROUP (CSPCWG) [A Working Group of the Committee on Hydrographic Requirements
INTERNATIONAL HYDROGRAPHIC ORGANIZATION ORGANISATION HYDROGRAPHIQUE INTERNATIONALE CHART STANDARDIZATION & PAPER CHART WORKING GROUP (CSPCWG) [A Working Group of the Committee on Hydrographic Requirements
Department of Civil and Environmental Engineering
 Department of Civil and Environmental Engineering CEE213L Surveying & Introduction to GIS Lab SURVEYING LABORATORY NORTH SOUTH UNIVERSITY Center of Excellence in Higher Education The First Private University
Rec. ITU-R F RECOMMENDATION ITU-R F *
 Rec. ITU-R F.162-3 1 RECOMMENDATION ITU-R F.162-3 * Rec. ITU-R F.162-3 USE OF DIRECTIONAL TRANSMITTING ANTENNAS IN THE FIXED SERVICE OPERATING IN BANDS BELOW ABOUT 30 MHz (Question 150/9) (1953-1956-1966-1970-1992)
ISO 1101 Geometrical product specifications (GPS) Geometrical tolerancing Tolerances of form, orientation, location and run-out
 Geometrical tolerancing Tolerances of form, orientation, location and run-out") INTERNATIONAL STANDARD ISO 1101 Third edition 2012-04-15 Geometrical product specifications (GPS) Geometrical tolerancing Tolerances of form, orientation, location and run-out Spécification géométrique
INTERNATIONAL STANDARD ISO 1101 Third edition 2012-04-15 Geometrical product specifications (GPS) Geometrical tolerancing Tolerances of form, orientation, location and run-out Spécification géométrique
C.2 Equations and Graphs of Conic Sections
 0 section C C. Equations and Graphs of Conic Sections In this section, we give an overview of the main properties of the curves called conic sections. Geometrically, these curves can be defined as intersections
Geometric dimensioning & tolerancing (Part 1) KCEC 1101
 KCEC 1101") Geometric dimensioning & tolerancing (Part 1) KCEC 1101 Introduction Before an object can be built, complete information about both the size and shape of the object must be available. The exact shape of
Geometric dimensioning & tolerancing (Part 1) KCEC 1101 Introduction Before an object can be built, complete information about both the size and shape of the object must be available. The exact shape of
Chapter 6 Navigation and Field Mapping
 Chapter 6 Navigation and Field Mapping In this chapter you will learn about: Orienting maps Measuring a bearing on a map Plotting points on a map using latitude/longitude Plotting points on a map using
RECOMMENDATION ITU-R S.1257
 Rec. ITU-R S.157 1 RECOMMENDATION ITU-R S.157 ANALYTICAL METHOD TO CALCULATE VISIBILITY STATISTICS FOR NON-GEOSTATIONARY SATELLITE ORBIT SATELLITES AS SEEN FROM A POINT ON THE EARTH S SURFACE (Questions
At the conclusion of this unit you should be able to accomplish the following with a 70% accuracy
 7 Multiview Drawing OBJECTIVES At the conclusion of this unit you should be able to accomplish the following with a 70% accuracy 1. explain the importance of mulitview drawing as a communication tool far
Appendix. Springer International Publishing Switzerland 2016 A.Y. Brailov, Engineering Graphics, DOI /
 Appendix See Figs. A.1, A.2, A.3, A.4, A.5, A.6, A.7, A.8, A.9, A.10, A.11, A.12, A.13, A.14, A.15, A.16, A.17, A.18, A.19, A.20, A.21, A.22, A.23, A.24, A.25, A.26, A.27, A.28, A.29, A.30, A.31, A.32,
Roof Tutorial Wall Specification
 Roof Tutorial The majority of Roof Tutorial describes some common roof styles that can be created using settings in the Wall Specification dialog and can be completed independent of the other tutorials.
Module 1H: Creating an Ellipse-Based Cylindrical Sheet-metal Lateral Piece
 Inventor (10) Module 1H: 1H- 1 Module 1H: Creating an Ellipse-Based Cylindrical Sheet-metal Lateral Piece In this Module, we will learn how to create an ellipse-based cylindrical sheetmetal lateral piece
Sketching Fundamentals
 Sketching Fundamentals Learning Outcome When you complete this module you will be able to: Make basic engineering sketches of plant equipment. Learning Objectives Here is what you will be able to do when
Introduction to CATIA V5
 Introduction to CATIA V5 Release 17 (A Hands-On Tutorial Approach) Kirstie Plantenberg University of Detroit Mercy SDC PUBLICATIONS Schroff Development Corporation www.schroff.com Better Textbooks. Lower
JUNIOR CERTIFICATE 2009 MARKING SCHEME TECHNICAL GRAPHICS HIGHER LEVEL
 . JUNIOR CERTIFICATE 2009 MARKING SCHEME TECHNICAL GRAPHICS HIGHER LEVEL Sections A and B Section A any ten questions from this section Q1 12 Four diagrams, 3 marks for each correct label. Q2 12 2 marks
Map Basics: Datums and Coordinate Systems
 Map Basics: Datums and Coordinate Systems ESRM 304 Autumn 2015 Contributors: Phil Hurvitz, Peter Schiess, Eric Turnblom 1 of 39 Datums, land division systems, & coordinate systems Datums (from Wikipedia)
U.K.O.O.A. P1/90 POST PLOT DATA EXCHANGE TAPE 1990 FORMAT
 U.K.O.O.A. P1/90 POST PLOT DATA EXCHANGE TAPE 1990 FORMAT Prepared by The Surveying and Positioning Committee For The U.K.O.O.A. Exploration Committee June 28, 1990 The United Kingdom Offshore Operators
Dimensioning. Dimensions: Are required on detail drawings. Provide the shape, size and location description: ASME Dimensioning Standards
 Dimensioning Dimensions: Are required on detail drawings. Provide the shape, size and location description: - Size dimensions - Location dimensions - Notes Local notes (specific notes) General notes ASME
Lab #8: Topographic Map Lab
 NAME: LAB TIME: TA NAME: Lab #8: Topographic Map Lab Topography is the shape of the land. Topographic maps are used to aid in the visualization of the shape of the land. Topographic maps include the accurate
Sketch-Up Guide for Woodworkers
 W Enjoy this selection from Sketch-Up Guide for Woodworkers In just seconds, you can enjoy this ebook of Sketch-Up Guide for Woodworkers. SketchUp Guide for BUY NOW! Google See how our magazine makes you
Performance Factors. Technical Assistance. Fundamental Optics
 Performance Factors After paraxial formulas have been used to select values for component focal length(s) and diameter(s), the final step is to select actual lenses. As in any engineering problem, this
ENGINEERING DRAWING. 1. Set squares are used to draw different angles. What is the angel a formed by the 45⁰ set square? Give a brief answer.
 ENGINEERING DRAWING 1. Set squares are used to draw different angles. What is the angel a formed by the 45⁰ set square? Give a brief answer. 2. Which is the correct method of hatching a plane surface?
Orthographic Projection
 Orthographic Projection Why Orthographic Projection is used in technical drawing Orthographic projection is a method of producing a number of separate two-dimensional inter-related views, which are mutually
Chapter 36. Image Formation
 Chapter 36 Image Formation Image of Formation Images can result when light rays encounter flat or curved surfaces between two media. Images can be formed either by reflection or refraction due to these
Shoe Box Activity Constructing a Topographic Map
 Shoe Box Activity Constructing a Topographic Map Background Information All maps are models of some feature of the real world. The kind of map oen used by scientists is called a contour or topographic
How to Design a Geometric Stained Glass Lamp Shade
 This technique requires no calculation tables, math, or angle computation. Instead you can use paper & pencil with basic tech drawing skills to design any size or shape spherical lamp with any number of
Graphing Techniques. Figure 1. c 2011 Advanced Instructional Systems, Inc. and the University of North Carolina 1
 Graphing Techniques The construction of graphs is a very important technique in experimental physics. Graphs provide a compact and efficient way of displaying the functional relationship between two experimental
1 st Subject: Types of Pictorial Drawings (Isometric, Oblique, and Perspective)
") Intermediate Engineering Graphics 4 th Week 1 st Meeting Lecture Notes Instructor: Edward N. Locke Topic: Types of pictorial drawings (isometric, oblique, and perspective), isometric sketching and drafting
Intermediate Engineering Graphics 4 th Week 1 st Meeting Lecture Notes Instructor: Edward N. Locke Topic: Types of pictorial drawings (isometric, oblique, and perspective), isometric sketching and drafting
not to be republished NCERT Introduction To Aerial Photographs Chapter 6
 Chapter 6 Introduction To Aerial Photographs Figure 6.1 Terrestrial photograph of Mussorrie town of similar features, then we have to place ourselves somewhere in the air. When we do so and look down,
BATHYMETRIC DATA AND NAUTICAL CHART DATUMS
 Distr. LIMITED ECA/NRD/CART.9/USA.2 October 1996 Original: ENGLISH Ninth United Nations Regional Cartographic Conference for Africa Addis Ababa, Ethiopia 11-15 November 1996 A GLOBAL APPROACH TO UPDATE
1 Sketching. Introduction
 1 Sketching Introduction Sketching is arguably one of the more difficult techniques to master in NX, but it is well-worth the effort. A single sketch can capture a tremendous amount of design intent, and