CPM Educational Program
|
|
|
- Magdalen Floyd
- 5 years ago
- Views:
Transcription
1 ALGEBRA CONNECTIONS
2 Table of Contents General Tools... 3 Algebra Tiles (CPM)... 4 Desmos Graphing Calculator... 7 Pattern Tile & Dot Tool (CPM)...10 Data Representations (CPM)...12 Chapter AC 1.1.2: 1-7 Student etool (Desmos)...15 AC 1.1.3: 1-15 Newton's Revenge Student etool (Desmos)...16 AC 1.1.4: 1-31 & 1-32 Student etool (CPM)...17 Chapter AC 2.1.4: 2-36 Student etool (CPM)...20 AC 2.1.5: 2-48, 2-50a & 2-50b tiles (CPM)...21 AC 2.1.6: 2-57a-f & 2-58 tiles (CPM)...23 AC 2.1.7: 2-65, 2-66, 2-67a & 2-67b tiles (CPM)...27 AC 2.1.8: 2-73a & 2-75a tiles (CPM)...30 AC 2.1.9: 2-83a-c tiles (CPM)...31 Chapter AC 3.1.1: 3-1a & 3-1b Student etool (CPM)...34 AC 3.1.2: John's Giant Redwood Student etool (Desmos)...36 AC 3.1.3: 3-18, 3-19 to 3-22 Student etool (CPM & Desmos)...37 AC 3.2.1: 3-69 Student etool (CPM)...39 Chapter AC 4.1.2: 4-8, 4-9a&b, 4-11 Student etool (CPM)...42 AC 4.2.1: AC-67 Student etool (Desmos) & Iditarod - Checkpoints Video...45 AC 4.2.3: 4-86 Student etool (CPM)...47
3 General Tools Page 3

4 Algebra Tiles (CPM) This tutorial describes how to use the Algebra Tiles including additional features. Click on the link below to access etool. Algebra Tiles (CPM) 1. The top bar has three main parts: Pen & Paper Icon, '?' Icon, and the Arrow Icon. 1. Select the Pen & Paper Icon to: Options - Add Title and Description and Enable/Disable Tools. Clear Tiles - This will remove all the tiles that are in the tile area. Save - This will save all the changes made. 2. Select the '?' icon for directions. 3. Select the Arrow Icon at the right to open and close the tray. 2. Drag tiles from the tray at the left to the display area at the right. 1. Select one of the tiles and drag it to the tile area. 2. Use the sliders in the tray to change the size of the tiles. Page 4
.")
5 3. Double click tiles to change orientation (horizontal/vertical). 4. Click on a tile once to change the sign (+ ). Note: The color of the tile will turn to red for negative sign. Page 5

6 3. Choose from a variety of different mats. Also choose from a variety of sizes to fit on various devices. 4. Choose from a variety of different tiles: Click the arrow next to the tool to view/hide the options for each tool. Page 6

7 Desmos Graphing Calculator This free graphing calculator allows students to create a free account to save all of their graphs, animations, and projects created. Click on the "Desmos Graphing Calculator" link below. Desmos Graphing Calculator 1. Click on all of the buttons. Try it out! For extra help, click the "?". 2. Click on the interactive tours below for help to create: Sliders Tables Advanced Tables Restrictions Page 7

8 3. The interactive tours will NOT let you make a mistake! Try the links above! 4. Need additional help? Watch these very short excellent videos! Desmos Introduction Moveable Points Graph Inequalities Piece-Wise Function Page 8

9 5. The video links will help you with many of your graphing projects! 6. If you still need help, check out Desmos "Knowledge Base" Desmos Knowledge Base Page 9

10 Pattern Tile & Dot Tool (CPM) Click on the link below. Pattern Tile & Dot Tool 1. Drag tiles from the tray to the Display area. Add tiles and copy and paste them to the display area. Select all tiles and drag to the tray to remove the tiles. 2. Textboxes and Dots Located in the General Tools Drag out and choose border/no border and color. Double click to rotate. Click to add text. Page 10
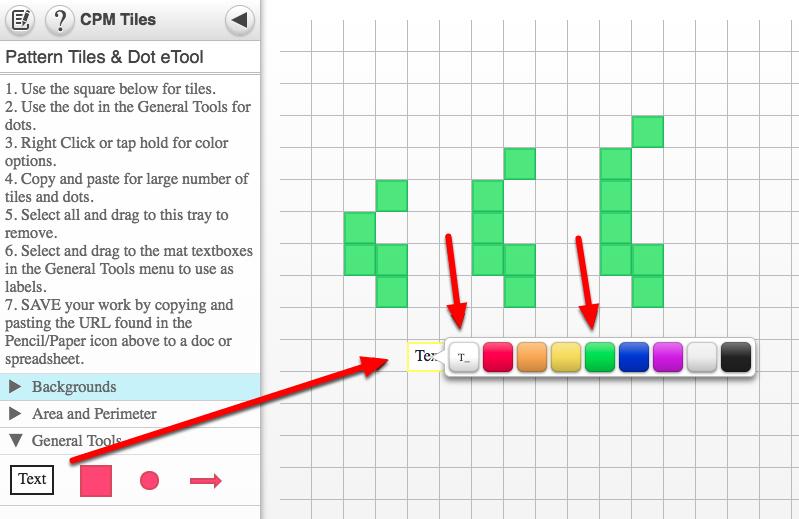
11 Page 11

12 Data Representations (CPM) Click the link below for CPM Data Representations" CPM Data Representations 1. CPM Data Representations: Type in up to two sets of data into the columns under the Data Sets tab. Click the wrench to sort or change the graph color. Click the Data Sets arrow to hide the data. 2. Single-Variable Statistics or the Stem and leaf Plots: When choosing Single-Variable Statistics or the Stem and Leaf Plots from the left tray, the data/plot(s) show from the right. Unclick from the left to close the trays at right. Page 12


13 3. Box Plots Note: Use the zoom in and out buttons at the upper right to position the histograms in a friendly window. On a computer, you can use the mouse wheel. On a tablet, use two fingers to pinch or spread data. Page 13
14 Chapter 1 Page 14
15 AC 1.1.2: 1-7 Student etool (Desmos) The Eucalyptus Grove AC 1-7 Student etool (Desmos) 1. Use this etool to solve the Eucalyptus Grove problem! 2. Page 15
16 AC 1.1.3: 1-15 Newton's Revenge Student etool (Desmos) Click on the link below. Newton's Revenge Student etool (Desmos) 1. Add data to the table. 2. Drag the moveable line to show a trend in the data. The slope is indicated in the tray at the left. Page 16
 1-32 Student etool (CPM) 1.")
17 AC 1.1.4: 1-31 & 1-32 Student etool (CPM) Click on the links below Student etool (CPM) 1-32 Student etool (CPM) 1. Drag the tiles from the tray to build Figures 1 and 5. Page 17

18 Student etool: Drag tiles to create figures not shown. Page 18
19 Chapter 2 Page 19
 AC 2-36: Drag tiles to reposition.")
20 AC 2.1.4: 2-36 Student etool (CPM) Click on the link below. AC 2-36 Student etool (CPM) AC 2-36: Drag tiles to reposition. Page 20
")
 2-50a tiles (CPM)")
21 AC 2.1.5: 2-48, 2-50a & 2-50b tiles (CPM) Click on the links below tiles (CPM) 2-50a tiles (CPM) 2-50b tiles (CPM) 2-48 Tiles: 2-50a Tiles: Page 21

22 2-50b Tiles: Page 22
 Click on the links below.")
 2-57e tiles (CPM) 2-57f tiles (CPM) 2-58")
23 AC 2.1.6: 2-57a-f & 2-58 tiles (CPM) Click on the links below. 2-57a tiles (CPM) 2-57b tiles (CPM) 2-57c tiles (CPM) 2-57d tiles (CPM) 2-57e tiles (CPM) 2-57f tiles (CPM) 2-58 tiles (CPM) 1. AC a: 2. AC b: Page 23


24 3. AC c: 4. AC d: Page 24


25 5. AC e: 6. AC f: Page 25

26 7. AC : Page 26
 2-66 tiles (CPM) 2-67a tiles (CPM) 2-67b tiles (CPM) 1.")
27 AC 2.1.7: 2-65, 2-66, 2-67a & 2-67b tiles (CPM) Click on the links below tiles (CPM) 2-66 tiles (CPM) 2-67a tiles (CPM) 2-67b tiles (CPM) 1. AC : Page 27


28 2. AC : 3. AC a: Page 28

29 4. AC b: Page 29
 Click")
 2-75a tiles (CPM)")
30 AC 2.1.8: 2-73a & 2-75a tiles (CPM) Click on the links below. 2-73a tiles (CPM) 2-75a tiles (CPM) 1. AC a: 2. AC a: Page 30
 Click on the")
 2-83b tiles (CPM)")
31 AC 2.1.9: 2-83a-c tiles (CPM) Click on the links below. 2-83a tiles (CPM) 2-83b tiles (CPM) 2-83c tiles (CPM) 1. AC a: 2. AC b: Page 31

32 3. AC c: Page 32
33 Chapter 3 Page 33

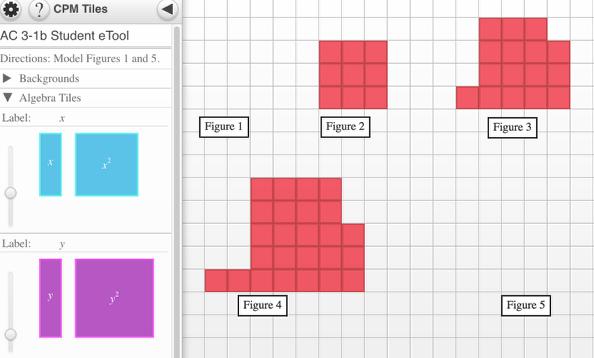
34 AC 3.1.1: 3-1a & 3-1b Student etool (CPM) Click on the links below. 3-1a Student etool (CPM) 3-1b Student etool (CPM) 1. AC 3-1a: Create figures 1 and 5. Move the text boxes to a better location. 2. AC 3-1b: Create figures 1 and 5. Move the text boxes to a better location. Page 34
35 Page 35
36 AC 3.1.2: John's Giant Redwood Student etool (Desmos) Click on the link below for the John's Giant Redwood Student etool (Desmos)." John's Giant Redwood Student etool (Desmos) 1. Complete the table. Then type in the rule that goes through the points. Page 36
 3-19 to 3-22 Student etool (Desmos) 1.")
37 AC 3.1.3: 3-18, 3-19 to 3-22 Student etool (CPM & Desmos) Click on the links below Student etool (CPM) 3-19 to 3-22 Student etool (Desmos) 1. Drag tiles to create Figure 0 and Figure 4. Page 37
38 2. Complete the table finding a rule that goes through the points. Page 38
 1. AC 3-69 Student etool: 2. Record each step.")
39 AC 3.2.1: 3-69 Student etool (CPM) Click on the link below tiles Student etool (CPM) 1. AC 3-69 Student etool: 2. Record each step. Example below: Add a 2x to both sides. Page 39
40 Page 40
41 Chapter 4 Page 41
 4-9a Student etool (CPM) 4-9b Student etool (CPM) 4-11 Student etool (CPM) 1.")
42 AC 4.1.2: 4-8, 4-9a&b, 4-11 Student etool (CPM) Click on the links below. 4-8 Student etool (CPM) 4-9a Student etool (CPM) 4-9b Student etool (CPM) 4-11 Student etool (CPM) 1. AC 4-8 Student etool: Page 42


43 2. AC 4-9a Student etool: 3. AC 4-9b Student etool: Page 43

44 4. AC 4-11 Student etool: Page 44
45 AC 4.2.1: AC-67 Student etool (Desmos) & Iditarod - Checkpoints Video Click on the links below. AC 4-67 Student etool (Desmos) 1. AC 4-67 Student etool (Desmos) Page 45

46 2. Iditarod - Checkpoints Page 46
 AC 4-86 Student etool: Page 47")
47 AC 4.2.3: 4-86 Student etool (CPM) Click on the link below. AC 4-86 Student etool (CPM) AC 4-86 Student etool: Page 47
CPM Educational Program
 ALGEBRA CONNECTIONS Table of Contents General Tools... 4 Algebra Tiles (CPM)... 5 Desmos Graphing Calculator... 7 Pattern Tile & Dot Tool (CPM)... 9 Data Representations (CPM)...10 Chapter 1...12 AC 1.1.2:
CPM Educational Program
 CC COURSE 3 ETOOLS Table of Contents General etools... 4 Algebra Tiles (CPM)... 5 Pattern Tile & Dot Tool (CPM)... 8 Base Ten Blocks (CPM)...10 Area and Perimeter (CPM)...12 Desmos Graphing Calculator...15
CPM Educational Program
 CC COURSE 1 ETOOLS Table of Contents General etools... 4 Algebra Tiles (CPM)... 5 Pattern Tile & Dot Tool (CPM)... 8 Area and Perimeter (CPM)...10 +/- Tiles & Number Lines (CPM)...13 Base Ten Blocks (CPM)...15
MAKING CONNECTIONS 1
 MAKING CONNECTIONS 1 Table of Contents General Tools... 3 Algebra Tiles (CPM)... 4 Desmos Graphing Calculator... 7 Pattern Tile & Dot Tool (CPM)...10 Area and Perimeter (CPM)...12 Base Ten Blocks (CPM)...15
CPM Educational Program
 PRE-CALC. W/TRIG Table of Contents General Tools... 3 Algebra Tiles (CPM)... 4 Desmos Graphing Calculator... 7 Chapter 1...10 PCT 1.1.2: 1-14 & 1-20 Student etool...11 PCT 1.1.4: 1-43 & 1-44 Student etool...13
GEOMETRY CONNECTIONS
 GEOMETRY CONNECTIONS Table of Contents General Tools... 3 Algebra Tiles (CPM)... 4 Desmos Graphing Calculator... 7 Probability Tools (CPM)...10 Similarity Toolkit (CPM)...14 3D Blocks (CPM)...16 Shape
CC INTEGRATED 2 ETOOLS
 CC INTEGRATED 2 ETOOLS Table of Contents General etools... 3 Algebra Tiles (CPM)... 4 Pattern Tile & Dot Tool (CPM)... 7 Similarity Toolkit (CPM)... 9 Probability Tools (CPM)...11 Desmos Graphing Calculator...15
CPM Educational Program
 CC COURSE 2 ETOOLS Table of Contents General etools... 5 Algebra Tiles (CPM)... 6 Pattern Tile & Dot Tool (CPM)... 9 Area and Perimeter (CPM)...11 Base Ten Blocks (CPM)...14 +/- Tiles & Number Lines (CPM)...16
Motion Simulation - The Moving Man
 Constant Velocity Motion Simulation - The Moving Man Today you will learn how to get information from a simulation program. Our goal is to play with the simulation to find the rules that it follows. Simulations
CREATING (AB) SINGLE- SUBJECT DESIGN GRAPHS IN MICROSOFT EXCEL Lets try to graph this data
 SINGLE- SUBJECT DESIGN GRAPHS IN MICROSOFT EXCEL Lets try to graph this data") CREATING (AB) SINGLE- SUBJECT DESIGN GRAPHS IN MICROSOFT EXCEL 2003 Lets try to graph this data Date Baseline Data Date NCR (intervention) 11/10 11/11 11/12 11/13 2 3 3 1 11/15 11/16 11/17 11/18 3 3 2
CREATING (AB) SINGLE- SUBJECT DESIGN GRAPHS IN MICROSOFT EXCEL 2003 Lets try to graph this data Date Baseline Data Date NCR (intervention) 11/10 11/11 11/12 11/13 2 3 3 1 11/15 11/16 11/17 11/18 3 3 2
Let s start by making a pencil, that can be used to draw on the stage.
 Paint Box Introduction In this project, you will be making your own paint program! Step 1: Making a pencil Let s start by making a pencil, that can be used to draw on the stage. Activity Checklist Start
Step 1: Set up the variables AB Design. Use the top cells to label the variables that will be displayed on the X and Y axes of the graph
 Step 1: Set up the variables AB Design Use the top cells to label the variables that will be displayed on the X and Y axes of the graph Step 1: Set up the variables X axis for AB Design Enter X axis label
Using the zoom adjustment, zoom on the gel Adjust the tray on the VGAU 3000 to see the image of the gel in the viewfinder
 Operation of Vakili 3000 Gel Analysis Unit Both qualitative and quantitative analysis of electrophoresis experiments can be accomplished by using the Vakili 3000 Gel Analysis Unit. There are three steps
Investigating the equation of a straight line
 Task one What is the general form of a straight line equation? Open the Desmos app on your ipad If you do not have the app, then you can access Desmos by going to www.desmos.com and then click on the red
Share My Design Space Project to Facebook or Pinterest?
 How Do I Share My Design Space Project to Facebook or Pinterest? We love it when our members share the projects they create daily with their Cricut machines, materials, and accessories. Design Space was
LabVIEW Basics Peter Avitabile,Jeffrey Hodgkins Mechanical Engineering Department University of Massachusetts Lowell
 LabVIEW Basics Peter Avitabile,Jeffrey Hodgkins Mechanical Engineering Department University of Massachusetts Lowell 1 Dr. Peter Avitabile LabVIEW LabVIEW is a data acquisition software package commonly
FlashChart. Symbols and Chart Settings. Main menu navigation. Data compression and time period of the chart. Chart types.
 FlashChart Symbols and Chart Settings With FlashChart you can display several symbols (for example indices, securities or currency pairs) in an interactive chart. You can also add indicators and draw on
Session 3: Getting to Know Photoshop Elements. Keep in mind that there are many others ways of solving the problems.
 Tutorial Session 3: Getting to Know Photoshop Elements Now that you have taken some pictures you might have noticed that some of the images have little problems like red-eye, colorcast, and too dark or
Image Viewing. with ImageScope
 Image Viewing with ImageScope ImageScope Components Use ImageScope to View These File Types: ScanScope Virtual Slides.SVS files created when the ScanScope scanner scans glass microscope slides. JPEG files
TeleTrader FlashChart
 TeleTrader FlashChart Symbols and Chart Settings With TeleTrader FlashChart you can display several symbols (for example indices, securities or currency pairs) in an interactive chart. You can also add
ACDSee Pro 3 tutorials: Process mode overview
 ACDSee Pro 3 tutorials: Process overview After you have organized and viewed your images in Manage and View s, you are ready to take your images into Process for developing and editing. Start in to do
Adding Fireworks To A Photo With Photoshop
 Adding Fireworks To A Photo With Photoshop Written by Steve Patterson. In this Photoshop Effects tutorial, we re going to learn how to add fireworks to a photo. What you ll need is a photo of fireworks
Ryan - Using the PhotoStitch Wizard
 Ryan - Using the PhotoStitch Wizard This exercise is taken from the PhotoStitch Wizard chapter of the PREMIER+ EMBROIDERY/PREMIER+ EXTRA Reference Guide. Using the PhotoStitch Wizard 1 - Load and Edit
Creo Extrude Tutorial 2: Cutting and Adding Material
 Creo Extrude Tutorial 2: Cutting and Adding Material 1. Open Creo Parametric 2. File > Open > extrudeturial (From Creo Extrude Tutorial 1) 3. Cutting Material a. Click Extrude Icon > Select the following
Drawing Layouts Paper space & Model Space
 Drawing Layouts Paper space & Model Space Users of Bricscad will have seen the tabs at the bottom left of the drawings area labelled: Model, Layout1, Layout2 but may not know how to use them or what they
copyright Karen Hinrichs, 2011 all rights reserved Adding Stops and Stitches Page 1 of 5 Adding Stops and Stitches to make Applique from Ordinary
 all rights reserved Adding Stops and Stitches Page 1 of 5 5D Embroidery Extra Adding Stops and Stitches to make Applique from Ordinary Karen Hinrichs Lee in Tampa asked: Is there a way to take a design
The Snipping Tool is automatically installed in Windows 7 and Windows 8.
 Introduction The Snipping Tool is a program that is part of Windows Vista, Windows 7, and Window 8. Snipping Tool allows you to take selections of your windows or desktop and save them as snips, or screen
ADDING FIREWORKS TO A PHOTO
 ADDING FIREWORKS TO A PHOTO In this Photoshop tutorial, we re going to learn how to add fireworks to a photo. What you ll need is a photo of fireworks and the photo you want to add the fireworks to (preferably
Creating a Frame by Frame Animation for PhotoStory
 Creating a Frame by Frame Animation for PhotoStory There are an unlimited number of animation styles that you can create using the PhotoShop Elements software. Depending on the type of animation you want,
SolidWorks Tutorial 1. Axis
 SolidWorks Tutorial 1 Axis Axis This first exercise provides an introduction to SolidWorks software. First, we will design and draw a simple part: an axis with different diameters. You will learn how to
Taking the Picture. Getting Started
 Getting Started Taking the Picture What is PixScan? PixScan technology allows you to cut precisely around any printed image or position cut lines on a specific place on your material. PixScan technology
Using Bloxels in the Classroom
 Using Bloxels in the Classroom Introduction and Getting Started: What are Bloxels? With Bloxels, you can use the concept of game design to tell stories! Bloxels Grid Board Each Bloxels set consists of
Veco User Guides. Property Photos & Images
 Introduction Veco User Guides Property Photos & Images Veco-onesystem allows images to be attached to each property. Once recorded against each property, these images can be categorised into order of priority
Let s start by making a pencil that can be used to draw on the stage.
 Paint Box Introduction In this project, you will be making your own paint program! Step 1: Making a pencil Let s start by making a pencil that can be used to draw on the stage. Activity Checklist Open
Fiery Color Profiler Suite Calibrator
 2017 Electronics For Imaging, Inc. The information in this publication is covered under Legal Notices for this product. 11 July 2017 Contents 3 Contents...5 Select a task...5 Create calibration for the
TURN A PHOTO INTO A PATTERN OF COLORED DOTS (CS6)
") TURN A PHOTO INTO A PATTERN OF COLORED DOTS (CS6) In this photo effects tutorial, we ll learn how to turn a photo into a pattern of solid-colored dots! As we ll see, all it takes to create the effect is
TURN A PHOTO INTO A PATTERN OF COLORED DOTS (CS6) In this photo effects tutorial, we ll learn how to turn a photo into a pattern of solid-colored dots! As we ll see, all it takes to create the effect is
g. Click once on the left vertical line of the rectangle.
 This drawing will require you to a model of a truck as a Solidworks Part. Please be sure to read the directions carefully before constructing the truck in Solidworks. Before submitting you will be required
Making Standard Note Blocks and Placing the Bracket in a Drawing Border
 C h a p t e r 12 Making Standard Note Blocks and Placing the Bracket in a Drawing Border In this chapter, you will learn the following to World Class standards: Making standard mechanical notes Using the
PASS Sample Size Software. These options specify the characteristics of the lines, labels, and tick marks along the X and Y axes.
 Chapter 940 Introduction This section describes the options that are available for the appearance of a scatter plot. A set of all these options can be stored as a template file which can be retrieved later.
Create a Flowchart in Word
 Create a Flowchart in Word A flowchart is a diagram of steps, movements or actions involved in a system or activity. Flowcharts use conventional geometric symbols and arrows to define relationships and
1.1 Displaying Distributions with Graphs, Continued
 1.1 Displaying Distributions with Graphs, Continued Ulrich Hoensch Thursday, January 10, 2013 Histograms Constructing a frequency table involves breaking the range of values of a quantitative variable
Scanning Procedure Using SilverFast Ai Software (6.6.1r2b) 1
 1") last modified 6.16.2015 Scanning Procedure Using SilverFast Ai Software (6.6.1r2b) 1 PREP In scanner notebook, fill out Incoming Checklist column on a Scanner Equipment Checklist sheet. Use flash drive
last modified 6.16.2015 Scanning Procedure Using SilverFast Ai Software (6.6.1r2b) 1 PREP In scanner notebook, fill out Incoming Checklist column on a Scanner Equipment Checklist sheet. Use flash drive
Map Direct Lite. Contents. Quick Start Guide: Drawing 11/05/2015
 Map Direct Lite Quick Start Guide: Drawing 11/05/2015 Contents Quick Start Guide: Drawing... 1 Drawing, Measuring and Analyzing in Map Direct Lite.... 2 Measure Distance and Area.... 3 Place the Map Marker
Color and More. Color basics
 Color and More In this lesson, you'll evaluate an image in terms of its overall tonal range (lightness, darkness, and contrast), its overall balance of color, and its overall appearance for areas that
Moving Man Introduction Motion in 1 Direction
 Moving Man Introduction Motion in 1 Direction Go to http://www.colorado.edu/physics/phet and Click on Play with Sims On the left hand side, click physics, and find The Moving Man simulation (they re listed
High Speed Motion Trail Effect With Photoshop
 High Speed Motion Trail Effect With Photoshop Written by Steve Patterson. In this Photo Effects tutorial, we'll learn how to add a sense of speed to an object using an easy to create motion blur effect!
Tutorial 2: Setting up the Drawing Environment
 Drawing size With AutoCAD all drawings are done to FULL SCALE. The drawing limits will depend on the size of the items being drawn. For example if our drawing is the plan of a floor 23.8m X 15m then we
Chapter 5: Relationships Within Triangles
 Name: Hour: Chapter 5: Relationships Within Triangles GeoGebra Exploration and Extension Project Mr. Kroll 2013-14 GeoGebra Introduction Activity In this tutorial, you will get used to the basics of GeoGebra.
Music Production. Summer Music Technology - Day 1. July 8, 2013
 Music Production Summer Music Technology - Day 1 July 8, 2013 1 Introduction In this activity we will cover the basics of music production using the popular digital audio workstation (DAW) GarageBand for
Numicon Software for the Interactive Whiteboard v2.0 Getting Started Guide
 Numicon Software for the Interactive Whiteboard v2.0 Getting Started Guide Introduction 2 Getting Started 3 4 Resources 10 2 Getting Started Guide page 2 of 10 Introduction Thank you for choosing the Numicon
Cricut Design Space App for ipad User Manual
 Cricut Design Space App for ipad User Manual Cricut Explore design-and-cut system From inspiration to creation in just a few taps! Cricut Design Space App for ipad 1. ipad Setup A. Setting up the app B.
MANAGEMENT REPORT QUICK START GUIDE
 MANAGEMENT REPORT QUICK START GUIDE Page 1 of 10 THE MANAGEMENT REPORT Welcome to the Practice Pipeline Management Report. With this easy-to-use tool, you can analyze, edit and export the progress statistics
Solidworks Tutorial Pencil
 The following instructions will be used to help you create a Pencil using Solidworks. These instructions are ordered to make the process as simple as possible. Deviating from the order, or not following
Use Corel Snapfire 2.0 to create scrapbook pages, greeting cards and more!
 Page 1 of 6 Use Corel Snapfire 2.0 to create scrapbook pages, greeting cards and more! Snapfire 2.0 comes with hundreds of project templates that let you easily create album pages, scrapbook pages, greeting
Tiling. 1. Overlapping tiles with fixed number of tiles. Tutorial
 Tutorial Tiling Software version: Asanti 3.0 Document version: April 3, 2017 This tutorial demonstrates how to use tiling within Asanti. Download the Asanti Sample Files via the Asanti Client (Help > Asanti
Excel Tool: Plots of Data Sets
 Excel Tool: Plots of Data Sets Excel makes it very easy for the scientist to visualize a data set. In this assignment, we learn how to produce various plots of data sets. Open a new Excel workbook, and
Tutorial 1 getting started with the CNCSimulator Pro
 CNCSimulator Blog Tutorial 1 getting started with the CNCSimulator Pro Made for Version 1.0.6.5 or later. The purpose of this tutorial is to learn the basic concepts of how to use the CNCSimulator Pro
We recommend downloading the latest core installer for our software from our website. This can be found at:
 Dusk Getting Started Installing the Software We recommend downloading the latest core installer for our software from our website. This can be found at: https://www.atik-cameras.com/downloads/ Locate and
Photoshop Elements Hints by Steve Miller
 2015 Elements 13 A brief tutorial for basic photo file processing To begin, click on the Elements 13 icon, click on Photo Editor in the first box that appears. We will not be discussing the Organizer portion
Welcome Booklet. Version 5
 Welcome Booklet Version 5 Visit the Learning Center Find all the resources you need to learn and use Sketchpad videos, tutorials, tip sheets, sample activities, and links to online resources, services,
CETOL 6σ Tutorial. For Pro/Engineer and Creo Parametric. The table. CETOL 6σ / ProE. Page 1
 CETOL 6σ Tutorial For Pro/Engineer and Creo Parametric The table Page 1 The Table Description: This tutorial will show you the basic functionality of CETOL 6 Sigma. An analysis normally starts with a definition
FLIR Tools for PC 7/21/2016
 FLIR Tools for PC 7/21/2016 1 2 Tools+ is an upgrade that adds the ability to create Microsoft Word templates and reports, create radiometric panorama images, and record sequences from compatible USB and
CHAPTER 5: MICROSOFT OFFICE: POWERPOINT 2010
 CHAPTER 5: MICROSOFT OFFICE: POWERPOINT 2010 Quick Summary Microsoft PowerPoint 2010 is software that can be used to effectively present information to an audience. The following objects are parts of the
SURVIVING AUSCHWITZ: Five Personal Journeys Exhibit Instructions: PAGE 1
 SURVIVING AUSCHWITZ: Five Personal Journeys Exhibit Instructions: PAGE 1 EXHIBIT INSTRUCTIONS Surviving Auschwitz: Five Personal Journeys follows the lives of five Holocaust survivors before, during, and
Miniature Effect With Tilt-Shift In Photoshop CS6
 Miniature Effect With Tilt-Shift In Photoshop CS6 This effect works best with a photo taken from high overhead and looking down on your subject at an angle. You ll also want a photo where everything is
Here s a quick overview how to access these new tools and micro-markets:
 TO: HousingAlerts.com Active Members FROM: Ken Wade SUBJECT: New Tools & New Markets Hang on! We re adding 20,000 new FREE TO YOU micro markets to your member s area, including zip code level data! We
Creo Revolve Tutorial
 Creo Revolve Tutorial Setup 1. Open Creo Parametric Note: Refer back to the Creo Extrude Tutorial for references and screen shots of the Creo layout 2. Set Working Directory a. From the Model Tree navigate
Virtual I.V. System overview. Directions for Use.
 System overview 37 System Overview Virtual I.V. 6.1 Software Overview The Virtual I.V. Self-Directed Learning System software consists of two distinct parts: (1) The basic menus screens, which present
Managing images with NewZapp
 Managing images with NewZapp This guide is for anyone using the NewZapp Fixed editor as opposed to the Drag and Drop editor. The Image Manager is where images are uploaded and stored in your NewZapp account
Optional extras. Varying the basic technique. Making a parchment that is other than square
 Optional extras Varying the basic technique CTRL + Z is your friend. This is the undo button, and I use it all the time. This handy keyboard shortcut makes experimentation so much more rewarding. Varying
Organizing artwork on layers
 3 Layer Basics Both Adobe Photoshop and Adobe ImageReady let you isolate different parts of an image on layers. Each layer can then be edited as discrete artwork, allowing unlimited flexibility in composing
Note: These directions are for Paint on WindowsXp and Vista. At the end of this tutorial are features of Paint for Windows 7.
 The Power of Paint Note: These directions are for Paint on WindowsXp and Vista. At the end of this tutorial are features of Paint for Windows 7. Your Assignment Using Paint 1. Resize an image 2. Crop an
Essential Post Processing
 Essential Post Processing By Ian Cran Preamble Getting to grips with Photoshop and Lightroom could be described in three stages. One is always learning and going through stages but there are three main
Photoshop CS6 automatically places a crop box and handles around the image. Click and drag the handles to resize the crop box.
 CROPPING IMAGES In Photoshop CS6 One of the great new features in Photoshop CS6 is the improved and enhanced Crop Tool. If you ve been using earlier versions of Photoshop to crop your photos, you ll find
How to create a cove for cove lighting in DIALux In this tutorial you will learn how to make a cove similar to the one in the following image
 How to create a cove for cove lighting in DIALux In this tutorial you will learn how to make a cove similar to the one in the following image The cove dimension will be 4 meter by 5 meter and the other
uiulearn TUTORIAL INTEGRATIONS> HOW TO USE PANOPTO (STUDENT)
") uiulearn TUTORIAL INTEGRATIONS> HOW TO USE PANOPTO (STUDENT) This tutorial covers how to record a Panopto video for your course. IN ORDER TO DO THIS, YOUR INSTRUCTOR MUST COMPLETE SEVERAL STEPS TO ALLOW
uiulearn TUTORIAL INTEGRATIONS> HOW TO USE PANOPTO (STUDENT) This tutorial covers how to record a Panopto video for your course. IN ORDER TO DO THIS, YOUR INSTRUCTOR MUST COMPLETE SEVERAL STEPS TO ALLOW
Scribble Maps Tutorial
 Scribble Maps Tutorial Go to the homepage of Scribble Maps here: h t t p : / / w w w. s c r i b b l e m a p s. c o m / Getting to know the Interface Scribble Maps is a free online mapping application with
ADDING RAIN TO A PHOTO
 ADDING RAIN TO A PHOTO Most of us would prefer to avoid being caught in the rain if possible, especially if we have our cameras with us. But what if you re one of a large number of people who enjoy taking
PlanSwift 3D Viewer Plugin User Guide
 PlanSwift 3D Viewer Plugin User Guide UPDATED ON 7/13/2018 PlanSwift Authored by: Dave Hansen 1 Table of Contents Overview... 3 Purchasing and Installation... 4 Purchasing Plugins... 4 Installation and
Part 6: Checking an existing kitchen design
 Welcome, Thank you for choosing, an innovative surveying tool for kitchen surveying. To help you get started with, we will guide you on the following pages through the registration, installation and handling
Graphic Design Tutorial: Adobe Illustrator Basics
 Graphic Design Tutorial: Adobe Illustrator Basics Open your Illustrator Use the Start Menu OR the AI icon on your desktop What is Illustrator? Illustrator is a vector drawing program. It is used to draw
Ansoft Designer Tutorial ECE 584 October, 2004
 Ansoft Designer Tutorial ECE 584 October, 2004 This tutorial will serve as an introduction to the Ansoft Designer Microwave CAD package by stepping through a simple design problem. Please note that there
Navigant Software New Features in v2.11
 Navigant Software New Features in v2.11 TRG-000 Rev A Effective Date: 00/00/00 Navigant v2.11 New Features Highlight of new features: NaviLine Automated linear navigation Automapping of Pulmonary Veins
Index of Command Functions
 Index of Command Functions version 2.3 Command description [keyboard shortcut]:description including special instructions. Keyboard short for a Windows PC: the Control key AND the shortcut key. For a MacIntosh:
Morpholio Quick Tips TracePro. Morpholio for Business 2017
 m Morpholio Quick Tips TracePro Morpholio for Business 2017 m Morpholio Quick Tips TracePro 00: Hand Gestures 01: Start a New Drawing 02: Set Your Scale 03: Set Your Pens 04: Layer Controls 05: Perspective,
Getting Started. Before You Begin, make sure you customized the following settings:
 Getting Started Getting Started Before getting into the detailed instructions for using Generative Drafting, the following tutorial aims at giving you a feel of what you can do with the product. It provides
Google Earth 101. A lesson about the basics of the Google Earth program, and how to use it with the REAL storm surge visualization tool.
 Google Earth 101 A lesson about the basics of the Google Earth program, and how to use it with the REAL storm surge visualization tool. How does Google Earth Display Maps? Using sets of information called
Page 21 GRAPHING OBJECTIVES:
 Page 21 GRAPHING OBJECTIVES: 1. To learn how to present data in graphical form manually (paper-and-pencil) and using computer software. 2. To learn how to interpret graphical data by, a. determining the
Alibre Design Tutorial: Loft, Extrude, & Revolve Cut Loft-Tube-1
 Alibre Design Tutorial: Loft, Extrude, & Revolve Cut Loft-Tube-1 Part Tutorial Exercise 5: Loft-Tube-1 [Complete] In this Exercise, We will set System Parameters first, then part options. Then, in sketch
Storybird Instructions for Patrons
 Storybird Instructions for Patrons Getting Added to a Storybird Class 1) Visit your local library, make sure you have your library card with you 2) The librarian will ask you for your Storybird username
Educator s Guide to Graphing y = mx + b
 Educator s Guide to Graphing y = mx + b Overview: Using an ipad and Sketchpad Explorer, students will graph a linear equation using the y intercept and slope. Grades and Subject Areas: High School Algebra
Entering Checkpoint Data
 Entering Checkpoint Data How do I change which Checkpoint Period I m viewing? To change the period from one to another, here are the steps: On the right side of the screen, click the grey drop-down "Change
The original image. Let s get started! The final result.
 Miniature Effect With Tilt-Shift In Photoshop CS6 In this tutorial, we ll learn how to create a miniature effect in Photoshop CS6 using its brand new Tilt-Shift blur filter. Tilt-shift camera lenses are
Google Earth Workshop Version 5
 Google Earth Workshop Version 5 From the Mitchell Home Page (http://mitchell.needham.k12.ma.us) Technology > For Teachers > Prof Dev > Google Earth Getting to Know Google Earth Taken from Google Earth
Sketch-Up Project Gear by Mark Slagle
 Sketch-Up Project Gear by Mark Slagle This lesson was donated by Mark Slagle and is to be used free for education. For this Lesson, we are going to produce a gear in Sketch-Up. The project is pretty easy
BORDERS AND FRAMES - DROP SHADOW
 BORDERS AND FRAMES - DROP SHADOW In this tutorial in our series on creating photo borders and frames in Photoshop, we ll learn how to quickly add canvas space and a drop shadow to an image to create a
Notes: Displaying Quantitative Data
 Notes: Displaying Quantitative Data Stats: Modeling the World Chapter 4 A or is often used to display categorical data. These types of displays, however, are not appropriate for quantitative data. Quantitative
Silhouette Connect Layout... 4 The Preview Window... 5 Undo/Redo... 5 Navigational Zoom Tools... 5 Cut Options... 6
 user s manual Table of Contents Introduction... 3 Sending Designs to Silhouette Connect... 3 Sending a Design to Silhouette Connect from Adobe Illustrator... 3 Sending a Design to Silhouette Connect from
Chapter 1. Picturing Distributions with Graphs
 Chapter 1. Picturing Distributions with Graphs 1 Chapter 1. Picturing Distributions with Graphs Definition. Individuals are the objects described by a set of data. Individuals may be people, but they may
Chapter 2. The Excel functions, Excel Analysis ToolPak Add-ins or Excel PHStat2 Add-ins needed to create frequency distributions are:
 I. Organizing Data in Tables II. Describing Data by Graphs Chapter 2 I. Tables: 1. Frequency Distribution (Nominal or Ordinal) 2. Grouped Frequency Distribution (Interval or Ratio data) 3. Joint Frequency