CPM Educational Program
|
|
|
- Silvia Gaines
- 5 years ago
- Views:
Transcription
1 CC COURSE 1 ETOOLS
2 Table of Contents General etools... 4 Algebra Tiles (CPM)... 5 Pattern Tile & Dot Tool (CPM)... 8 Area and Perimeter (CPM) /- Tiles & Number Lines (CPM)...13 Base Ten Blocks (CPM)...15 Table Tool (CPM)...17 Data Representations (CPM)...19 Desmos Graphing Calculator...21 Chapter CC : 1-7 Figure Student etools (CPM)...25 CC : 1-15 Student etool (CPM)...29 CC : 1-18 Student etool (CPM)...30 CC : Frog Jumping Contest Video...31 CC : 1-56 Student etool (CPM)...32 CC : 1-73 Student etool (CPM)...33 CC : 1-7 Figure Student etools (CPM)...35 Chapter CC Student etool (CPM)...40 CC : 2-33 Student etool (CPM)...41 CC : 2-43a & 2-43b Student etools (CPM)...42 Chapter CC : 3-36 Student etool (CPM)...44 CC : 3-90 Student etool (CPM)...45 CC : Frog Race Video...46 CC : Student etool (CPM)...48 CC : Student etool (CPM)...49 CC : Student etool (Desmos)...50 Chapter CC : 4-12 Student etool (CPM)...52
3 Chapter CC : 5-76 Shape 1-8 Student etools...55 CC : 5-78 Student etool...60 CC : 5-96 Trapezoid Decomposer - Method 1 Student etool (Desmos)...61 CC : 5-96 Trapezoid Decomposer - Method 2 Student etool (Desmos)...63 Chapter CC : 6-82 & 6-83 Student etools (CPM)...66 CC Student etool (CPM)...69 CC : 6-94 Student etool (CPM)...70 Chapter CC : 7-24 Student etool (Desmos)...72 Chapter CC : 8-61 Student etool (Desmos)...74 CC : 8-84 and 8-86 Student etools (Desmos)...75 Chapter CC : 9-1 3D Video...77 CC : Cube Cutting Video...79 CC : Net Demo Video...81
4 General etools Page 4

5 Algebra Tiles (CPM) This tutorial describes how to use the Algebra Tiles including additional features. Click on the "Algebra Tiles" link below. Algebra Tiles (CPM) 1. The top bar has three main parts: Gear Icon, '?' Icon, and the Arrow Icon. Select the Gear Icon to: Add notes and Title Save file. Select the '?' icon for directions. Select the Arrow Icon at the right to open and close the tray. 2. Drag tiles from the tray at the left to the display area at the right. Use the sliders in the tray to change the size of the tiles. Double click tiles to change orientation (horizontal/vertical). Click on a tile once to change the sign (+ ). Page 5


6 3. Choose from a variety of different mats. Also choose from a variety of sizes to fit on various devices. Page 6

7 4. Choose from a variety of different tiles: Page 7

8 Pattern Tile & Dot Tool (CPM) Click on the link below. Pattern Tile & Dot Tool 1. Drag tiles from the tray to the Display area. Add tiles and copy and paste them to the display area. Select all tiles and drag to the tray to remove the tiles. 2. Textboxes and Dots Located in the General Tools Drag out and choose border/no border and color. Double click to rotate. Click to add text. Page 8
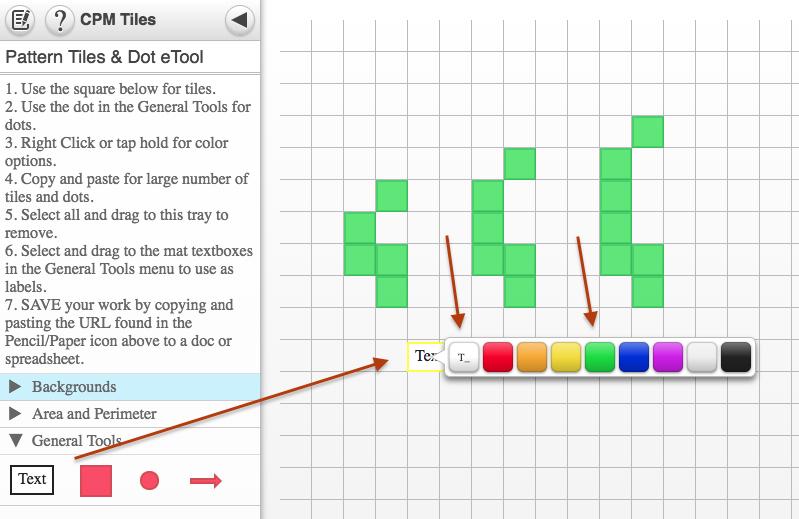
9 Page 9

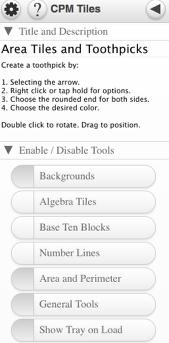
10 Area and Perimeter (CPM) Click on the "Area Tiles & Toothpicks" link below. Area and Perimeter (CPM) 1. Drag the tiles and toothpicks to the display area. Double click toothpicks to rotate. 2. Toothpicks Drag an arrow to the display area. Choose a "rounded" end for both ends to get a toothpick Choose the color. Double click to rotate. Drag to move. Page 10

11 3. Dim Area showing the perimeter more sharply. 4. In the Gear Menu, under Options: Add a title. Add a description Enable the tray and/or various menu items. Page 11
12 Page 12
13 +/- Tiles & Number Lines (CPM) Click on the "+/1 Tiles & Number Lines" link below. +/- Tiles & Number Lines (CPM) 1. Drag either the Large scale or the small scale to the display area. You can only choose one scale for each app. Drag + or tiles to the display area. 2. To add titles, drag the Drag the number line to the display area. Drag the arrows at either end to enlarge On Step, click the "+" or the "-" to change the step! Drag the number line to posiiton. Page 13

14 3. Add arrows or Text: Page 14
 1. Drag Base Ten Blocks from the tray to the display area. You can overlap them. They will snap to the grid.")
15 Base Ten Blocks (CPM) Use this tool for percents and counting out of one hundred. Click on the "Quantity Explorations" link below. Base Ten Blocks (CPM) 1. Drag Base Ten Blocks from the tray to the display area. You can overlap them. They will snap to the grid. Page 15
16 2. Double click to rotate: 3. Textbox: Open General Tools. Drag "Text" to the display area. Choose border/no border Choose color. Double click to rotate. Drag to position. Page 16

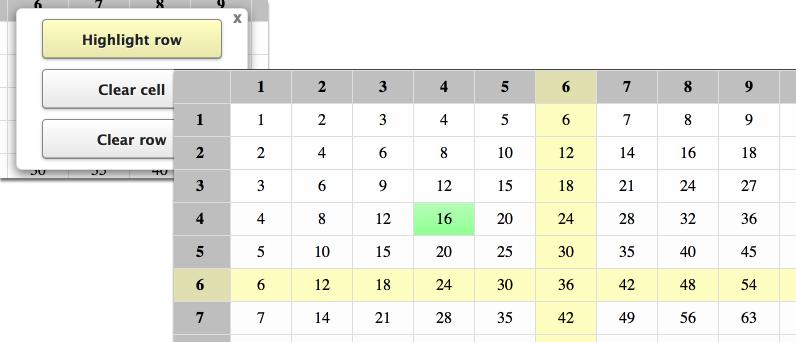
17 Table Tool (CPM) CPM Table etool 1. CPM Table etool Find patterns Highlight cells Highlight rows 2. Highlight Click on a row or column and highlight. Click on a cell and choose the color. Page 17
18 Page 18

19 Data Representations (CPM) Click the link below for CPM Data Representations" CPM Data Representations 1. CPM Data Representations: Type in up to two sets of data into the columns under the Data Sets tab. Click the wrench to sort or change the graph color. Click the Data Sets arrow to hide the data. 2. Single-Variable Statistics or the Stem and leaf Plots: When choosing Single-Variable Statistics or the Stem and Leaf Plots from the left tray, the data/plot(s) show from the right. Unclick from the left to close the trays at right. Page 19


20 3. Box Plots Note: Use the zoom in and out buttons at the upper right to position the histograms in a friendly window. On a computer, you can use the mouse wheel. On a tablet, use two fingers to pinch or spread data. Page 20

21 Desmos Graphing Calculator This free graphing calculator allows students to create a free account to save all of their graphs, animations, and projects created. Click on the "Desmos Graphing Calculator" link below. Desmos Graphing Calculator 1. Click on all of the buttons. Try it out! For extra help, click the "?". 2. Click on the interactive tours below for help to create: Sliders Tables Advanced Tables Restrictions Page 21

22 3. The interactive tours will NOT let you make a mistake! Try the links above! 4. Need additional help? Watch these very short excellent videos! Desmos Introduction Moveable Points Graph Inequalities Piece-Wise Function Page 22

23 5. The video links will help you with many of your graphing projects! 6. If you still need help, check out Desmos "Knowledge Base" Desmos Knowledge Base Page 23
24 Chapter 1 Page 24
25 CC : 1-7 Figure Student etools (CPM) Tools for 1-7 Figures A, B, C, D, and E are included. Click the links below for the 1-7 Figure Student etools (CPM)." 1-7 Figure A Student etool(cpm), 1-7 Figure B Student etool(cpm), 1-7 Figure C Student etool(cpm), 1-7 Figure D Student etool(cpm), 1-7 Figure E Student etool(cpm) 1. Use the facts below and your team to assign each fact to a Figure. Each team member clicks on one of the figure number above not showing it to anyone else. By describing your figure to others in your team, decide which fact goes with each figure. Page 25
26 2. Collaborative Learning Expectations 3. CC1 1-7 Figure A Student etool: Page 26
27 4. CC1 1-7 Figure B Student etool: 5. CC1 1-7 Figure C Student etool: Page 27
28 6. CC1 1-7 Figure D Student etool: 7. CC1 1-7 Figure E Student etool: Page 28

29 CC : 1-15 Student etool (CPM) Show patterns to build from one figure # to the next consecutive figure # Student etool (CPM) 1. CC Student etool: Use the textbox to write the patterns you found. Drag dots to the display area to color code your ideas. 2. One pattern might be to have three vertical dots colored red while two vertical dots are colored blue. How does this relate to the figure#? Page 29
30 CC : 1-18 Student etool (CPM) Click on the "1-18 Student etool (CPM)" link below Student etool Dots (CPM) 1. Create figures 4 and 5 showing the pattern of growth using various colored dots. Page 30

31 CC : Frog Jumping Contest Video Click on the Video link below to view the Frog Jumping Contest. Frog Jumping at Calaveras County 1. Frogs are given three jumps. The frog with the longest distance wins! Page 31
32 CC : 1-56 Student etool (CPM) Click on the "1-56 Student etool (CPM)" link below Student etool (CPM) 1. Use the tools to show various numerical ways to show the figure below. Drag the Text box to label each one. Text Box: Drag to the display area. Click once to type in the label. Click twice to rotate the label. 2. Students find as many numerical ways they can draw the figure above. Below is one example. Page 32

33 CC : 1-73 Student etool (CPM) Click the "1-73 Student etool (CPM)" link below Student etool 1. Fill the empty cells with the correct number by finding a pattern of numbers. 2. To change the color of a cell, click the cell and choose a color. Page 33

34 3. Answer: Students type in their answers. Click the cell again to change the color Page 34
35 CC : 1-7 Figure Student etools (CPM) Tools for 1-7 Figures A, B, C, D, and E are included. Click the links below for the 1-7 Figure Student etools (CPM)." 1-7 Figure A Student etool(cpm), 1-7 Figure B Student etool(cpm), 1-7 Figure C Student etool(cpm), 1-7 Figure D Student etool(cpm), 1-7 Figure E Student etool(cpm) 1. Use the facts below and your team to assign each fact to a Figure. Each team member clicks on one of the figure number above not showing it to anyone else. By describing your figure to others in your team, decide which fact goes with each figure. Page 35

36 2. Collaborative Learning Expectations 3. CC1 1-7 Figure A Student etool: Page 36


37 4. CC1 1-7 Figure B Student etool: 5. CC1 1-7 Figure C Student etool: Page 37


38 6. CC1 1-7 Figure D Student etool: 7. CC1 1-7 Figure E Student etool: Page 38
39 Chapter 2 Page 39
\".")
40 CC Student etool (CPM) Click the link below for the "2-13 Student etool (CPM)" Student etool (CPM) Page 40
 1. Use the area tiles and color to illustrate two ways to find area.")
41 CC : 2-33 Student etool (CPM) Click the link on below for the 2-33 Student etool (CPM)." 2-33 Student etool (CPM) 1. Use the area tiles and color to illustrate two ways to find area. Page 41
42 CC : 2-43a & 2-43b Student etools (CPM) Click on the links below. 2-43a Student etool (CPM) 2-43b Student etool (CPM) 2-43a Student etool: 2-43b Student etool: Page 42
43 Chapter 3 Page 43

44 CC : 3-36 Student etool (CPM) Click the link below to access the etool: 3-36 Student etool (CPM) Use the Base Ten Block etool to solve the problem. Shade the 100's block by dragging a red block from the General Tools over the desired portion. You can also change the color or even add grid lines to your shading. Page 44
 1. Using the colored arrows, record the frog's movements. Page 45")
45 CC : 3-90 Student etool (CPM) Click the link on below for the 3-90 Student etool (CPM)." 3-90 Student etool (CPM) 1. Using the colored arrows, record the frog's movements. Page 45
46 CC : Frog Race Video Click the link on below for the Frog Race Video" Frog Race 1. What numbers will both frogs land on? Page 46
47 2. How can you know what will be the next number? Page 47
 Click the link on below for the")

48 CC : Student etool (CPM) Click the link on below for the Student etool (CPM)." Student etool (CPM) 1. Use the colored dots and arrows to help you keep track of your ideas. 2. Your work may look like the example below. Page 48

49 CC : Student etool (CPM) Click the link on below for the Student etool (CPM)." Student etool (CPM) 1. Use the colored dots and arrows to help you keep track of your ideas. 2. Your work may look like the example below. Page 49
50 CC : Student etool (Desmos) Click the link on below for the Student etool (Desmos)" Student etool (Desmos) 1. Using the diagram, answer a-c. You can save your work digitally or use the etool to explore ideas writing your final version on graph paper. Page 50
51 Chapter 4 Page 51

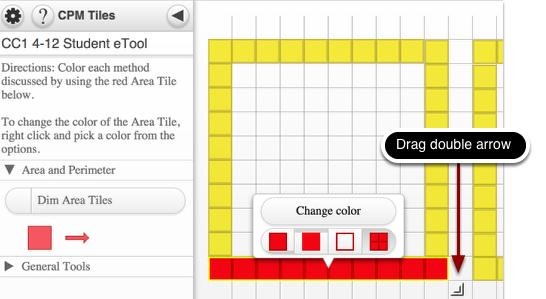
52 CC : 4-12 Student etool (CPM) Click the link on below for the 4-12 Student etool (CPM)." 4-12 Student etool (CPM) 1. Use the portion tiles and/or the arrows to show your ideas. 2. Area Tiles Drag RED tile from the tray to the display area. Drag the double arrow to enlarge in either direction. Change color. Drag to position. Page 52
53 Page 53
54 Chapter 5 Page 54
 5-76 Shape 2 Student etool (Desmos) 5-76 Shape 3 Student etool (Desmos) 5-76 Shape 4 Student etool (Desmos) 5-76 Shape 5 Student etool (Desmos) 5-76 Shape 6")
55 CC : 5-76 Shape 1-8 Student etools Click on the line below for the 5-76 Shape Student etool Shape 1 Student etool (Desmos) 5-76 Shape 2 Student etool (Desmos) 5-76 Shape 3 Student etool (Desmos) 5-76 Shape 4 Student etool (Desmos) 5-76 Shape 5 Student etool (Desmos) 5-76 Shape 6 Student etool (Desmos) 5-76 Shape 7 Student etool (Desmos) 5-76 Shape 8 Student etool (Desmos) 5-76 Shape 1 Student etool Page 55


56 5-76 Shape 2 Student etool 5-76 Shape 3 Student etool Page 56


57 5-76 Shape 4 Student etool 5-76 Shape 5 Student etool Page 57


58 5-76 Shape 6 Student etool 5-76 Shape 7 Student etool Page 58

59 5-76 Shape 8 Student etool Page 59
60 CC : 5-78 Student etool Click on the line below for the CC Student etool. CC Student etool (Desmos) CC Student etool (Desmos) Page 60
 5-96 Trapezoid Decomposer - Method 1 Student etool (Desmos) Bottom half of each of the side triangles are rotated up to form")
61 CC : 5-96 Trapezoid Decomposer - Method 1 Student etool (Desmos) Click on the line below for the 5-96 Trapezoid Decomposer - Method 1 Student etool (Desmos) Trapezoid Decomposer - Method 1 Student etool (Desmos) 5-96 Trapezoid Decomposer - Method 1 Student etool (Desmos) Bottom half of each of the side triangles are rotated up to form a rectangle. Page 61
62 Top half where the parallel sides are at the top and bottom is rotated downward to form a parallelogram. Page 62
63 CC : 5-96 Trapezoid Decomposer - Method 2 Student etool (Desmos) Click on the line below for the 5-96 Trapezoid Decomposer - Method 2 Student etool (Desmos) Trapezoid Decomposer - Method 2 Student etool (Desmos) 5-96 Trapezoid Decomposer - Method 2 Student etool (Desmos) Rotate the ORANGE dot to create a rotated duplicate of the trapezoid. Then move the blue dot to translate the blue outlined trapezoid to fit next to the shaded trapezoid.now you have doubled the area in creating a parallelogram. Page 63
64 Page 64
65 Chapter 6 Page 65
 6-83a Student etool (CPM) 6-83b Student etool (CPM) 6-83c Student etool (CPM) 1.")
66 CC : 6-82 & 6-83 Student etools (CPM) Click the link on below for the 6-82 Student etool (CPM) Student etool (CPM) 6-83a Student etool (CPM) 6-83b Student etool (CPM) 6-83c Student etool (CPM) Student etool (CPM): Page 66
: 3.")
:")
67 a Student etool (CPM): b Student etool (CPM): Page 67
68 c Student etool (CPM): Page 68
69 CC Student etool (CPM) Click the link on below for the 6-84 Student etool (CPM) Student etool (CPM) 6-84 Student etool (CPM) Page 69
70 CC : 6-94 Student etool (CPM) Click the link on below for the 6-94 Student etool (CPM) Student etool (CPM) : Page 70
71 Chapter 7 Page 71
72 CC : 7-24 Student etool (Desmos) Click the link on below for the 7-24 Student etool (Desmos)." 7-24 Student etool (Desmos) Student etool Page 72
73 Chapter 8 Page 73
74 CC : 8-61 Student etool (Desmos) Click the link on below for the 8-61 Student etool (Desmos)." 8-61 Student etool (Desmos) Student etool 1. Drag handles to position the box plot. 2. Drag upward to create a histogram 3. Click the table and add data. Page 74
75 CC : 8-84 and 8-86 Student etools (Desmos) Click the links below for the 8-84 and 8-86 Student etools (Desmos)." 8-84 Student etool (Desmos) 8-86 Student etool (Desmos) a a Page 75
76 Chapter 9 Page 76
77 CC : 9-1 3D Video The video shows the object in 3-D space. Click the link on below for the 9-1 3D Video" 9-1 Video 1. Screen shot: Page 77

78 2. Screen shot: Page 78
79 CC : Cube Cutting Video Click the link on below for the Cube Cutting Video" Cube Cutting Video 1. Screen Shot: Page 79
80 2. Screen Shot: 3. Screen Shot: Page 80

81 CC : Net Demo Video Click the link on below for the Net Demo Video" Net Demo 1. Screen Shot: 2. Screen Shot: Page 81
82 3. Screen Shot: Page 82
MAKING CONNECTIONS 1
 MAKING CONNECTIONS 1 Table of Contents General Tools... 3 Algebra Tiles (CPM)... 4 Desmos Graphing Calculator... 7 Pattern Tile & Dot Tool (CPM)...10 Area and Perimeter (CPM)...12 Base Ten Blocks (CPM)...15
CPM Educational Program
 ALGEBRA CONNECTIONS Table of Contents General Tools... 4 Algebra Tiles (CPM)... 5 Desmos Graphing Calculator... 7 Pattern Tile & Dot Tool (CPM)... 9 Data Representations (CPM)...10 Chapter 1...12 AC 1.1.2:
CPM Educational Program
 ALGEBRA CONNECTIONS Table of Contents General Tools... 3 Algebra Tiles (CPM)... 4 Desmos Graphing Calculator... 7 Pattern Tile & Dot Tool (CPM)...10 Data Representations (CPM)...12 Chapter 1...14 AC 1.1.2:
CPM Educational Program
 CC COURSE 3 ETOOLS Table of Contents General etools... 4 Algebra Tiles (CPM)... 5 Pattern Tile & Dot Tool (CPM)... 8 Base Ten Blocks (CPM)...10 Area and Perimeter (CPM)...12 Desmos Graphing Calculator...15
CPM Educational Program
 PRE-CALC. W/TRIG Table of Contents General Tools... 3 Algebra Tiles (CPM)... 4 Desmos Graphing Calculator... 7 Chapter 1...10 PCT 1.1.2: 1-14 & 1-20 Student etool...11 PCT 1.1.4: 1-43 & 1-44 Student etool...13
CPM Educational Program
 CC COURSE 2 ETOOLS Table of Contents General etools... 5 Algebra Tiles (CPM)... 6 Pattern Tile & Dot Tool (CPM)... 9 Area and Perimeter (CPM)...11 Base Ten Blocks (CPM)...14 +/- Tiles & Number Lines (CPM)...16
CC INTEGRATED 2 ETOOLS
 CC INTEGRATED 2 ETOOLS Table of Contents General etools... 3 Algebra Tiles (CPM)... 4 Pattern Tile & Dot Tool (CPM)... 7 Similarity Toolkit (CPM)... 9 Probability Tools (CPM)...11 Desmos Graphing Calculator...15
GEOMETRY CONNECTIONS
 GEOMETRY CONNECTIONS Table of Contents General Tools... 3 Algebra Tiles (CPM)... 4 Desmos Graphing Calculator... 7 Probability Tools (CPM)...10 Similarity Toolkit (CPM)...14 3D Blocks (CPM)...16 Shape
Step 1: Set up the variables AB Design. Use the top cells to label the variables that will be displayed on the X and Y axes of the graph
 Step 1: Set up the variables AB Design Use the top cells to label the variables that will be displayed on the X and Y axes of the graph Step 1: Set up the variables X axis for AB Design Enter X axis label
Core Connections, Course 2 Checkpoint Materials
 Core Connections, Course Checkpoint Materials Notes to Students (and their Teachers) Students master different skills at different speeds. No two students learn exactly the same way at the same time. At
Excel Tool: Plots of Data Sets
 Excel Tool: Plots of Data Sets Excel makes it very easy for the scientist to visualize a data set. In this assignment, we learn how to produce various plots of data sets. Open a new Excel workbook, and
Photoshop Elements Hints by Steve Miller
 2015 Elements 13 A brief tutorial for basic photo file processing To begin, click on the Elements 13 icon, click on Photo Editor in the first box that appears. We will not be discussing the Organizer portion
Create a Flowchart in Word
 Create a Flowchart in Word A flowchart is a diagram of steps, movements or actions involved in a system or activity. Flowcharts use conventional geometric symbols and arrows to define relationships and
TruEmbroidery Software Program
 Page 1 Get to Know TruE Create, an Application of the TruEmbroidery Software Program By Janie Lantz TruE Create is easy yet feature-rich digitizing software with an automated Assistant, plus many manual
Physics 253 Fundamental Physics Mechanic, September 9, Lab #2 Plotting with Excel: The Air Slide
 1 NORTHERN ILLINOIS UNIVERSITY PHYSICS DEPARTMENT Physics 253 Fundamental Physics Mechanic, September 9, 2010 Lab #2 Plotting with Excel: The Air Slide Lab Write-up Due: Thurs., September 16, 2010 Place
g. Click once on the left vertical line of the rectangle.
 This drawing will require you to a model of a truck as a Solidworks Part. Please be sure to read the directions carefully before constructing the truck in Solidworks. Before submitting you will be required
FlashChart. Symbols and Chart Settings. Main menu navigation. Data compression and time period of the chart. Chart types.
 FlashChart Symbols and Chart Settings With FlashChart you can display several symbols (for example indices, securities or currency pairs) in an interactive chart. You can also add indicators and draw on
Tutorial 2: Setting up the Drawing Environment
 Drawing size With AutoCAD all drawings are done to FULL SCALE. The drawing limits will depend on the size of the items being drawn. For example if our drawing is the plan of a floor 23.8m X 15m then we
Solving Problems. PS1 Use and apply mathematics to solve problems, communicate and reason Year 1. Activities. PS1.1 Number stories 1.
 PS1 Use and apply mathematics to solve problems, communicate and reason Year 1 PS1.1 Number stories 1 PS1.2 Difference arithmagons PS1.3 Changing orders PS1.4 Making shapes PS1.5 Odd or even? PS1.6 Odd
How to Make a Run Chart in Excel
 How to Make a Run Chart in Excel While there are some statistical programs that you can use to make a run chart, it is simple to make in Excel, using Excel s built-in chart functions. The following are
Creo Extrude Tutorial 2: Cutting and Adding Material
 Creo Extrude Tutorial 2: Cutting and Adding Material 1. Open Creo Parametric 2. File > Open > extrudeturial (From Creo Extrude Tutorial 1) 3. Cutting Material a. Click Extrude Icon > Select the following
TEKSING TOWARD STAAR MATHEMATICS GRADE 6. Student Book
 TEKSING TOWARD STAAR MATHEMATICS GRADE 6 Student Book TEKSING TOWARD STAAR 2014 Six Weeks 1 Lesson 1 STAAR Category 1 Grade 6 Mathematics TEKS 6.2A/6.2B Problem-Solving Model Step Description of Step 1
TURN A PHOTO INTO A PATTERN OF COLORED DOTS (CS6)
") TURN A PHOTO INTO A PATTERN OF COLORED DOTS (CS6) In this photo effects tutorial, we ll learn how to turn a photo into a pattern of solid-colored dots! As we ll see, all it takes to create the effect is
TURN A PHOTO INTO A PATTERN OF COLORED DOTS (CS6) In this photo effects tutorial, we ll learn how to turn a photo into a pattern of solid-colored dots! As we ll see, all it takes to create the effect is
Kitchen and Bath Design Tutorial
 Kitchen and Bath Design Tutorial This tutorial continues where the Interior Design Tutorial left off. You should save this tutorial using a new name to archive your previous work. The tools and techniques
PASS Sample Size Software. These options specify the characteristics of the lines, labels, and tick marks along the X and Y axes.
 Chapter 940 Introduction This section describes the options that are available for the appearance of a scatter plot. A set of all these options can be stored as a template file which can be retrieved later.
Evaluation Chapter by CADArtifex
 The premium provider of learning products and solutions www.cadartifex.com EVALUATION CHAPTER 2 Drawing Sketches with SOLIDWORKS In this chapter: Invoking the Part Modeling Environment Invoking the Sketching
TeleTrader FlashChart
 TeleTrader FlashChart Symbols and Chart Settings With TeleTrader FlashChart you can display several symbols (for example indices, securities or currency pairs) in an interactive chart. You can also add
Use the and buttons on the right to go line by line, or move the slider bar in the middle for a quick canning.
 How To Use The IntelliQuilter Help System The user manual is at your fingertips at all times. Extensive help messages will explain what to do on each screen. If a help message does not fit fully in the
Alibre Design Tutorial: Loft, Extrude, & Revolve Cut Loft-Tube-1
 Alibre Design Tutorial: Loft, Extrude, & Revolve Cut Loft-Tube-1 Part Tutorial Exercise 5: Loft-Tube-1 [Complete] In this Exercise, We will set System Parameters first, then part options. Then, in sketch
NCSS Statistical Software
 Chapter 147 Introduction A mosaic plot is a graphical display of the cell frequencies of a contingency table in which the area of boxes of the plot are proportional to the cell frequencies of the contingency
Overview. The Game Idea
 Page 1 of 19 Overview Even though GameMaker:Studio is easy to use, getting the hang of it can be a bit difficult at first, especially if you have had no prior experience of programming. This tutorial is
Ansoft Designer Tutorial ECE 584 October, 2004
 Ansoft Designer Tutorial ECE 584 October, 2004 This tutorial will serve as an introduction to the Ansoft Designer Microwave CAD package by stepping through a simple design problem. Please note that there
Note: These directions are for Paint on WindowsXp and Vista. At the end of this tutorial are features of Paint for Windows 7.
 The Power of Paint Note: These directions are for Paint on WindowsXp and Vista. At the end of this tutorial are features of Paint for Windows 7. Your Assignment Using Paint 1. Resize an image 2. Crop an
BORDERS AND FRAMES - DROP SHADOW
 BORDERS AND FRAMES - DROP SHADOW In this tutorial in our series on creating photo borders and frames in Photoshop, we ll learn how to quickly add canvas space and a drop shadow to an image to create a
Chapter 4: Patterns and Relationships
 Chapter : Patterns and Relationships Getting Started, p. 13 1. a) The factors of 1 are 1,, 3,, 6, and 1. The factors of are 1,,, 7, 1, and. The greatest common factor is. b) The factors of 16 are 1,,,,
Quilt Pro 6 Lesson Quilt in a Quilt
 Quilt Pro 6 Lesson Quilt in a Quilt Quilt in a Quilt The Inner Quilt This quilt is a very complex design. We will cover a unique technique not covered in the manual. While any one can master the techniques
2. Creating and using tiles in Cyberboard
 2. Creating and using tiles in Cyberboard I decided to add some more detail to the first hexed grip map that I produced (Demo1) using the Cyberboard Design program. To do this I opened program by clicking
Middle School Geometry. Session 2
 Middle School Geometry Session 2 Topic Activity Name Page Number Related SOL Spatial Square It 52 6.10, 6.13, Relationships 7.7, 8.11 Tangrams Soma Cubes Activity Sheets Square It Pick Up the Toothpicks
33-2 Satellite Takeoff Tutorial--Flat Roof Satellite Takeoff Tutorial--Flat Roof
 33-2 Satellite Takeoff Tutorial--Flat Roof Satellite Takeoff Tutorial--Flat Roof A RoofLogic Digitizer license upgrades RoofCAD so that you have the ability to digitize paper plans, electronic plans and
Assignment 5 due Monday, May 7
 due Monday, May 7 Simulations and the Law of Large Numbers Overview In both parts of the assignment, you will be calculating a theoretical probability for a certain procedure. In other words, this uses
Brief introduction Maths on the Net Year 2
 Brief introduction Maths on the Net Year 2 Mildenberger Verlag 77652 Offenburg Im Lehbühl 6 Tel. + 49 (7 81) 91 70-0 Fax + 49 (7 81) 91 70-50 Internet: www.mildenberger-verlag.de E-Mail: info@mildenberger-verlag.de
New Sketch Editing/Adding
 New Sketch Editing/Adding 1. 2. 3. 4. 5. 6. 1. This button will bring the entire sketch to view in the window, which is the Default display. This is used to return to a view of the entire sketch after
Addendum 27: Personalized Meander
 Addendum 27: Personalized Meander About the Author: Lynn Mintz Photo Lynn Mintz is a Florida resident. She spends summers in New Jersey. Lynn has been quilting, embroidering and digitizing for 20 years.
GRADE 3 TEKS ALIGNMENT CHART
 GRADE 3 TEKS ALIGNMENT CHART TEKS 3.2.A compose and decompose numbers up to,000 as the sum of so many ten thousands, so many thousands, so many hundreds, so many tens, and so many ones using objects, pictorial
BEST PRACTICES COURSE WEEK 14 PART 2 Advanced Mouse Constraints and the Control Box
 BEST PRACTICES COURSE WEEK 14 PART 2 Advanced Mouse Constraints and the Control Box Copyright 2012 by Eric Bobrow, all rights reserved For more information about the Best Practices Course, visit http://www.acbestpractices.com
Creating Journey In AgentCubes
 DRAFT 3-D Journey Creating Journey In AgentCubes Student Version No AgentCubes Experience You are a traveler on a journey to find a treasure. You travel on the ground amid walls, chased by one or more
High Speed Motion Trail Effect With Photoshop
 High Speed Motion Trail Effect With Photoshop Written by Steve Patterson. In this Photo Effects tutorial, we'll learn how to add a sense of speed to an object using an easy to create motion blur effect!
1. Use Pattern Blocks. Make the next 2 figures in each increasing pattern. a) 2. Write the pattern rule for each pattern in question 1.
 2. Write the pattern rule for each pattern in question 1.") s Master 1.22 Name Date Extra Practice 1 Lesson 1: Exploring Increasing Patterns 1. Use Pattern Blocks. Make the next 2 figures in each increasing pattern. a) 2. Write the pattern rule for each pattern
s Master 1.22 Name Date Extra Practice 1 Lesson 1: Exploring Increasing Patterns 1. Use Pattern Blocks. Make the next 2 figures in each increasing pattern. a) 2. Write the pattern rule for each pattern
NAME DATE CLASS NOTES
 NAME DATE CLASS NOTES How do painters design murals so large that you can only see them from a distance? In most cases, designs for large projects like murals are first created as small pieces of art.
Problem of the Month: Between the Lines
 Problem of the Month: Between the Lines Overview: In the Problem of the Month Between the Lines, students use polygons to solve problems involving area. The mathematical topics that underlie this POM are
ACI Sketch. Copyright October 2008, ACI All Rights Reserved. 24 Old Kings Road North Palm Coast, FL appraiserschoice.com
 ACI Sketch Copyright October 2008, ACI All Rights Reserved 24 Old Kings Road North Palm Coast, FL 32137 appraiserschoice.com 800.234.8727 ACI Sketch Contents Getting Started 1 Working with the Grid 2 Unit
Kitchen and Bath Design Tutorial
 Kitchen and Bath Design Tutorial This tutorial continues where the Interior Design Tutorial left off. You should save this tutorial using a new name to archive your previous work. The tools and techniques
1. Create a 2D sketch 2. Create geometry in a sketch 3. Use constraints to position geometry 4. Use dimensions to set the size of geometry
 2.1: Sketching Many features that you create in Fusion 360 start with a 2D sketch. In order to create intelligent and predictable designs, a good understanding of how to create sketches and how to apply
Cricut Design Space App for ipad User Manual
 Cricut Design Space App for ipad User Manual Cricut Explore design-and-cut system From inspiration to creation in just a few taps! Cricut Design Space App for ipad 1. ipad Setup A. Setting up the app B.
Using the zoom adjustment, zoom on the gel Adjust the tray on the VGAU 3000 to see the image of the gel in the viewfinder
 Operation of Vakili 3000 Gel Analysis Unit Both qualitative and quantitative analysis of electrophoresis experiments can be accomplished by using the Vakili 3000 Gel Analysis Unit. There are three steps
MANAGEMENT REPORT QUICK START GUIDE
 MANAGEMENT REPORT QUICK START GUIDE Page 1 of 10 THE MANAGEMENT REPORT Welcome to the Practice Pipeline Management Report. With this easy-to-use tool, you can analyze, edit and export the progress statistics
Mathematics Expectations Page 1 Grade 04
 Mathematics Expectations Page 1 Problem Solving Mathematical Process Expectations 4m1 develop, select, and apply problem-solving strategies as they pose and solve problems and conduct investigations, to
Kitchen and Bath Design Tutorial
 Kitchen and Bath Design Tutorial This tutorial continues where the Interior Design Tutorial left off. You should save this tutorial using a new name to archive your previous work. The tools and techniques
CREATING (AB) SINGLE- SUBJECT DESIGN GRAPHS IN MICROSOFT EXCEL Lets try to graph this data
 SINGLE- SUBJECT DESIGN GRAPHS IN MICROSOFT EXCEL Lets try to graph this data") CREATING (AB) SINGLE- SUBJECT DESIGN GRAPHS IN MICROSOFT EXCEL 2003 Lets try to graph this data Date Baseline Data Date NCR (intervention) 11/10 11/11 11/12 11/13 2 3 3 1 11/15 11/16 11/17 11/18 3 3 2
CREATING (AB) SINGLE- SUBJECT DESIGN GRAPHS IN MICROSOFT EXCEL 2003 Lets try to graph this data Date Baseline Data Date NCR (intervention) 11/10 11/11 11/12 11/13 2 3 3 1 11/15 11/16 11/17 11/18 3 3 2
2 a Shade one more square to make a pattern with just one line of symmetry.
 GM2 End-of-unit Test Rotate the shape 80 about point P. P 2 a Shade one more square to make a pattern with just one line of symmetry. b Shade one more square to make a pattern with rotational symmetry
PASS Sample Size Software
 Chapter 945 Introduction This section describes the options that are available for the appearance of a histogram. A set of all these options can be stored as a template file which can be retrieved later.
Building Concepts: Fractions and Unit Squares
 Lesson Overview This TI-Nspire lesson, essentially a dynamic geoboard, is intended to extend the concept of fraction to unit squares, where the unit fraction b is a portion of the area of a unit square.
ADMS 5 MapInfo Link. User Guide CERC
 ADMS 5 MapInfo Link User Guide CERC ADMS 5 MapInfo Link User Guide November 2012 Cambridge Environmental Research Consultants Ltd 3 King s Parade Cambridge CB2 1SJ Telephone: +44 (0)1223 357773 Fax: +44
Numicon Software for the Interactive Whiteboard v2.0 Getting Started Guide
 Numicon Software for the Interactive Whiteboard v2.0 Getting Started Guide Introduction 2 Getting Started 3 4 Resources 10 2 Getting Started Guide page 2 of 10 Introduction Thank you for choosing the Numicon
Drawing Layouts Paper space & Model Space
 Drawing Layouts Paper space & Model Space Users of Bricscad will have seen the tabs at the bottom left of the drawings area labelled: Model, Layout1, Layout2 but may not know how to use them or what they
Mathematics, Grade 8
 Session 1, Multiple-Choice Questions Use the scatter plot to answer question 1. 1. In the scatter plot, each dot represents one student who participated in the 50-meter race. Ben is 15 years old. Based
WORD ART - CHANGING LETTERING SPACING
 CHANGING LETTERING SIZE Enter single letters or words and use the icon to rescale the motif. When the Maintaining Proportions (lock) icon is outlined in white, the design will be resized proportionately.
Creo Revolve Tutorial
 Creo Revolve Tutorial Setup 1. Open Creo Parametric Note: Refer back to the Creo Extrude Tutorial for references and screen shots of the Creo layout 2. Set Working Directory a. From the Model Tree navigate
Version 6.1. Instructional Days: 11-14
 Instructional Days: 11-14 Topic Description: In this lesson, students learn how computers can be used as a tool for visualizing data, modeling and design, and art in the context of culturally situated
Drawing Bode Plots (The Last Bode Plot You Will Ever Make) Charles Nippert
 Charles Nippert") Drawing Bode Plots (The Last Bode Plot You Will Ever Make) Charles Nippert This set of notes describes how to prepare a Bode plot using Mathcad. Follow these instructions to draw Bode plot for any transfer
Drawing Bode Plots (The Last Bode Plot You Will Ever Make) Charles Nippert This set of notes describes how to prepare a Bode plot using Mathcad. Follow these instructions to draw Bode plot for any transfer
Using Dynamic Views. Module Overview. Module Prerequisites. Module Objectives
 Using Dynamic Views Module Overview The term dynamic views refers to a method of composing drawings that is a new approach to managing projects. Dynamic views can help you to: automate sheet creation;
Properties Range% - Minutes - Restart - Box Size Initial % -
 Price Histogram The Price Histogram study draws horizontal rows of boxes, markers or letters. The rows are drawn at different lengths and price levels. The length of a row represents the number of times
Turn A Photo Into A Collage Of Polaroids With Photoshop
 http://www.photoshopessentials.com/photo-effects/polaroids/ Turn A Photo Into A Collage Of Polaroids With Photoshop Written by Steve Patterson. In this Photoshop Effects tutorial, we ll learn how to take
The Snipping Tool is automatically installed in Windows 7 and Windows 8.
 Introduction The Snipping Tool is a program that is part of Windows Vista, Windows 7, and Window 8. Snipping Tool allows you to take selections of your windows or desktop and save them as snips, or screen
Getting Started. with Easy Blue Print
 Getting Started with Easy Blue Print User Interface Overview Easy Blue Print is a simple drawing program that will allow you to create professional-looking 2D floor plan drawings. This guide covers the
12. Creating a Product Mockup in Perspective
 12. Creating a Product Mockup in Perspective Lesson overview In this lesson, you ll learn how to do the following: Understand perspective drawing. Use grid presets. Adjust the perspective grid. Draw and
Mrs. Ambre s Math Notebook
 Mrs. Ambre s Math Notebook Almost everything you need to know for 7 th grade math Plus a little about 6 th grade math And a little about 8 th grade math 1 Table of Contents by Outcome Outcome Topic Page
Tutorial 1: Install Forecaster HD (Win XP, Vista, 7, 8)
") Tutorial 1: Install Forecaster HD (Win XP, Vista, 7, 8) Download Forecaster HD (FHD) from Community s website http://www.communitypro.com/productlist/135-forecaster-ceiling-system-software Open Setup.exe
Tutorial 1: Install Forecaster HD (Win XP, Vista, 7, 8) Download Forecaster HD (FHD) from Community s website http://www.communitypro.com/productlist/135-forecaster-ceiling-system-software Open Setup.exe
ARCHICAD Introduction Tutorial
 Starting a New Project ARCHICAD Introduction Tutorial 1. Double-click the Archicad Icon from the desktop 2. Click on the Grey Warning/Information box when it appears on the screen. 3. Click on the Create
TenMarks Curriculum Alignment Guide: EngageNY/Eureka Math, Grade 7
 EngageNY Module 1: Ratios and Proportional Relationships Topic A: Proportional Relationships Lesson 1 Lesson 2 Lesson 3 Understand equivalent ratios, rate, and unit rate related to a Understand proportional
Tutorial 4: Overhead sign with lane control arrows:
 Tutorial 4: Overhead sign with lane control arrows: SignCAD Analysis The sign above splits multilane freeway traffic into two routes/destinations. It uses the overhead lane control arrows. The top half
Silhouette Connect Layout... 4 The Preview Window... 5 Undo/Redo... 5 Navigational Zoom Tools... 5 Cut Options... 6
 user s manual Table of Contents Introduction... 3 Sending Designs to Silhouette Connect... 3 Sending a Design to Silhouette Connect from Adobe Illustrator... 3 Sending a Design to Silhouette Connect from
We recommend downloading the latest core installer for our software from our website. This can be found at:
 Dusk Getting Started Installing the Software We recommend downloading the latest core installer for our software from our website. This can be found at: https://www.atik-cameras.com/downloads/ Locate and
Chapter 6: TVA MR and Cardiac Function
 Chapter 6 Cardiac MR Introduction Chapter 6: TVA MR and Cardiac Function The Time-Volume Analysis (TVA) optional module calculates time-dependent behavior of volumes in multi-phase studies from MR. An
Similarity and Ratios
 " Similarity and Ratios You can enhance a report or story by adding photographs, drawings, or diagrams. Once you place a graphic in an electronic document, you can enlarge, reduce, or move it. In most
To Explore the Properties of Parallelogram
 Exemplar To Explore the Properties of Parallelogram Objective To explore the properties of parallelogram Dimension Measures, Shape and Space Learning Unit Quadrilaterals Key Stage 3 Materials Required
Starting a 3D Modeling Part File
 1 How to Create a 3D Model and Corresponding 2D Drawing with Dimensions, GDT (Geometric Dimensioning and Tolerance) Symbols and Title Block in SolidWorks 2013-2014 By Edward Locke This tutorial will introduce
House Design Tutorial
 Chapter 2: House Design Tutorial This House Design Tutorial shows you how to get started on a design project. The tutorials that follow continue with the same plan. When you are finished, you will have
Creating Photo Borders With Photoshop Brushes
 Creating Photo Borders With Photoshop Brushes Written by Steve Patterson. In this Photoshop photo effects tutorial, we ll learn how to create interesting photo border effects using Photoshop s brushes.
Let s start by making a pencil, that can be used to draw on the stage.
 Paint Box Introduction In this project, you will be making your own paint program! Step 1: Making a pencil Let s start by making a pencil, that can be used to draw on the stage. Activity Checklist Start
Motic Live Imaging Module. Windows OS User Manual
 Motic Live Imaging Module Windows OS User Manual Motic Live Imaging Module Windows OS User Manual CONTENTS (Linked) Introduction 05 Menus, bars and tools 06 Title bar 06 Menu bar 06 Status bar 07 FPS 07
Adding Graphics to a Presentation
 Lesson 8 Page 1 Adding Graphics to a Presentation Lesson Skill Matrix Skill Exam Objective Objective Number Inserting and Formatting Images Insert images. Display alignment tools. Resize and crop images.
Photoshop Backgrounds: Turn Any Photo Into A Background
 Photoshop Backgrounds: Turn Any Photo Into A Background Step 1: Duplicate The Background Layer As always, we want to avoid doing any work on our original image, so before we do anything else, we need to
Adding Graphics to a Presentation
 8 Adding Graphics to a Presentation LESSON SKILL MATRIX Skill Exam Objective Objective Number Inserting and Formatting Images Adding Shapes to Slides Ordering and Grouping Shapes Insert images. Display
CETOL 6σ Tutorial. For Pro/Engineer and Creo Parametric. The table. CETOL 6σ / ProE. Page 1
 CETOL 6σ Tutorial For Pro/Engineer and Creo Parametric The table Page 1 The Table Description: This tutorial will show you the basic functionality of CETOL 6 Sigma. An analysis normally starts with a definition
Microsoft Excel Lab Two (Completed 03/02/18) Transcript by Rev.com. Page 1 of 6
 Transcript by Rev.com. Page 1 of 6") [00:00:31] Speaker 1: Hello everyone and welcome to excel lab two. To get started with this lab you will need two files. You will need excel lab two instructions file also, you will need excel lab two
[00:00:31] Speaker 1: Hello everyone and welcome to excel lab two. To get started with this lab you will need two files. You will need excel lab two instructions file also, you will need excel lab two
Vectorworks / MiniCAD Tutorials
 Vectorworks / MiniCAD Tutorials Tutorial 1: Construct a simple model of a little house Tutorial 2: Construct a 4 view Orthographic drawing of the Model These tutorials are available as Adobe Acrobat 4
Create new drawing. Select Collection. Manage graphs. Collection Name. Graphs preview
 Create new drawing Select Collection Collection Name Manage graphs Graphs preview Duplicate selection Move selection Delete selection Select All drawings Exit Share selection Selected graphs Add new Collection
ACDSee Pro 3 tutorials: Process mode overview
 ACDSee Pro 3 tutorials: Process overview After you have organized and viewed your images in Manage and View s, you are ready to take your images into Process for developing and editing. Start in to do
Essential Post Processing
 Essential Post Processing By Ian Cran Preamble Getting to grips with Photoshop and Lightroom could be described in three stages. One is always learning and going through stages but there are three main