Develop a PWL System for Dense Graded Hot Mix Asphalt Construction, Including Pay Factors
|
|
|
- Brett Welch
- 5 years ago
- Views:
Transcription

1 NDOT Research Report Report No Develop a PWL System for Dense Graded Hot Mix Asphalt Construction, Including Pay Factors January 2015 Nevada Department of Transportation 1263 South Stewart Street Carson City, NV 89712
2 Disclaimer This work was sponsored by the Nevada Department of Transportation. The contents of this report reflect the views of the authors, who are responsible for the facts and the accuracy of the data presented herein. The contents do not necessarily reflect the official views or policies of the State of Nevada at the time of publication. This report does not constitute a standard, specification, or regulation.
3 DEVELOP A PWL SYSTEM FOR DENSE GRADED HOT MIX ASPHALT CONSTRUCTION, INCLDUING PAY FACTORS NEVADA DEPARTMENT OF TRANSPORATION Research Division 1263 South Stewart Street Carson City, Nevada Research Report No. 3 January, 2015 UNIVERSITY OF NEVADA, RENO Pavements/Materials Program Department of Civil and Environmental Engineering College of Engineering University of Nevada Reno, Nevada 89557
4 Technical Report Documentation Page 1. Report No. 2. Government Accession No. 3. Recipient s Catalog No. 4. Title and Subtitle Develop a PWL System for Dense Graded Hot Mix Asphalt Construction, Including Pay Factors 7. Author(s) Peter E. Sebaaly, Roger Schlierkamp, Cristian Diaz, Elie Hajj, and Mena Souliman 5. Report Date January 6, Performing Organization Code University of Nevada, Reno 8. Performing Organization Report No. WRSC-UNR-PWL Performing Organization Name and Address Western Regional Superpave Center Pavements/Materials Program Department of Civil and Environmental Engineering University of Nevada 1664 N. Virginia Street/Mail Stop 258 Reno, Nevada Sponsoring Agency Name and Address Nevada Department of Transportation 1263 South Stewart Street Carson City, Nevada Work Unit No. 11. Contract or Grant No. 13. Type of Report and Period Covered 14. Sponsoring Agency Code 15. Supplementary Notes This report is accompanied by a PWL software which conducts all applicable calculations 16. Abstract This research project developed a PWL system that the Nevada DOT can effectively implement on the construction of dense graded HMA mixtures. The PWL system includes pay factors that are based on pavement performance indicators such as rutting and cracking. In addition, the developed PWL System is incorporated into a user-oriented software that is capable of analyzing the relevant data, establishing the PWL values, and applying the appropriate pay adjustments. The research was completed over three phases: Phase I Review of Existing PWL Specification Systems: this phase reviewed several PWL specification systems for HMA construction. Based on the findings of the review, the research team recommended the general framework of the PWL system to be developed in Phase II. Phase II Develop the PWL Specification System: this phase developed the PWL system. The developed system uses several materials and mixtures properties to identify the PWLs for all sublots and lots of HMA mixtures. Weight factors are identified for each of the materials and mixtures properties leading to the development of a single PWL for each lot within a construction project. Phase III Implement the Specifications: this phase will implement the developed PWL system on several NDOT projects and uses the data from these projects to fine tune the system. 17. Key Words Hot Mix Asphalt, PWL, Performance 19. Security Classif. (of this report) Unclassified 20. Security Classif. (of this page) Unclassified 18. Distribution Statement No restriction. 21. No. of Pages Price Free i
5 SI* (MODERN METRIC) CONVERSION FACTORS APPROXIMATE CONVERSIONS TO SI UNITS Symbol When you know Multiply by To find Symbol LENGTH in inches 25.4 millimeters mm ft feet meters m yd yards meters m mi miles 1.61 kilometers km AREA in 2 square inches square millimeters mm 2 ft 2 square feet square meters m 2 yd 2 square yard square meters m 2 ac acres hectares ha mi 2 square miles 2.59 square kilometers km 2 VOLUME fl oz fluid ounces milliliters ml gal gallons liters L ft 3 cubic feet cubic meters m 3 yd 3 cubic yards cubic meters m 3 NOTE: volumes greater than 1000 L shall be shown in m 3 MASS oz ounces grams g lb pounds kilograms kg T short tons (2000 lb) megagrams (or "metric ton") Mg (or "t") TEMPERATURE (exact degrees) o F Fahrenheit 5 (F-32)/9 or (F-32)/1.8 Celsius o C ILLUMINATION fc foot-candles lux lx fl foot-lamberts candela/m 2 cd/m 2 FORCE and PRESSURE or STRESS lbf poundforce 4.45 newtons N lbf/in 2 poundforce per square inch 6.89 kilopascals kpa APPROXIMATE CONVERSIONS TO SI UNITS Symbol When you know Multiply by To find Symbol LENGTH mm millimeters inches in m meters 3.28 feet ft m meters 1.09 yards yd km kilometers miles mi AREA mm 2 square millimeters square inches in 2 m 2 square meters square feet ft 2 m 2 square meters square yards yd 2 ha hectares 2.47 acres ac km 2 square kilometers square miles mi 2 VOLUME ml milliliters fluid ounces fl oz L liters gallons gal m 3 cubic meters cubic feet ft 3 m 3 cubic meters cubic yards yd 3 MASS g grams ounces oz kg kilograms pounds lb Mg (or "t") megagrams (or "metric ton") short tons (2000 lb) T TEMPERATURE (exact degrees) o C Celsius 1.8C+32 Fahrenheit o F ILLUMINATION lx cd/m 2 lux candela/m foot-candles foot-lamberts fc fl FORCE and PRESSURE or STRESS N newtons poundforce lbf kpa kilopascals poundforce per square inch lbf/in 2 ii
6 TABLE OF CONTENTS TABLE OF CONTENTS... iii LIST OF FIGURES... iv LIST OF TABLES... v CHAPTER 1. INTRODUCTION Overall Research Objective Scope of Work... 5 CHAPTER 2. REVIEW OF EXISTING PWL SPECIFICATION SYSTEMS Distribution of Data Variability of Data Percent within Limits Sample Calculations Review of PWL Systems a Type of Data Used in PWL b Definition of Lot and Sublot c Measured Properties d Determination of Overall PWL and Pay Adjustment e Specification Limits Recommendations of Phase I CHAPTER 3. DEVELOPMENT OF THE PWL SPECIFICATION SYSTEM Data Collection Data Analyses and Results a Distribution of Measured Properties Against JMF b Impact of Project Size and Presence of RAP c Identify Critical Sieves on Aggregate Gradations d Adequacy of Measurements and Reported Data Values e Sizes and Construction Limits on Sublots and Lots Determination of Weight Factors Applications of the AASHTO Pay Factors CHAPTER 4. IMPLEMENTATION OF THE PWL SYSTEM Implementation Plan PWL Software REFRENCES iii
7 LIST OF FIGURES Figure 1. Typical normal distribution of measured asphalt content... 6 Figure 2. Illustrations of data variations... 8 Figure 3. Total HMA production (in tons) for the selected NDOT contracts Figure 4. Daily Plant Report of Asphalt Mixtures (Contract No RAP) Figure 5. Nuclear Thin Layer Compaction Report (Contract No RAP) Figure 6. Control chart for percentage of aggregates passing ¾ sieve (Contract 3339) Figure 7. Control chart for asphalt content (Contract 3339) Figure 8. Percentage of violations for contracts with total production less than 90,000 tons versus contracts with total production of 90,000 tons or more...32 Figure 9. Percentage of violations for contracts without RAP versus contracts with RAP Figure 10. Percentage violations in the aggregate sieve sizes Figure 11. Continuity of production versus lot definition: Example Figure 12. Continuity of production versus lot definition: Example Figure 13. Calculated PWL (%) for all nine NDOT contracts Figure 14. Calculated pay factors (%) for all nine NDOT contracts Figure 15. Gain/loss per lot ($) versus lot number (Contract 3466 RAP) Figure 16. Cumulative gain per lot ($) versus lot number (Contract 3466 RAP) iv
8 LIST OF TABLES Table 1. Mix Property Acceptance Attributes for 40 States (1) Table 2. Density Attributes for 40 States (1) Table 3. Pay Adjustment Attributes for 40 States (1) Table 4. A PWL Estimation Table for Sample Size n = 5 (3) Table 5. Type of Data used in PWL Table 6. Size of Lot and Sublot of HMA Mix Table 7. Properties used for PWL and Pay Adjustment Table 8. Pay Factors for the Arizona PWL System Table 9. Pay Factors for the California System Table 10. Pay Factors for the Colorado System Table 11. Pay Factors for the Idaho System Table 12. Pay Factors for the New Mexico System Table 13. Pay Factors for the New York System Table 14. Pay Factors for the Utah System Table 15. Pay Factors for the Washington System Table 16. Specification limits for properties used for PWL and Pay Adjustment Table 17. Nevada s Contracts Considered in The Study Table 18. Percentage of Observed Specification Violation Table 19. Impact of Decimals on the Calculated PWL Values Table 20. Sources of Variability and Violation Levels Considered in the Impact of Construction Variability Study Table 21. Effect of the Single Factor Violations on the Performance of Polymer-Modified Asphalt Mixtures Table 22. Performance Related Weight Factors for Northern Mixtures Table 23. Performance Related Weight Factors for Southern Mixtures v
9 CHAPTER 1. INTRODUCTION There are three essential steps for the successful construction of hot mix asphalt (HMA) pavements: mix design, production, and quality control/quality assurance (QC/QA). Every State Highway Agency (SHA) has well documented procedures for each of the three steps. However, the processes used in each of the three steps differ significantly among SHAs especially in the area of QC/QA. Since the subject of this report is mainly related to the Percent within Limit (PWL) system, only the QC/QA process will be discussed due to its direct application in the PWL. Quality control represents the testing program that the contractor is required to conduct in order to assess the uniformity and acceptability of the produced HMA mix. Quality assurance represents the testing program that the SHA conducts in order to assess the conformance of the produced HMA mix with the agency s applicable specifications. For final acceptance of the HMA mix, some agencies use both the QC and QA testing results while others use only the QA testing results. The specific properties measured in the QC and QA programs also vary significantly among SHAs. In 1998, Schmitt et al conducted a survey on the various properties that are measured through the QA programs in 40 states (1). The survey identified three fundamental measures of acceptance testing: mix properties, density, and smoothness. Tables 1 and 2 summarize the mix properties and density attributes identified by Schmitt et al, respectively. The mix properties that are commonly used for acceptance include: aggregate gradation, asphalt content, and mix volumetrics. The data presented in Tables 1 and 2 show that there are significant variations among the practices used by various SHAs in terms of: size of sublots and lots, sampling location, testing methods, and compliance measure (i.e. method used to measure conformance with the specification). Tables 1 and 2 show that the majority of the SHAs use the Quality Level Analysis to measure the compliance of the HMA mixtures to the agency s specifications. In addition, the most common Quality Level Analysis is the PWL process. This indicates that the use of the PWL method for evaluating the compliance of HMA mixtures to SHAs specifications has been very popular. The survey conducted by Schmitt et al also looked at the use of the measured properties to identify pay adjustment that can be applied to the overall cost of the HMA mix (1). Table 3 summarizes the various properties that have been used in the calculations of pay adjustments by various SHAs. A review of the data in Table 3 indicates the followings: The majority of the SHAs establish a Factor which may lead to a penalty or bonus for their pay adjustment. The majority of the SHAs use aggregate gradation, asphalt content, air voids, field density, and smoothness as measures of compliance with specifications. The percent passing #200 is the most commonly used gradation attribute. The majority of the SHAs use a weighted approach to combine the impact of the various attributes toward the final pay adjustment. 1
10 Attribute Table 1. Mix Property Acceptance Attributes for 40 States (1). Sublot Size 1 per 500 tons to 1 per 900 tons 1 per 1,000 tons to 1 per 2,000 tons 1 per 3 hours 4 samples Variable Lot Size 1 per 500 tons to 5 per 6,000 tons 1 to 4 per day 4 Sublots Project Total per Mix Design Variable Cumulative Continuous Sampling Location a Coldfeeds or Hot Bins Plant Discharge Truck Windrow Volume Analysis Mat Asphalt Content Testing Methods b Extraction Nuclear Gauge Ignition Oven Plant Record Tank Stickings Specific Gravity Compliance Measure c Quality Level Analysis Absolute Average deviation Moving Average Average Range Aggregate Gradation Number of States Specifying Asphalt Content Note: 1 ton = 0.91 Mg a States may specify multiple locations for aggregates gradation and asphalt content b States may specify multiple testing options for asphalt content c One or more compliance measures may be specified within a state (i.e. may vary by property being measured) Mix Volumetrics
11 Table 2. Density Attributes for 40 States (1). Attribute Number of States Specifying Sublot Size 1 per 80 to 1 per 1,500 tons to 600 meters 5 1 to 5 per day 4 Square yards 1 Square meters 1 Variable 1 None 9 Lot Size 1 per 400 to 1 per 6,000 tons 17 5 to 10 per day to 1,500 meters 5 Total per Mix design 4 1 per shift 1 Cumulative 1 Variable 1 Sampling Method Nuclear Gauge 16 Core 15 Nuclear Gauge corrected to core a 9 Reference b,c Theoretical Maximum Density 32 Laboratory Maximum Density 9 Test Strip 8 Compliance Measure b,d Quality Level Analysis 20 Absolute Average deviation 8 Moving Average 4 Average 3 Range 3 Note: 1 ton = 0.91 Mg a Number of cores for correcting nuclear readings ranged from 3 to 12. b When the total number is less than 40, this means that not all agencies provided a response. c States may specify multiple options a density reference. d States may specify multiple options for compliance. 3
12 Table 3. Pay Adjustment Attributes for 40 States (1). Attribute Type of Adjustment Factor Fixed Rate Bonus Aggregate Gradation Sieve Sizes 12.5mm(1/2 ) 9.5mm(3/8 ) 4.75mm(#4) 2.36mm(#8) 2.07mm(#10) 1.18mm(#16) 600um(#30) 450um(#40) 300um(#50) 75um(#200) Asphalt and Mixture Properties Asphalt Content Air Voids Voids in Mineral Aggregate Stability Voids Filled with Asphalt Asphalt Penetration Anti-strip Additive Moisture Content Theoretical Maximum Density Density Percent Theoretical Maximum Density Percent Test Strip Density Percent Laboratory Maximum Density Smoothness Profile Index Rolling Straightedge Profilomter/Mays Meter Method of Combination Weighted b Minimum c Density Average a Bonus provision is contained within the Factor or Fixed Rate. b Weights summing to 1.0 are multiplied to each property then summed. c Minimum individual pay factor of all measured properties is used. Number of States Specifying a
13 1.1 Overall Research Objective The overall objective of the research was to establish a practical PWL system that the Nevada DOT can effectively implement on the construction of dense graded HMA mixtures. The PWL system shall also include pay factors that are based on pavement performance indicators such as rutting and cracking. In addition, the developed PWL shall be incorporated into a user-oriented software that is capable of analyzing the relevant data, establishing the PWL values, and applying the appropriate pay adjustments. Training will be provided to NDOT employees and other entities that will be involved in the implementation of the PWL system. 1.2 Scope of Work In order to achieve the overall objectives of the research project, the following three phases will be completed: Phase I Review of Existing PWL Specification Systems: this phase reviewed several PWL specification systems for HMA construction. The effort concentrated on the review of PWLs implemented by various SHA agencies with similar conditions to NDOT. Based on the findings of the review, the research team recommended the general framework of the PWL system to be developed in Phase II. Phase II Develop the PWL Specification System: this phase developed the PWL specification system for dense graded HMA construction that was recommended in Phase I taking into account NDOT and Associated General Contractors (AGC) comments and concerns. The developed system uses several materials and mixtures properties to identify the PWLs for all sublots and lots of HMA mixtures. Weight factors were identified for each of the materials and mixtures properties leading to the development of a single PWL for each lot within the construction project. The PWL system also includes pay factors based pavement performance indicators; rutting and cracking. Finally the developed PWL system has been packaged into a user-oriented software. Phase III Implement the Specifications: this phase implemented the developed PWL system on several NDOT projects and uses the data from these projects to fine tune the system. 5
14 CHAPTER 2. REVIEW OF EXISTING PWL SPECIFICATION SYSTEMS This chapter summarizes the findings of a literature review on the applications of PWL system for the acceptance and pay adjustment of dense graded HMA mixtures. Therefore, it will be appropriate to first explain the PWL concept as it relates to the acceptance and pay adjustment of dense graded HMA mixtures. The Transportation Research Board (TRB) definition of PWL is as follows (2): PWL also called percent conforming. The percentage of the lot falling above the LSL, beneath the USL, or between the USL and LSL. [PWL may refer to either the population value or the sample estimate of the population value. PWL = 100-PD.] Where: LSL: lower specification limit USL: upper specification limit PD: percent defective The PWL uses the measured sample average and standard deviation of a specific property of the HMA mix to estimate the percent of the materials, represented by the sample that is within the specification limits. In other words, the PWL process considers both the actual value of the measured property and its associated variability. The PWL tends to reward a producer that manufactures a product that is very close to the target value and has low variability. The low variability part ensures that consistent products are delivered over the duration of the project. 2.1 Distribution of Data The PWL process assumes that the measured property is normally distributed, i.e. bell shape. Historical data show that most properties of HMA mixtures and pavements follow normal distribution as shown in Figure 1 for asphalt content. Figure 1. Typical normal distribution of measured asphalt content 6
15 The normal distribution is typically described in terms of its average and standard deviation as defined below: 2.2 Variability of Data Using the average and standard deviation of a normally distributed data set, the percent of data above or below certain level of the measured property can be estimated. This process is called the Q-statistic or the quality index. For a given HMA property, the quality index is defined for the lower specification limit (LSL) and the upper specification limit (USL) as shown below: The Q-value indicates the distance in sample deviation units that the sample average is offset from the specification limit. A positive Q-value represents the number of standard deviation units that 7
16 the sample average falls inside the specification limit. A negative Q-value represents the number of sample standard deviation units that the sample average falls outside the specification limits. These cases are illustrated in Figure 2. QL is used when there is only a one-sided lower specification limit. QU is used for the one-sided upper specification limit. Illustration of the positive quality index. Illustration of the negative quality index. Figure 2. Illustrations of data variations 2.3 Percent within Limits The calculated QL and QU are used in standard statistical tables or in the standard normal distribution function to identify the percent of data that fall above the LSL (i.e. PWLL) and percent of data that fall below the USL (i.e. PWLU), respectively. A standard statistical table for number of samples of 5 is shown in Table 4. A complete set of standard statistical tables for sample sizes from 3 to 30 are available in reference 3. The total percent of data that fall between the LSL and USL is estimated using the following relationship: Where: PWLT = PWLL + PWLU PWLT = percent within the upper and lower specification limits PWLL = percent above the lower specification limits (based on QL) PWLU = percent below the upper specification limits (based on QU) 8
17 Table 4. A PWL Estimation Table for Sample Size n = 5 (3). QL or QU Sample Calculations This example shows the calculation process used in the determination of PWL for asphalt content (AC). The following asphalt content data were collected from a lot of HMA mix: AC1 = 4.40% AC2 = 4.62% AC3 = 4.10% AC4 = 4.33% AC5 = 4.86% The target asphalt content (ACT), LSL, and USL are specified as follows: ACT = 4.50 LSL = 4.10 USL = 4.90 The average AC is: ( )/5 = 4.46% 9
18 The standard deviation: {[( ) 2 +( ) 2 +( ) 2 +( ) 2 +( ) 2 ]/4} 0.5 = 0.29 The lower and upper quality indexes are calculated as follows: QL = ( )/0.29 = 1.24 QU = ( )/0.29 = 1.52 The PWL values are obtained from Table 4 as follows: PWLL = PWLU = PWLT = = 86.86% ~ 87% This lot of HMA has 87% of the mix within the limits of the asphalt content. The data show that even-though the average of the asphalt content is very close to the target value of 4.50%, the high variability of the produced mix as represented by the standard deviation of 0.29 resulted in a low percentage of the materials being within the specification limits. 2.5 Review of PWL Systems This part of the report summarizes the findings of the review of some of the PWL systems that are currently in use for HMA mixtures. Efforts were exerted to identify PWL systems that are being applied by road agencies outside the U.S.; Europe, Japan, and Australia. This search did not identify any applications of the PWL system in these regions. Following this finding, the review focused on the application of the PWL system in SHAs within the U.S. The following eleven PWL systems were reviewed and are summarized in this report: Arizona California Colorado Idaho Kansas Michigan New Mexico New York Utah Vermont Washington The review process consisted of identifying the following information from each of the eleven systems: Type of data used in PWL: QC, QA, or both Definition of lot and sublot Measured properties Method used to determine overall PWL for a lot 10
19 Method used to determine pay adjustment for a lot Specifications limits 2.5.a Type of Data Used in PWL Table 5 summarizes the type of data used in the PWL systems implemented by the eleven agencies. Table 5. Type of Data used in PWL. Agency QC Data QA Data Both QC and QA Arizona X California X X Colorado X Idaho X X Kansas X Michigan X X New Mexico X X X New York X X Utah X Vermont X Washington X Few of the reviewed PWL systems used different data sets for different applications. For example, the California PWL system uses the QC data for asphalt content and the QA data for the in-place compaction. The Idaho system uses both the QC and QA data for acceptance but only the QC data are used for pay adjustment. The Michigan system uses the QC and QA data for acceptance but only the QA data are used for pay adjustment. The New York system uses the QA data for pay adjustment and QC and QA data for mix verification at the plant. Only the New Mexico system fully uses both the QC and QA data sets. Combining the summary shown in Table 5 and the additional information provided in the previous paragraph indicates that the majority of the reviewed PWL systems use the QA data to establish the percent within limits of the measured properties. 2.5.b Definition of Lot and Sublot The size of lot and sublot vary significantly among the reviewed PWL systems as shown in Table 6. The majority of the reviewed PWLs uses a lot size and sublot size that are consistent with the AASHTO recommendation for the 19 mm mix. Arizona and Idaho use a production shift which is typically a 1-day production unless contractor runs a continuous operation. Colorado combines all produced mixtures into a continuous lot as long as none of the mixtures properties change which require a change in the job mix formula (JMF). It should be noted that the number of sublots per lot varies depending on the properties that the agency measures which will be presented in the next section. A typical number of sublots per lot for mix volumetrics and gradation is 4-5 while for compaction it can be as high as 10. The New York PWL system is based on paved feet per day which is not consistent with the other systems. 11
20 Table 6. Size of Lot and Sublot of HMA Mix. Agency Size of Lot (Ton) Size of Sublot (Ton) Sublots/Lot AASHTO R42: or more Mix 19mm AASHTO R42: or more Mix 12.5mm Arizona single production shift ¼ production shift 1/10 production shift 4 for mixtures properties 10 for compaction California Colorado homogeneous material 1000 for AC Unlimited 1-day for Va and VMA 2000 for gradation 500 for compaction Idaho single production shift or more Kansas Michigan New Mexico New York 1 1-day paving in feet ¼ lot 4 Utah 1-day production ¼ lot for AC ¼ lot for gradation 1/5 lot for compaction Vermont 3000 for Va 1-day paving for compaction 500 for Va 0.6 miles for compaction Washington size of lot and sublots is in feet 4 for AC 4 for gradation 5 for compaction 6 for Va Min 6 per day for compaction 2.5.c Measured Properties In general, the reviewed PWL systems use mix volumetrics, gradation, and compaction as measured properties for PWL and pay adjustment. Table 7 summarizes the properties measured by the various agencies. A review of the data presented in Table 7 leads to the following observations: All of the reviewed systems use compaction for PWL calculations and pay adjustment. The frequency of measurement varies significantly among the systems (i.e tons of mix). Eight out of eleven systems use Va for PWL calculations and pay adjustment. Four out of the eleven systems use both Va and VMA for PWL calculations and pay adjustment. The frequency of measurement ranges from 1 per 500 tons to 1 per 1000 tons of mix. Seven out of the eleven systems use AC for both PWL calculations and pay adjustment. The frequency of measurement varies from 1 per 500 tons to 1 per 1000 tons of mix. 12
21 Five out of the eleven systems use gradation on multiple sieves for PWL calculations and pay adjustment. The frequency of measurement varies from 4 per day to 1 per 2000 tons of mix. Table 7. Properties used for PWL and Pay Adjustment. Agency Volumetrics Gradation AC Compaction Property Frequency Property Frequency Frequency Frequency Arizona Va 4 per shift 3/8, #8, #40, 4 per shift 4 per shift 10 per shift #200 California ½, #8, # tons 750 tons 750 tons Colorado /8, #4, 2000 tons 1000 tons 500 tons #8,#30,#200 Idaho Va, VMA 750 tons tons Kansas Va 750 tons per shift Michigan Va, VMA 1000 tons tons 250 tons New Mexico Va, VMA 750 tons tons 750 tons New York ¼ paving length/day in feet Utah topsize, #8, 4 per day 4 per day 5 per day #50, #200 Vermont Va 500 tons miles of paved lane Washington Va 800 tons topsize, #4, #8, # tons 800 tons 80 tons 2.5.d Determination of Overall PWL and Pay Adjustment The overall PWL and pay adjustment (PA) refer to the PWL and PA for the entire lot of HMA mix. The following describes the methods used for determining the overall PWL and PA for the reviewed systems. Arizona: Individual PWL values are determined for gradation, AC, Va, and Compaction. Using the calculated PWLs, the pay factor for each property is determined from Table 8. A single pay factor (PF) is determined for gradation and AC by selecting the lowest of the determined PFs for these properties. Note: multiple PFs are determined for gradation based on the individual sieves. Pay adjustments are calculated as follows: Mixture Pay Adjustment = (PFGradation&AC + PFVa) x Lot Quantity (tons) Compaction Pay Adjustment = (PFCompaction) x Lot Quantity (tons) 13
22 The following notes apply: o Positive mixture properties lot pay factors reduces to zero when the compaction lot is in reject and the material is allowed to be left in place. o Positive compaction lot pay factors reduces to zero when the mixture properties lot is in reject and the material is allowed to remain in place. o For any mixture properties lot that is in reject due to asphalt content but allowed to remain in place, payment will not be made for asphalt cement quantities in excess of the Upper Limit. Table 8. Pay Factors for the Arizona PWL System. PWL AC/ Gradation Va Compaction 100 $0.00 +$1.00 +$ $0.00 +$0.50 +$ $0.00 $0.00 $ $0.00 -$0.25 -$ $0.25 -$0.50 -$ $0.50 -$0.75 -$ $0.75 -$1.00 -$ $1.00 -$1.25 -$ $1.50 -$1.50 -$ $2.00 -$2.00 -$ $2.50 -$2.50 -$3.00 < 50 Reject California: the CA PWL system uses the percent defection (PD) in place of the PWL; PD = PWLL+PWLU. Individual PD values are calculated for gradation, AC, and compaction. The calculated PD values are used in Table 9 to determine the PF which is labeled as Quality Factor in the first column. Measured properties are assigned weights as shown below: Property Weight (%) AC 30 ½ Gradation 5 #8 Gradation 10 #200 gradation 15 Compaction 40 14
23 Individual pay adjustments are determined for AC, gradation, and compaction as follows: AC Pay Adjustment = (PF%AC 1) x Lot Quantity(tons)xUnit Price x 0.30 ½ Sieve Pay Adjustment = (PF1/2 1) x Lot Quantity(tons)xUnit Price x 0.05 #8 Sieve Pay Adjustment = (PF#8 1) x Lot Quantity(tons)xUnit Price x 0.10 #200 Sieve Pay Adjustment = (PF#200 1)xLot Quantity(tons)xUnit Price x 0.15 Compaction Pay Adjustment = (PFComp 1)xLot Quantity(tons)xUnit Price x 0.40 Table 9. Pay Factors for the California System. 15

24 Colorado: Individual PWL values are determined for gradation, AC, compaction, and joint density. Using the calculated PWLs, the pay factor for each property is determined from Table 10 where the PWL is referred to as QL. A weighted average PF is calculated for each property based on the weight of lot that is represented by the individual PF values. The pay adjustment for the entire project is calculated based on a composite pay factor (CPF) and the following: Project Pay Adjustment = (CPF 1) x lot Quantity(tons) x Unit Price The CPF is calculated based on the following weights: Property Weight (%) AC 25 Gradation 15 Compaction 45 Joint Density 15 Table 10. Pay Factors for the Colorado System. 16
25 Idaho: Individual PWL values are determined for Va, VMA, and compaction. The PF for the Va is calculated as follows: PFVa = [55 + (0.5)PWL]/100 For VMA and compaction, the PFs are obtained from Table 11. Note: the Quality Level in the table represents the PWL value. Each of the PFs for Va and VMA is weighted 30% while the PF for compaction is weighted 40%.The pay adjustment for the lot is calculated as follows: Pay adjustment = [((PFVa x 0.30) + (PFVMA x 0.30) + (PFCompaction x 0.40))-1] xunit Price x Lot Quantity (tons) Table 11. Pay Factors for the Idaho System. Note: Quality Level represents the PWL value 17
26 Kansas: Individual PWL values are determined for Va, and compaction. The calculated PWL values are used in the following equations to calculate the PFs: PFVa = [(PWLVa 100) x 0.003] 0.27 PFCompaction = (PWLCompaction x 0.004) 0.36 The pay adjustments are calculated as follows: Va Pay Adjustment = PFVa x Lot Quantity(tons) x 40 Compaction Pay Adjustment = PFCompaction x Lot Quantity(tons) x 40 Michigan: Individual PWL values are determined for Va, AC, VMA, and compaction. PF values are determined based on the following guidelines: o If PWL id between 70 and 100: PF = 55 +(0.5 x PWL) o If PWL is between 50 and 70: PF = (0.75 x PWL) o If PWL is less than 50, the Engineer may elect to do one of the following: Require removal and replacement of the entire lot with new QA sampling and testing and repeat the evaluation procedure. Allow the lot to remain in place and apply an Overall Lot Pay Factor of 50%. Allow submittal of a corrective action plan for the Engineer's approval. The corrective action plan may include removal and replacement of one or more sublots. If one or more sublots are replaced, the sublot(s) will be retested and the Overall Lot Pay Factor will be recalculated according to this special provision. If the Engineer does not approve the plan for corrective action, actions (1) or (2) above will be applied. Weight factors are assigned to the various properties as shown below: Property Weight (%) AC 15 Va 30 VMA 15 Compaction 40 Using the weight factors, the Overall Lot Pay Factor (OLPF) is calculated as follows: OLPF = (0.4 x PFCompaction) + (0.30 x PFVa) + (0.15 x PFAC) + (0.15 x PFVMA) The lot pay adjustment is calculated as follows: 18
![Pay Adjustment = [(OLPF -100)/100] x Lot Quantity(tons) x Unit Price New Mexico: Individual PWL values are determined for Va, AC, VMA, and compaction.](/docs-images/89/97705434/images/27-0.jpg "Pay factors are determined for each property from Table 12 using the calculated PWLs for each property.")
27 Pay Adjustment = [(OLPF -100)/100] x Lot Quantity(tons) x Unit Price New Mexico: Individual PWL values are determined for Va, AC, VMA, and compaction. Pay factors are determined for each property from Table 12 using the calculated PWLs for each property. Weight factors are assigned to the various properties as shown below: Property Weight (%) AC 10 Va 35 VMA 20 Compaction 35 Using the weight factors, the Composite Pay Factor (CPF) is calculated as follows: CPF = (0.35 x PFCompaction) + (0.35 x PFVa) + (0.10 x PFAC) + (0.20 x PFVMA) The lot pay adjustment is calculated as follows: Pay Adjustment = (CPF -1) x Lot Quantity(tons) x Unit Price Table 12. Pay Factors for the New Mexico System. 19
 and a PF is assigned for each DR as shown in Table 13.")
28 New York: The PWL is determined for compaction. The PF is determined based on the following conditions: o PWL > 93, PF = 1.05 o If the PWL < 93, the density data are grouped into Density Ranges (DR) and a PF is assigned for each DR as shown in Table 13. The PWL for each DR is calculated using the average and standard deviation of the entire data. The PWL is multiplied by the corresponding PF to obtain the Quality Adjustment Factor (QAF) for each DR. o The sum of the QAFs is the overall pay factor. Sample calculations are shown in Table 13. The lot pay adjustment is calculated as follows: Pay Adjustment = [(QAF -100)/100] x Lot Quantity(tons) x Unit Price Table 13. Pay Factors for the New York System. Utah: Individual PWL values are determined for AC, gradations, and compaction. Pay factors are determined for each property from Table 14 using the calculated PWLs for each property. The lowest PF determined for AC and gradations is selected to be used for pay adjustment. The total pay adjustment will be the sum of the following two adjustments: Pay AdjustmentAC or Grad = (PFAC or Grad) x Lot Quantity(tons) Pay AdjustmentCompaction = (PFCompaction) x Lot Quantity(tons) 20
29 Vermont: Individual PWL values are determined for Va, compaction, and roughness. Pay factors are calculated for each property using the following equations: PFVa = [(0.28 x PWL + 75)/100] 1.0 PFCompaction = = [(0.20 x PWL + 83)/100] 1.0 for 85 PWL 100 PFCompaction = = [(0.20 x PWL + 83)/100] 1.0 for 60 PWL<85 PFRoughness = = ( x IRI ) 1.0 PFRoughness = = ( x IRI ) 1.0 for Limited Access Highways for Other State Routes Since lot sizes are different, individual pay adjustments are calculated: Pay Adjustment (Va) = PFVa x Lot Quantity(tons) x Unit Price Pay Adjustment (Compaction) = PFCompaction x Lot Quantity(tons) x Unit Price Pay Adjustment (Roughness) = PFRoughness x Lot Quantity(tons) x Unit Price Table 14. Pay Factors for the Utah System. %AC/Gradation and Compaction PWL (based on an average of minimum of 4 PF ($ / ton) samples) >99 $ $ $ $ $ $ $ $ $ $ $2.27 <60 Reject 21

 is calculated for")
![gradations, Ac and Va as follows: CPF = [ fi(pfi))]/ fi Pay adjustments are calculated based on a split of 60% for gradation, Va, and AC and](/docs-images/89/97705434/images/30-2.jpg "40% for Compaction: Pay AdjustmentGrad,AC,Va = 0.60 x (CPFGrad,AC,Va 1) x Lot Quantity(tons) x Unit Price Pay AdjustmentCompaction = 0.")
30 Washington: Individual PWL values are determined for Va, AC, gradations, and compaction. Pay factors are determined for each property. Table 15 using the calculated PWLs for each property. The PFs for the Va, AC, and gradations are assigned the following weights: Pay Factors Constituents Factor f All aggregate passing: 1.5, 1, ¾, and #4 2 All aggregate passing #8 15 All aggregate passing # AC 40 Va 20 A Composite Pay Factor (CPF) is calculated for gradations, Ac and Va as follows: CPF = [ fi(pfi))]/ fi Pay adjustments are calculated based on a split of 60% for gradation, Va, and AC and 40% for Compaction: Pay AdjustmentGrad,AC,Va = 0.60 x (CPFGrad,AC,Va 1) x Lot Quantity(tons) x Unit Price Pay AdjustmentCompaction = 0.40 x (CPFCompaction 1) x Lot Quantity(tons) x Unit Price Table 15. Pay Factors for the Washington System. 22
31 2.5.e Specification Limits As summarized in Table 7, every SHA uses a set of mixture properties and field compaction in the determination of PWLs and the pay adjustment. The specification limits for the identified mixtures properties and field compaction vary among the various SHAs. Table 16 summarizes the limits for the mixtures properties and field compaction used in the eleven PWL systems that were reviewed and as required in the NDOT specifications. A review of the data summarized in Table 16 leads to the following observations: In general, most of the reviewed specification limits on gradations are very similar. The majority of the specification limits on air voids are 3.0 to 5.0% while the NDOT specification allows 4 to 7%. The NDOT specification on AC of ±0.40 is within the range of other specifications. The NDOT specification on compaction of 92 to 96% is very consistent with other specifications. Table 16. Specification limits for properties used for PWL and Pay Adjustment. Agency Volumetrics Gradation AC Compaction Property LL UL Property LL UL LL UL LL UL Arizona Va /8 #8 #40 # % 96% California -- ½ #8 #200 Colorado -- 3/8 #4, #8 #30 #200 Idaho Va VMA NMS*: 1.5 NMS: 1 NMS: ¾ NMS:1/2 NMS: 3/ % 96% % 96% Cores 92% Nuc. 91 Cores 95% Nuc. 95.5% Kansas Va % Michigan Va % VMA New Mexico Va % 97% VMA New York % 97% Utah -- Topsize #8 # % 95.5% 23
32 Agency Volumetrics Gradation AC Compaction Property LL UL Property LL UL LL UL LL UL # Vermont Va % 96.5% Washington Va topsize #4 #8 #200 Nevada Va #4 #8 #10 #200 *Nominal Maximum Size 2.6 Recommendations of Phase I % % 96% Based on the review of the eleven PWL systems and the comments received from NDOT and the AGC, the following recommendations were made for the overall framework of the NDOT PWL for dense graded HMA mixtures. Measured properties: 1. Gradation on multiple sieves using calibrated ignition oven. The critical sieves will be determined based on the analysis of field data presented in Chapter Asphalt Content using calibrated ignition oven. 3. In-place Density using nuclear gauge calibrated with cores. Weight Factors: each of the measured properties will be assigned a weight factor based on its relative contribution toward the long-term performance of the HMA pavement. Percent within Limit: a PWL value will be determined for each of the measured properties for every sublot. An overall PWL will be determined for the entire lot using the appropriate weight factors. Sublot and Lot sizes: Size of Sublot: 1,000 tons of HMA mix or end of day whichever comes first for all properties for the duration of the project. However, the size of the sublot for the compaction (i.e., mat density) can range between 100 tons and 1,000 tons. Necessary exceptions will be identified to accommodate construction activities. Size of Lot: 5,000 tons of HMA or 5 sublots whichever comes first for asphalt binder content and gradation and whatever the corresponding number of sublots for compaction for the duration of the project. Necessary exceptions will be identified to accommodate construction activities. The following assumptions will be implemented when assigning lot numbers: A job mix revision is not allowed within a lot. An interruption in production of more than one day is not allowed within a lot. 24
33 CHAPTER 3. DEVELOPMENT OF THE PWL SPECIFICATION SYSTEM Phase II was initiated to develop the Percent within Limits (PWL) specification system including pay factors for dense graded HMA construction following the recommendation of Phase I and taking into account NDOT and AGC comments and concerns. This chapter presents the following components of the developed PWL system: Collection of measured properties on selected dense graded HMA mixtures constructed by NDOT over the past few years. Analyses of the collected data including: statistical analysis, definition of lot and sublot, calculations of PWL values followed by the overall computed bonus or demerit that the contractor would have incurred on each project. Development of the PWL software. 3.1 Data Collection A summary of the nine NDOT contracts that were evaluated in this study is presented in Table 17. Table 17. Nevada s Contracts Considered in The Study. Contract (RAP) 3466 (RAP) 3505 (RAP) County Clark Clark Clark Churchill Pershing Elko Elko Clark Lyon Plant start Plant end Test reports Gradation/AC 22-Feb-08 6-Jul Sep May Apr Sep May-11 4-Apr Sep Apr Feb-10 9-Jul Aug Jun Aug Sep Sep Dec In-place density Start 3-Mar-08 6-Jul Sep May Apr Sep May Mar Sep-12 End 17-Apr-09 8-Mar-10 9-Jul Aug Jun Aug Sep Sep Dec-12 Test reports
34 Figure 3 shows the tonnage production of the selected NDOT contracts. The production rates range from 26,688 up to 119,918 tons representing small and large NDOT projects. The wide distribution of the HMA tonnage among the nine contracts allows the assessment of the application of the PWL system on small and large NDOT projects. In addition, the impact of project size on the conformation of the measured properties with the limits of the JMF would be assessed to identify any impact of project size on the quality of the work. In other words, would contractors pay more attention to quality on large projects versus small projects which would necessitate the implementation of a PWL system that takes into consideration the size of the project. 140, , , ,918 Production, tons 100,000 80,000 60,000 40,000 20,000 36,664 31,371 64,761 94,343 57,315 26,688 72, (RAP) Contract 3466 (RAP) 3505 (RAP) Figure 3. Total HMA production (in tons) for the selected NDOT contracts Figure 4 shows the standard data collection form that NDOT uses to record the measured properties on HMA mixtures during production: Daily Report of Asphalt Mixtures. Figure 5 shows the standard data collection form that NDOT uses to record the measured properties of HMA mixtures during construction: Nuclear Thin Layer Compaction Report. The combination of data from these two reports covers all the properties that were recommended for inclusion in the NDOT PWL System. The hard copies of the two forms were obtained from NDOT Construction Division for all nine contracts and entered into Excel files in order to facilitate the data analyses. 26


35 Figure 4. Daily Plant Report of Asphalt Mixtures (Contract No RAP) 27


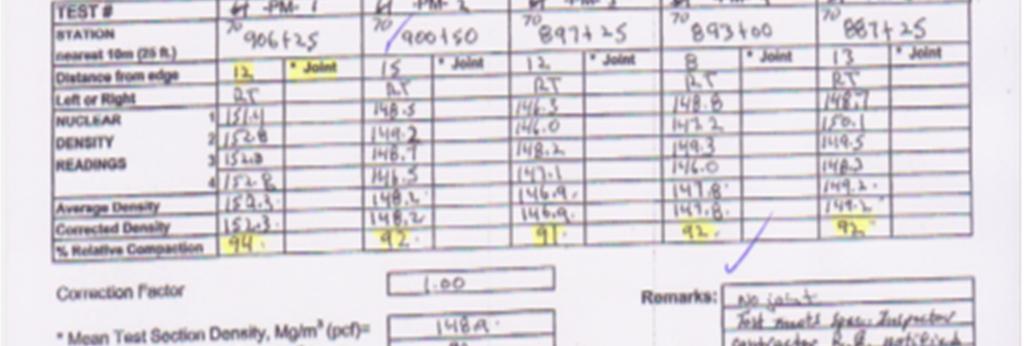
36 Figure 5. Nuclear Thin Layer Compaction Report (Contract No RAP) 28
37 3.2 Data Analyses and Results Phase I recommended the following properties to be included in the PWL system: 1. Gradation using calibrated ignition oven 2. Asphalt Content using calibrated ignition oven 3. In-place Density using nuclear gauge calibrated with cores The goals of the analyses of the data collected from the nine NDOT contracts are listed below: Examine the distribution of the measured properties against the limits of the JMF of each contract. Assess the impact of project size on the conformation of the measured properties with the JMF limits. Assess the impact of the presence of Reclaimed Asphalt Pavements (RAP) on the conformation of the measured properties with the JMF limits. Assess the adequacy of the reported values, in terms of decimals, toward the calculations of PWL parameters. In the case of gradations, identify the critical sieves to be included in the calculations of the PWL parameters. Identify the appropriate construction limits on the sizes of sublots and lots. 3.2.a Distribution of Measured Properties Against JMF The purpose of this analysis is to compare the measured properties of the mixtures to the specification limits of the project. Aggregate gradations, asphalt content (AC), and in-place density were examined against their respective upper and lower JMF limits. Each individual measurement was checked against its respective JMF limits (i.e. upper and lower limits). This was followed by estimating the percentage of measured properties that violated the JMF limits relative to the total number of measurements for each property within each contract. For example, Contract 3339 had a total of 41 measured aggregate gradations. For the percentage of aggregates passing sieve size 3/4, it was found that 6 data points out of a 41 were outside the JMF range. This was translated into 15% violations ([6/41]*100) (Figure 6). Similarly, 11 measured asphalt content data points out of 40 were outside the JMF resulting in 28% violations with respect to the asphalt content specifications (Figure 7). Table 18 summarizes the percent violations for all measured properties on gradation, AC and compaction for all nine Contracts. Examination of the data in Table 18 indicates that the percent of violations in the gradation and AC are significantly higher than the percent violations in the compaction. The significantly lower percent violations in compaction can be attributed to the following reasons: Compaction is controlled through a test strip which establishes the appropriate rolling pattern to achieve the desired in-place density. The sampling rate for the compaction is much higher than for aggregate gradation and AC which leads to a much larger sample size. 29
38 Percent Passing Sieve 3/4" Control chart - 3/4" sieve % Violation = 6 violations /total of 41 individual measurments *100% = 15% Individual measurement Passing #3/4 Limit Target Figure 6. Control chart for percentage of aggregates passing ¾ sieve (Contract 3339) 6.0 Control chart - Asphalt Content Asphalt Binder Content (%) % Violation = 11 violations /total of 40 individual measurments *100% = 28% Individual measurement Asphalt Content Limit Target Figure 7. Control chart for asphalt content (Contract 3339) 30
39 3339/ 36,664 Table 18. Percentage of Observed Specification Violation. 3361/ 31, / 64,761 Contract/Tonnage (ton) 3402/ 94, / 57, / 26, (RAP)/ 117, (RAP)/ 119, (RAP)/ 72,574 Sieve Percentage Violations (%) Gradation 1" /4" /2" /8" # # # # Specification Asphalt Content OBC± Specification Compaction (In-Place Density) Individual <90% or >97% Average <92% or >96% Overall Mean (%) 31
40 3.2.b Impact of Project Size and Presence of RAP The selected nine NDOT Contracts spans over a wide range of mixture tonnage and incorporates projects with and without RAP. Using this variations in projects characteristics the analysis can assess the impact of project size and presence of RAP on the quality of the produced and constructed asphalt mixtures. In order to assess the impact of the project size on the quality of the produced and constructed asphalt mixtures, the evaluated contracts were separated in two groups: contracts with less than 90,000 tons versus contracts with 90,000 tons or more. Figure 8 compares the percent violations in aggregate gradations, AC, and compaction for the two groups of project sizes. The whiskers represent the 95% Confidence Interval (CI). Overlapping of the CIs for each measurement implies the similarity in the percentage of violations among the two groups of contracts. Examination of the data in Figure 8 indicates that the size of the project did not significantly impact the percent violations of the specification limits for aggregate gradations, AC, and compaction. Therefore, it can be concluded that the size of the project did not impact the quality of the produced and constructed asphalt mixtures Percentage Violations (%) " 3/4" 1/2" 3/8" #4 #10 #40 #200 AC Average Field Collected Mixture Property Density Contracts with total production less than 90,000 tons Contracts with total production of 90,000 tons or more Figure 8. Percentage of violations for contracts with total production less than 90,000 tons versus contracts with total production of 90,000 tons or more 32
41 In order to assess the impact of the presence of RAP on the quality of the produced and constructed asphalt mixtures, the evaluated contracts were separated in two groups: contracts without RAP versus contracts with RAP. Figure 9 compares the percent violations in aggregate gradations, AC, and compaction for the two groups of contracts. The whiskers represent the 95% Confidence Interval (CI). Overlapping of the CIs for each measurement implies the similarity in the percentage of violations among the two groups of contracts. Examination of the data in Figure 9 indicates that the presence of RAP did not significantly impact the percent violations of the specification limits for aggregate gradations, AC, and compaction. Therefore, it can be concluded that the presence of RAP did not impact the quality of the produced and constructed asphalt mixtures Percentage Violations (%) " 3/4" 1/2" 3/8" #4 #10 #40 #200 AC Average Field Collected Mixture Property Density Contracts without RAP Contracts with RAP Figure 9. Percentage of violations for contracts without RAP versus contracts with RAP 3.2.c Identify Critical Sieves on Aggregate Gradations The recommendations from phase I indicated the need to include the gradation of the aggregate in the calculations of PWL and pay factors. The next step is to identify the critical sieves that must be monitored during the production process to generate the data necessary for the calculations of PWL and pay factors. The following guidelines were followed in identifying the critical sieves: Multiple critical sieves must be identified in order to control the full shape of the gradation curve. A critical sieve in the upper portion of the gradation curve must be identified to control the coarse portion of the aggregates. 33
42 The sieve #200 must be identified as a critical sieve due to the significant impact of the materials passing sieve #200 on the performance and durability of asphalt mixtures. One or two critical sieves in the middle portion of the gradation curve must be identified to control the fine portion of the aggregates and to ensure the continuous shape of the gradation curve. Figure 10 presents the percentage violations on the various sieves for the nine NDOT Contracts. Examination of the data presented in Figure 10 leads to the following observations: Among the four top sieve sizes, the 1/2 sieve shows the most consistent and most significant percent violations of the specifications. The 3/8 sieve should be used for Type 2 mixtures. Among the middle sieve sizes, sieve #10 shows the most significant percent violations of the specifications Percentage Violations (%) " 3/4" 1/2" 3/8" #4 #10 #40 #200 Aggregate Seive Size (RAP) 3466 (RAP) 3505 (RAP) Figure 10. Percentage violations in the aggregate sieve sizes. Taking into consideration both the basis for selecting the critical sieves and the observations from Figure 10, the following critical sieves were selected to be included in the PWL calculations and pay factors: Sieve 1/2 (3/8 for type 2 mixtures) to control the coarse portion of the aggregates. Sieve #4 to control the fine portion of the aggregates. Sieve #10 to control the shape of the aggregate gradation curve. Sieve #200 to control the performance and durability of the asphalt mixture. 34
43 3.2.d Adequacy of Measurements and Reported Data Values The objective of this analysis is to identify the needed level of accuracy in the calculations of the aggregate gradations, AC, and compaction. In other words, do the calculations need to be carried out to three decimals (i.e ) or only one decimal is sufficient (i.e. 0.1). The importance of this step lies in the fact that the PWL calculations are based on the determination of the average and standard deviation of the measured values for aggregates gradations, AC, and compaction for each lot of asphalt mixtures. In general, the higher the number of decimals, the better accuracy of the calculated average and standard deviation. However, not all measurements requires calculations to three decimals. It should be noted that the number of decimals that must be carried during the calculations is one higher than the number of decimals that can be reported. For example, in order to report a value with two-decimals, the calculations of the value must be carried out to the three-decimals. In order to assess the need for multiple decimals, sample calculations were conducted with variable number of decimals. Table 19 summarizes the data for the following cases: Case 1: the calculations were made with one-decimal and the reported values were rounded to no-decimal. Case 2: the calculations were made with two-decimal and the reported values were rounded to one-decimal. Case 3: the calculations were made with three-decimal and the reported values were rounded to two-decimal. For all three cases, the PWL values were calculated for the four critical sieves, AC, and compaction. Examination of the data in Table 19 indicates the following: Case 1: the PWL values for Sieve #200 and AC could not be determined due to the fact that all three measurements had the same values when rounded to no-decimal which resulted in a standard deviation of zero. It is numerically impossible to calculate the PWL value for a data set with a standard deviation of zero. Case 2: the PWL values for all measures were determined. There are significant changes in the PWL values for the sieve 1/2 and compaction when measurements are rounded to one-decimal as compared to no-decimal. Case 3: the PWL values for all measures were determined. There are no significant changes in the PWL values when measurements are rounded to two-decimal as compared to onedecimal. Similar analyses were conducted on data from multiple contracts and led to similar findings. Based on the analyses of the impact of decimals in measurements and reported values (i.e. rounding) for gradation, AC, and compaction, the following recommendations are made: 1. Gradations on Sieves 1/2 (3/8 for Type 2), #4, #10, and #200 using calibrated ignition oven measured with two-decimal (0.01) and rounded to the one-decimal (0.1). 2. Asphalt Content using calibrated ignition oven measured with two-decimal (0.01) and rounded to the one-decimal (0.1). 35
44 3. In-place Density using nuclear gauge calibrated with cores measured with two-decimal (0.01) and rounded to the one-decimal (0.1). Table 19. Impact of Decimals on the Calculated PWL Values. Case 1: Measuring with one-decimal and reporting with no-decimal Date Lot Sublot 17-Sep c 6c Sep c 6c Sep c 6c PWL Sep c 6c Sep c 6c Sep c 6c Sep c 6c Sep c 6c Sep c 6c PWL Report Job Mix Formula Case 2: Measuring with two-decimal and reporting with one-decimal Date Lot Sublot Report PWL Case 3: Measuring with three-decimal and reporting with two-decimal Date Lot Sublot Report Job Mix Formula Job Mix Formula Percentage passing, % 1" 3/4" 1/2" 3/8" #4 #10 Percentage passing, % 1" 3/4" 1/2" 3/8" #4 #10 Percentage passing, % 1" 3/4" 1/2" 3/8" #4 #10 #40 #200 #40 #200 #40 #200 Asphalt Content, % Asphalt Content, % Asphalt Content, % Compaction, % Compaction, % Compaction, % e Sizes and Construction Limits on Sublots and Lots As part of the PWL system, the sizes of sublots and lots must be well defined in order to ensure consistency in the implementation among the various projects. Typically, the sizes of sublots and lots are defined in terms of tonnage of mixture being constructed. However, the implementation of the recommended sizes of sublots and lots must accommodate actual construction activities on every project. Therefore, additional guidance is needed in order to ensure that uniform materials are being considered in each sublot and lot for every project. The guidelines will set the practical limits of sublots and lots based on the actual construction activities on a specific project. For example, when a change occurs to the job mix formula (JMF), the sizes sublots and lots must be adjusted to accommodate this event. Another case that might differentiate assigning sublots and lots is the number of days when construction activities are interrupted. It is recommended that when production is interrupted by more than one day, the sublots and lot must be terminated and their sizes adjusted accordingly. Based on these considerations, the following guidelines are recommended for determining the sizes of sublots and lots for the NDOT PWL system: 1. Size of Sublot: 1,000 tons of HMA mix or end of day whichever comes first for the asphalt content and gradations for the duration of the project. The size of the sublot for the compaction (i.e. in-place density) shall be controlled by the current NDOT sampling rate which may generate compaction sublots as low as 100 tons. The following exceptions shall be applied: 36
45 a. When the amount of materials produced after the last full size sublot of a given day is less than 500 tons, these materials should be added to the last sublot of the day. b. When the amount of materials produced after the last full size sublot of a given day is equal or more than 500 tons, these materials should be tested as a separate sublot. 2. Size of Lot: 5,000 tons of HMA or 5 sublots whichever comes first for asphalt binder content and gradation and whatever the corresponding number of sublots for compaction for the duration of the project. The following exceptions shall be applied: a. When the number of sublots is less than 3 and the production of materials is interrupted for more than one day or the JMF is changed, these materials cannot be included in the PWL calculations. b. When the number of sublots is 3 4 and the production of materials is interrupted for more than one day or the JMF is changed, the size of lot should be reduced to represent the actual number of sublots. c. When the number of sublots exceeds 5 but less than 8 and the production of materials is interrupted for more than one day or the JMF is changed, the size of lot should be increased to accommodate the additional sublots. Figure 11 presents the data from one of the evaluated NDOT Contracts. Figure 11 shows that JMF1 was used for the first week of production on Friday with a total production of 224 tons only. On the following Monday, a new JMF2 was utilized and only 234 tons were produced. Production was interrupted for two days and started again on Thursday under the same JMF2. A new JMF3 was utilized starting Friday of the same week. Under the conditions presented in Figure 12, the following assignments of sublots and lots will be followed: The 224 tons produced on Friday under JMF1 are too little to be considered as a single lot and too far to be combined with the next lot on Monday (exception 2.a). Therefore, these materials will not be included in the PWL calculations. The 234 tons produced on Monday under JMF2 are too little to be considered as a single lot and too far to be combined with the next lot on Thursday (exception 2.a). Therefore, these materials will not be included in the PWL calculations. The 4,769 tons produced on Thursday should be divided into 5 sublots with the fifth sublot having 769 tons (exception 1.b) to constitute a single lot with 5 sublots. The 4,271 tons produced on Friday should be divided into 4 sublots with the fourth sublot having 1,271 tons (exception 1.a) to constitute a single lot with 4 sublots (exception 2.b). These materials cannot be combined with the materials produced on Monday due to existence of the two-day weekend where production was interrupted. The 2,407 tons on Monday should be divided into 2 sublots with the second sublot having 1,407 tons (exception 1.a) and combined with the 3,041 tons produced on Tuesday divided into 3 sublots with the third sublot having 1,041 tons (exception 1.a) to constitute a single lot with 5 sublots. The 2,670 tons on Wednesday should be divided into 3 sublots with the third sublot having 670 tons (exception 1.b) and combined with the 1,968 tons produced on Thursday divided into 2 sublots with the second sublot having 968 tons (exception 1.b) to constitute a single lot with 5 sublots. 37
46 Production Tonnage Week 1: Sublots Mon Tues Wed Thu Fri Sat Sun Legend Production Tonnage Sublots 4,769 5 Sublots 4,271 4 Sublots JMF 1 JMF 2 JMF 3 Week 2: Mon Tues Wed Thu Fri Sat Sun Lot Production Tonnage 2,407 2 Sublots 3,041 3 Sublots 2,670 3 Sublots 1,968 2 Sublots Week 3: Mon Tues Wed Thu Fri Sat Sun Figure 11. Continuity of production versus lot definition: Example 1 Figure 12 shows the data from another NDOT Contract where three different JMFs were utilized. During the first week, the production under JMF1 was interrupted for two days while only a oneday weekend was observed. Under the conditions presented in Figure 12, the following assignments of sublots and lots will be followed: The 2,356 tons produced on Tuesday should be divided into 2 sublots with the second sublot having 1,356 tons (exception 1.a) and combined with the 1,960 tons produced on Wednesday divided into 2 sublots with the second sublot having 960 tons (exception 1.b) to constitute a single lot with 4 sublots (exception 2.b). These materials cannot be combined with the materials produced on Saturday due to existence of the two days interruption in production. The 1,874 tons produced on Saturday should be divided into 2 sublots with the second sublot having 874 tons (exception 1.b) and combined with the first three sublots (1,000 tons each) from the 3,968 tons produced on Monday since the interruption was only for one day to constitute a single lot with 5 sublots. The remaining 968 tons produced on Monday should be assigned as a sublot (exception 1.b), combined with the three sublots from the 3,307 tons produced on Tuesday with the 38
47 third sublot having 1,307 tons (exception 1.b) and three sublots from the 2,747 tons produced on Wednesday with the third sublot having 747 tons (exception 1.b) to constitute a single lot with 7 sublots (exception 2.c). Note that the additional 2 sublots produced on Wednesday cannot be combined with the materials produced on Thursday due to the change in the JMF. The 1,315 tons produced on Thursday should be assigned as a sublot (exception 1.b), combined with 3 sublots from the 2,825 tons produced on Friday with the third sublot having 825 tons (exception 1.b) and two sublots from the 2,437 tons produced on Saturday with the second sublot having 1,437 tons (exception 1.a) to constitute a single lot with 6 sublots (exception 2.c). Note that the additional sublot produced on Saturday cannot be combined with the materials produced on Monday due to a change in the JMF. The 3,639 tons produced on Monday should be divided into 4 sublots with the fourth sublot having 639 tons (exception 1.b) combined with the 2 sublots from the 2,337 tons produced on Tuesday with the second sublot having 1,337 (exception 1.a) to constitute a single lot with 6 sublots. Production Tonnage 2,356 2 Sublots 1,960 1,874 2 Sublots 2 Sublots Week 1: Production Tonnage Mon Tues Wed Thu Fri Sat Sun 3,968 3,307 2,747 2,825 2, Sublots 3 Sublots 1,315 3 Sublots 3 Sublots 2 Sublots 1 Sublot Legend JMF 1 JMF 2 JMF 3 Week 2: Mon Tues Wed Thu Fri Sat Sun Lot Production Tonnage 3,639 4 Sublots 2,337 2 Sublots Week 3: Mon Tues Wed Thu Fri Sat Sun Figure 12. Continuity of production versus lot definition: Example 2 39
48 3.3 Determination of Weight Factors The final step in the development of the PWL system is to identify the weight factors for the identified critical sieves, AC, and compaction. This step is divided into parts: 1) determining the weight factors for each critical sieve within the aggregate gradations and 2) determining the weight factors for aggregate gradations, AC, and compaction. The following principles apply for determining the weigh factors for both parts: The weight factor should reflect the relative contribution of the individual measure. The sum of the weight factors should be a. Part 1: Weight Factors for Critical Sieves The weight factors for each of the critical sieves are required for the calculation of the PWL value for gradation and were selected as follows. Gradation on Sieve 1/2 : 10% (Sieve 3/8 for Type 2) Gradation on Sieve #4: 35% Gradation on Sieve #10: 35% Gradation on Sieve #200: 20% Higher and equal weight factors were assigned to the #4 and #10 sieves. This is mainly due to the following reasons: (1) The two sieves highly control the overall shape of the aggregate gradation; (2) For a given mix, the largest number of violations was generally observed on the #10 sieve; and (3) The observed increased variability in the percent passing #4 and #10 sieves during production. The PWL value for the aggregate gradation is then determined using the weight factors for each of the critical sieves as follows. PWLGradation = 0.10 PWL1/2 or 3/8 inch PWL# PWL# PWL# b. Part 2: Weight Factors for Gradations, AC, and Compaction A performance related approach was followed to determine the weight factors for aggregate gradations, AC, and compaction. The approach makes use of the findings from a study conducted by Sebaaly and Bazi (4) in 2005 to evaluate the impact of construction variability in aggregate gradation, asphalt binder content, and air-voids, on the performance of HMA pavements. The performance of HMA pavements was measured in terms of their resistance to rutting, fatigue cracking, and thermal cracking using advanced laboratory testing techniques. Materials were selected to cover common sources used in northern and southern Nevada and typical mix designs. Two aggregate sources were identified, one source in northern Nevada (Lockwood) and one source in southern Nevada (Sloan). The study was conducted in two phases. In Phase I, unmodified AC- 20 binder from Paramount Petroleum Company and AC-30 binder from Koch Performance Asphalt were used with the north and south aggregates, respectively. In Phase II, polymermodified PG64-28NV binder from Paramount Petroleum Company and PG76-22NV binder from Koch Performance Asphalt were used with the north and south aggregates, respectively. The findings from the Phase II were used in this study to determine the performance related weight factors for the various properties. 40
49 A total of four sources of variability in a given HMA mix were evaluated: gradation on #4 sieve, gradation on #200 sieve, asphalt binder content, and air-voids (Table 20). Each variability source was simulated at three levels of: Low, medium, and high. The medium level represents the job mix formula (JMF) value (i.e. control mixture) while the low represents below the JMF level and the high represents above the JMF level. Table 20. Sources of Variability and Violation Levels Considered in the Impact of Construction Variability Study. Sources of Allowable range variability (NDOT Specs) Violation Levels % P#4 ± 7% ± 10% L, M, and H % P#200 ± 2% + 4% M and H 1 % AC ± 0.4% dwa ± 0.6% dwa L, M, and H % AV 4 to 8 % 3 to 11 % L, M, and H 1 the below JMF level (i.e., L) was not evaluated since no violation was observed. The impacts of construction variability on the performance of the HMA laboratory mixtures were measured using the Asphalt Pavement Analyzer (APA) for rutting resistance, the flexural beam fatigue for fatigue cracking resistance, and the thermal stress restrained specimen test (TSRST) for the low temperature cracking resistance (TSRST was conducted on northern mixtures only). Table 21 summarizes the effect of the single factor violations on the performance of the evaluated mixtures. All presented trends are based on the statistical significance relative to the control mixture at the JMF values. The information in Table 21 was used to develop the performance related weight factors for aggregate gradation, AC, and compaction using the following steps. The associated calculations are summarized in Tables 22 and 23 for the northern and southern mixtures, respectively. Assign a representative weight factor (WF) to each of the considered distresses according to the historical performance of HMA pavements in Nevada. Consequently, since fatigue and thermal cracking are more prone to occur in northern Nevada while rutting is more prone in the southern part of the state the following weight factors were selected for the considered type of distresses. o Northern Nevada: 40% for rutting, 30% for fatigue, and 30% for thermal cracking (total of 60% for cracking) o Southern Nevada: 60% for rutting and 40% for fatigue cracking. Determine the percent of incidence when the violation resulted in a positive (i.e. increase in performance) or negative (i.e. reduction in performance) effect on the resistance of the mixture to a specific type of distress. A zero value is assigned when no significant effect for the violation was observed on the mixture property. For example, in the case of the northern mixtures, two out of the three violations in aggregate gradation resulted in a reduction of the mixture resistance to fatigue cracking. Hence, the percent of incident to have a positive and a negative effect is 1/3 100 = 33 and 2/3 100 = 67, respectively. 41
50 Calculate the overall weighted percent of incidence for the negative effect by multiplying the individual percent of incidence by the corresponding weight factor for each of the distresses. Calculate the weight factor for each property by dividing the overall weighted percent of negative incidence for a given property by the total sum of the overall weighted percent of negative incidences for all properties. For example, in the case of the northern mixtures, the performance related weight factor for gradation is equal to 20.1/ = 22.3%. Accordingly, the following performance related weight factors were determined for each of the properties. Northern mixtures: o Gradation: 22.3% o Asphalt Binder Content: 33.3% o Compaction (i.e., Mat Density): 44.4% Southern mixtures: o Gradation: 26.7% o Asphalt Binder Content: 33.3% o Compaction (i.e., Mat Density): 40.0% Table 21. Effect of the Single Factor Violations on the Performance of Polymer-Modified Asphalt Mixtures. 1 Single Factor Violations Rutting Resistance Northern Nevada Mixtures Southern Nevada Mixture 2 Fatigue Thermal Fatigue Rutting Cracking Cracking Cracking Resistance Resistance Resistance Resistance Low on # 4-Sieve High on # 4-Sieve High on # 200-Sieve Low on Percent AC High on Percent AC Not Tested Low on Percent AV Impractical 3 High on Percent AV Not Tested Not Tested Not Tested 1 Statistical significance relative to the control mixture (i.e., at the JMF values): no significant effect to the violation on the mixture resistance; significant reduction in the mixture resistance as a result of violation; significant increase in the mixture resistance as a result of violation. 2 The resistance of southern mixtures to thermal cracking was not evaluated. 3 The HMA mixture that is low on the air-voids, and meeting the specification limits on the #4 and #200 sieves, and on the binder content was considered impractical because of the observed high compaction effort required to reach the 3% air-void level. 42
51 Property Table 22. Performance Related Weight Factors for Northern Mixtures. Rutting (WR = 40%) Fatigue Cracking (WFC = 30%) Thermal Cracking (WTC = 30%) Percent of Incidence (P = Positive Effect; N = Negative Effect) Overall Weighted Percent of Incidence Perf. Related Weight Factor P N P N P N P N Gradation % AC % Compaction % Sum % Property Table 23. Performance Related Weight Factors for Southern Mixtures Rutting (WR = 60%) Fatigue Cracking (WFC = 40%) Thermal Cracking (WTC = 0%) Overall Weighted Percent of Incidence Percent of Incidence (P = Positive Effect; N = Negative Effect) P N P N P N P N Perf. Related Weight Factor Gradation % Not AC % Applicable Compaction % Sum % For both, the northern and southern mixtures, the highest weight factor was for the compaction, followed by the asphalt binder content, then the gradation. The determined weight factors for the northern and southern mixtures were relatively similar for each of the properties. Therefore, the average values for the weight factors were calculated and recommended for the State of Nevada as follows: Gradation: 25% Asphalt Binder Content: 33% Compaction (i.e., Mat Density): 42% The overall PWL value for each lot shall be determined from the individual PWL values for aggregate gradation, AC, and compaction using the following equation. PWLOverall = 0.25 PWLGradation PWLAC PWLCompaction 43
52 3.4 Applications of the AASHTO Pay Factors The objective of this analysis was to apply the current AASHTO Pay Factor (PF) recommendation shown below with the recommended PWL calculations on the data from the nine NDOT Contracts. PF = 55 + (0.5 x PWL) The AASHTO PF assumes a 100% pay will be provided to the contractor at a PWL of 90% while the maximum pay will be at 105%. Figure 13 illustrates the calculated pay factors for all collected nine NDOT Contracts. The following steps were completed using the data from each of the nine NDOT Contracts: Identify the sublots and lots. For each lot, calculate the individual PWL values for gradations, AC and Compaction. For each lot, calculate the overall PWL value using the weight factors for gradations, AC, and Compaction as shown in Figure 13. For each lot, calculate the Pay Factor following the AASHTO recommendation as shown in Figure 14. Based on the calculated PF for each lot, the overall computed bonus or demerit that the contractor incurred along the duration of the project can be calculated according to the following equation: = For example, the computed individual bonus and demerit for the 45 lots in contract 3466 (RAP) is presented in Figure 15. It can be noticed that six lots (1, 9, 17, 23, 31, and 32) had high performance (PWL >100) resulting in considerable bonus that ranged from $1, (lot number 9) to $8, (lot number 31). On the other hand, three lots (21, 22, 37) had low performance (100<PWL<70) resulting in associated demerit costs that ranged from $1, (lot number 22) to $11, (lot number 21). In addition, Figure 16 shows the accumulated bonuses and demerits along the entire duration for contract 3466 (RAP). The data in Figure 16 indicate that a total of accumulated bonus of $3, was achieved by the end of the project. Note that the lots that had a PWL less than 70 are not considered in the PWL bonus/demerit analysis and are marked as rejected lots. 44
53 PWL, % PWL, % PWL, % Contract Lot number Contract Lot number Contract 3435 (RAP) Lot number PWL, % PWL, % PWL, % Contract Lot number Contract Lot number Contract 3466 (RAP) Lot number Figure 13. Calculated PWL (%) for all nine NDOT contracts PWL, % PWL, % PWL, % Contract Lot number Contract Lot number Contract 3505 (RAP) Lot number 45
54 Pay Factor, % Pay Factor, % Pay Factor, % Contract Lot number Contract Lot number Contract 3435 (RAP) Lot number Pay Factor, % Pay Factor, % Pay Factor, % Contract Lot number Contract Lot number Contract 3466 (RAP) Lot number Figure 14. Calculated pay factors (%) for all nine NDOT contracts Pay Factor, % Pay Factor, % Pay Factor, % Contract Lot number Contract Lot number Contract 3505 (RAP) Lot number 46
55 Gain/Loss per lot, $ Contract 3466 (RAP) Lot number Gain Loss Figure 15. Gain/loss per lot ($) versus lot number (Contract 3466 RAP) Cumulative gain per lot, $ Contract 3466 (RAP) Lot number Figure 16. Cumulative gain per lot ($) versus lot number (Contract 3466 RAP) 47
56 4.1 Implementation Plan CHAPTER 4. IMPLEMENTATION OF THE PWL SYSTEM Phase III of the project calls for the implementation of the developed PWL system on NDOT projects. The following implementation plan will be followed: The PWL System will be implemented under the following conditions: Dense graded asphalt mixtures. Projects larger than 25,000 tons. Mixtures constructed on main-lines. Year 2014: The PWL System will be applied on pilot projects, however the pay factors will not be implemented. Year 2015: The 100% pay will be provided at an overall PWL of 70. The maximum pay factor is fixed at 105%. The following payment procedure will be used: If PWL for any of the measured properties (i.e. Gradations, AC, Compaction) is less than 50, the lot is considered rejected. For 50 PWLOverall 80, = For PWLOverall > 80, PF = 105% For example: PF at (PWLOverall = 100) = 105% PF at (PWLOverall = 80) = 105% PF at (PWLOverall = 70) = 100% PF at (PWLOverall = 50) = 90% Year 2016: The 100% pay will be provided at an overall PWL of 80. The maximum pay factor is fixed at 105%. The following payment procedure will be used: If PWL for any of the measured properties (i.e. Gradations, AC, Compaction) is less than 60, the lot is considered rejected. For 60 PWLOverall 90, = For PWLOverall > 90, PF = 105% For example: PF at (PWLOverall = 100) = 105% PF at (PWLOverall = 90) = 105% PF at (PWLOverall = 80) = 100% PF at (PWLOverall = 60) = 90% Year 2017: The 100% pay will be provided at an overall PWL of 90. The maximum pay factor is fixed at 105%. The following payment procedure will be used: If PWL for any of the measured properties (i.e. Gradation, AC, Compaction) is less than 70, the lot is considered rejected. For PWLOverall 90, = For example: PF at (PWLOverall = 100) = 105% PF at (PWLOverall = 90) = 100% 48
57 PF at (PWLOverall = 70) = 90% Once the PWL system is fully implemented, a lot is considered rejected if the calculated PWL for any of the measured properties (i.e. Gradations, AC, Compaction) is less than 70. Currently all JMFs must match the broadband specification ranges for aggregate gradations. These specification ranges are the minimum and maximum numbers allowed when establishing the job-mix operational range for the combined percent passing targets. The job-mix operational range must be within the broadband specifications. NDOT will reassess this process and make a recommendation whether the full range on the individual sieves will be allowed regardless of the broadband specification. The accuracy of the ignition oven for the measurements of asphalt content and aggregate gradations shall be evaluated on each project and the necessary actions shall be taken as shown below: If a constant off-set is occurring between the ignition oven data and the JMF but the Va, VMA, Stability, TS, and TSR are within the specification, then the PWL shall be adjusted accordingly. If a constant off-set is occurring between the ignition oven data and the JMF but any of the Va, VMA, Stability, TS, and TSR are outside the specification, then a new mix design shall be conducted. 4.2 PWL Software The developed PWL System for Dense Graded Mixtures has been incorporated into a Microsoft Excel software. The developed PWL Software consists of a user-friendly spreadsheet along with a User Manual. The PWL Software incorporates all parts of the NDOT PWL system including: critical measures on gradations, AC, and compaction, determination of subolts and lots, calculations of individual PWL values and overall the PWL value for each lot, determination of pay factors and calculations of bonuses and demerits for each lot and for the entire project. REFRENCES 1. Schmitt, R.L., Russell, J.S., Hanna, A.S., Bahia, H.U., and Jung, G.S., Summary of Current Quality Control/Quality Assurance Practices for Hot-Mix Asphalt Concrete, Transportation Research Record 1632, Transportation Research Board, Washington, DC, Glossary of Highway Quality Assurance Terms, Transportation Research Circular N. E-C037, Transportation Research Board, Washington, DC, Weed, R.M., Quality Assurance Software for the Personal Computers, Publication No. FHWA-SA , Federal Highway Administration, Washington, DC, May Sebaaly, P. E., and Bazi, G., Impact of Construction Variability on Pavement Performance. Research Report No. 13DN-2, Nevada Department of Transportation, Construction Division, December

 888-7220 kchambers@dot.nv.")
58 Nevada Department of Transportation Rudy Malfabon, P.E. Director Ken Chambers, Research Division Chief (775) South Stewart Street Carson City, Nevada 89712
Percent Within Limits The NDOT Story
 Percent Within Limits The NDOT Story By Steve Hale, P.E. Quality Assurance Engineer Nevada Transportation Conference May 2 nd & 3 rd, 2017 Reno, Nevada Outline What is Percent Within Limits (PWL)? How
To Develop a Quality Control/Quality Assurance Plan For Hot Mix Asphalt. AASHTO PP qq
 1. Introduction Proposed Standard Practice To Develop a Quality Control/Quality Assurance Plan For Hot Mix Asphalt AASHTO PP qq 1.1. This standard practice presents specific details necessary to effectively
HMA Acceptance Specifications Assessing Contractor Risk
 HMA Acceptance Specifications Assessing Contractor Risk Who Really Has Risk? Adam J.T. Hand, PhD, PE University of Nevada, Reno 80 th IAPA Annual Meeting Springfield, IL March 13, 2017 1 Outline Introduction
SUPPLEMENT 1127 PAY FACTORS DETERMINATION FOR PAVEMENT AND STRUCTURE CONCRETE
 State of Ohio Department of Transportation SUPPLEMENT 1127 PAY FACTORS DETERMINATION FOR PAVEMENT AND STRUCTURE CONCRETE July 17, 2015 1127.01 Scope 1127.02 Structures 1127.03 Pavements 1127.04 Tables
Alaska University Transportation Center
 Alaska Department of Transportation & Public Facilities Alaska University Transportation Center Structural Health Monitoring and Condition Assessment of Chulitna River Bridge: Training Report Prepared
Verification of Rut Depth Collected with the INO Laser Rut Measurement System (LRMS)
") Verification of Rut Depth Collected with the INO Laser Rut Measurement System (LRMS) Bradley R. Hoffman and Shad M. Sargand Prepared in cooperation with The Ohio Department of Transportation And the U.S.
Verification of Rut Depth Collected with the INO Laser Rut Measurement System (LRMS) Bradley R. Hoffman and Shad M. Sargand Prepared in cooperation with The Ohio Department of Transportation And the U.S.
Summer Assignment for AP Environmental Science
 Summer Assignment for AP Environmental Science 1. Reading Writing Critically about Environmental Science Issues Read The Ghost Map and write a paper in which you focus on: How the water supply and delivery
Report No. K-TRAN: KSU-09-7 P1 FINAL REPORT December Daba Gedafa, Ph.D., P.E. Mustaque Hossain, Ph.D., P.E. Lon Ingram, P.E.
 Report No. K-TRAN: KSU-09-7 P1 FINAL REPORT December 2012 Review of Data in Construction Management System (CMS) and Quality Control and Quality Assurance (QC/QA) Databases to Improve Current Specifications
Content of Presentation
 Statistical Analysis Determining payment NEC/AAAE 2017 Annual Airport Conference Hershey, PA Content of Presentation Explain concept behind Percentage Within Limits (PWL) Demonstrate importance of process
Northern York County School District Curriculum
 Northern York County School District Curriculum Course Name Grade Level Mathematics Fourth grade Unit 1 Number and Operations Base Ten Time Frame 4-5 Weeks PA Common Core Standard (Descriptor) (Grades
Texas Transportation Institute The Texas A&M University System College Station, Texas
 1. Report No. FHWA/TX-06/5-4577-01-1 4. Title and Subtitle PILOT IMPLEMENTATION OF PAVE-IR FOR DETECTING SEGREGATION IN HOT-MIX ASPHALT CONSTRUCTION 2. Government Accession No. 3. Recipient's Catalog No.
Central Federal Lands Division Data Collection Packages
 Central Federal Lands Division Data Collection Packages Final Report March 2011 [Type text] Department of Transportation Federal Highway Administration Central Federal Lands Division 12300 W. Dakota Avenue
Measurement and Data Core Guide Grade 4
 Solve problems involving measurement and conversion of measurements from a larger unit to a smaller unit (Standards 4.MD.1 2) Standard 4.MD.1 Know relative sizes of measurement units within each system
Why is math important in. healthcare?
 00 000 00 0 000 000 0 Why is math important in 00 000 00 0 000 000 0 healthcare? Health care workers are required to perform simple math calculations when doing various tasks. Mathematical errors may result
Step 1 Calculate the square feet of roadway covered with tack 1,000 ft. x 12 ft. = 12,000 square feet
 Tack Rate Problem # CRS-2 Tack (Specific Gravity=.00) was applied to the roadway. The temperature measured from the tack distributor was 25 F. The length of the application was 000 feet. The width of the
Grade 6 Mathematics Practice Test
 Grade 6 Mathematics Practice Test Nebraska Department of Education 2010 Directions: On the following pages are multiple-choice questions for the Grade 6 Practice Test, a practice opportunity for the Nebraska
Converting Within Measurement Systems. ESSENTIAL QUESTION How do you convert units within a measurement system? 6.RP.1.3d
 ? L E S S O N 7.3 Converting Within Measurement Systems ESSENTIAL QUESTION How do you convert units within a measurement system? Use ratio reasoning to convert measurement units; manipulate and transform
4th Grade Common Core Math Vocabulary
 + = + = + = + = + 4th Grade Common Core Math Vocabulary Created by Alexis Sergi Alexis Sergi http://www.teachersnotebook.com/shop/mathmojo = + = + + = + = + 1 Table of Contents!!!!!!!!!!!! Page Number
Converting Within Measurement Systems. ESSENTIAL QUESTION How do you convert units within a measurement system? 6.RP.1.3d
 L E S S O N 7.3 Converting Within Measurement Systems Use ratio reasoning to convert measurment units; manipulate and transform units appropriately when multiplying or dividing quantities. Also 6.RP.1.3
METRIC TT-B-1325C June 1, 1993 SUPERSEDING TT-B-1325B April 25, 1978 FEDERAL SPECIFICATION BEADS (GLASS SPHERES) RETRO-REFLECTIVE
 RETRO-REFLECTIVE") METRIC June 1, 1993 SUPERSEDING TT-B-1325B April 25, 1978 FEDERAL SPECIFICATION BEADS (GLASS SPHERES) RETRO-REFLECTIVE This specification is approved by the Commissioner, Federal Supply Service, General
METRIC June 1, 1993 SUPERSEDING TT-B-1325B April 25, 1978 FEDERAL SPECIFICATION BEADS (GLASS SPHERES) RETRO-REFLECTIVE This specification is approved by the Commissioner, Federal Supply Service, General
USE OF TEAR-OFF RECYCLED SHINGLES IN ASPHALT PAVEMENTS
 USE OF TEAR-OFF RECYCLED SHINGLES IN ASPHALT PAVEMENTS Larry Shively The Shelly Company Ohio Asphalt Paving & North Central User Producer Group Conference Columbus, Oh February 2, 2011 Background 10 million
Quality Assurance Where does the Future Lead US. John D AngeloD Federal Highway Administration
 Quality Assurance Where does the Future Lead US John D AngeloD Federal Highway Administration QA of the Past Material Testing Aggregate Gradations stock pile or cold feeds Binder Content volume measurement
Case Study: Roofing Shingle Scrap in Hot Mix Asphalt, TxDOT Dallas District. Project Overview
 Case Study: Roofing Shingle Scrap in Hot Mix Asphalt, TxDOT Dallas District Project Overview In 1997, TxDOT tested two 1,000-foot sections of roadway using a Type C asphalt mix with AC 20 and roofing shingles.
STRAIN MONITORING FOR HORSETAIL FALLS AND SYLVAN BRIDGES. Final Report
 STRAIN MONITORING FOR HORSETAIL FALLS AND SYLVAN BRIDGES Final Report SPR 34-81 by Steven Soltesz Oregon Department of Transportation Research Group for Oregon Department of Transportation Research Group
A Contractor s View of PWL (Michigan Experience)
") A Contractor s View of PWL (Michigan Experience) Peter Capon Rieth-Riley Construction Co., Inc. January 10, 2007 PWL View - New way of thinking - Needs a different approach - Learn how Acceptance Criteria
A Contractor s View of PWL (Michigan Experience) Peter Capon Rieth-Riley Construction Co., Inc. January 10, 2007 PWL View - New way of thinking - Needs a different approach - Learn how Acceptance Criteria
2.02 Units and the Metric System
 2.02 Units and the Metric System Dr. Fred Omega Garces Chemistry 100 Miramar College 1 2.02 Units and the Metric System Measurements In our daily lives we deal with making measurement routinely. i.e.,
Project No.: VTRC 06-R22 March Period Covered: Contract No.
 Standard Title Page - Report on State Project Report No. Report Date No. Pages Type Report: Final Project No.: 78783 VTRC 06-R22 March 2006 17 Period Covered: Contract No. Title: Evaluation of Precast
MATH NEWS. 5 th Grade Math. Focus Area Topic A. Grade 5, Module 2, Topic A. Words to know. Things to Remember:
 MATH NEWS Grade 5, Module 2, Topic A 5 th Grade Math Focus Area Topic A Math Parent Letter This document is created to give parents and students a better understanding of the math concepts found in Eureka
Math 6/7 Unit 10 - GEOMETRY - Study Guide (SOL 6.10)
") Math 6/7 Unit 10 - GEOMETRY - Study Guide (SOL 6.10) Find the perimeter of the following (include the correct units): 1) 2) 5.3 cm 15 ft 15 ft 10.6 cm 18 ft P = P = Solve the following (include the correct
Math 6/7 Unit 10 - GEOMETRY - Study Guide (SOL 6.10) Find the perimeter of the following (include the correct units): 1) 2) 5.3 cm 15 ft 15 ft 10.6 cm 18 ft P = P = Solve the following (include the correct
3 All Weather Paint. Product Bulletin January Second Drop Glass Beads
 3 All Weather Paint Product Bulletin January 2010 Description 3M All Weather Paint is a traffic paint system consisting of high-build waterborne paint and 3M bonded core elements. 3M all weather paint
+ 4 ~ You divided 24 by 6 which equals x = 41. 5th Grade Math Notes. **Hint: Zero can NEVER be a denominator.**
 Basic Fraction numerator - (the # of pieces shaded or unshaded) denominator - (the total number of pieces) 5th Grade Math Notes Mixed Numbers and Improper Fractions When converting a mixed number into
STATE OF OHIO DEPARTMENT OF TRANSPORTATION. SUPPLEMENTAL SPECIFICATION 817 SPRAY THERMOPLASTIC PAVEMENT MARKING April 15, 2011
 817.01 Description 817.02 Materials 817.03 Equipment 817.04 Surface Preparation 817.05 Application 817.06 Basis of Payment STATE OF OHIO DEPARTMENT OF TRANSPORTATION SUPPLEMENTAL SPECIFICATION 817 SPRAY
Stabilized Base IC Demonstration US 84, Wayne County, MS Mississippi State Department of Transportation Experimental Plan
 Plac e your mes sage here. F or maximum i mpact, us e t wo or thr ee sent ences. Accelerated Implementation of Intelligent Compaction Technology for Embankment Subgrade Soils, Aggregate Base, and Asphalt
FHWA s Demonstration Project for Enhanced Durability Through Increased Density
 FHWA s Demonstration Project for Enhanced Durability Through Increased Density Courtesy Asphalt Institute TIM ASCHENBRENER, P.E. SENIOR ASPHALT PAVEMENT ENGINEER PAVEMENT MATERIALS TEAM OFFICE OF PRECONSTRUCTION,
Measurement / Scale Long-Term Memory Review Grade 6, Standard 3.0 Review 1
 Review 1 1. Convert: 240 mg to g 2. Name a metric unit that measures capacity. 3. Explain how to convert feet to inches. 4. Complete this table:.004 4 1 10,000 5. Joe and Lola are hanging picture frames.
ITEM 644 THERMOPLASTIC PAVEMENT MARKING
 ITEM 644 THERMOPLASTIC PAVEMENT MARKING 644.01 Description 644.02 Materials 644.03 Equipment 644.04 Application 644.05 Layout and Premarking 644.06 Basis of Payment 644.01 Description. This work consists
DATA EXPRESSION AND ANALYSIS
 NAME Lab Day DATA EXPRESSION AND ANALYSIS LABORATORY 1 OBJECTIVES Understand the basis of science and the scientific method. Understand exponents and the metric system. Understand the metric units of length,
NUTC R293. Field Evaluation of Thermographic Bridge Concrete Inspection Techniques. Glenn Washer
 Field Evaluation of Thermographic Bridge Concrete Inspection Techniques by Glenn Washer NUTC R293 A National University Transportation Center at Missouri University of Science and Technology Disclaimer
Pave-IR Scan TM Primer
 SHRP2 Solution: Technologies to Enhance Quality Control on Asphalt Pavements Introduction Pave-IR Scan TM Primer In-place density is a critical factor in determining pavement durability in hot mix asphalt
Number Line: Comparing and Ordering Integers (page 6)
") LESSON Name 1 Number Line: Comparing and Ordering Integers (page 6) A number line shows numbers in order from least to greatest. The number line has zero at the center. Numbers to the right of zero are
LESSON Name 1 Number Line: Comparing and Ordering Integers (page 6) A number line shows numbers in order from least to greatest. The number line has zero at the center. Numbers to the right of zero are
TECHNICAL REPORT STANDARD TITLE PAGE TX September Performing Organization Code
 1. Report No. 2. Government Accession No. TX-92-1923-1 4. Title and Subtitle Influence of Asphalt Layering and Surface Treatments on Asphalt and Base Layer Thickness Computations Using Radar 7. Author(s)
Product Bulletin July 2011
 3 Dry Elements Dry Standard/S Elements for Paint and Thermoplastic Pavement Markings Dry P Elements for 3M Polyurea Pavement Markings Dry E Elements for Epoxy Pavement Markings Dry M Elements for MMA Pavement
Remember: Equilateral All sides and angles equal. Right-Angled Includes one right angle (90 ) Scalene No sides equal.
 Scalene No sides equal.") Prime Numbers Square Numbers 2 3 5 6 7 8 9 0 3 5 6 7 8 9 20 2 22 23 2 25 26 27 28 29 30 3 32 33 3 35 36 37 38 39 0 2 3 5 6 7 8 9 50 5 52 53 5 55 56 57 58 59 60 6 62 63 6 65 66 67 68 69 70 Only divisible
Prime Numbers Square Numbers 2 3 5 6 7 8 9 0 3 5 6 7 8 9 20 2 22 23 2 25 26 27 28 29 30 3 32 33 3 35 36 37 38 39 0 2 3 5 6 7 8 9 50 5 52 53 5 55 56 57 58 59 60 6 62 63 6 65 66 67 68 69 70 Only divisible
EFFECT OF GRADATION OF AGGREGATES ON MARSHALL PROPERTIES OF SDBC MIX DESIGN
 IJRET: International Journal of Research in Engineering and Technology eissn: 23191163 pissn: 23217308 EFFECT OF GRADATION OF AGGREGATES ON MARSHALL PROPERTIES OF SDBC MIX DESIGN Deepesh Kumar Singh Lodhi
SPECIFICATION FOR WATERBORNE TRAFFIC LINE PAINT
 Page 1 of 5 ATTACHMENT I Commonwealth of Pennsylvania Department of Transportation SPECIFICATION FOR WATERBORNE TRAFFIC LINE PAINT August 14, 2006 1. SCOPE 1.1 Scope. This specification covers fast-drying
Technical Report Documentation Page 2. Government 3. Recipient s Catalog No.
 1. Report No. FHWA/TX-06/0-4958-1 Technical Report Documentation Page 2. Government 3. Recipient s Catalog No. Accession No. 4. Title and Subtitle Linear Lighting System for Automated Pavement Distress
FEDERAL SPECIFICATION WIRE, ELECTRICAL, COPPER (UNINSULATED)
") 8 April 99 SUPERSEDING QQ-W-343F 9 November 990 FEDERAL SPECIFICATION WIRE, ELECTRICAL, COPPER (UNINSULATED) This specification was approved by the Commissioner, Federal Supply Service, General Services
8 April 99 SUPERSEDING QQ-W-343F 9 November 990 FEDERAL SPECIFICATION WIRE, ELECTRICAL, COPPER (UNINSULATED) This specification was approved by the Commissioner, Federal Supply Service, General Services
Joint Evaluation Report
 0 Joint Evaluation Report ICC-ES (800) 423-6587 (562) 699-0543 www.icc-es.org 000 ESR-2909 Reissued 09/2017 This report is subject to renewal 09/2019. DIVISION: 06 00 00 WOOD, PLASTICS AND COMPOSITES SECTION:
EXPERIMENTAL INVESTIGATION OF STONE MASTIC ASPHALT BY VARYING MIX DESIGN
 EXPERIMENTAL INVESTIGATION OF STONE MASTIC ASPHALT BY VARYING MIX DESIGN Prerana C Shekar 1, Rajath B H 2, J S Vishwas 3 1,2 Under Graduate Student, Department of Civil Engineering, PES University, Bengaluru,
Measurement. & Calculations. Chapter Scientific Notation. Quantitative observation. Comparison based on an accepted scale e.g.
 Measurements & Calculations Chapter 2 All rights reserved 1 Measurement Quantitative observation Comparison based on an accepted scale e.g. Meter stick 2 Parts Number & Unit Number is a comparison Units
11. Contract or Grant No. Lubbock, Texas Project
 TECHNICAL REPORT DOCUMENTATION PAGE 1. Report No. 2. Government Accession No. 3. Recipient's Catalog No. TX -99/7-4936-2 4. Title and Subtitle 5. Report Date Test Method Tex-899-B Radio-Frequency Interference
Application Brief TROXLER MODEL 3450
 Application Brief TROXLER MODEL 3450 Roadreader Plus Nuclear Moisture Density & Thin Layer Gauge May 2007 Introduction The Troxler Model 3450, Roadreader Plus, nuclear moisture / density gauge offers the
Summer Solutions Common Core Mathematics 4. Common Core. Mathematics. Help Pages
 4 Common Core Mathematics 63 Vocabulary Acute angle an angle measuring less than 90 Area the amount of space within a polygon; area is always measured in square units (feet 2, meters 2, ) Congruent figures
COMMERCIAL ITEM DESCRIPTION SPLICE CONNECTORS
 INCH-POUND A-A-59213A 28 May 2009 SUPERSEDING A-A-59213 18 May 1998 COMMERCIAL ITEM DESCRIPTION SPLICE CONNECTORS The General Services Administration has authorized the use of this commercial item description
For Preview Only GEO5 STUDENT PAGES. GEOMETRY AND MEASUREMENT Student Pages for Packet 5: Measurement. Name Period Date
 Name Period Date GEO5 STUDENT PAGES GEOMETRY AND MEASUREMENT Student Pages for Packet 5: GEO5.1 Conversions Compare measurements within and between measurement systems. Convert measurements within and
Minute Simplify: 12( ) = 3. Circle all of the following equal to : % Cross out the three-dimensional shape.
 = 3. Circle all of the following equal to : % Cross out the three-dimensional shape.") Minute 1 1. Simplify: 1( + 7 + 1) =. 7 = 10 10. Circle all of the following equal to : 0. 0% 5 100. 10 = 5 5. Cross out the three-dimensional shape. 6. Each side of the regular pentagon is 5 centimeters.
Minute 1 1. Simplify: 1( + 7 + 1) =. 7 = 10 10. Circle all of the following equal to : 0. 0% 5 100. 10 = 5 5. Cross out the three-dimensional shape. 6. Each side of the regular pentagon is 5 centimeters.
Tire/Pavement Noise 1
 Tire/Pavement Noise 1 Nature of highway noise Tire/pavement! Generally the primary source at highway speeds (greater than 35 mph) " Level is dependent on vehicle type, vehicle speed and tire type! Other
Dowel Bar Standardization. NC^2 Spring Meeting Savannah, GA
 Dowel Bar Standardization NC^2 Spring Meeting Savannah, GA Dowel Bar Task Force Maria Masten, Minnesota DOT Mark Snyder, ACPA Pennsylvania Matt Zeller, Concrete Paving Association of Minnesota Tom Cackler,
Long-term Memory Review CRT PRACTICE 6 th Grade: MONDAY REVIEW STATE STANDARDS AND 3.6.2
 CRT PRACTICE 6 th Grade: MONDAY REVIEW 1) Convert: 240 mg to g 2) Name a metric unit that measures capacity. 3) Explain how one would convert feet to inches. 4) Complete this table:.004 4 1 10,000 5) Joe
Seal Coats and Surface Treatments Fred J. Benson, Dean of Engineering A. and M. College of Texas College Station, Texas The construction, as here
 Seal Coats and Surface Treatments Fred J. Benson, Dean of Engineering A. and M. College of Texas College Station, Texas The construction, as here discussed, consists of an application of bituminous material
ICC-ES Evaluation Report
 ICC-ES Evaluation Report ESR-6 Reissued April, 009 This report is subject to re-examination in two years. www.icc-es.org (800) 4-6587 (56) 699-054 A Subsidiary of the International Code Council DIVISION:
SIXTH GRADE MATHEMATICS CHAPTER 10 AREA AND PERIMETER TOPICS COVERED:
 SIXTH GRADE MATHEMATICS CHAPTER 10 AREA AND PERIMETER TOPICS COVERED: Perimeter of Polygons Area of Parallelograms Area of Triangles Area of a Trapezoid Area of Irregular Figures Activity 10-1: Sixth Grade
Non-destructive Evaluation of Bituminous Compaction Uniformity Using Rolling Density
 Non-destructive Evaluation of Bituminous Compaction Uniformity Using Rolling Density October 2017 Lev Khazanovich, PhD Kyle Hoegh, PhD Ryan Conway Shongtao Dai, PhD, PE University of Pittsburgh University
DOT-VNTSC-FAA Edward J. Rickley Joyce E. Rosenbaum Gregg G. Fleming Christopher J. Roof Eric R. Boeker
 DOT-VNTSC-FAA-12-14 DEVELOPMENT OF SIMPLIFIED PROCEDURE FOR COMPUTING THE ABSORPTION OF SOUND BY THE ATMOSPHERE AND APPLICABILITY TO AIRCRAFT NOISE CERTIFICATION: PROPOSED SAE METHOD Edward J. Rickley
POSTPRINT UNITED STATES AIR FORCE RESEARCH ON AIRFIELD PAVEMENT REPAIRS USING PRECAST PORTLAND CEMENT CONCRETE (PCC) SLABS (BRIEFING SLIDES)
 SLABS (BRIEFING SLIDES)") POSTPRINT AFRL-RX-TY-TP-2008-4582 UNITED STATES AIR FORCE RESEARCH ON AIRFIELD PAVEMENT REPAIRS USING PRECAST PORTLAND CEMENT CONCRETE (PCC) SLABS (BRIEFING SLIDES) Athar Saeed, PhD, PE Applied Research
POSTPRINT AFRL-RX-TY-TP-2008-4582 UNITED STATES AIR FORCE RESEARCH ON AIRFIELD PAVEMENT REPAIRS USING PRECAST PORTLAND CEMENT CONCRETE (PCC) SLABS (BRIEFING SLIDES) Athar Saeed, PhD, PE Applied Research
ShillerMath Book 4 Test Answers
 ShillerMath Book 4 Test Answers LESSON 4-44 REVIEW TEST #4-1 ANSWERS HOW KIDS LEARN MATH Grading instructions: compare the answers here to the student s answers. For each correct answer, add the appropriate
4 rows of 6 4 x 6 = rows of 4 6 x 4 = 24
 Arrays 8/8/16 Array a rectangular arrangement of equal rows 4 4 rows of 6 4 x 6 = 24 6 6 6 rows of 4 6 x 4 = 24 4 Dimension the number of rows and columns in an array Multiplication the operation of repeated
NEXT GENERATION SMART BARREL SYSTEM FOR WORKZONE SAFETY ENHANCEMENT
 NEXT GENERATION SMART BARREL SYSTEM FOR WORKZONE SAFETY ENHANCEMENT FINAL REPORT ~ FHWA-OK-12-02 ODOT SP&R ITEM NUMBER 2232 Submitted to: John Bowman, P.E. Planning & Research Division Engineer Oklahoma
Design and Production Control of SMA Mixes
 Design and Production Control of SMA Mixes SMA Mixture Design Steps Selection of Materials Design Aggregate Structure Design Binder Content Performance Test Test Section Selection of Materials Asphalt
PORTABLE WEIGH-IN-MOTION FOR PAVEMENT DESIGN - PHASES 1 AND 2
 Oklahoma Department of Transportation 200 NE 21st Street, Oklahoma City, OK 73105-3204 FINAL REPORT ~ FHWA-OK-14-07 PORTABLE WEIGH-IN-MOTION FOR PAVEMENT DESIGN - PHASES 1 AND 2 Hazem Refai, Ph.D. Ahmad
ESR-2648 Reissued May 1, 2012 This report is subject to renewal June 1, 2013.
 ICC-ES Evaluation Report ESR-2648 Reissued May 1, 2012 This report is subject to renewal June 1, 2013. www.icc-es.org (800) 423-6587 (562) 699-0543 A Subsidiary of the International Code Council DIVISION:
4.1. Foremen 4.2. Concrete plant manager 4.3. Concrete plant operator 4.4. Personnel performing saw cutting and joint sealing
 10-1. JOINTED PLAIN CONCRETE PAVEMENT GENERAL Summary This work includes constructing jointed plain concrete pavement. Comply with Section 40, "Concrete Pavement," of the Standard Specifications. Submittals
Thermal Segregation. Wednesday, December 8, 2010 SEAUPG 2010 ANNUAL CONFERENCE OKLAHOMA CITY, OK. Acknowledgements. Thermal Segregation - Background
 Thermal Segregation 2010 SEAUPG Meeting Oklahoma City Acknowledgements Richard Izzo, P.E. - TxDOT Stephen Sebesta TTI Texas Transportation Institute (TTI) National Center for Asphalt Technology (NCAT)
GRADE 4. M : Solve division problems without remainders. M : Recall basic addition, subtraction, and multiplication facts.
 GRADE 4 Students will: Operations and Algebraic Thinking Use the four operations with whole numbers to solve problems. 1. Interpret a multiplication equation as a comparison, e.g., interpret 35 = 5 7 as
Standard Title Page - Report on Federally Funded Project 1. Report No. 2. Government Accession No. 3. Recipient s Catalog No.
 Standard Title Page - Report on Federally Funded Project 1. Report No. 2. Government Accession No. 3. Recipient s Catalog No. FHWA/VTRC 05-R34 4. Title and Subtitle 5. Report Date Texture, Ride Quality,
Slate Shingle Specifications
 Slate Shingle Specifications California Slate is a proud member of the Slate Roofing Contractors Association of North America, Inc. (SRCA) which publishes Section 07310 Slate Shingles setting forth architectural
HAND RECEIPT COVERING CONTENTS OF COMPONENTS OF END ITEM (COEI), BASIC ISSUE ITEMS (BII), AND ADDITIONAL AUTHORIZATION LIST (AAL) FOR
, BASIC ISSUE ITEMS (BII), AND ADDITIONAL AUTHORIZATION LIST (AAL) FOR") TM 32-5895-263-14&P-HR HAND RECEIPT COVERING CONTENTS OF COMPONENTS OF END ITEM (COEI), BASIC ISSUE ITEMS (BII), AND ADDITIONAL AUTHORIZATION LIST (AAL) FOR MONITORING SET, RADIO AN/TRR-33 NSN 5895-00-168-9564
TM 32-5895-263-14&P-HR HAND RECEIPT COVERING CONTENTS OF COMPONENTS OF END ITEM (COEI), BASIC ISSUE ITEMS (BII), AND ADDITIONAL AUTHORIZATION LIST (AAL) FOR MONITORING SET, RADIO AN/TRR-33 NSN 5895-00-168-9564
C. For cold-applied tape, the pavement temperature shall be at least 70 F.
 SECTION 6100 - PAVEMENT MARKING (THERMOPLASTIC) PART 1 - GENERAL 1.01 SCOPE: This Section covers hot-applied, extruded thermoplastic and cold-applied tape for white and yellow pavement marking. Topics
WITH MATH INTERMEDIATE/MIDDLE (IM) GRADE 6
 GRADE 6") May 06 VIRGINIA MATHEMATICS STANDARDS OF LEARNING CORRELATED TO MOVING WITH MATH INTERMEDIATE/MIDDLE (IM) GRADE 6 NUMBER AND NUMBER SENSE 6.1 The student will identify representations of a given percent
May 06 VIRGINIA MATHEMATICS STANDARDS OF LEARNING CORRELATED TO MOVING WITH MATH INTERMEDIATE/MIDDLE (IM) GRADE 6 NUMBER AND NUMBER SENSE 6.1 The student will identify representations of a given percent
Math Review Packet. Grades. for th. Multiplication, Division, Decimals, Fractions, Metric & Customary Measurements, & Volume Math in the Middle
 Math Review Packet for th 5 th 6 Grades Multiplication, Division, Decimals, Fractions, Metric & Customary Measurements, & Volume 206 Math in the Middle Multiplying Whole Numbers. Write the problem vertically
Wednesday. Friday. Monday. Thursday. Tuesday. Name: Monday March 14 th Performance Coach pages
 Homework Students will continue reviewing for the FSA. Please check and make sure your children are completing their homework and showing their work. There will be a Quiz on Thursday reviewing Performance
STATE OF OHIO DEPARTMENT OF TRANSPORTATION SUPPLEMENT SUBMITTAL AND APPLICATION REQUIREMENTS FOR ProVAL PAVEMENT SMOOTHNESS SOFTWARE
 STATE OF OHIO DEPARTMENT OF TRANSPORTATION SUPPLEMENT 1110 SUBMITTAL AND APPLICATION REQUIREMENTS FOR ProVAL PAVEMENT SMOOTHNESS SOFTWARE April 18, 2014 1110.01 Scope 1110.02 Acquiring software 1110.03
EMBRACING A QUALITY CULTURE
 EMBRACING A QUALITY CULTURE Flexible Pavements of Ohio, 49 th Annual Meeting More Tons Through Value Harold Mullen Texas Asphalt Pavement Association DALLAS COWBOYS STADIUM How Bout Them Cowboys Parking
Passages Between Acklins Island, Haiti and Caicos Islands NGA Chart A reduced-scale NGA nautical chart for small boaters
 BookletChart Passages Between Acklins Island, Haiti and Caicos Islands NGA Chart 26260 A reduced-scale NGA nautical chart for small boaters When possible, use the full-size NGA chart or Electronic Nautical
FOAMED BITUMEN STABILISATION PROJECT WARWICK, QLD
 FOAMED BITUMEN STABILISATION PROJECT WARWICK, QLD 1 INTRODUCTION by Warren Smith Stabilised Pavements of Australia The Department of Main Roads, Queensland, has for some time been looking at using bitumen
ESR-1254 * DELETED BY CITY OF LOS ANGELES. Reissued April 1, 2006 This report is subject to re-examination in one year.
 ESR-1254 Reissued April 1, 2006 This report is subject to re-examination in one year. www.icc-es.org Business/Regional Office 5360 Workman Mill Road, Whittier, California 90601 (562) 699-0543 Regional
Enrichment ,000 1, ,000 5
 4- Multiplying by 0, 00, and,000 Can you see a pattern in these multiplications? 5.9 5.9 5.9 0 00,000 59.0 59. 59.00 59. 5,9.000 5,9 When you multiply a number by 0, 00, or,000, the product contains the
An Experimental Study on Effect of Scrap Tyre Crumbed Rubber on 80/100 Grade Bitumen
 IJIRST International Journal for Innovative Research in Science & Technology Volume 2 Issue 9 February 21 ISSN (online): 2349-1 An Experimental Study on Effect of Scrap Tyre Crumbed Rubber on 8/1 Grade
GEOMETRIC REPRESENTATIONS AND TRANSFORMATIONS MTH Scored Activity 1. Date sent:... Student's identification. Name:...
 GEOMETRIC REPRESENTATIONS AND TRANSFORMATIONS MTH-2102-3 Scored Activity 1 Date sent:... Student's identification Name:... Address:...... Tel. No.:... Email:... Mark:... /100 September 2012 1930-07 MTH-2102-3
DIVISION: WOOD, PLASTICS AND COMPOSITES SECTION: WOOD, PLASTIC, AND COMPOSITE FASTENINGS REPORT HOLDER:
 0 Most Widely Accepted and Trusted ICC ES Evaluation Report ICC ES 000 (800) 423 6587 (562) 699 0543 www.icc es.org ESR 2761 Reissued 10/2017 This report is subject to renewal 10/2019. DIVISION: 06 00
INCH-POUND TT-B-1325D 06 August 2007 SUPERSEDING TT-B-1325C June 1, 1993 FEDERAL SPECIFICATION BEADS (GLASS SPHERES) RETRO-REFLECTIVE
 RETRO-REFLECTIVE") INCH-POUND TT-B-1325D 06 August 2007 SUPERSEDING TT-B-1325C June 1, 1993 FEDERAL SPECIFICATION BEADS (GLASS SPHERES) RETRO-REFLECTIVE The General Services Administration has authorized the use of this
INCH-POUND TT-B-1325D 06 August 2007 SUPERSEDING TT-B-1325C June 1, 1993 FEDERAL SPECIFICATION BEADS (GLASS SPHERES) RETRO-REFLECTIVE The General Services Administration has authorized the use of this
Large Scale CalArc Pavers for Sand-Set Pedestrian Use Installations
 The following specification refers to the Stepstone, Inc. product known as: Large Scale CalArc Pavers for Sand-Set Pedestrian Use Installations Large Scale CalArc Pavers are part of the California Architectural
4 th Grade Math Notebook
 4 th Grade Math Notebook By: Aligned to the VA SOLs Table of Contents Quarter 1 Table of Contents Quarter 2 Table of Contents Quarter 3 Table of Contents Quarter 4 Hundred Millions Ten Millions Millions
CORRECTED RMS ERROR AND EFFECTIVE NUMBER OF BITS FOR SINEWAVE ADC TESTS
 CORRECTED RMS ERROR AND EFFECTIVE NUMBER OF BITS FOR SINEWAVE ADC TESTS Jerome J. Blair Bechtel Nevada, Las Vegas, Nevada, USA Phone: 7/95-647, Fax: 7/95-335 email: blairjj@nv.doe.gov Thomas E Linnenbrink
VGLA COE Organizer Mathematics 4
 4.1 The Student will identify the place value for each digit in a whole number expressed through millions a) orally and in writing; b) compare two whole numbers expressed through millions, using symbols
RR-F-191/1D 14 May SUPERCEDING RR-F-191/1C July 22, 1981 FEDERAL SPECIFICATION SHEET
 14 May 1990 ----------- SUPERCEDING RR-F-191/1C July 22, 1981 FEDERAL SPECIFICATION SHEET FENCING, WIRE AND POST METAL (CHAIN-LINK FENCE FABRIC) (DETAIL SPECIFICATION) This Federal Specification is approved
J O I N T I N D U S T R Y S T A N D A R D. Requirements for Soldering Pastes J Standard 005A. December 2011
 J O I N T I N D U S T R Y S T A N D A R D Requirements for Soldering Pastes J Standard 005A December 2011 Requirements for Soldering Pastes 1.0 SCOPE 1.1 Scope This standard prescribes general requirements
2 Scale Drawings Def: a special ratio that gives the. 3 Measurements
 1 Percents Def: a special ratio in which the denominator is 100 Formula pppppppp (iiii) = % wwwwwwwwww (oooo) 111111 What percent of $10 is $4? 2 Scale Drawings Def: a special ratio that gives the relationship
BookletChart. Port-au-Prince (Haiti) NGA Chart A reduced-scale NGA nautical chart for small boaters
 NGA Chart A reduced-scale NGA nautical chart for small boaters") BookletChart Port-au-Prince (Haiti) NGA Chart 26186 A reduced-scale NGA nautical chart for small boaters When possible, use the full-size NGA chart or Electronic Nautical Chart (ENC) for navigation. VHF
BookletChart Port-au-Prince (Haiti) NGA Chart 26186 A reduced-scale NGA nautical chart for small boaters When possible, use the full-size NGA chart or Electronic Nautical Chart (ENC) for navigation. VHF
The Shell Bitumen Handbook
 The Shell Bitumen Handbook Sixth edition Principal aufhors Dr Robert N. Hunter, Andy Self and Professor John Read Shell Bitumen Contents About the principal authors Foreword Acknowledgements xii xiv xv