Verification of Rut Depth Collected with the INO Laser Rut Measurement System (LRMS)
|
|
|
- Vincent Shelton
- 6 years ago
- Views:
Transcription
 Bradley R.")


1 Verification of Rut Depth Collected with the INO Laser Rut Measurement System (LRMS) Bradley R. Hoffman and Shad M. Sargand Prepared in cooperation with The Ohio Department of Transportation And the U.S. Department of Transporation, Federal Highway Administration Student Study Report No. FHWA/OH-2011/18 State Job No October 2011 Ohio Research Institute for Transportation and the Environment
2
3 1. Report No. FHWA/OH-2011/18 2. Government Accession No. 3. Recipient s Catalog No. 4. Title and Subtitle Verification of Rut Depth Collected with the INO Laser Rut Measurement System (LRMS) 7. Author(s) Bradley R. Hoffman, Shad M. Sargand 9. Performing Organization Name and Address Ohio Research Institute for Transportation and the Environment (ORITE) 141 Stocker Center Ohio University Athens OH Sponsoring Agency Name and Address Ohio Department of Transportation Innovation, Research, and Implementation Section 1980 West Broad St. Columbus OH Report Date October 28, Performing Organization Code 8. Performing Organization Report No. 10. Work Unit No. (TRAIS) 11. Contract or Grant No. SJN: Agreement No Type of Report and Period Covered Student Study 14. Sponsoring Agency Code 15. Supplementary Notes 16. Abstract Pavement rutting can be an indicator that a section of roadway is in need of repair or replacement. It can also become a hazard to drivers, causing loss of control or hydroplaning when water accumulates. To better monitor pavement conditions throughout the state, the Ohio Department of Transportation (ODOT) purchased two road profilers with INO Laser Rut Measurement Systems (LRMS). The vehicle mounted systems provide ODOT pavement condition raters with a faster and safer method for evaluating pavement conditions. This study was intended to evaluate the accuracy, precision, and repeatability of the LRMS system and determine the correlation between manually collected data and data collected using the LRMS. The system s performance was evaluated by collecting rut measurements over two sections of pavement using the LRMS, the straight edge method, and a mechanical profiling system developed by the Ohio Research Institute for Transportation and the Environment (ORITE) and comparing results. The study showed that the LRMS produces accurate and repeatable results that are similar to those produced with a straight edge or profilometer. Minor adjustments to the Pavement Condition Rating (PCR) system are needed, however, to ensure that scores properly represent the condition of the pavement. A range of 5-25% is recommended for the occasional extent classification when the LRMS is used. 17. Key Words Pavement rut measurement, Laser Rut Measurement Systems (LRMS), Pavement Condition Rating (PCR) 19. Security Classif. (of this report) Unclassified 20. Security Classif. (of this page) Unclassified 18. Distribution Statement No restrictions. This document is available to the public through the National Technical Information Service, Springfield, Virginia No. of Pages Price
4 SI APPROXIMATE CONVERSIONS TO SI UNITS Symbol When You Know Multiply By To Find Symbol Symbol When You Know Multiply By To Find Symbol LENGTH in inches 25.4 millimeters mm mm millimeters inches in ft feet meters m m meters 3.28 feet ft yd yards meters m m meters 1.09 yards yd mi miles 1.61 kilometers km km kilometers miles mi AREA in 2 square inches square millimeters mm 2 mm 2 square millimeters square inches in 2 ft 2 square feet square meters m 2 m 2 square meters square feet ft 2 yd 2 square yards square meters m 2 m 2 square meters square yards yd 2 ac acres hectares ha ha hectares 2.47 acres ac mi 2 square miles 2.59 square kilometers km 2 km 2 square kilometers square miles mi 2 VOLUME fl oz fluid ounces milliliters ml ml milliliters fluid ounces fl oz gal gallons liters L L liters gallons gal ft 3 cubic feet cubic meters m 3 m 3 cubic meters cubic feet ft 3 yd 3 cubic yards cubic meters m 3 m 3 cubic meters cubic yards yd 3 NOTE: Volumes greater than 1000 L shall be shown in m 3. MASS oz ounces grams g g grams ounces oz lb pounds kilograms kg kg kilograms pounds lb T short tons (2000 lb) megagrams Mg Mg megagrams short tons (2000 lb) T (or "metric ton") (or "t") (or "t") (or "metric ton") TEMPERATURE (exact) F Fahrenheit 5( F-32)/9 Celsius C C Celsius 1.8 C + 32 Fahrenheit F temperature or ( F-32)/1.8 temperature temperature temperature ILLUMINATION fc foot-candles lux lx lx lux foot-candles fc fl foot-lamberts candela/m 2 cd/m 2 cd/m 2 candela/m foot-lamberts fl FORCE and PRESSURE or STRESS (MODERN METRIC) CONVERSION FACTORS APPROXIMATE CONVERSIONS FROM SI UNITS LENGTH AREA VOLUME MASS TEMPERATURE (exact) ILLUMINATION FORCE and PRESSURE or STRESS lbf poundforce 4.45 newtons N N newtons poundforce lbf lbf/in 2 poundforce per 6.89 kilopascals kpa kpa kilopascals poundforce per lbf/in 2 or psi square inch square inch or psi SI is the symbol for the International Symbol of Units. Appropriate rounding should be made to comply with Section 4 of ASTM E380. (Revised September 1993)
5 Verification of Rut Depth Collected with the INO Laser Rut Measurement System (LRMS) Prepared in cooperation with the Ohio Department of Transportation Prepared by Bradley R. Hoffman and Shad M. Sargand Ohio Research Institute for Transportation and the Environment Russ College of Engineering and Technology Ohio University Athens, Ohio The contents of this report reflect the views of the authors who are responsible for the facts and the accuracy of the data presented herein. The contents do not necessarily reflect the official views or policies of the Ohio Department of Transportation or the Federal Highway Administration. This report does not constitute a standard, specification or regulation. Submitted October 28, 2011
6 Acknowledgements There are several Ohio University faculty and graduate students that assisted with this project and deserve acknowledgement. Dr. Shad Sargand, Russ Professor of civil engineering, provided support and guidance throughout the project and Dr. Deborah McAvoy, assistant professor of civil engineering, assisted with the statistical analysis. Mike Krumlauf of ORITE, and graduate students Drew Hatton and Ben Jordan helped with research equipment and provided field support. Wally Richardson offered his expertise with the profilometer system and calibrated it just prior to its use in this study. There are a number of people from ODOT that were essential to this project. Roger Green, Dan Radanovich, and Cynthia Gerst are gratefully acknowledged for their contributions. iv
7 Table of Contents 1 Introduction Problem statement Objectives Review of literature and equipment Straight edge and dial gage (S&G) Profilometer Laser rut measurement system Rut depth algorithms Straight edge model Wire model Pseudo-rut model Verification of the LRMS system Experimental procedure Localized heavy use/severe rutting on US Light use/medium rutting on SR Results Localized heavy use/severe rutting on US Light use/medium rutting on SR Discussion LRMS and the ODOT pavement condition rating system Procedure Results and discussion of comparison with S&G PCR ratings Summary and conclusions Summary Recommendations References Appendix A: US-30 Rut Measurements (1 in = 25.4 mm; 100 ft = m) Appendix B: SR-682 Rut Measurements (1 in = 25.4 mm; 100 ft = m) Appendix C: PCR Data from District 10 (S&G and LRMS) v
8 List of Figures Figure 1. Measurement of rut using a straight edge and electronic dial gage... 3 Figure 2. ORITE Profilometer measuring a transverse profile on SR Figure 3. Typical virtual straight edge model using ORITE profilometer data from US-30 (1 in = 2.54 cm)... 5 Figure 4. Front view of ODOT profiler vehicle... 6 Figure 5. Rear view of ODOT profiler vehicle showing attached INO Laser Rut Measurement System... 7 Figure 6. Virtual 2 m straight edge model... 8 Figure 7. Virtual wire model for measuring rut depth... 9 Figure 8. Test section at the intersection of US-30 and SR Figure 9. Measuring rut depth on US-30 using the ORITE profilometer Figure 10. Location of SR-682 test section Figure 11. Rut measurement on SR-682 using the profilometer and 8-ft S&G Figure 12. Temporary rumble strips used to create an artificially deep rut to be used as a reference point in the LRMS data Figure 13. Distribution of rutting by severity on US-30 (LWP) Figure 14. Distribution of rutting by severity on US-30 (RWP) Figure 15. Rut depth measurements from 200 ft (60.96 m) test section on US-30 (LWP) (1 in = 25.4 mm) Figure 16. Rut depth measurements from 200-ft (60.96 m) test section on US-30 (RWP) (1 in = 25.4 mm) Figure 17. Rut depth measurements from LRMS in left wheel path on SR-682 ( ft) (1 in =25.4 mm) Figure 18. Pavement deterioration on SR Figure 19. Distribution of rutting by severity on SR-682 (LWP) Figure 20. Distribution of rutting by severity on SR-682 (RWP) Figure 21. Rut depth measurements from the 200-ft (60.96 m) test section on SR-682 (LWP) (1 in = 25.4 mm) Figure 22. Rut depth measurements from the 200-ft (60.96 m) test section on SR-682 (RWP) (1 in = 25.4 mm) Figure 23. Pavement profile from profilometer on SR-682 (LWP) where depth measurement was influenced by pavement deterioration (@ 2780 ft) (1 in = 25.4 mm) Figure m and 4-ft virtual straight edge models (1 in = 25.4 mm) Figure 25. PCR rating key for flexible pavement (ODOT, 2006, p. 6) Figure 26. PCR rating form for flexible pavement (ODOT, 2006, p. 7) vi
9 List of Tables Table 1. General summary of data collected on US-30 using the Dynatest system Table 2. Games-Howell post-hoc test on LRMS data from US Table 3. Games-Howell post-hoc test results on all data from the 200-ft (60.96 m) test section on US Table 4. General summary of data collected on SR-682 using the Dynatest system Table 5. Games-Howell post-hoc test results on LRMS data from SR Table 6. Games-Howell post-hoc test results on LRMS, profilometer, and S&G data from the 200-ft (60.96 m) test section on SR Table 7. Mean absolute deviation of LRMS data from US Table 8. Mean absolute deviation of LRMS data from SR Table 9. Distribution of LRMS PCR scores by corresponding S&G rating Table 10. Average LRMS PCR scores grouped by corresponding S&G score Table 11. Effect on the overall average difference between LRMS and S&G PCR scores when the lower boundary of occasional rating range is changed Table 12. Effect on the average differences between LRMS and S&G PCR scores when the lower boundary of occasional rating range is changed vii
10
11 1 Introduction 1.1 Problem statement Since 1985, ODOT has been manually collecting rut depth data using a straight edge and dial gauge (S&G). This method is slow and dangerous to pavement condition raters when traffic control is not available. According to the Pavement Condition Rating (PCR) procedures, the rating team is instructed to stop at 1 mile intervals along the predetermined roadway section and evaluate a 100 foot section of pavement. While this method may be sufficient in many cases, there is potential for raters to overlook short sections of deeper than typical rutting. Also, there have been numerous instances, according to ODOT Infrastructure Management workers, when the level of traffic prevented them from obtaining the necessary number of rut depth measurements to properly evaluate a pavement section. To solve this problem, ODOT purchased two inertial road profilers; one from Pathway Services and one from Dynatest. Both vehicles use rear-mounted INO Laser Rut Measurement Systems (LRMS). These systems utilize two 3D laser profilers and allow the collection of transverse road profiles and calculation of rut depth measurements while the vehicle is in motion, even at high speeds. With the LRMS, numerous rut measurements can be obtained at short intervals over the entire section in a much shorter period of time. The safety risk for the rating team is greatly reduced because they can obtain measurements without leaving the vehicle and without interfering with traffic flow. As previously discussed, manual evaluations of rutting for the PCR are often based on few actual measurements because of traffic and time limitations. ODOT has collected a database of PCR ratings for rut depth based on manual measurements, LRMS data, or both. The two methods of evaluating rut depth may produce significantly different PCR scores for the same section of pavement. A method for reconciling the difference between the two methods is needed. Before this can be done however, the accuracy, precision, and repeatability of the LRMS system needs to be confirmed. During the initial preparation for this project, it was discovered that the straight edge and dial gage being used by the ODOT technicians was only 4 ft (1.22 m) in length. The ASTM standard for rut depth measurement (ASTM E 1703/E 1703M, 1995) specifies a minimum length of 1.73 m (5.67 ft) and recommends a length of 1.83 m (6 ft), 2 m (6.56 ft), 3 m (9.84 ft), 3.05 m (10 ft), or 3.66 m (12 ft). Not only is the ODOT straight edge limited by length, but the dial gage is fixed at the center of the bar. It is necessary to determine the possible effect of these factors on the rut depth measurements gathered by ODOT pavement raters. 1.2 Objectives The main goals of this study were to evaluate the rut depth measurement collection techniques used by ODOT and to verify data gathered using the automated laser rut measurement system. To meet these goals, the following objectives were devised and met: Conduct tests on a section of rutted pavement at one or more locations using the LRMS, straight edges, and profilometer o Evaluate the LRMS data for precision, accuracy, and repeatability using the S&G method and Ohio Research Institute for Transportation and the Environment (ORITE) Profilometer as references 1
12 o Examine the potential effect of straight edge length on the accuracy of S&G measurements to determine whether the 4ft straight edge used by ODOT is adequate Develop a method for extracting rutting distress scores from the LRMS data to be used with the ODOT pavement condition rating system Recommend other parameters (maximum, minimum, etc.) that may be suggested by the data for the use and interpretation of INO rut depth measurements 2

13 2 Review of literature and equipment 2.1 Straight edge and dial gage (S&G) The most traditional technique for measuring rut depth is the straightedge method. This requires one to lay a straightedge across the wheel path perpendicular to the direction of traffic. The straightedge should contact the road at the two highest points on either side of the wheel path. The ASTM specification for this method requires that the straightedge be at least 1.73m (5.67ft) in length to ensure that it spans the entire width of the rut (ASTM E 1703/E 1703M, 1995). Using a gauge, several measurements along the length of the straightedge should be taken to find the deepest point in the rut. This method, while simple and accurate if proper technique is used, can be time consuming and difficult to perform especially with limited traffic control. Figure 1. Measurement of rut using a straight edge and electronic dial gage 2.2 Profilometer The Ohio Research Institute for Transportation and the Environment (ORITE) designed and constructed a mechanical profilometer for measuring surface deformation at the ORITE Accelerated Pavement Loading Facility. The device creates a profile by measuring the distance between the pavement surface and an aluminum beam that serves as a guide rail. A carriage hangs below the guide rail with a 12-in (30.5-cm) arm extending down to the pavement. A 2-in (5.08 cm) diameter wheel is connected to the end of the arm that allows it to roll over the pavement surface. The carriage is driven back and forth along the rail by an electric motor. Its movement is tracked using a quadrature rotary encoder. The angle of the arm changes as the 3

14 wheel travels over the uneven pavement. This angle is measured to a precision of degrees using an incremental rotary optical encoder. A DOS program, written specifically for the ORITE Profilometer, uses the measured change in angle to calculate the tangential displacement of the wheel at the end of the arm. A change of degrees measured by the rotary encoder would indicate approximately inches (0.127 mm) of movement at the end of the arm. An inclinometer mounted at the center of the beam is used to measure the slope of the beam during each profile measurement. This allows profiles to be rotated or leveled to create a more accurate model of the pavement. The inclinometer makes it possible to level each profile in a series to produce an interpolated, three-dimensional profile of a segment of roadway (Richardson, 2003). Figure 2. ORITE Profilometer measuring a transverse profile on SR-682 In 2001, a similar device, called the Transverse Profile Beam (TPB), was designed by HTC Infrastructure Management Ltd. (HTC) and Dr. Christopher Bennett of Data Collection Ltd. (DCL) to meet the needs of Transit New Zealand at a low cost. Like the ORITE device, the TPB runs a wheel across the pavement surface below an aluminum beam. Both devices use a rotary encoder to measure the vertical displacement of the wheel; however the TPB measures vertically instead of using an arm. The TPB wheel is much larger in diameter (actual diameter unknown) than that of the ORITE profilometer. The TPB predicts the horizontal position of the carriage with a precision of 2.97 mm (0.117 in) using a proximity sensor mounted to the carriage 4
15 that produces a pulse when it passes one of the magnets mounted at measured intervals along the beam (Bennett, 2002) Measurements taken by the TPB were compared to straightedge measurements and repeated over a period of time to confirm that the TPB would produce consistent results. Bennett (2002) reported that the TPB results were within 2.5 mm (0.10 in) of the straightedge. The differences were attributed to the difference in precision between the two methods (the straightedge/wedge measurements were to the nearest mm) and the size of the TPB wheel. Repeated runs of the TPB showed a typical deviation of +/- 1.5 mm (0.06 in). The results of the study show that the TPB could produce reliable and accurate pavement profiles (Bennett, 2002). Given the similarities in design between the ORITE Profilometer and the TPB, Bennett (2002) supports the validity of the data collected by the ORITE Profilometer. In order to measure the rut depth from the profilometer readings, a method for simulating a 2-m (6.56-ft) straight edge was developed using MATLAB. The MATLAB program begins at the leftmost point of the profile (the profilometer was run from right to left, which resulted in right and left being reversed) and draws a virtual line to every point within 2 m (6.56 ft). Each time a line is drawn, the depth is measured at every point in between its beginning and end. After the final line is drawn and depths are measured, the starting point is shifted one point to the right and the process of drawing lines begins again. This is repeated until the left end of the virtual straight edge is beyond the deepest part of the rut. The largest depth measured during this process is output as the rut depth for that profile. The rut width is recorded as well. This was done for each of the profiles collected in both wheel paths. An example of the resulting virtual straight edge created by the program is shown in Figure 3. Just like in the case of an actual straight edge measurement, the maximum possible depth is found when the virtual straight edge is tangent to the plotted curve at two points near the peaks on either side of the rut Vertical measurement (in) Profile Straight edge Depth Horizontal measurement (in) Figure 3. Typical virtual straight edge model using ORITE profilometer data from US-30 (1 in = 2.54 cm) 5

16 2.3 Laser rut measurement system The INO laser rut measurement system used by ODOT utilizes two laser profilers mounted to the rear of a vehicle, as shown in Figure 4. Each profiler provides part of the overall field of view. The profilers use high-power pulsed infrared laser line projectors and specially designed cameras to create a transverse profile of the roadway surface. The LRMS system reads the vehicle odometer to determine the location of each profile reading and to ensure that measurements are taken at the user-specified intervals. The system is controlled from within the vehicle by a driver or passenger. The rut measurement data are analyzed and can be viewed in real time. In this study, the program RSPWin v2.6.8 from Dynatest was used. A list of specifications for the LRMS taken from the Pavemetrics website ( is shown below: Number of laser profiles: 2 Number of 3D points per profile (max): 1280 Sampling rate: 30 or 150 profiles/s Profile spacing: adjustable Transversal field-of-view (nominal): 4 m (13.1 ft) Transversal resolution: ± 2 mm (0.08 in) Depth range of operation: 500 mm (19.7 in) (30 Hz) or 450 mm (17.7 in) (150 Hz) Depth accuracy (nominal): ±1 mm (0.04in) Laser profiler dimensions (approx.): 108 mm (4.25 in) (W) x 692 mm (27.2 in) (H) x 220 mm (8.7 in) (D) Laser profiler weight (approx.): 12 kg (26.5 lbs) Power consumption (max): 150 W at 120/240 VAC Figure 4. Front view of ODOT profiler vehicle 6
 for both wheel paths.")
17 Figure 5. Rear view of ODOT profiler vehicle showing attached INO Laser Rut Measurement System The profiler vehicle used in this study was built by Dynatest Consultants, Inc. The output file, created in the RSPWin program, includes rut depth, rut width, rut area, and location (milepoint) for both wheel paths. The Dynatest system allows the user to not only adjust the profile spacing, but also to use rapid-fire mode which allows the system to collect data at the maximum 30 Hz sampling rate as opposed to a set distance interval. This feature was advantageous during this study as it allowed for a much higher density of data over the pavement test sections. In 2002, a research study (Grondin, Leroux, Laurent, 2002) was funded by the Quebec Ministry of Transport (MTQ) to evaluate the INO Laser Rut Measurement System (LRMS). The goal of the study was to determine whether the system could meet the needs of the MTQ and to validate the precision and accuracy promised in the systems specifications. Most of the equipment used by MTQ is identical to what is used by ODOT, with the main exception being the computer and software. In order to validate the rut depth measurements, Grondin, et al (2002) compiled data collected by the LRMS at twelve 400-m (1312-ft) sites. Six passes were made at each site; three on day one and three more on day two. Readings were taken at 1-m (3.3-ft) intervals and the average depth per 10 m (32.8 ft) was calculated. Multiple passes allowed the team to examine deviation of rut depth measurements. In order to test the LRMS for repeatability, a 2-km (1.24- mi) site was selected and measured five times. The team then conducted measurements on the twelve 400-m (1312-ft) sites. Afterward, the 2-km site was measured again and the results were compared to those obtained earlier in the day. 20 days later, the researchers performed three additional passes. The results show that the LRMS was accurate to 0.5 mm (0.02 in) (mean deviation) and produced reliable and repeatable measurements. The results produced in this research study can be compared to those in Grondin, et al (2002). 7
18 2.4 Rut depth algorithms Throughout their development, automated transverse profile systems have typically used three different methods of determining rut depth. Two of these methods, the straight edge model and the wire model, are based on manual measurement methods. The third method, the pseudorut model, has been commonly used with rut-bar systems. These systems often provide only 3 or 5 measurements for determining rut depth and have been shown to be inaccurate and unreliable. This is mainly because the limited number of profile measurements allows it to be affected by vehicle wandering (FHWA-RD-01-27, 2001) Straight edge model The straight edge model assumes a 2-m virtual straight edge bridging the rut which is created by connecting the two highest points on either side of a rut with a straight line (Figure 6). The depth is usually measured at a right angle to the straight edge. When this is not the case, the slope angle of the virtual straight edge is ignored as the effect is often negligible (Bennet Wang, 2002a). The 2-m virtual straight edge model is used by the LRMS system for calculating rut depth. Figure 6. Virtual 2 m straight edge model Wire model This model simulates a massless wire being stretched horizontally between the high points across the pavement. The wire begins at a high point to the left of the left wheel path and ends at another high point to the right of the right wheel path. The virtual wire may contact other high points and change slope as an actual wire would. In most cases, the wire model and the straight edge model would produce the same results. The only exception would be when the 2-m straight edge is too short to span the single or double rut (Figure 7) (Bennett Wang, 2002a). 8
19 Figure 7. Virtual wire model for measuring rut depth Pseudo-rut model The pseudo-rut model bases the rut depth on the difference between the highest and lowest points measured. This is not a reliable method for determining rut-depth and can produce poor results. The pseudo-rut method was intended for use with profiler systems that produce a limited number of data points and is not suited for this study (Bennett Wang, 2002a). 9
 section was measured and marked at 5 ft (1.52 m) intervals. At each interval, rut depth was measured in both the left and right wheel paths using the profilometer, 8 ft S&G, and 4 ft S&G.")
20 3 Verification of the LRMS system 3.1 Experimental procedure Two 200-ft (60.96 m) sections of pavement with rutting at a variety of severity levels were selected for data collection. Each 200-ft (60.96 m) section was measured and marked at 5 ft (1.52 m) intervals. At each interval, rut depth was measured in both the left and right wheel paths using the profilometer, 8 ft S&G, and 4 ft S&G. Workers from the ODOT Infrastructure Management division made five runs at each site with the Dynatest profiling vehicle over a greater length of pavement that contained each 200-ft (60.96 m) section. As the vehicle approached the test sections, the system was switched to rapid-fire mode in order to provide a greater number of measurements for analysis Localized heavy use/severe rutting on US-30 A site was selected on US-30 near Wooster, Ohio for testing. The 200-ft (60.96 m) section was in the westbound approach to a stoplight at the intersection of US-30 and SR-94 (see Figure 8). This area receives a significant amount of large truck traffic. The stopped or slowmoving, heavily loaded trucks had produced a section of extremely severe rutting and upheaving. Areas away from the intersection were typically characterized by light or medium rutting. Figure 8. Test section at the intersection of US-30 and SR-94 10

21 Figure 9. Measuring rut depth on US-30 using the ORITE profilometer ODOT workers made five runs with the Dynatest pavement profiling vehicle and collected measurements at five foot intervals (with the exception of the rapid-fire segment at the test section). They began collection at milepost and ended near milepost , covering a distance of mi (2.515 km). The intersection of US-30 and SR-94 where the 200-ft (60.96 m) test section was located is at milepost Data collection with the LRMS system is started and stopped by the operator as the vehicle is in motion. As a result, the accuracy of the starting point is dependent on the vehicle speed and reaction time of the operator. Fortunately, the extreme severity of rutting at the 200-ft (60.96 m) test section provided a welldefined reference point for aligning the data from each run and aligning the LRMS data with the measurements taken with the profilometer and straight edges Light use/medium rutting on SR-682 A second test site having a more typical section of distressed pavement was needed in order to evaluate the LRMS system under normal conditions. A section of SR-682 in Athens County, Ohio was chosen for its low to medium severity rutting. This section is similar to the pavement sections typically found in the PCR database. 11
 intervals. Workers from the ODOT Infrastructure Management office made five runs with the Dynatest LRMS system.")
22 Figure 10. Location of SR-682 test section For this test, procedures similar to those used for the US-30 site were followed. A 200ft (60.96 m) section of pavement at approximately mile point 1.51 was measured and marked at five foot (1.52 m) intervals. Workers from the ODOT Infrastructure Management office made five runs with the Dynatest LRMS system. LRMS data was collected at five foot intervals beginning at milepoint 1 and ending at approximately milepoint 1.8, a distance of about 0.8 mi (1.3 km). As the vehicle approached the test section, rapid-fire mode was initiated, causing the system to record at 30 Hz intervals. Measurements were collected at 5-ft (1.52 m) intervals using the 4 ft straight edge, 8 ft straight edge, and profilometer on the 200-ft (60.96 m) section only. These measurements were then compared with the LRMS results. Unlike the US-30 test, there was no clearly defined section of severe rutting that could be used as a reference point for aligning data sets. To compensate, a reference point was created at the start of the 200-ft test section by creating a sort of artificial rut that would be easy to distinguish from other areas of the pavement. This was achieved by laying temporary rumble strips longitudinally in the road on both sides of the right wheel path. This artificially raised the sides of the wheel path to simulate a deeper rut and produced a spike in depth measurements that was used to align each set of data (see Figure 12). 12


23 Figure 11. Rut measurement on SR-682 using the profilometer and 8-ft S&G Figure 12. Temporary rumble strips used to create an artificially deep rut to be used as a reference point in the LRMS data 13
24 3.2 Results Localized heavy use/severe rutting on US-30 The sets of data from the Dynatest LRMS system were examined in order to determine whether repeated runs produce similar results. The data collected using the Dynatest system is summarized in Table 1. A small number of points were missing from runs 2, 3, and 5. According to the ODOT workers, this was a result of the vehicle being forced to stop or slow down. The Dynatest system will not collect unless the vehicle is moving at a sufficient speed and data can be lost. These errors result in the omission of both the left and right rut measurements. Table 1. General summary of data collected on US-30 using the Dynatest system Data Set Wheel path Starting Milepost Final Milepost Total data points (n*) Errors Data points after errors removed (n) Run 1 Run 2 Run 3 Run 4 Run 5 LWP RWP LWP RWP LWP RWP LWP RWP LWP RWP A statistical analysis was conducted with IBM SPSS Statistics software using the analysis of variance (ANOVA) method and the Games-Howell post-hoc test. Pairs of data were tested to determine their difference using a significance level of The results are shown in Table 2. Cells colored yellow show statistical dissimilarity. A natural log transformation was used on data from both wheel paths to achieve normality. 14
25 Table 2. Games-Howell post-hoc test on LRMS data from US-30 Sig. Run # (I) Run # (J) LWP RWP Run 1 Run Run Run Run Run 2 Run Run Run Run Run 3 Run Run Run Run Run 4 Run Run Run Run Run 5 Run Run Run Run The Games-Howell test results suggest that the similarity between the five runs made with the LRMS system is fairly weak, especially in the left wheel path. However, the distribution of rutting, shown in Figure 13 and Figure 14, suggests that the five runs would have all produced the same score using the ODOT pavement rating system. 15
26 Extent (%) Run 1 Run 2 Run 3 Run 4 Run (< 1/8") Low (1/8" 3/8") Medium (3/8" 3/4") High (> 3/4") Rutting Severity Figure 13. Distribution of rutting by severity on US-30 (LWP) Extent (%) Run 1 Run 2 Run 3 Run 4 Run (< 1/8") Low (1/8" 3/8") Medium (3/8" 3/4") High (> 3/4") Rutting Severity Figure 14. Distribution of rutting by severity on US-30 (RWP) The 200-ft (60.96 m) test section was extracted from the LRMS data and compared with the profilometer and S&G data gathered at the test section. S&G measurements could not be obtained at many of the 5-ft (1.52 m) intervals due to the extreme severity of rutting at these locations. The dial gage was not able to reach the bottom of the rut. The profilometer was able to gather data at each interval however. The same ANOVA and Games-Howell tests were used 16
27 in this analysis. Once again, a significance level of 0.05 was used. The natural log transformation was not necessary in this case. The results are shown in Table 3 and plots of the measurements are shown in Figure 15 and Figure 16. Unlike the previous test, the results of the ANOVA test on only the test section show strong statistical similarity and therefore imply strong repeatability. They also show that there was no statistical difference between the LRMS rut depth and alternative measurement methods. 17
28 Table 3. Games-Howell post-hoc test results on all data from the 200-ft (60.96 m) test section on US-30 Sig. Sig. Run # (I) Run # (J) LWP RWP Run # (I) Run # (J) LWP RWP Run 1 Run Profilometer Run Run Run Run Run Run Run Profilometer Run ft S&G ft S&G ft S&G ft S&G Run 2 Run ft S&G Run Run Run Run Run Run Run Profilometer Run ft S&G Profilometer ft S&G ft S&G Run 3 Run ft S&G Run Run Run Run Run Run Run Profilometer Run ft S&G Profilometer ft S&G ft S&G Run 4 Run Run Run Run Profilometer ft S&G ft S&G Run 5 Run Run Run Run Profilometer ft S&G ft S&G
29 2.0 Rut Depth (in) Location (ft) Run 1 Run 2 Run 3 Run 4 Run 5 Profilometer 8 ft S&G 4 ft S&G Figure 15. Rut depth measurements from 200 ft (60.96 m) test section on US-30 (LWP) (1 in = 25.4 mm) 3.0 Rut Depth (in) Location (ft) Run 1 Run 2 Run 3 Run 4 Run 5 Profilometer 8 ft S&G 4 ft S&G Figure 16. Rut depth measurements from 200-ft (60.96 m) test section on US-30 (RWP) (1 in = 25.4 mm) Light use/medium rutting on SR-682 The five runs collected with the Dynatest LRMS system were aligned and compared using SPSS statistical analysis software. A summary of the collected data is shown in Table 4. 19
30 Table 4. General summary of data collected on SR-682 using the Dynatest system Data Set Run 1 Run 2 Run 3 Run 4 Run 5 Wheel Path Starting Milepost Final Milepost Total data points (n*) Errors Data points after errors removed (n) LWP RWP LWP RWP LWP RWP LWP RWP LWP RWP Once the five runs were aligned using the artificial rut caused by the temporary rumble strips, ANOVA tests were conducted on the right and left wheel paths to determine whether the runs were statistically similar. The Games-Howell post-hoc test was used to provide a detailed comparison. A significance level of 0.05 was used. The results are shown in Table 5. 20
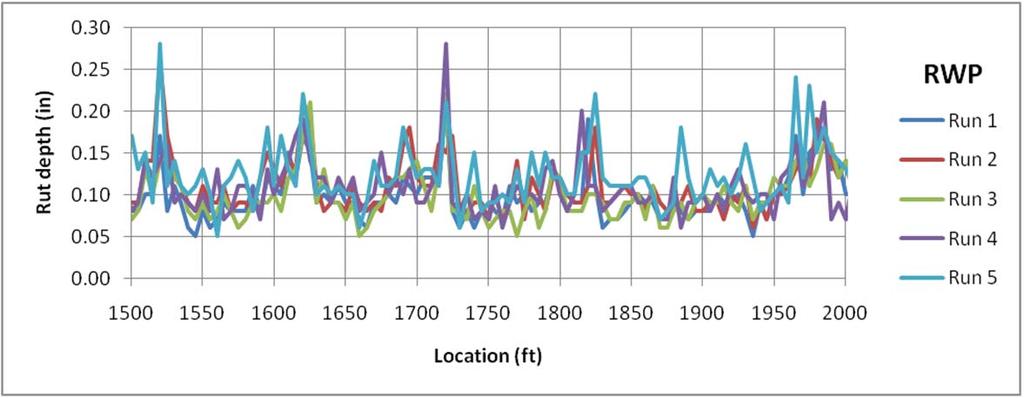
31 Table 5. Games-Howell post-hoc test results on LRMS data from SR-682 Run # (I) Run # (J) Sig. LWP RWP Run Run 1 Run Run Run Run Run 2 Run Run Run Run Run 3 Run Run Run Run Run 4 Run Run Run Run Run 5 Run Run Run The Games-Howell test shows a strong statistical similarity between each set of data from the right wheel path; however the left wheel path data from Run 1 do not correlate with the other data sets. There are a few instances where the measured rut depths from Run 1 are slightly less than the other runs over a short distance (see Figure 17). In these segments, the measured rut widths in Run 1 are also significantly less than the widths measured in other runs. This may suggest that the vehicle had drifted from the center of the lane or the laser system was being influenced by pavement deterioration observed at the center of the roadway (see Figure 18). 21
 Figure 17.")
32 Rut depth (in) Run 1 Run 2 Run 3 Run 4 Run Location (ft) Figure 17. Rut depth measurements from LRMS in left wheel path on SR-682 ( ft) (1 in =25.4 mm) Figure 18. Pavement deterioration on SR
33 Overall, the five runs show strong statistical similarity. There are some outlying data that created some dissimilarity in the first run; however, considering that these tests were run in an uncontrolled environment where the points do not align perfectly, pavement deterioration may influence measurements, and curves in the road may have influenced the driver s ability to remain at the center of the lane, the end results are convincing enough to deem the measurements repeatable. A distribution of data from SR-682 separated by PCR severity level is shown in Figure 19 and Figure 20. The distributions are similar between runs; however the inconsistency in the left wheel path data from run 1 is evident in Figure Extent (%) (< 1/8") Low (1/8" 3/8") Medium (3/8" 3/4") Rutting Severity High (> 3/4") Run 1 Run 2 Run 3 Run 4 Run 5 Figure 19. Distribution of rutting by severity on SR-682 (LWP) 23
34 Extent (%) Run 1 Run 2 Run 3 Run 4 Run (< 1/8") Low (1/8" 3/8") Medium (3/8" 3/4") High (> 3/4") Rutting Severity Figure 20. Distribution of rutting by severity on SR-682 (RWP) A separate ANOVA analysis was conducted on the LRMS data from the 200-ft (60.96 m) test section. The results from the Games-Howell post hoc tests are shown in Table 6. The results of the test show that the five runs were statistically similar; however the right wheel path measurements from Run 3 show a fairly weak correlation with the rest of the data. As was observed previously with Run 1, there exist data from Run 3 that are less than the measurements from other runs. Similarly, the measured rut widths corresponding with these points are also noticeably less than what is shown in the other runs. Because there was little deterioration observed in the right wheel path, it is likely that this was caused by the profiler vehicle drifting away from the center of the lane. In future studies, it may be helpful to videotape the vehicle as it passes over a test section to determine if this is in fact the cause. 24
35 Table 6. Games-Howell post-hoc test results on LRMS, profilometer, and S&G data from the 200-ft (60.96 m) test section on SR-682 Sig. Sig. Run # (I) Run # (J) LWP RWP Run # (I) Run # (J) LWP RWP Run 1 Run Profilometer Run Run Run Run Run Run Run Profilometer Run ft S&G ft S&G ft S&G ft S&G Run 2 Run ft S&G Run Run Run Run Run Run Run Profilometer Run ft S&G Profilometer ft S&G ft S&G Run 3 Run ft S&G Run Run Run Run Run Run Run Profilometer Run ft S&G Profilometer ft S&G ft S&G Run 4 Run Run Run Run Profilometer ft S&G ft S&G Run 5 Run Run Run Run Profilometer ft S&G ft S&G
36 1 Rut depth (in) Location (ft) Run 1 Run 2 Run 3 Run 4 Run 5 Profilometer 8 ft S&G 4 ft S&G Figure 21. Rut depth measurements from the 200-ft (60.96 m) test section on SR-682 (LWP) (1 in = 25.4 mm) 0.5 Rut depth (in) Location (ft) Run 1 Run 2 Run 3 Run 4 Run 5 Profilometer 8 ft S&G 4 ft S&G Figure 22. Rut depth measurements from the 200-ft (60.96 m) test section on SR-682 (RWP) (1 in = 25.4 mm) The LRMS data correlate well with the 8 ft straight edge in all cases; however the profilometer measurements correlated with the LRMS readings only in the right wheel path. As one can see in Figure 21, the profilometer measurements are frequently higher than the other measurements. This is due to the deterioration in the left wheel path and near the centerline as shown in Figure 18. Small pits in the roadway surface are read by the profilometer wheel and create low points in the profile that are interpreted as the bottom of the rut by the rut depth algorithm discussed in Section 2.2. An example of this is shown in Figure 23. The LRMS system may not be influenced by this type of deterioration due to the shallow angle at which the laser hits the pavement surface. Its effects may also be diminished by the filtering used in the 26
37 Dynatest software. The data from the profilometer in the left wheel path of SR-682 is assumed to be flawed and is disregarded in the comparison of measurement methods. 5 Vertical measurement (in) Pavement Profile 2 m Virtual Straight Edge Depth Lateral position (in) Figure 23. Pavement profile from profilometer on SR-682 (LWP) where depth measurement was influenced by pavement deterioration (@ 2780 ft) (1 in = 25.4 mm) 3.3 Discussion The results of the LRMS tests and ANOVA analyses satisfactorily demonstrate repeatability. The US-30 test showed some weakness in repeatability; however the statistical analysis may be misleading because of the low severity of rutting over most of the pavement segment that was profiled. The variation in this test may have been statistically significant relative to the mean rut depth; however the variation was small enough to be considered acceptable. The mean absolute deviation for each test is listed in Table 7 and Table 8. The combined mean absolute deviations of inches (0.660 mm) for US-30 and inches (0.762 mm) for SR-682 are not high enough to suggest that the differences between runs could have a major impact on the overall characterization of a pavement section by the LRMS. 27
38 Table 7. Mean absolute deviation of LRMS data from US-30 unit LWP RWP Combined (LWP and RWP) Number of points (n) Mean Absolute Deviation Standard Deviation of Absolute Deviation Upper 95% Confidence Interval Lower 95% Confidence Interval (in) (mm) (in) (mm) (in) (mm) (in) (mm) Table 8. Mean absolute deviation of LRMS data from SR-682 unit LWP RWP Combined (LWP and RWP) Number of points (n) Mean Absolute Deviation Standard Deviation of Absolute Deviation Upper 95% Confidence Interval Lower 95% Confidence Interval (in) (mm) (in) (mm) (in) (mm) (in) (mm) As a tool for evaluating pavement conditions, the LRMS system shows satisfactory repeatability. However, in the SR-682 test, the extent of medium severity rutting in the right wheel path for all five runs is coincidentally near the 20% threshold between the occasional and frequent ratings. Runs 1 and 2 would have resulted in a medium-occasional rating, while Runs 3, 4, and 5 would have resulted in a medium-frequent rating. This variation is likely caused by the lateral position of the profiler vehicle in the lane and the exact location of each measurement. To compensate for this problem, an alternative rating system that considers the extent of rutting at all levels of severity may be appropriate. This is discussed further in the next section. When compared to the profilometer and 8 ft straight edge, the LRMS showed a satisfactory level of accuracy and precision. With the exception of the profilometer data from the left wheel path of SR-682, the differences in measurements were statistically insignificant. 28
39 Measurements taken by the 4 ft straight edge during both tests were generally inconsistent with the profilometer and 8 ft straight edge. Figure 24 shows a profile of US-30 created by the profilometer with a 2 m virtual straight edge and a 4 ft virtual straight edge. The 4 ft straight edge is clearly unable to span the entire rut. This may not always be the case, since the validity of the 4 ft straight edge measurement is dependent on the width of the rut; however, because the potential for significant error exists when using this length of straight edge, its use should be discontinued Vertical measurement (in) Profile 2m Straight Edge 2m Depth 4ft Straight edge 4ft Depth Horizontal measurement (in) Figure m and 4-ft virtual straight edge models (1 in = 25.4 mm) 29
40 4 LRMS and the ODOT pavement condition rating system 4.1 Procedure The PCR ratings for rutting based on S&G measurements were compared to data collected in ODOT District 10 using the INO LRMS system on the Dynatest profiler. There were 397 locations found for which there exists a PCR score based on manual measurements as well as LRMS data. The following Ohio counties were represented in the data: Athens, Gallia, Hocking, Meigs, Monroe, Morgan, Noble, Vinton, and Washington. The data files were imported into Microsoft Excel and separated into the necessary log point intervals to correspond with the S&G data. Each interval was assigned a PCR score based on rut depth and extent according to the key and rating form shown in Table 9 and Table 10. A summary of the scores for each site can be found in Appendix C. Extraction of the PCR scores was done in Excel, using a spreadsheet that was pre-made to allow one to simply paste the data from the files created by the Dynatest software. To do this, each file (extension.hdr ) was imported as a comma-delimited data set. The rows beginning with 5412 were isolated using the sort function, and then copied into the pre-made spreadsheet (lines beginning with 5412 indicate rut measurements in.hdr output files). The spreadsheet then counted the number of rut depth measurements that fell into each severity category and multiplied each of these counts by the measurement interval. These three numbers were divided by the overall length to find the extent of rutting in each severity category. The PCR rating key and rating form for flexible pavement from the ODOT PCR manual are shown in Figure 25 and Figure 26 (ODOT, 2006). The rating key and rating form for composite pavement differ slightly; however rutting is evaluated and scored the same way. 30

41 Figure 25. PCR rating key for flexible pavement (ODOT, 2006, p. 6) 31

42 Figure 26. PCR rating form for flexible pavement (ODOT, 2006, p. 7) 32
43 4.2 Results and discussion of comparison with S&G PCR ratings In Table 9, the distribution (percent) of PCR scores extracted from LRMS data, organized by corresponding S&G ratings, is shown. A sizable portion of the LRMS scores are in the MO and HO categories. This may indicate that a major cause of the higher PCR scores derived from the LRMS is the effect of isolated areas of medium or severe rutting distresses. These areas are likely missed during the manual rut measurement process. S&G Table 9. Distribution of LRMS PCR scores by corresponding S&G rating LRMS (%) none LO LF LE MO MF ME HO HF HE none LO LF LE MO MF ME HO HF HE Table 10. Average LRMS PCR scores grouped by corresponding S&G score Average none (0) 4.03 LO (1.8) 3.70 LF (2.4) 3.26 LE (3.0) 2.80 MO (4.2) 5.17 S&G MF (5.6) 4.80 ME (7.0) N/A HO (6.0) N/A HF (8.0) N/A HE (10.0) N/A In order to more closely correlate the LRMS PCR with the S&G PCR, it may be necessary to reconsider the method used for rating pavements for rutting when the LRMS is used. 33
44 The high number and density of data points produced with the automated system might otherwise cause small segments of pavement with higher distresses to have the greatest influence on the overall score, regardless of whether the small segments are truly representative of the overall section. Of the pavement sections measured with the LRMS that were rated as either MO or HO, 25.4% had rutting at the highest measured severity over less than 1% of the total pavement section length. 64.9% of these sections had rutting at the highest measured severity over less than 5% of the total length. To ensure that the pavement rating is an accurate description of a section s overall conditions, a threshold for the occasional classification for extent may be more practical. For example: instead of an extent of 0-25% being classified as occasional, 1-25% or 5-25% might be more appropriate. The effect this might have on PCR score discrepancies between rating methods is shown in Table 11 and Table 12. Table 11. Effect on the overall average difference between LRMS and S&G PCR scores when the lower boundary of occasional rating range is changed Range for "occasional" classification Average difference in PCR scores (LRMS-S&G) 0-25% 1-25% 2-25% 3-25% 4-25% 5-25% Table 12. Effect on the average differences between LRMS and S&G PCR scores when the lower boundary of occasional rating range is changed Average PCR Score from LRMS Range for occasional classification PCR Score from S&G 0-25% 1-25% 5-25% none (0) LO (1.8) LF (2.4) LE (3.0) MO (4.2) MF (5.6) ME (7.0) N/A N/A N/A HO (6.0) N/A N/A N/A HF (8.0) N/A N/A N/A HE (10.0) N/A N/A N/A As Table 11 demonstrates, the 5%-25% range for the occasional rating dramatically reduces the difference in PCR score between methods. Raising the lower boundary to 5% would allow the LRMS data to produce a PCR score that more accurately represents the state of the pavement section being examined. Spikes in the data that may be caused by errors or other types of pavement deterioration instead of actual rutting would be unlikely to influence the PCR score. 34
45 More importantly, small sections of heavy rutting that produce outliers in the data would not cause a mischaracterization of the overall pavement section. Although altering the range for the occasional rating reduces the impact of using the LRMS in lieu of S&G, there remains a notable difference in scores. Other changes could be devised to further reduce the difference in scores; however because the tests conducted on US-30 and SR-682 showed that the LRMS can produce accurate, reliable, and repeatable results, doing so would require altering data that is already assumed to be correct. The remaining difference in LRMS and S&G scores after changing the occasional rating criteria should be attributed to the high density of measurements gathered by the LRMS. While the 5%-25 range for occasional rutting is recommended specifically for the PCR score, sections of pavement with increased rutting that are not extensive enough to exceed 5% of the overall length of the site should not be ignored. Such sections in the data that would not count towards the overall PCR score may represent isolated asphalt stability issues that need addressed as potential wet accident locations. These sections should be properly treated as high stress locations per ODOT guidelines during the next rehabilitation. The existence of localized areas of severe rutting can be determined by checking the extent of rutting at each severity level while analyzing the.hdr file. If such an area is present, it can be easily located in the data using the conditional formatting tool in Microsoft Excel. Once the location is found, a follow-up visual inspection of the site is recommended. 35
46 5 Summary and conclusions 5.1 Summary This study was conducted to assess the performance of the laser system and develop a method for extracting PCR scores from rut depth data gathered with the LRMS. The Laser Rut Measurement System provides the Ohio Department of Transportation with a valuable tool for evaluating the condition of pavement infrastructure. The high density of measurements and the accuracy of the laser system allow for a much higher quality assessment of rutting distresses than the traditional manual measurement methods. The ODOT profiler vehicles also allow pavement raters to evaluate a pavement segment in a much shorter amount of time and in a safer manner. Manual measurement requires the pavement rater to be exposed to the hazards of traffic. The ODOT profiler vehicle has the ability to operate while moving with the flow of traffic, thereby dramatically reducing risk of injury. The effect of the length of the straight edge used for manual measurements was also examined. To test the system s performance, two tests were conducted on selected pavement sections. The first test was performed on a west-bound section of US-30 in Wayne County, Ohio. This section is heavily used and had undergone light rutting over most of its length, with the exception of a severely rutted 200-ft (60.96 m) section at the approach to its intersection with SR-94. This section of severe rutting was also measured using the profilometer, 8 ft straight edge, and 4 ft straight edge. ODOT provided LRMS data from five runs made with the profiler vehicle over a section approximately 1.53 mi (2.46 km) in length that included the 200-ft (60.96 m) test section. The second test was over a lightly used section of SR-682 in Athens County, Ohio. This segment of SR-682 had undergone low-to-medium rutting over its entire length. A 200-ft (60.96 m) section was selected and rut depth was measured using each of the four methods. Again, ODOT provided LRMS data from five runs over a section approximately 0.80 mi (1.29 km) in length that included the 200-ft (60.96 m) test section. Statistical analyses were conducted on the data gathered from the two tests using ANOVA tests and Games-Howell post-hoc tests. The results of only the LRMS were examined for accuracy and repeatability, since the other methods were presumed accurate. The statistical analysis of the data from US-30 showed weak statistical similarity when the entire length of profiled pavement was considered. When only the 200-ft (60.96 m) test section was considered, strong statistical similarity was found. When the data from SR-682 was analyzed, statistical similarity between runs was found for the the entire pavement length as well as the 200-ft (60.96 m) test section at this site. The mean absolute deviations for the tests at SR-30 and SR-682 were inches (0.660 mm) and inches (0.762 mm) respectively. The distributions of measurements by PCR severity level over the entire pavement lengths show that the LRMS system is capable of producing the consistent and reliable PCR scores. Given that these tests were run under somewhat uncontrolled field conditions, it is believed that the results of these tests and analyses are evidence enough to conclude that the LRMS system produces repeatable and accurate results. Rut depth data from the LRMS, profilometer, 8-ft S&G, and 4-ft S&G for the 200-ft (60.96 m) test sections were analyzed and compared using the ANOVA and Games-Howell tests to assess the precision of the LRMS system and to examine the impact of the shorter straight edge on rut depth measurements. With the exception of the left wheel path data from the profilometer on SR-682, the LRMS measurements at both sites strongly correlated with the profilometer and 8-ft S&G. The profilometer data from SR-682 were influenced by deterioration 36
47 in the left wheel path that caused the rut depth algorithm to interpret pits in the pavement surface as the bottom of the rut. These data were considered invalid and were disregarded. The strong statistical similarity found in the results of the ANOVA and Games-Howell tests indicate that the LRMS produces accurate rut depth measurements. The 4-ft S&G however did not show strong similarity to the other measurement methods. The shorter length did not allow the straight edge to fully span the width of the rut in many cases. To prevent error and inaccuracy, the 4-ft S&G should be replaced with a device that meets the criteria listed in ASTM E 1703/E 1703M (1995). 5.2 Recommendations The LRMS displayed sufficient precision, accuracy, and repeatability in this study and is capable of producing reliable information for pavement evaluation purposes. To ensure that the system continues to operate properly, regular checks should be conducted. It is recommended that a section of light-use, low-traffic pavement with a range of rutting distress be selected for checks. The profiler vehicle should be run on this section monthly to ensure that readings are unchanging. More frequent checks may be necessary if the profiler is undergoing heavy use. Checks conducted less frequently may be misleading due to changes in the pavement surface caused by environment or its continued use. PCR scores can be extracted from the Dynatest.HDR files using the method described in Section 4.1. To prevent small, isolated areas of heavier rutting from mischaracterizing the pavement section, a range of 5-25% is suggested for the occasional extent classification. These isolated areas that would not account for 5% or more of the section length should still be reported and considered when performing rehabilitation. The presence of isolated and localized sections of severe rutting is represented in the extent values calculated during the analysis of the rutting files. Throughout the LRMS data gathered at both sites, there are short sections where one of the five runs produces significantly lower rut depth values than the others. It is suspected that this was a result of the profiler vehicle wandering laterally. Further study may be needed to determine the extent to which this may affect results. It is important that the LRMS operators attempt to keep the vehicle traveling within the existing wheel paths to improve the likelyhood of consistent results. 37
48 7 References ASTM (2000). Standard test method for measuring rut-depth of pavement surfaces using a straightedge (ASTM Standard E 1703/E 1703M, 1995). West Conshohocken, PA: ASTM International, 1995, DOI: /E1703_E1703M-95R05, Bennett, C. R. (2002). Establishing reference transverse profiles for rut depth measurements in New Zealand. Motueka, New Zealand: Data Collection Limited. Bennett, C.R. & Wang, H., (2002a). Harmonizing automated rut depth measurements. Report to Transfund New Zealand. Federal Highway Administration, U.S. Department of Transportation (2001). Adequacy of rut bar data collection (FHWA Techbrief Publication No. FHWA-RD-01-27). McLean, VA: Turner-Fairbank Highway Research Center. Grondin, M., Leroux, D., & Laurent, J. (2002). Advanced 3D technology for rut measurements: apparatus on board of the Quebec ministry of transportation multifunction vehicle. Quebec, Canada: Ministére des Transports du Québec, Canada. Hoffman, B. (2011). Evaluation of the automated rut measurement system used by the Ohio Department of Transportation. Unpublished master s thesis, Ohio University Miller, J.S. & Bellinger, W.Y. (2003, June). Distress identification maunal for the long-term pavement performance program (fourth revised edition) (Report No. FHWA-RD ). McLean, VA: Office of Infrastructure Research and Development. Ohio Department of Transportation (ODOT), (2006), Pavement Condition Rating Manual, Ohio Department of Transportation, Columbus OH, April, Richardson, W. (2003). Design and operation of the ORITE profilometer. Unpublished technical report, Athens, OH: Ohio Research Institute for Transportation and the Environment. Vedula, K., Hossain, M., Reigle, J., & Miller, R. (2002, 21 October). Comparison of 3-point and 5-point rut depth data analysis. Kansas State University: Offered for Presentation in Pavement Evaluation 2002 Conference, Roanoke, Virgina. Walker, Roger S. (2004). Implementation of the real-time transverse pavement profile measurement system: comprehensive report (Report No. FHWA/TX-06/ ). Arlington, TX: The University of Texas at Arlington, Transportation Instrumentation Laboratory. Wang, H. (2005). Development of laser system to measure pavement rutting. Unpublished master s thesis, University of South Florida. 38
49 Yoder, E., & Witczak, M. (1975). Principles of pavement design. New York: Wiley. 39
50 Appendix A: US-30 Rut Measurements (1 in = 25.4 mm; 100 ft = m) LWP = Left Wheel Path 40
51 41
52 42
53 43
54 44
55 45
56 RWP = Right Wheel Path 46
57 47
58 48
59 49
60 50
61 51
62 Appendix B: SR-682 Rut Measurements (1 in = 25.4 mm; 100 ft = m) LWP = Left Wheel Path 52
63 53
64 54
65 55
66 RWP = Right Wheel Path 56
67 57
68 58
69 Appendix C: PCR Data from District 10 (S&G and LRMS) County Abbrev Trans Route Milepost Segment PCR Ratings PCR Scores Start End Length (mi)** Pavement Type S&G LRMS LRMS (adj*) S&G LRMS LRMS (adj*) ATH SR FLEXIBLE ATH SR FLEXIBLE HO HO ATH SR FLEXIBLE MO LO ATH SR FLEXIBLE HO MO ATH SR FLEXIBLE HO MF ATH SR FLEXIBLE ATH SR FLEXIBLE LO ATH SR FLEXIBLE LO HO LO ATH SR FLEXIBLE LO LF LF ATH SR FLEXIBLE LO ATH SR FLEXIBLE LF MO LO ATH SR FLEXIBLE LF LO LO ATH SR FLEXIBLE LF LO ATH SR FLEXIBLE LF MO LF ATH SR FLEXIBLE MO MO LO ATH SR COMPOSITE MO HO MF GAL SR FLEXIBLE HO MO GAL SR FLEXIBLE MO MO GAL SR FLEXIBLE HO LO GAL SR FLEXIBLE MO LO GAL SR FLEXIBLE HO MO GAL SR FLEXIBLE HO MF GAL SR FLEXIBLE HO MO GAL SR FLEXIBLE MO MO GAL SR FLEXIBLE HO MF GAL SR FLEXIBLE MO MO GAL SR FLEXIBLE HO LO GAL SR FLEXIBLE GAL SR FLEXIBLE GAL SR FLEXIBLE LO GAL SR FLEXIBLE GAL SR FLEXIBLE LO HO MO * Adjusted for 5 25% range for "occasional" classification ** 1 mi = 1.61 km 59
70 County Abbrev Trans Route Milepost Segment PCR Ratings PCR Scores Start End Length (mi)** Pavement Type S&G LRMS LRMS (adj*) S&G LRMS LRMS (adj*) GAL SR FLEXIBLE LO LO GAL SR FLEXIBLE LF HOC SR FLEXIBLE MO LO HOC SR FLEXIBLE HO MO HOC SR FLEXIBLE HO HO HOC SR FLEXIBLE HO MO HOC SR FLEXIBLE HO MF HOC SR FLEXIBLE MO MO HOC SR FLEXIBLE HO MO HOC SR FLEXIBLE MO MO HOC SR FLEXIBLE MO MO HOC SR FLEXIBLE HO MO HOC SR FLEXIBLE LO HOC SR FLEXIBLE HOC SR FLEXIBLE HO MO HOC SR FLEXIBLE MO MO HOC SR FLEXIBLE MO MO HOC SR FLEXIBLE MO MO HOC SR FLEXIBLE HO HO HOC SR FLEXIBLE HF HF HOC SR FLEXIBLE HO MO HOC SR FLEXIBLE HO HO HOC SR FLEXIBLE LO HOC SR FLEXIBLE HO MO HOC SR FLEXIBLE LO HO MO HOC SR FLEXIBLE LO HO MF HOC SR FLEXIBLE LO LF LF HOC SR FLEXIBLE LO HO MO HOC SR FLEXIBLE LO HO MO HOC SR FLEXIBLE LO MO MO HOC SR FLEXIBLE LO HO MF HOC SR FLEXIBLE LO LO LO * Adjusted for 5 25% range for "occasional" classification ** 1 mi = 1.61 km 60
71 County Abbrev Trans Route Milepost Segment PCR Ratings PCR Scores Start End Length (mi)** Pavement Type S&G LRMS LRMS (adj*) S&G LRMS LRMS (adj*) HOC SR FLEXIBLE LO LO HOC SR FLEXIBLE LO LO HOC SR FLEXIBLE LF MO MO HOC SR FLEXIBLE LF MO MO HOC SR FLEXIBLE LF HO MO HOC SR FLEXIBLE LF LO HOC SR FLEXIBLE LE HO HO HOC SR FLEXIBLE MO HO MF HOC SR FLEXIBLE MO MO MO HOC SR FLEXIBLE MO MO MO MEG SR FLEXIBLE HO LO MEG SR FLEXIBLE LF LF MEG SR FLEXIBLE MEG SR FLEXIBLE MO LO MEG SR FLEXIBLE MO LO MEG SR FLEXIBLE MO LO MEG SR FLEXIBLE MO LO MEG SR FLEXIBLE MO LO MEG SR FLEXIBLE MO LO MEG SR FLEXIBLE LO MEG SR FLEXIBLE LO LO MEG SR FLEXIBLE MO LO MEG SR FLEXIBLE MEG SR FLEXIBLE HO MO MEG SR FLEXIBLE HO HO MEG SR FLEXIBLE MO LO MEG SR FLEXIBLE MO LO MEG SR FLEXIBLE MO MEG SR FLEXIBLE MEG SR FLEXIBLE MO LO MEG SR FLEXIBLE MO MEG SR FLEXIBLE MF MF * Adjusted for 5 25% range for "occasional" classification ** 1 mi = 1.61 km 61
72 County Abbrev Trans Route Milepost Segment PCR Ratings PCR Scores Start End Length (mi)** Pavement Type S&G LRMS LRMS (adj*) S&G LRMS LRMS (adj*) MEG SR FLEXIBLE MF MF MEG SR FLEXIBLE MO MO MEG SR COMPOSITE MEG SR COMPOSITE MO LO MEG SR FLEXIBLE LO HO MF MEG SR FLEXIBLE LO MO MO MEG SR FLEXIBLE LO MO LO MEG SR FLEXIBLE LO MO MO MEG SR FLEXIBLE LO LO LO MEG SR FLEXIBLE LO MO LO MEG SR FLEXIBLE LO LO LO MEG SR FLEXIBLE LF LO LO MOE SR FLEXIBLE LO LO MOE SR FLEXIBLE LO LO MOE SR FLEXIBLE MO MO MOE SR FLEXIBLE HO MO MOE SR FLEXIBLE HO MO MOE SR FLEXIBLE HO HO MOE SR FLEXIBLE HO HO MOE SR FLEXIBLE MF MF MOE SR FLEXIBLE MO LF MOE SR FLEXIBLE HO MO MOE SR FLEXIBLE HO MF MOE SR FLEXIBLE HO MF MOE SR FLEXIBLE HO MO MOE SR FLEXIBLE MO MO MOE SR FLEXIBLE HO MF MOE SR FLEXIBLE MF MF MOE SR FLEXIBLE HO MF MOE SR FLEXIBLE ME MF MOE SR FLEXIBLE MO LF MOE SR FLEXIBLE HO MO * Adjusted for 5 25% range for "occasional" classification ** 1 mi = 1.61 km 62
73 County Abbrev Trans Route Milepost Segment PCR Ratings PCR Scores Start End Length (mi)** Pavement Type S&G LRMS LRMS (adj*) S&G LRMS LRMS (adj*) MOE SR FLEXIBLE ME MF MOE SR FLEXIBLE HO MF MOE SR FLEXIBLE MO MO MOE SR FLEXIBLE MOE SR FLEXIBLE MO MO MOE SR FLEXIBLE HO MO MOE SR FLEXIBLE HO HO MOE SR FLEXIBLE HO HO MOE SR FLEXIBLE HF HF MOE SR FLEXIBLE HO HO MOE SR FLEXIBLE HO HO MOE SR FLEXIBLE HO MF MOE SR FLEXIBLE HO MF MOE SR FLEXIBLE MOE SR FLEXIBLE MOE SR FLEXIBLE LO MOE SR COMPOSITE LF LF MOE SR COMPOSITE LE LF MOE SR COMPOSITE LF LF MOE SR COMPOSITE MO MO MOE SR COMPOSITE LO MOE SR COMPOSITE MO MO MOE SR COMPOSITE ME MF MOE SR COMPOSITE MO MO MOE SR COMPOSITE MF MF MOE SR COMPOSITE MOE SR COMPOSITE MF MF MOE SR FLEXIBLE LO MF MF MOE SR FLEXIBLE LO HO HO MOE SR FLEXIBLE LO MF MF MOE SR FLEXIBLE LO HO HO MOE SR FLEXIBLE LO HO HO * Adjusted for 5 25% range for "occasional" classification ** 1 mi = 1.61 km 63
74 County Abbrev Trans Route Milepost Segment PCR Ratings PCR Scores Start End Length (mi)** Pavement Type S&G LRMS LRMS (adj*) S&G LRMS LRMS (adj*) MOE SR FLEXIBLE LO HO HO MOE SR COMPOSITE LO MO LF MOE SR COMPOSITE LO LO MOE SR FLEXIBLE MO MF MF MOE SR COMPOSITE MF HO LO MRG SR FLEXIBLE HO MO MRG SR FLEXIBLE MO MO MRG SR FLEXIBLE MO LO MRG SR FLEXIBLE HO MO MRG SR FLEXIBLE MO LO MRG SR FLEXIBLE HO MO MRG SR FLEXIBLE HO MO MRG SR FLEXIBLE HO MRG SR FLEXIBLE LO MO MO MRG SR FLEXIBLE LO MO MO MRG SR COMPOSITE LO MRG SR FLEXIBLE LF MO MO MRG SR FLEXIBLE LF LO LO MRG SR FLEXIBLE LF MRG SR FLEXIBLE LF HO MO MRG SR FLEXIBLE LF HO MO MRG SR FLEXIBLE LF HO MF MRG SR FLEXIBLE LF MO LF MRG SR FLEXIBLE LF MO LF MRG SR FLEXIBLE LF MO LO MRG SR COMPOSITE LF MRG SR COMPOSITE LF MRG SR COMPOSITE LF MRG SR COMPOSITE LF MO LO MRG SR COMPOSITE LF MRG SR COMPOSITE LF MRG SR FLEXIBLE LE * Adjusted for 5 25% range for "occasional" classification ** 1 mi = 1.61 km 64
75 County Abbrev Trans Route Milepost Segment PCR Ratings PCR Scores Start End Length (mi)** Pavement Type S&G LRMS LRMS (adj*) S&G LRMS LRMS (adj*) MRG SR FLEXIBLE LE HO MO MRG SR COMPOSITE LE MO MRG SR COMPOSITE LE MRG SR FLEXIBLE MO LO MRG SR FLEXIBLE MO HO MO MRG SR FLEXIBLE MO MO LO MRG SR FLEXIBLE MO HO MO MRG SR FLEXIBLE MO HO MO MRG SR COMPOSITE MO MO MO NOB SR FLEXIBLE MO NOB SR FLEXIBLE MO LO NOB SR FLEXIBLE HO MO NOB SR FLEXIBLE LF LF NOB SR FLEXIBLE MO MO NOB SR FLEXIBLE MO MO NOB SR FLEXIBLE HO MO NOB SR FLEXIBLE LF LF NOB SR FLEXIBLE HO MO NOB SR FLEXIBLE HO MO NOB SR FLEXIBLE ME MF NOB SR FLEXIBLE LO NOB SR COMPOSITE NOB SR COMPOSITE MF MF NOB SR COMPOSITE HO LO NOB SR COMPOSITE MO NOB SR COMPOSITE LO NOB SR COMPOSITE LO LO NOB SR FLEXIBLE LO HO MF NOB SR FLEXIBLE LO HO HO NOB SR FLEXIBLE LO HO MO NOB SR FLEXIBLE LO MO LO NOB SR FLEXIBLE LO HO MF * Adjusted for 5 25% range for "occasional" classification ** 1 mi = 1.61 km 65
76 County Abbrev Trans Route Milepost Segment PCR Ratings PCR Scores Start End Length (mi)** Pavement Type S&G LRMS LRMS (adj*) S&G LRMS LRMS (adj*) NOB SR FLEXIBLE LO HO MF NOB SR FLEXIBLE LO HO MO NOB SR FLEXIBLE LO HO MF NOB SR FLEXIBLE LO HO MF NOB SR FLEXIBLE LO MO LO NOB SR FLEXIBLE LO MO LO NOB SR FLEXIBLE LO MF MF NOB SR FLEXIBLE LO MF MF NOB SR COMPOSITE LO MO NOB SR FLEXIBLE LF HO MO NOB SR FLEXIBLE LF MO MO NOB SR FLEXIBLE LF MO LF NOB SR FLEXIBLE LF MO MO NOB SR FLEXIBLE LF LO LO NOB SR FLEXIBLE LF MO MO NOB SR FLEXIBLE LF MO NOB SR FLEXIBLE LF MO MO NOB SR COMPOSITE LF MO MO NOB SR FLEXIBLE LE MO MO NOB SR COMPOSITE LE MO LO NOB SR COMPOSITE LE MF MF NOB SR FLEXIBLE MO HO MF NOB SR FLEXIBLE MO MF MF NOB SR FLEXIBLE MO HO HO NOB SR FLEXIBLE MO HO HO NOB SR FLEXIBLE MO HO MF NOB SR FLEXIBLE MO HO MF NOB SR COMPOSITE MO MO LO NOB SR FLEXIBLE MF MO MO NOB SR FLEXIBLE MF MO LO VIN SR FLEXIBLE VIN SR FLEXIBLE * Adjusted for 5 25% range for "occasional" classification ** 1 mi = 1.61 km 66
77 County Abbrev Trans Route Milepost Segment PCR Ratings PCR Scores Start End Length (mi)** Pavement Type S&G LRMS LRMS (adj*) S&G LRMS LRMS (adj*) VIN SR FLEXIBLE LO VIN SR FLEXIBLE LO VIN SR FLEXIBLE LO LO VIN SR FLEXIBLE LO MO MO VIN SR FLEXIBLE LF MO VIN US FLEXIBLE VIN US FLEXIBLE VIN US COMPOSITE VIN US COMPOSITE VIN US COMPOSITE VIN US COMPOSITE MO VIN US FLEXIBLE LO VIN US COMPOSITE LO VIN US COMPOSITE LO LO VIN US COMPOSITE LO LO VIN US FLEXIBLE LF LO VIN US FLEXIBLE LF VIN US COMPOSITE LF VIN US COMPOSITE LF LO VIN US COMPOSITE LE WAS SR FLEXIBLE WAS SR FLEXIBLE MO WAS SR FLEXIBLE HO HO WAS SR FLEXIBLE HO HO WAS SR FLEXIBLE WAS SR FLEXIBLE LO LO WAS SR FLEXIBLE MO MO WAS SR FLEXIBLE MF MF WAS SR FLEXIBLE MO MO WAS SR FLEXIBLE HO MO WAS SR FLEXIBLE MO MO WAS SR FLEXIBLE MF MF * Adjusted for 5 25% range for "occasional" classification ** 1 mi = 1.61 km 67
78 County Abbrev Trans Route Milepost Segment PCR Ratings PCR Scores Start End Length (mi)** Pavement Type S&G LRMS LRMS (adj*) S&G LRMS LRMS (adj*) WAS SR FLEXIBLE HO MF WAS SR FLEXIBLE HO MF WAS SR FLEXIBLE MF MF WAS SR FLEXIBLE HO HO WAS SR FLEXIBLE HO MO WAS SR FLEXIBLE HO MO WAS SR FLEXIBLE HO LO WAS SR COMPOSITE LF LF WAS SR COMPOSITE LO LO WAS SR COMPOSITE WAS SR COMPOSITE LO WAS SR COMPOSITE MO WAS SR COMPOSITE WAS SR COMPOSITE MO WAS SR COMPOSITE LO WAS SR COMPOSITE WAS SR COMPOSITE WAS SR COMPOSITE WAS SR COMPOSITE MO LO WAS SR COMPOSITE MF MF WAS SR COMPOSITE MO MO WAS SR COMPOSITE MO WAS SR COMPOSITE MO LF WAS SR COMPOSITE MO MO WAS SR COMPOSITE HO MO WAS SR COMPOSITE LO WAS SR COMPOSITE LO WAS SR FLEXIBLE LO WAS SR FLEXIBLE LO WAS SR FLEXIBLE LO HO MO WAS SR FLEXIBLE LO HO HO WAS SR FLEXIBLE LO HO LO * Adjusted for 5 25% range for "occasional" classification ** 1 mi = 1.61 km 68
79 County Abbrev Trans Route Milepost Segment PCR Ratings PCR Scores Start End Length (mi)** Pavement Type S&G LRMS LRMS (adj*) S&G LRMS LRMS (adj*) WAS SR FLEXIBLE LO WAS SR FLEXIBLE LO WAS SR FLEXIBLE LO MO MO WAS SR FLEXIBLE LO LO LO WAS SR FLEXIBLE LO HO MO WAS SR FLEXIBLE LO HO HO WAS SR FLEXIBLE LO MF MF WAS SR FLEXIBLE LO MF MF WAS SR FLEXIBLE LO HO MO WAS SR FLEXIBLE LO WAS SR FLEXIBLE LO LO WAS SR COMPOSITE LO WAS SR COMPOSITE LO WAS SR COMPOSITE LO ME MF WAS SR COMPOSITE LO MO MO WAS SR COMPOSITE LO MO MO WAS SR COMPOSITE LO WAS SR COMPOSITE LO WAS SR COMPOSITE LO LO WAS SR FLEXIBLE LF LO WAS SR FLEXIBLE LF MO LF WAS SR FLEXIBLE LF WAS SR FLEXIBLE LF MO LO WAS SR FLEXIBLE LF MO MO WAS SR FLEXIBLE LF MO MO WAS SR FLEXIBLE LF HO MF WAS SR FLEXIBLE LF MF MF WAS SR FLEXIBLE LF ME MF WAS SR COMPOSITE LF MO MO WAS SR COMPOSITE LF WAS SR COMPOSITE LF LO WAS SR COMPOSITE LF * Adjusted for 5 25% range for "occasional" classification ** 1 mi = 1.61 km 69
80 County Abbrev Trans Route Milepost Segment PCR Ratings PCR Scores Start End Length (mi)** Pavement Type S&G LRMS LRMS (adj*) S&G LRMS LRMS (adj*) WAS SR COMPOSITE LF HF HF WAS SR COMPOSITE LF MO WAS SR COMPOSITE LF LO LO WAS SR COMPOSITE LF MO MO WAS SR COMPOSITE LF WAS SR COMPOSITE LF ME MF WAS SR COMPOSITE LF MO MO WAS SR COMPOSITE LF MO MO WAS SR COMPOSITE LF MF MF WAS SR COMPOSITE LF WAS SR COMPOSITE LF LO LO WAS SR COMPOSITE LF MF MF WAS SR COMPOSITE LF HO MF WAS SR FLEXIBLE LE MO MO WAS SR FLEXIBLE LE MO LF WAS SR FLEXIBLE LE WAS SR FLEXIBLE LE LO WAS SR FLEXIBLE LE MO WAS SR FLEXIBLE LE MO WAS SR FLEXIBLE LE LO WAS SR FLEXIBLE LE WAS SR FLEXIBLE LE WAS SR FLEXIBLE LE LO WAS SR FLEXIBLE LE LO WAS SR FLEXIBLE LE MO WAS SR FLEXIBLE LE WAS SR FLEXIBLE LE MO LO WAS SR FLEXIBLE LE LO LO WAS SR COMPOSITE LE HO MF WAS SR COMPOSITE LE WAS SR COMPOSITE LE LO WAS SR COMPOSITE LE MO MO * Adjusted for 5 25% range for "occasional" classification ** 1 mi = 1.61 km 70
81 County Abbrev Trans Route Milepost Segment PCR Ratings PCR Scores Start End Length (mi)** Pavement Type S&G LRMS LRMS (adj*) S&G LRMS LRMS (adj*) WAS SR COMPOSITE LE LF LF WAS SR COMPOSITE LE MO MO WAS SR COMPOSITE LE LO LO WAS SR COMPOSITE LE LO WAS SR COMPOSITE LE MO LO WAS SR COMPOSITE LE MF MF WAS SR COMPOSITE LE WAS SR COMPOSITE LE MO LO WAS SR COMPOSITE LE ME MF WAS SR COMPOSITE LE LO WAS SR COMPOSITE LE LO WAS SR COMPOSITE LE LO LO WAS SR COMPOSITE LE LO * Adjusted for 5 25% range for "occasional" classification ** 1 mi = 1.61 km 71
82
83

84 ORITE 141 Stocker Center Athens, Ohio Fax:
Develop a PWL System for Dense Graded Hot Mix Asphalt Construction, Including Pay Factors
 NDOT Research Report Report No. 206-10-803 Develop a PWL System for Dense Graded Hot Mix Asphalt Construction, Including Pay Factors January 2015 Nevada Department of Transportation 1263 South Stewart
Alaska University Transportation Center
 Alaska Department of Transportation & Public Facilities Alaska University Transportation Center Structural Health Monitoring and Condition Assessment of Chulitna River Bridge: Training Report Prepared
TxDOT Project : Evaluation of Pavement Rutting and Distress Measurements
 0-6663-P2 RECOMMENDATIONS FOR SELECTION OF AUTOMATED DISTRESS MEASURING EQUIPMENT Pedro Serigos Maria Burton Andre Smit Jorge Prozzi MooYeon Kim Mike Murphy TxDOT Project 0-6663: Evaluation of Pavement
STRAIN MONITORING FOR HORSETAIL FALLS AND SYLVAN BRIDGES. Final Report
 STRAIN MONITORING FOR HORSETAIL FALLS AND SYLVAN BRIDGES Final Report SPR 34-81 by Steven Soltesz Oregon Department of Transportation Research Group for Oregon Department of Transportation Research Group
Measurement and Data Core Guide Grade 4
 Solve problems involving measurement and conversion of measurements from a larger unit to a smaller unit (Standards 4.MD.1 2) Standard 4.MD.1 Know relative sizes of measurement units within each system
Northern York County School District Curriculum
 Northern York County School District Curriculum Course Name Grade Level Mathematics Fourth grade Unit 1 Number and Operations Base Ten Time Frame 4-5 Weeks PA Common Core Standard (Descriptor) (Grades
STATE OF OHIO DEPARTMENT OF TRANSPORTATION SUPPLEMENT SUBMITTAL AND APPLICATION REQUIREMENTS FOR ProVAL PAVEMENT SMOOTHNESS SOFTWARE
 STATE OF OHIO DEPARTMENT OF TRANSPORTATION SUPPLEMENT 1110 SUBMITTAL AND APPLICATION REQUIREMENTS FOR ProVAL PAVEMENT SMOOTHNESS SOFTWARE April 18, 2014 1110.01 Scope 1110.02 Acquiring software 1110.03
Central Federal Lands Division Data Collection Packages
 Central Federal Lands Division Data Collection Packages Final Report March 2011 [Type text] Department of Transportation Federal Highway Administration Central Federal Lands Division 12300 W. Dakota Avenue
Technical Report Documentation Page 2. Government 3. Recipient s Catalog No.
 1. Report No. FHWA/TX-06/0-4958-1 Technical Report Documentation Page 2. Government 3. Recipient s Catalog No. Accession No. 4. Title and Subtitle Linear Lighting System for Automated Pavement Distress
Why is math important in. healthcare?
 00 000 00 0 000 000 0 Why is math important in 00 000 00 0 000 000 0 healthcare? Health care workers are required to perform simple math calculations when doing various tasks. Mathematical errors may result
OPERATING PAVEMENT PROFILOGRAPH AND EVALUATING PROFILES
 Test Procedure for OPERATING PAVEMENT PROFILOGRAPH AND EVALUATING PROFILES Texas Department of Transportation TxDOT Designation: Tex-1000-S Effective Date: August 1999 1. SCOPE 1.1 This method covers the
VGLA COE Organizer Mathematics 4
 4.1 The Student will identify the place value for each digit in a whole number expressed through millions a) orally and in writing; b) compare two whole numbers expressed through millions, using symbols
Update: July 20, 2012
 Location and Design Manual, Volume 3 ODOT Office of CADD and Mapping Services Update: July 20, 2012 ** NOTE: All metric references have been removed from this manual. ** PREFACE REVISIONS Glossary of Terms
1. Report No. FHWA/TX-05/ Title and Subtitle PILOT IMPLEMENTATION OF CONCRETE PAVEMENT THICKNESS GPR
 1. Report No. FHWA/TX-05/5-4414-01-3 4. Title and Subtitle PILOT IMPLEMENTATION OF CONCRETE PAVEMENT THICKNESS GPR Technical Report Documentation Page 2. Government Accession No. 3. Recipient s Catalog
Noise Mitigation Study Pilot Program Summary Report Contract No
 Ohio Turnpike Commission Noise Mitigation Study Pilot Program Summary Report Contract No. 71-08-02 Prepared For: Ohio Turnpike Commission 682 Prospect Street Berea, Ohio 44017 Prepared By: November 2009
APPENDIX E INSTRUMENT VERIFICATION STRIP REPORT. Final Remedial Investigation Report for the Former Camp Croft Spartanburg, South Carolina Appendices
 Final Remedial Investigation Report for the Former Camp Croft APPENDIX E INSTRUMENT VERIFICATION STRIP REPORT Contract No.: W912DY-10-D-0028 Page E-1 Task Order No.: 0005 Final Remedial Investigation Report
Improving the Safety and Efficiency of Roadway Maintenance Phase II: Developing a Vision Guidance System for the Robotic Roadway Message Painter
 Improving the Safety and Efficiency of Roadway Maintenance Phase II: Developing a Vision Guidance System for the Robotic Roadway Message Painter Final Report Prepared by: Ryan G. Rosandich Department of
Converting Within Measurement Systems. ESSENTIAL QUESTION How do you convert units within a measurement system? 6.RP.1.3d
 ? L E S S O N 7.3 Converting Within Measurement Systems ESSENTIAL QUESTION How do you convert units within a measurement system? Use ratio reasoning to convert measurement units; manipulate and transform
Converting Within Measurement Systems. ESSENTIAL QUESTION How do you convert units within a measurement system? 6.RP.1.3d
 L E S S O N 7.3 Converting Within Measurement Systems Use ratio reasoning to convert measurment units; manipulate and transform units appropriately when multiplying or dividing quantities. Also 6.RP.1.3
11. Contract or Grant No. Lubbock, Texas Project
 TECHNICAL REPORT DOCUMENTATION PAGE 1. Report No. 2. Government Accession No. 3. Recipient's Catalog No. TX -99/7-4936-2 4. Title and Subtitle 5. Report Date Test Method Tex-899-B Radio-Frequency Interference
OPPORTUNISTIC TRAFFIC SENSING USING EXISTING VIDEO SOURCES (PHASE II)
") CIVIL ENGINEERING STUDIES Illinois Center for Transportation Series No. 17-003 UILU-ENG-2017-2003 ISSN: 0197-9191 OPPORTUNISTIC TRAFFIC SENSING USING EXISTING VIDEO SOURCES (PHASE II) Prepared By Jakob
CIVIL ENGINEERING STUDIES Illinois Center for Transportation Series No. 17-003 UILU-ENG-2017-2003 ISSN: 0197-9191 OPPORTUNISTIC TRAFFIC SENSING USING EXISTING VIDEO SOURCES (PHASE II) Prepared By Jakob
Project No.: VTRC 06-R22 March Period Covered: Contract No.
 Standard Title Page - Report on State Project Report No. Report Date No. Pages Type Report: Final Project No.: 78783 VTRC 06-R22 March 2006 17 Period Covered: Contract No. Title: Evaluation of Precast
4th Grade Common Core Math Vocabulary
 + = + = + = + = + 4th Grade Common Core Math Vocabulary Created by Alexis Sergi Alexis Sergi http://www.teachersnotebook.com/shop/mathmojo = + = + + = + = + 1 Table of Contents!!!!!!!!!!!! Page Number
Grade 6 Mathematics Practice Test
 Grade 6 Mathematics Practice Test Nebraska Department of Education 2010 Directions: On the following pages are multiple-choice questions for the Grade 6 Practice Test, a practice opportunity for the Nebraska
Measurement / Scale Long-Term Memory Review Grade 6, Standard 3.0 Review 1
 Review 1 1. Convert: 240 mg to g 2. Name a metric unit that measures capacity. 3. Explain how to convert feet to inches. 4. Complete this table:.004 4 1 10,000 5. Joe and Lola are hanging picture frames.
Math 6/7 Unit 10 - GEOMETRY - Study Guide (SOL 6.10)
") Math 6/7 Unit 10 - GEOMETRY - Study Guide (SOL 6.10) Find the perimeter of the following (include the correct units): 1) 2) 5.3 cm 15 ft 15 ft 10.6 cm 18 ft P = P = Solve the following (include the correct
Math 6/7 Unit 10 - GEOMETRY - Study Guide (SOL 6.10) Find the perimeter of the following (include the correct units): 1) 2) 5.3 cm 15 ft 15 ft 10.6 cm 18 ft P = P = Solve the following (include the correct
ON USING PERFECT SIGNAL PROGRESSION AS THE BASIS FOR ARTERIAL DESIGN: A NEW PERSPECTIVE
 ON USING PERFECT SIGNAL PROGRESSION AS THE BASIS FOR ARTERIAL DESIGN: A NEW PERSPECTIVE Samuel J. Leckrone, P.E., Corresponding Author Virginia Department of Transportation Commerce Rd., Staunton, VA,
FINAL REPORT. On Project Supplemental Guidance on the Application of FHWA s Traffic Noise Model (TNM) APPENDIX K Parallel Barriers
 APPENDIX K Parallel Barriers") FINAL REPORT On Project - Supplemental Guidance on the Application of FHWA s Traffic Noise Model (TNM) APPENDIX K Parallel Barriers Prepared for: National Cooperative Highway Research Program (NCHRP) Transportation
FINAL REPORT On Project - Supplemental Guidance on the Application of FHWA s Traffic Noise Model (TNM) APPENDIX K Parallel Barriers Prepared for: National Cooperative Highway Research Program (NCHRP) Transportation
Texas Transportation Institute The Texas A&M University System College Station, Texas
 1. Report No. FHWA/TX-06/5-4577-01-1 4. Title and Subtitle PILOT IMPLEMENTATION OF PAVE-IR FOR DETECTING SEGREGATION IN HOT-MIX ASPHALT CONSTRUCTION 2. Government Accession No. 3. Recipient's Catalog No.
4 th Grade Curriculum Map
 4 th Grade Curriculum Map 2017-18 MONTH UNIT/ CONTENT CORE GOALS/SKILLS STANDARDS WRITTEN ASSESSMENTS ROUTINES RESOURCES VOCABULARY September Chapter 1 8 days NUMBERS AND OPERATIONS IN BASE TEN WORKING
Chapter 4 Results. 4.1 Pattern recognition algorithm performance
 94 Chapter 4 Results 4.1 Pattern recognition algorithm performance The results of analyzing PERES data using the pattern recognition algorithm described in Chapter 3 are presented here in Chapter 4 to
2.02 Units and the Metric System
 2.02 Units and the Metric System Dr. Fred Omega Garces Chemistry 100 Miramar College 1 2.02 Units and the Metric System Measurements In our daily lives we deal with making measurement routinely. i.e.,
Constructing Line Graphs*
 Appendix B Constructing Line Graphs* Suppose we are studying some chemical reaction in which a substance, A, is being used up. We begin with a large quantity (1 mg) of A, and we measure in some way how
GRADE 4. M : Solve division problems without remainders. M : Recall basic addition, subtraction, and multiplication facts.
 GRADE 4 Students will: Operations and Algebraic Thinking Use the four operations with whole numbers to solve problems. 1. Interpret a multiplication equation as a comparison, e.g., interpret 35 = 5 7 as
4 th Grade Mathematics Learning Targets By Unit
 INSTRUCTIONAL UNIT UNIT 1: WORKING WITH WHOLE NUMBERS UNIT 2: ESTIMATION AND NUMBER THEORY PSSA ELIGIBLE CONTENT M04.A-T.1.1.1 Demonstrate an understanding that in a multi-digit whole number (through 1,000,000),
For Preview Only GEO5 STUDENT PAGES. GEOMETRY AND MEASUREMENT Student Pages for Packet 5: Measurement. Name Period Date
 Name Period Date GEO5 STUDENT PAGES GEOMETRY AND MEASUREMENT Student Pages for Packet 5: GEO5.1 Conversions Compare measurements within and between measurement systems. Convert measurements within and
Non-Destructive Bridge Deck Assessment using Image Processing and Infrared Thermography. Masato Matsumoto 1
 Non-Destructive Bridge Deck Assessment using Image Processing and Infrared Thermography Abstract Masato Matsumoto 1 Traditionally, highway bridge conditions have been monitored by visual inspection with
PORTABLE WEIGH-IN-MOTION FOR PAVEMENT DESIGN - PHASES 1 AND 2
 Oklahoma Department of Transportation 200 NE 21st Street, Oklahoma City, OK 73105-3204 FINAL REPORT ~ FHWA-OK-14-07 PORTABLE WEIGH-IN-MOTION FOR PAVEMENT DESIGN - PHASES 1 AND 2 Hazem Refai, Ph.D. Ahmad
Summer Solutions Common Core Mathematics 4. Common Core. Mathematics. Help Pages
 4 Common Core Mathematics 63 Vocabulary Acute angle an angle measuring less than 90 Area the amount of space within a polygon; area is always measured in square units (feet 2, meters 2, ) Congruent figures
FASTENERS, MEASUREMENTS AND CONVERSIONS
 FASTENERS, MEASUREMENTS AND CONVERSIONS Bolts, Nuts and Other Threaded Retainers Although there are a great variety of fasteners found in the modern car or truck, the most commonly used retainer is the
Plan Preparation Checklist
 Appendix D Plan Preparation Checklist It is the responsibility of the Designer to complete and submit this checklist along with all required drawings for OUC (EFP) Review. All drawings submitted for OUC
3 All Weather Paint. Product Bulletin January Second Drop Glass Beads
 3 All Weather Paint Product Bulletin January 2010 Description 3M All Weather Paint is a traffic paint system consisting of high-build waterborne paint and 3M bonded core elements. 3M all weather paint
Grade 6. Prentice Hall. Connected Mathematics 6th Grade Units Alaska Standards and Grade Level Expectations. Grade 6
 Prentice Hall Connected Mathematics 6th Grade Units 2004 Grade 6 C O R R E L A T E D T O Expectations Grade 6 Content Standard A: Mathematical facts, concepts, principles, and theories Numeration: Understand
Edgerail Aluminum Bridge Railing System Specification & Installation Instructions
 Edgerail System Specification & Installation Instructions Hill & Smith, Inc 1000 Buckeye Park Road Columbus, Ohio 43207 Tel: 614-340-6294 Fax: 614-340-6296 www.hillandsmith.com Section A System Specification
NUTC R293. Field Evaluation of Thermographic Bridge Concrete Inspection Techniques. Glenn Washer
 Field Evaluation of Thermographic Bridge Concrete Inspection Techniques by Glenn Washer NUTC R293 A National University Transportation Center at Missouri University of Science and Technology Disclaimer
xcvbnmqwertyuiopasdfghjklzxcvbnmqwertyuiopa Grade 2 Math Crook County School District # 1 Curriculum Guide
 qwertyuiopasdfghjklzxcvbnmqwertyuiopasdfghjkl zxcvbnmqwertyuiopasdfghjklzxcvbnmqwertyuiop asdfghjklzxcvbnmqwertyuiopasdfghjklzxcvbnmq wertyuiopasdfghjklzxcvbnmqwertyuiopasdfghjklz Crook County School District
Deployment and Testing of Optimized Autonomous and Connected Vehicle Trajectories at a Closed- Course Signalized Intersection
 Deployment and Testing of Optimized Autonomous and Connected Vehicle Trajectories at a Closed- Course Signalized Intersection Clark Letter*, Lily Elefteriadou, Mahmoud Pourmehrab, Aschkan Omidvar Civil
CENTER FOR INFRASTRUCTURE ENGINEERING STUDIES
 1 CENTER FOR INFRASTRUCTURE ENGINEERING STUDIES Nondestructive Ultrasonic Detection of FRP Delamination By Dr. Norbert Maerz University Transportation Center Program at UTC R81 The University of Missouri-Rolla
A Systematic Approach for Evaluating LED Street Light Fixtures
 A Systematic Approach for Evaluating LED Street Light Fixtures By Blake Redfield LED street lights are gaining popularity throughout the US and the world. Numerous companies have offered LED street lights
Simulation and Animation Tools for Analysis of Vehicle Collision: SMAC (Simulation Model of Automobile Collisions) and Carmma (Simulation Animations)
 and Carmma (Simulation Animations)") CALIFORNIA PATH PROGRAM INSTITUTE OF TRANSPORTATION STUDIES UNIVERSITY OF CALIFORNIA, BERKELEY Simulation and Animation Tools for Analysis of Vehicle Collision: SMAC (Simulation Model of Automobile Collisions)
CALIFORNIA PATH PROGRAM INSTITUTE OF TRANSPORTATION STUDIES UNIVERSITY OF CALIFORNIA, BERKELEY Simulation and Animation Tools for Analysis of Vehicle Collision: SMAC (Simulation Model of Automobile Collisions)
CHECKLIST PRELIMINARY SUBDIVISION AND PRELIMINARY SITE PLAN
 N/A Waiver (1) Four (4) copies of application form. (2) Fifteen (15) copies of plan (3) Subdivision/site plan application fee & professional review escrow deposit (4) Variance application fee & professional
Falling Weight Deflectometer
 elastic pavements ltd Manufacturer of highly specialist equipment Falling Weight Deflectometer Model ASTEC-120-2013-9G The device is used to measure the vertical deflection response of a surface to an
GPR SYSTEM USER GUIDE AND TROUBLESHOOTING GUIDE
 GPR SYSTEM USER GUIDE AND TROUBLESHOOTING GUIDE Implementation Report 5-4414-01-1 Project Number 5-4414-01 Subsurface Sensing Lab Electrical and Computer Engineering University of Houston 4800 Calhoun
NEXT GENERATION SMART BARREL SYSTEM FOR WORKZONE SAFETY ENHANCEMENT
 NEXT GENERATION SMART BARREL SYSTEM FOR WORKZONE SAFETY ENHANCEMENT FINAL REPORT ~ FHWA-OK-12-02 ODOT SP&R ITEM NUMBER 2232 Submitted to: John Bowman, P.E. Planning & Research Division Engineer Oklahoma
REVIEW TOPICS CEEN 2320 FINAL EXAM
 REVIEW TOPICS CEEN 2320 FINAL EXAM Be familiar with all materials covered in class, your class handouts and the notes you took in class, your homework assignments, test questions, formulas, tables, figures.
MATH NEWS. 5 th Grade Math. Focus Area Topic A. Grade 5, Module 2, Topic A. Words to know. Things to Remember:
 MATH NEWS Grade 5, Module 2, Topic A 5 th Grade Math Focus Area Topic A Math Parent Letter This document is created to give parents and students a better understanding of the math concepts found in Eureka
HiSPEQ: GUIDANCE FOR ROAD ADMINISTRATIONS FOR SPECIFYING NETWORK SURVEYS - EQUIPMENT
 CEDR Transnational Road Research Programme Call 2013: Aging Infrastructure Management funded by Denmark, Germany, Ireland, Netherlands, UK and Slovenia HiSPEQ: GUIDANCE FOR ROAD ADMINISTRATIONS FOR SPECIFYING
The University of the State of New York REGENTS HIGH SCHOOL EXAMINATION GEOMETRY. Thursday, August 17, :30 to 3:30 p.m.
 GEOMETRY The University of the State of New York REGENTS HIGH SCHOOL EXAMINATION GEOMETRY Thursday, August 17, 2017 12:30 to 3:30 p.m., only Student Name: School Name: The possession or use of any communications
DEVELOPMENT AND EVALUATION OF FIBER OPTIC SENSORS. Final Report PROJECT 312
 DEVELOPMENT AND EVALUATION OF FIBER OPTIC SENSORS Final Report PROJECT 312 DEVELOPMENT AND EVALUATION OF FIBER OPTIC SENSORS Final Report PROJECT 312 by Eric Udd and Marley Kunzler Blue Road Research
THE DET CURVE IN ASSESSMENT OF DETECTION TASK PERFORMANCE
 THE DET CURVE IN ASSESSMENT OF DETECTION TASK PERFORMANCE A. Martin*, G. Doddington#, T. Kamm+, M. Ordowski+, M. Przybocki* *National Institute of Standards and Technology, Bldg. 225-Rm. A216, Gaithersburg,
5 m-measurement system for traceable measurements of tapes and rules
 5 m-measurement system for traceable measurements of tapes and rules Tanfer Yandayan*, Bulent Ozgur Tubitak Ulusal Metroloji Enstitusu (UME) PK54, 4147 Gebze-KOCAELI / TURKEY ABSTRACT Line standards such
Exit 61 I-90 Interchange Modification Justification Study
 Exit 61 I-90 Interchange Modification Justification Study Introduction Exit 61 is a diamond interchange providing the connection between Elk Vale Road and I-90. Figure 1 shows the location of Exit 61.
Remember: Equilateral All sides and angles equal. Right-Angled Includes one right angle (90 ) Scalene No sides equal.
 Scalene No sides equal.") Prime Numbers Square Numbers 2 3 5 6 7 8 9 0 3 5 6 7 8 9 20 2 22 23 2 25 26 27 28 29 30 3 32 33 3 35 36 37 38 39 0 2 3 5 6 7 8 9 50 5 52 53 5 55 56 57 58 59 60 6 62 63 6 65 66 67 68 69 70 Only divisible
Prime Numbers Square Numbers 2 3 5 6 7 8 9 0 3 5 6 7 8 9 20 2 22 23 2 25 26 27 28 29 30 3 32 33 3 35 36 37 38 39 0 2 3 5 6 7 8 9 50 5 52 53 5 55 56 57 58 59 60 6 62 63 6 65 66 67 68 69 70 Only divisible
Advanced Methods to Identify Asphalt Pavement Delamination (R06D) Minnesota DOT Evaluation: Calibration and Signal Analysis
 Minnesota DOT Evaluation: Calibration and Signal Analysis") Advanced Methods to Identify Asphalt Pavement Delamination (R06D) Minnesota DOT Evaluation: Calibration and Signal Analysis Ken Maser, Infrasense Shongtao Dai, Research Operations Engineer Kyle Hoegh,
Advanced Methods to Identify Asphalt Pavement Delamination (R06D) Minnesota DOT Evaluation: Calibration and Signal Analysis Ken Maser, Infrasense Shongtao Dai, Research Operations Engineer Kyle Hoegh,
Dowel Bar Alignment and Location for Placement by Mechanical Dowel Bar Insertion
 Dowel Bar Alignment and Location for Placement by Mechanical Dowel Bar Insertion January 7, 2013 Scope, Background and Applicability This guide specification is directly applicable to 18 in. (457 mm) long,
Long-term Memory Review CRT PRACTICE 6 th Grade: MONDAY REVIEW STATE STANDARDS AND 3.6.2
 CRT PRACTICE 6 th Grade: MONDAY REVIEW 1) Convert: 240 mg to g 2) Name a metric unit that measures capacity. 3) Explain how one would convert feet to inches. 4) Complete this table:.004 4 1 10,000 5) Joe
Portable retroreflectometers and structured pavement markings
 TECHNICAL NOTE RS104 Portable retroreflectometers and structured pavement markings Introduction This paper addresses the question: "can portable retroreflectometers be used to measure the retroreflection
4 rows of 6 4 x 6 = rows of 4 6 x 4 = 24
 Arrays 8/8/16 Array a rectangular arrangement of equal rows 4 4 rows of 6 4 x 6 = 24 6 6 6 rows of 4 6 x 4 = 24 4 Dimension the number of rows and columns in an array Multiplication the operation of repeated
DOT-VNTSC-FAA Edward J. Rickley Joyce E. Rosenbaum Gregg G. Fleming Christopher J. Roof Eric R. Boeker
 DOT-VNTSC-FAA-12-14 DEVELOPMENT OF SIMPLIFIED PROCEDURE FOR COMPUTING THE ABSORPTION OF SOUND BY THE ATMOSPHERE AND APPLICABILITY TO AIRCRAFT NOISE CERTIFICATION: PROPOSED SAE METHOD Edward J. Rickley
Certificate of Accreditation
 PERRY JOHNSON LABORATORY ACCREDITATION, INC. Certificate of Accreditation has assessed the Laboratory of: Rays Precision Calibration, Inc 881-3 Nandino Blvd., Lexington, KY 40511 (Hereinafter called the
GEOMETRIC REPRESENTATIONS AND TRANSFORMATIONS MTH Scored Activity 1. Date sent:... Student's identification. Name:...
 GEOMETRIC REPRESENTATIONS AND TRANSFORMATIONS MTH-2102-3 Scored Activity 1 Date sent:... Student's identification Name:... Address:...... Tel. No.:... Email:... Mark:... /100 September 2012 1930-07 MTH-2102-3
Problems with TNM 3.0
 Problems with TNM 3.0 from the viewpoint of SoundPLAN International LLC TNM 2.5 TNM 2.5 had some restrictions that hopefully are lifted in the up-coming version of TNM 3.0. TNM 2.5 for example did not
TECHNICAL REPORT STANDARD TITLE PAGE TX September Performing Organization Code
 1. Report No. 2. Government Accession No. TX-92-1923-1 4. Title and Subtitle Influence of Asphalt Layering and Surface Treatments on Asphalt and Base Layer Thickness Computations Using Radar 7. Author(s)
Pavemetrics. LCMS - 3D road scanning and texture. PAVEMETRICS Systems Inc. 150 Boulevard René-Lévesque Est, Suite 1820 Québec, Québec, CANADA G1R 5B1
 LCMS - 3D road scanning and texture Pavemetrics Vision Technology for Inspection of Transportation Infrastructures PAVEMETRICS Systems Inc. 150 Boulevard René-Lévesque Est, Suite 1820 Québec, Québec, CANADA
Roadside Range Sensors for Intersection Decision Support
 Roadside Range Sensors for Intersection Decision Support Arvind Menon, Alec Gorjestani, Craig Shankwitz and Max Donath, Member, IEEE Abstract The Intelligent Transportation Institute at the University
Developments in Electromagnetic Inspection Methods II
 6th International Conference on NDE in Relation to Structural Integrity for Nuclear and Pressurized Components October 2007, Budapest, Hungary For more papers of this publication click: www.ndt.net/search/docs.php3?mainsource=70
TECHNICAL INFORMATION Traffic Template Catalog No. TT1
 Copyright 2016 by SIRCHIE All Rights Reserved. TECHNICAL INFORMATION Traffic Template Catalog No. TT1 INTRODUCTION Your SIRCHIE Traffic Template is a versatile police tool designed to make even the most
Measurement. & Calculations. Chapter Scientific Notation. Quantitative observation. Comparison based on an accepted scale e.g.
 Measurements & Calculations Chapter 2 All rights reserved 1 Measurement Quantitative observation Comparison based on an accepted scale e.g. Meter stick 2 Parts Number & Unit Number is a comparison Units
GE AMX 4+ Portable X-Ray
 GE AMX 4+ Portable X-Ray Typical Manufacturer s Picture GE Healthcare s AMX-4+ analog X-ray system provides high-performance in a compact, easy-to-maneuver package. The rotating arm and tube simplify positioning
DYNAMIC CHARACTERISTICS OF A BRIDGE ESTIMATED WITH NEW BOLT-TYPE SENSOR, AMBIENT VIBRATION MEASUREMENTS AND FINITE ELEMENT ANALYSIS
 C. Cuadra, et al., Int. J. of Safety and Security Eng., Vol. 6, No. 1 (2016) 40 52 DYNAMIC CHARACTERISTICS OF A BRIDGE ESTIMATED WITH NEW BOLT-TYPE SENSOR, AMBIENT VIBRATION MEASUREMENTS AND FINITE ELEMENT
Fastener Hole Crack Detection Using Adjustable Slide Probes
 Fastener Hole Crack Detection Using Adjustable Slide Probes General The guidelines for the adjustable sliding probes are similar to the fixed types, therefore much of the information that is given here
Re: Citywide Sign Regulations; CEQA Compliance (Council File ) Dear Chairman Huizar, Vice Chair Harris-Dawson, and Honorable Councilmembers:
 Dear Chairman Huizar, Vice Chair Harris-Dawson, and Honorable Councilmembers:") 355 South Grand Avenue, Suite 100 Los Angeles, California 90071-1560 Tel: +1.213.485.1234 Fax: +1.213.891.8763 www.lw.com May 22, 2018 VIA FEDEX & EMAIL Planning and Land Use Management Committee City
355 South Grand Avenue, Suite 100 Los Angeles, California 90071-1560 Tel: +1.213.485.1234 Fax: +1.213.891.8763 www.lw.com May 22, 2018 VIA FEDEX & EMAIL Planning and Land Use Management Committee City
Learning and Using Models of Kicking Motions for Legged Robots
 Learning and Using Models of Kicking Motions for Legged Robots Sonia Chernova and Manuela Veloso Computer Science Department Carnegie Mellon University Pittsburgh, PA 15213 {soniac, mmv}@cs.cmu.edu Abstract
20. Security Classif. (of this page) Unclassified
 Unclassified") 1. Report No. FHWA/TX-05/7-4975-1 Technical Report Documentation Page 2. Government 3. Recipient s Catalog No. Accession No. 4. Title and Subtitle Development of an Automatic Pavement Surface Distress
1. Report No. FHWA/TX-05/7-4975-1 Technical Report Documentation Page 2. Government 3. Recipient s Catalog No. Accession No. 4. Title and Subtitle Development of an Automatic Pavement Surface Distress
PUBLICATION 213. Think Safety First
 PUBLICATION 213 (67 PA CODE, CHAPTER 212) Think Safety First Pub 213 (02-08) Appendix Appendix A - Temporary/Portable
To Develop a Quality Control/Quality Assurance Plan For Hot Mix Asphalt. AASHTO PP qq
 1. Introduction Proposed Standard Practice To Develop a Quality Control/Quality Assurance Plan For Hot Mix Asphalt AASHTO PP qq 1.1. This standard practice presents specific details necessary to effectively
Unit 02 PC Form A. 1. Use pencil and paper to answer the question. Write the digit in each place of the number below. 2,921,365,254,860.
 1. Use pencil and paper to answer the question. Write the digit in each place of the number below. 2,921,365,254,860.1922 a. ten billions b. ten millions c. millions d. hundred millions e. hundreds f.
Exercise 1-3. Radar Antennas EXERCISE OBJECTIVE DISCUSSION OUTLINE DISCUSSION OF FUNDAMENTALS. Antenna types
 Exercise 1-3 Radar Antennas EXERCISE OBJECTIVE When you have completed this exercise, you will be familiar with the role of the antenna in a radar system. You will also be familiar with the intrinsic characteristics
Fresnel Lens Characterization for Potential Use in an Unpiloted Atmospheric Vehicle DIAL Receiver System
 NASA/TM-1998-207665 Fresnel Lens Characterization for Potential Use in an Unpiloted Atmospheric Vehicle DIAL Receiver System Shlomo Fastig SAIC, Hampton, Virginia Russell J. DeYoung Langley Research Center,
Certificate of Accreditation
 PERRY JOHNSON LABORATORY ACCREDITATION, INC. Certificate of Accreditation Perry Johnson Laboratory Accreditation, Inc. has assessed the Laboratory of: (Hereinafter called the Organization) and hereby declares
Willie D. Caraway III Randy R. McElroy
 TECHNICAL REPORT RD-MG-01-37 AN ANALYSIS OF MULTI-ROLE SURVIVABLE RADAR TRACKING PERFORMANCE USING THE KTP-2 GROUP S REAL TRACK METRICS Willie D. Caraway III Randy R. McElroy Missile Guidance Directorate
State Road A1A North Bridge over ICWW Bridge
 Final Report State Road A1A North Bridge over ICWW Bridge Draft Design Traffic Technical Memorandum Contract Number: C-9H13 TWO 5 - Financial Project ID 249911-2-22-01 March 2016 Prepared for: Florida
Jointing Rural Intersections
 Design Manual Chapter 5 - Roadway Design 5G - PCC Pavement Joints 5G-4 Jointing Rural Intersections This section describes how to joint rural intersections by following the guidelines outlined in Iowa
ENVI.2030L Topographic Maps and Profiles
 Name ENVI.2030L Topographic Maps and Profiles I. Introduction A map is a miniature representation of a portion of the earth's surface as it appears from above. The environmental scientist uses maps as
IMPACT OF MODERN HEADLAMPS ON THE DESIGN OF SAG VERTICAL CURVES. A Thesis Proposal by Madhuri Gogula
 IMPACT OF MODERN HEADLAMPS ON THE DESIGN OF SAG VERTICAL CURVES A Thesis Proposal by Madhuri Gogula Submitted to the Office of Graduate Studies of Texas A&M University in partial fulfillment of the requirements
CRITICAL PROFILER ACCURACY REQUIREMENTS STEVEN M. KARAMIHAS
 UMTRI-005-4 SEPTEMBER 005 CRITICAL PROFILER ACCURACY REQUIREMENTS STEVEN M. KARAMIHAS 1. Report No.. Government Accession No. 3. Recipient's Catalog No. UMTRI-005-4 Technical Report Documentation Page
Step 1 Calculate the square feet of roadway covered with tack 1,000 ft. x 12 ft. = 12,000 square feet
 Tack Rate Problem # CRS-2 Tack (Specific Gravity=.00) was applied to the roadway. The temperature measured from the tack distributor was 25 F. The length of the application was 000 feet. The width of the
Further Comparison of Traffic Noise Predictions Using the CadnaA and SoundPLAN Noise Prediction Models
 Proceedings of 20 th International Congress on Acoustics, ICA 2010 23-27 August 2010, Sydney, Australia Further Comparison of Traffic Noise Predictions Using the CadnaA and SoundPLAN Noise Prediction Models
Sea Surface Backscatter Distortions of Scanning Radar Altimeter Ocean Wave Measurements
 Sea Surface Backscatter Distortions of Scanning Radar Altimeter Ocean Wave Measurements Edward J. Walsh and C. Wayne Wright NASA Goddard Space Flight Center Wallops Flight Facility Wallops Island, VA 23337
Introduction to Measurement Systems
 MFE 3004 Mechatronics I Measurement Systems Dr Conrad Pace Page 4.1 Introduction to Measurement Systems Role of Measurement Systems Detection receive an external stimulus (ex. Displacement) Selection measurement