Analysis of Trace Impurities in Semiconductor Gas via Cavity-Enhanced Direct Frequency Comb Spectroscopy
|
|
|
- Brianna Craig
- 5 years ago
- Views:
Transcription
1 Analysis of Trace Impurities in Semiconductor Gas via Cavity-Enhanced Direct Frequency Comb Spectroscopy K.C. Cossel 1*, F. Adler 1, K.A. Bertness 2, M.J. Thorpe 1, J. Feng 3, M.W. Raynor 3, J. Ye 1 1 JILA, National Institute of Standards and Technology and University of Colorado Department of Physics, University of Colorado, Boulder, Colorado , USA 2 National Institute of Standards and Technology, Boulder, Colorado , USA 3 Matheson Tri-Gas, Longmont, Colorado 80501, USA *kevin.cossel@colorado.edu Cavity-enhanced direct frequency comb spectroscopy (CE-DFCS) has demonstrated powerful potential for trace gas detection based on its unique combination of high bandwidth, rapid data acquisition, high sensitivity, and high resolution, which is unavailable with conventional systems. However, previous demonstrations have been limited to proof-of-principle experiments or studies of fundamental laboratory science. Here we present the development of CE-DFCS towards an industrial application measuring impurities in arsine, an important process gas used in III-V semiconductor compound manufacturing. A strongly absorbing background gas with an extremely complex, congested, and broadband spectrum renders trace detection exceptionally difficult, but the capabilities of CE-DFCS overcome this challenge and make it possible to identify and quantify multiple spectral lines associated with water impurities. Further, frequency combs allow easy access to new spectral regions via efficient nonlinear optical processes. Here, we demonstrate detection of multiple potential impurities across µm ( cm -1 ), with a single-channel detection sensitivity of
2 4 x 10⁻⁸ cm -1 Hz -1/2 in nitrogen and specifically, absorption sensitivity of 4 x 10⁻⁷ cm -1 Hz -1/2 for trace water doped in arsine. 1. Introduction Arsine (AsH 3 ) and phosphine (PH 3 ) are important process gases used in the production of III-V semiconductors via metal organic chemical vapor deposition (MOCVD) [1-4]. These compounds are used in devices ranging from high-brightness light emitting diodes and high power laser diodes to solar cells. Trace levels of contaminants present in the process gases can result in unintentional doping and lattice defects. The inclusion of these dopants gives rise to additional energy levels in the bandgap of the host semiconductor, leading to undesired changes of its electrical and optical properties. In particular, oxygen incorporation in III-V semiconductors has been shown to form a deep recombination level, resulting in a decrease of photoluminescence efficiency and carrier lifetimes as well as reduced device reliability. A primary source of oxygen impurities is the presence of traces of water vapor in the precursor gases, which has been shown to negatively impact the semiconductor at the level of parts per billion (ppb) [4]. Because of its ubiquity and low vapor pressure, water is extremely difficult for the manufacturer to completely remove. Furthermore, water impurities can be introduced from contamination in the transfer lines at the point of use; therefore, on-line monitoring of water concentrations during semiconductor growth is desirable. In addition to water vapor, many other impurities including carbon dioxide, hydrocarbons (methane and ethane), hydrogen sulfide, silane and germane must be controlled in the process gas [2].
3 Current systems, employing different techniques, capable of detecting water at the sub- 100-ppb level all have significant drawbacks [2]. For example, Fourier transform infrared (FTIR) [5] spectrometers require long acquisition times owing to the low spectral brightness of their thermal light source. In addition, the required sensitivity can only be achieved by using a highly optimized research system with a long pathlength gas cell, a high sensitivity detector, and an ultrahigh purity nitrogen purge system. Another potential technique is negative ionatmospheric pressure ionization mass spectrometry (APIMS) [6], but these expensive systems are large and complex, not suitable for on-line monitoring and are mainly limited to inert background gases. Current research has focused on laser-based spectroscopy systems such as tunable diode laser spectroscopy (TDLAS) or cavity ring-down spectroscopy (CRDS) [1, 3, 7], which provide highly sensitive measurements with rapid acquisition times; however, these systems typically target one or two absorption lines of the desired impurity species. Thus, multiple contaminants cannot be easily identified and quantified, while unexpected impurities can significantly degrade the reliability of the measurement. In a recent study [4], it was necessary to use gas chromatography with mass spectrometry, atomic emission spectroscopy, and pulsed discharge ionization detection in addition to CRDS, to check for all of the critical impurities in arsine. Cavity-enhanced direct frequency comb spectroscopy (CE-DFCS) [8, 9] provides both high sensitivity and broad bandwidth, which enabled multi-species trace detection in breath near 1.5 µm [10]. Previous cw-crds experiments measuring water in phosphine at 940 nm [7] and 1400 nm [3] were limited by competing background gas absorption and by the line strength of the water transition. The µm ( cm -1 ) region contains bands of several important impurities, including a water band at 1.85 µm (5400
4 cm -1 ) that is stronger than the 1400 nm band by a factor of 2-3, and should be a somewhat transparent region of the arsine absorption spectrum [11]. Therefore, it is a compelling range to explore with CE-DFCS. CE-DFCS is a recently developed spectroscopic technique that potentially overcomes the difficulty of slow speed with continuous-wave (cw) laser based spectroscopy [9, 10], while maintaining the high-resolution capability. In addition to high detection sensitivity obtained from the use of an optical enhancement cavity (as in CRDS), CE-DFCS has broad bandwidth available from the femtosecond optical frequency comb. Furthermore, the use of ultrashort pulses enables highly efficient nonlinear frequency conversion, further increasing the possible bandwidth and providing easy access to spectral regions that are difficult to access with conventional methods. We use this latter advantage in this paper, demonstrating for the first time direct frequency comb spectroscopy in a region accessed by supercontinuum generation in this case, µm ( cm -1 ). This spectral region is mostly unexplored via laserbased spectroscopy owing to the lack of widely tunable lasers operating here. In fact, DFB diode lasers have only recently become available in this spectral region [12], but still with limited tuning range. Two possible broadly tunable sources are optical parametric oscillators [13] or difference frequency generation [14]; however, these cw systems must be carefully scanned to cover the full spectral region. Our CE-DFCS approach provides high sensitivities across more than 2000 detection channels distributed over a broad, simultaneous bandwidth in a robust and compact system. Furthermore, we have performed CE-DFCS for the first time with focus on an industrial application (i.e., trace detection in a strongly absorbing process gas), where the
5 bandwidth is critical for distinguishing impurity signals from background absorption, along with high resolution for making unambiguous identifications. 2. Experimental Details 2.1 Frequency Comb Source We used a home-built mode-locked Erbium-doped fiber ring laser [15] that provides 130 mw average power at a repetition rate of approximately 250 MHz. The laser output was then amplified with a single mode Er:fiber amplifier to produce 81-fs pulses with 400 mw average power. These parameters are readily achievable with commercially available fiber lasers as well. After the amplifier and polarization control optics, all of the light was coupled into 10 cm of standard single mode fiber spliced to a 6 cm long piece of highly non-linear silica fiber (OFS Specialty Photonics) to provide spectral broadening. The spectrum (covering µm or cm -1 ) from this fiber is shown in Fig. 1 as optimized for generation of a frequency comb near 1.85 µm; however, it is easy to change the spectrum by varying polarization and input pulse chirp. The average power after a 40-nm bandwidth filter centered at 1.86 µm was 17 mw. Because the laser and nonlinear spectrum generation were both fiber-based, this entire system was compact and robust requiring almost no adjustment from day to day. 2.2 Optical Cavity and Sample Cell The optical resonator used for enhancing the absorption detection was a linear Fabry- Pérot cavity with one 2-m radius concave mirror and one flat mirror and a peak finesse of 30,000 (mirror reflectivity ). In order to obtain accurate absorption values, we characterized the mirror reflectivity via wavelength resolved ringdown measurements. For this
6 we recorded ringdown traces of an empty (under vacuum) cavity in 10 nm wavelength increments using a monochromator and a fast extended-ingaas photodiode. Several measurements for each wavelength were averaged, and the resulting data was fit with an 8 th order polynomial. The cavity length ( 60 cm) was adjusted so that the free spectral range was matched to the comb repetition rate. In addition, the comb-offset frequency (f 0 ) was adjusted via the fiber laser pump power to optimize the transmission of the comb through the enhancement cavity [9]. The useful spectral bandwidth of the cavity was about 200 nm (600 cm -1 ); however, owing to the varying free spectral range frequency due to cavity dispersion, it is not possible to simultaneously match all comb modes and cavity modes over this bandwidth. To overcome this limitation and to synchronize the cavity and comb during measurements, the comb modes were dithered (by changing the laser cavity length and therefore the repetition rate) using a triangle waveform with an amplitude of 150 khz at a frequency of 7.5 khz around the cavity modes, and slow feedback to the enhancement cavity length (via a piezo) was used to keep the time gap between the successive transmission peaks constant [9]. Since our integration time per individual record was around 150 ms, we integrated over multiple dither cycles. This dither process effectively allowed us to couple the comb to the cavity over the full spectral bandwidth of the mirrors. Furthermore, if the comb were locked to the cavity without dither, the transmitted intensity noise would be significantly increased due to FM-AM conversion from cavity vibrations and laser frequency jitter. Dithering the comb reduces this noise and also simplifies locking.
7 The sample gases flowed through the optical buildup cavity for detection. To measure and quantify impurities in arsine, our gas handling system was designed to add trace contaminants to arsine at well-controlled mixing ratios. For this purpose we obtained a calibrated mixture of 10 parts per million (ppm) each of CO 2, CH 4, and H 2 S in a nitrogen gas cylinder. In addition, we added small amounts of water vapor via a diffusion vial. Typically, the total pressure in the sample cell was 200 torr. The gas system was designed to be very flexible for this experiment; however, it was not optimized for switching speed due to the small diameter of the installed tubing. 2.3 Virtually Imaged Phase Array (VIPA) Spectrometer The light transmitted from the cavity was analyzed with a two-dimensional dispersive spectrometer based on a virtually imaged phased array (VIPA), a cross-dispersion grating, and a 2D camera [10, 16-18]. This spectrometer system provides high resolution (900 MHz or cm -1 ) in one dimension, while maintaining broad bandwidth ( 20 nm or 50 cm -1, limited by the size of the camera s imaging sensor) in the orthogonal dimension. Light was coupled into the VIPA etalon (51 GHz free spectral range) with a horizontal 6 cm focal length cylindrical lens. The etalon was tilted approximately 2 from vertical to provide a high dispersion in the vertical direction. A cross-dispersing grating was used to separate the mode orders in the horizontal direction. Finally, the light was imaged onto the 320x256-pixel InSb focal plane array camera with a 25 cm focal length lens, resulting in images as shown in Fig. 1. Each bright stripe corresponds to a mode order of the etalon resolved with the grating; 900 MHz (0.03 cm -1 ) resolution is obtained in the vertical direction due to the high dispersion of the VIPA, while the cross dispersion allows us to collect over 2000 spectral channels simultaneously. Images were
8 collected alternating between sample and reference gases, which provides a differential measurement of the change in transmitted power with and without absorber. Typically, we average 20 images (at 150 ms integration time per image) with sample gas; then switched to reference gas and averaged another 20 images. This sequence was repeated to average down to the desired sensitivity. 2.4 Spectral Recovery The two final sets of images, one with sample gas in the cavity and one with nitrogen reference gas, provided a measurement of I/I 0 for each detection channel, i.e., the fractional change in integrated power due to absorption in the cavity. This quantity is equivalent to measuring the fractional change in cavity ringdown time ( because the integrated intensity of an exponential decay is proportional to and then the ratio removes the proportionality constant. ( ) by using The quantity can be expressed as a function of standard absorption per centimeter / 0 ( ( ) 0 )/ 0 2L ( ) c(1 R 2 e 2 L ) ; 2L 0 c(1 R 2 ) where L is the cavity length (obtained by counting the laser repetition rate) and R is the single mirror reflectivity [19]. This can be solved for to give
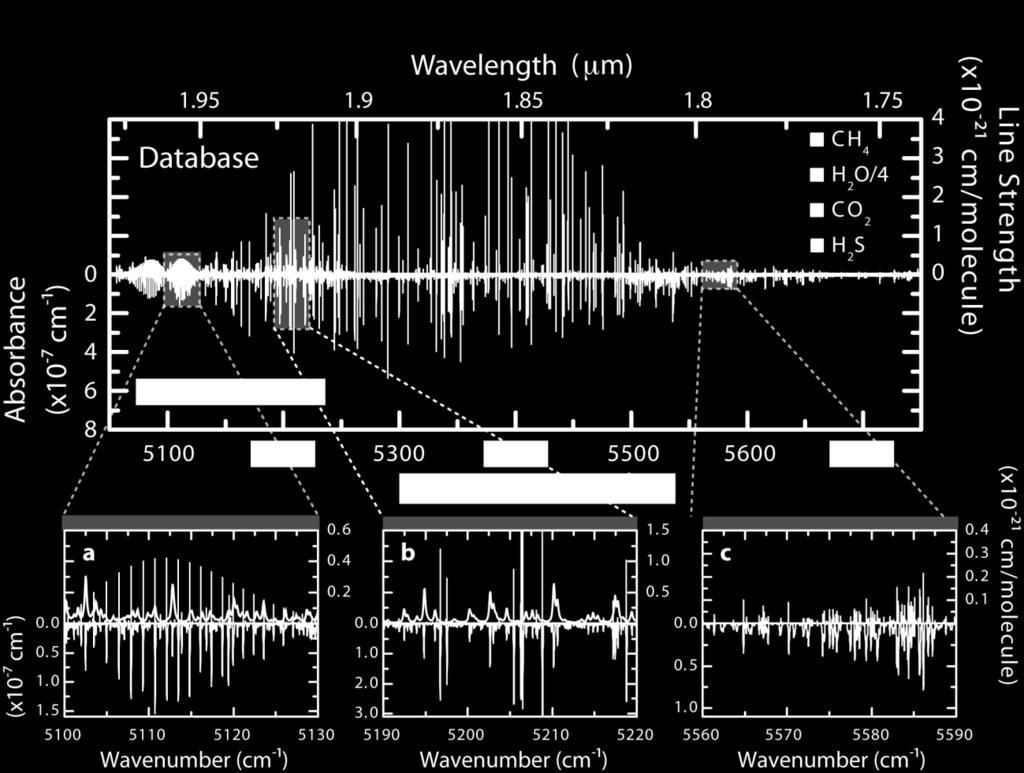
9 1 2L ln 1 R R 2 1 I I0, where I/I 0 has been substituted for This equation was used to evaluate the per channel absorption to give the final spectrum. The frequency axis was calibrated using known line positions from the HITRAN database [20]. 3. Results 3.1 Trace gasses in N 2 To calibrate our CE-DFCS system, we first recorded the spectrum of the impurity gas cylinder plus 2.5 ppm H 2 O in nitrogen. The measured absorption spectra are plotted below the axis as inverted peaks in black in Fig For comparison, known spectral lines from HITRAN [20] (for CO 2, H 2 O, and CH 4 ) and PNNL [11] (for H 2 S) are plotted above the axis. This overall spectrum is a composite of 11 individual spectra, spanning over 700 cm -1 (200 nm) spectral bandwidth with a step size of cm -1. The total acquisition time was approximately 10 hours; however, this was severely limited by the switching speed of the gas flow system. By using a gas handling system designed for rapid gas switching (large tube diameter, short lines, high flow rates, etc.) switching times could be significantly reduced, resulting in an estimated acquisition time of ~15 minutes per individual spectrum (~2.5 hours for the full bandwidth) to achieve the current sensitivity. In addition, a carefully designed system using two separate cavities (one for sample gas and one for reference gas) can reduce common-mode amplitude 1 A detailed spectrum is available at:
10 noise and would require no gas switching, thus improving sensitivity and further reducing the required acquisition time. The high resolution of the system can be observed clearly in Figs. 2a-c, where three separate regions of the spectrum are expanded, each with a 30-cm -1 span. Fig. 2a shows a reference FTIR spectrum (H 2 S, in purple, from PNNL [10]), reference line positions for CO 2 (green, from HITRAN), and a spectrum with 1.1 GHz (0.035 cm -1 ) resolution obtained with broadband CE-DFCS (black line). The current resolution is ideal for the 1-2 GHz wide Doppler and pressure broadened lines observed here. Since 5-10 comb modes sample each absorption feature, lineshape distortion is not an issue and single comb mode resolution is not required; however, if desired, resolutions of below 250 khz ( cm -1 ) are obtainable with modifications to resolve single comb lines [9]. In addition, Figs. 2a-c illustrate that the relative frequency accuracy of the spectrum is high; we estimate it to be better than 100 MHz ( cm -1 ) across the full 700 cm -1 spectral bandwidth by qualitatively comparing measured line positions with HITRAN [20]. Again, by resolving individual comb lines, absolute frequencies with sub-khz accuracies are possible. Indeed, CE-DFCS can be an effective and accurate tool for future additions and modifications to molecular absorption databases. Since we are able to observe many absorption lines for each species, the concentration and minimum detectable absorption may be determined with a modification of the Hubaux-Vos regression method [21], which is similar to methods used by the International Union of Pure and Applied Chemistry [22] and Semiconductor Equipment and Materials International [23], using a single measured spectrum at a fixed concentration. All of these methods use a
11 calibration curve of measured absorption versus sample concentration to determine the range of noise at zero concentration. Instead of measuring a single absorption feature as a function of sample concentration, we determine the measured absorption as a function of predicted absorption for lines with different strengths. This result allows us to determine both the noiseequivalent absorption and the concentration of the sample. In other words, one spectrum allows us to collect noise statistics over a wide range of signal strengths. To do this, we first predict the spectrum by approximating the concentration and using available HITRAN [20] data with modifications due to pressure broadening, Doppler broadening, spectrometer resolution, and digital filters. We then plot each observed peak height versus the predicted height of the corresponding peak, as shown in Fig. 3a for CO 2 and Fig. 3b for H 2 O (note that saturation was observed at higher absorptions, these points were not included in the analysis). The slope of a linear fit to this comparison data gives a correction factor from the approximated concentration to the true concentration and the uncertainty in the slope provides the uncertainty in the true concentration. In addition, the minimum detectable absorption is given by the 3 standard error of the intercept, which specifies the measured absorption value that can be considered a non-zero true absorption with 99.86% confidence. This is shown graphically in Fig. 3 by the value of the upper confidence interval when it intersects the y-axis. Since the confidence intervals shown are for the fit, it is not expected that all data should lie within them; the standard error of the fit is much smaller than the standard deviation of each data point due to the large number of points. The error on the intercept is roughly the same as the standard deviation for each data point.
12 For CO 2 in the nitrogen gas, we measure a concentration of 9.7 ± 0.2 ppm (3 uncertainty in slope of fit, consistent with the factory-specified impurity level in the cylinder at 10 ppm ± 10%. In addition, we obtain a minimum detectable absorption (3 of cm -1, corresponding to 325 ppb minimum detectable concentration by using the line strength of the strongest measured line. This data was recorded with a total integration time (T) of 180 s (time includes reference and sample images, but not gas switching times), which gives a 1-Hz minimum detectable absorption of cm -1 Hz -1/2. For boxcar style integration as we do here, the bandwidth is defined as 2/T, analogous to the bandwidth when calculating shot noise. Similarly for H 2 O, we measure 2.50 ± 0.12 ppm, with an absorption sensitivity of cm -1 or a minimum detectable concentration of 7 ppb. Since this absorption sensitivity is uniform across our measured spectral range, we project a minimum detectable concentration of 700 ppb for CH 4 and 370 ppb for H 2 S. We also note the advantage of a dramatically increased dynamic range (larger than the single concentration data in Fig. 3) obtained from simultaneously studying lines with significantly different strengths. Even though strong absorption peaks (above cm -1 ) provide signals that are saturated at the measured concentration, at lower concentrations they will be in a linear regime while the weak lines will be too small to measure. Additionally, lines that are too weak to measure at the current concentration will be detectable at higher concentrations. By using the range of water line strengths given in HITRAN [20] for this wavelength region, we estimate a measurement range for water concentration from 7 ppb to 100 ppm with this system.
13 3.2 Impurities in arsine After calibrating the system, we filled the high finesse optical cavity with arsine interspersed with impurities. The same mixture measured in nitrogen was added to a purified arsine gas in a ratio of 1:8. Figure 4 shows the composite spectrum of trace water recorded in the background of arsine gas at ~160 torr. 2 Again, measured absorption features are plotted as inverted peaks below the axis, with available HITRAN [20] spectral lines on water plotted above the axis. It is apparent that the absorption of arsine continues to increase rapidly towards both ends of the spectral window; past the plotted range, the arsine absorption begins to decrease at 1.94 µm, but even at 1.97 µm it was still too strong to collect reliable spectra of trace species. The density of the arsine absorption obscured the other impurity lines, making it only possible to observe water in this experiment. Because of the strongly absorbing background gas, it is clearly a major advantage to have a spectroscopy system based on CE-DFCS providing broad bandwidth and high spectral resolution. Such a system allows us to easily identify and quantify water lines that are isolated from arsine absorption features, as seen by the two zoomed-in bottom panels of Fig. 4. From this data (see Fig. 3c) we determine a water concentration of 1.27 ± 0.08 ppm and an absorption sensitivity of cm -1 with an integration time of 600 s, which corresponds to a minimum detectable concentration for water in arsine of 31 ppb. 2 A detailed spectrum is available at:
14 4. Conclusions This first demonstration of CE-DFCS for impurity monitoring of industrial process gases has shown an absorption detection sensitivity (3 ) of cm -1 Hz -1/2 for water in arsine around 1.85 µm (5400 cm -1 ). The 200 nm bandwidth of our system also allowed us to look at absorption regions of other impurities (CH 4, CO 2, and H 2 S), which were obscured by densely spaced arsine absorption lines. However, the same system can be easily extended anywhere from µm ( cm -1 ) with additional mirrors or potentially with a single cavity using Brewster angle prisms [24] to cover additional impurity bands. For future real-time monitoring in industrial conditions acquisition times and detection sensitivities should be improved. As discussed previously, the current acquisition time was limited by the gas handling system and could be significantly reduced. A two-cavity system or the recently demonstrated two-comb multi-heterodyne technique [25-28] will further reduce intensity noise by decreasing the time between sample and reference spectra. Additionally, extending spectral coverage of combs into the mid-ir [29] provides a promising direction for improvement in detection sensitivity and searching for new transparency windows of industrial process gasses. Overall, the capabilities of comb spectroscopy for real-world applications provide a clear path towards further improvements and application-oriented developments for this technique. Acknowledgements We dedicate this paper to Dr. Jun Feng ( ), who initiated this collaborative project. We would like to thank R. Holzwarth and T. Wilken for helpful discussions. Funding was provided by AFOSR, DARPA, DTRA, Agilent, and NIST. K.C.C. acknowledges support from the NSF
15 Graduate Research Fellowship. F.A. is partially supported by the Alexander von Humboldt Foundation. References [1] S. K. Lehman, K. A. Bertness, J. T. Hodges, J. Cryst. Growth 250, (2003). [2] H. H. Funke, B. L. Grissom, C. E. McGrew, M. W. Raynor, Rev. Sci. Instrum. 74, 1-25 (2003). [3] H. H. Funke, M. W. Raynor, K. A. Bertness, Y. Chen, Appl. Spectrosc. 61, (2007). [4] J. Feng, R. Clement, M. Raynor, J. Cryst. Growth 310, (2008). [5] P. R. Griffiths, J. A. D. Haseth, Fourier Transform Infrared Spectroscopy (Wiley-Interscience, New Jersey, 2007). [6] K. Siefering, H. Berger & W. Whitlock, J. Vac. Sci. Technol. A 11, (1993). [7] S. Y. Lehman, K. A. Bertness & J. T. Hodges, J. Cryst. Growth 261, (2004). [8] M. J. Thorpe, K. D. Moll, R. J. Jones, B. Safdi, J. Ye, Science 311, (2006). [9] M. J. Thorpe, J. Ye, Appl. Phys. B: Lasers Opt. 91, (2008). [10] M. J. Thorpe, D. Balslev-Clausen, M. S. Kirchner, J. Ye, Opt. Express 16, (2008). [11] S. W. Sharpe, T. J. Johnson, R. L. Sams, P. M. Chu, G. C. Rhoderick, P. A. Johnson, Appl. Spectrosc. 58, (2004). [12] R. Wehr, S. Kassi, D. Romanini, L. Gianfrani, Appl. Phys. B: Lasers Opt. 92, (2008). [13] M. H. Dunn, M. Ebrahimzadeh, Science 286, (1999). [14] M. Hamilton, R. Peverall, G. Ritchie, L. Thornton, J. van Helden, Appl. Phys. B: Lasers Opt. 97, (2009). [15] L. E. Nelson, D. J. Jones, K. Tamura, H. A. Haus & E. P. Ippen, Appl. Phys. B: Lasers Opt. 65, (1997). [16] M. Shirasaki, Opt. Lett. 21, (1996). [17] S. Xiao, A. M. Weiner, Opt. Express 12, (2004). [18] S. A. Diddams, L. Hollberg, V. Mbele, Nature 445, (2007).
16 [19] C. C. Davis, Lasers and Electro-optics: Fundamentals and Engineering (Cambridge University Press, Cambridge, 1996). [20] L. S. Rothman, I. E. Gordon, A. Barbe, D. C. Benner, P. E. Bernath, M. Birk, V. Boudon, L. R. Brown, A. Campargue, J. P. Champion, K. Chance, L. H. Coudert, V. Dana, V. M. Devi, S. Fally, J. M. Flaud, R. R. Gamache, A. Goldman, D. Jacquemart, I. Kleiner, N. Lacome, W. J. Lafferty, J. Y. Mandin, S. T. Massie, S. N. Mikhailenko, C. E. Miller, N. Moazzen-Ahmadi, O. V. Naumenko, A. V. Nikitin, J. Orphal, V. I. Perevalov, A. Perrin, A. Predoi-Cross, C. P. Rinsland, M. Rotger, M. Simeckova, M. A. H. Smith, K. Sung, S. A. Tashkun, J. Tennyson, R. A. Toth, A. C. Vandaele, J. Vander Auwera, J. Quant. Spectrosc. Radiat. Transfer 110, (2009). [21] A. Hubaux, G. Vos, Anal. Chem. 42, (1970). [22] G. L. Long & J. D. Winefordner, Anal. Chem. 55, 712A-724A (1983). [23] SEMI Standard C , "Guider for Determination of Method Detection Limits," available from Semiconductor Equipment and Materials International, 3081 Zanker Road, San Jose, CA 95134, [24] K. K. Lehmann, P. S. Johnston, P. Rabinowitz, Appl. Opt. 48, (2009). [25] F. Keilmann, C. Gohle, R. Holzwarth, Opt. Lett. 29, (2004). [26] A. Schliesser, M. Brehm, F. Keilmann, D. W. van der Weide, Opt. Express 13, (2005). [27] I. Coddington, W. C. Swan, N. R. Newbury, Phys. Rev. Lett. 100, (2008). [28] B. Berhardt, A. Ozawa, P. Jacquet, M. Jacquey, Y. Kobayashi, T. Udem, R. Holzwarth, G. Guelachvili, T. W. Hänsch, N. Picqué, Nat. Photonics 4, (2010). [29] F. Adler, K. C. Cossel, M. J. Thorpe, I. Hartl, M. E. Fermann, J. Ye, Opt. Lett. 34, (2009).
17 Figure 1: Overview of experiment. A mode-locked Er:fiber laser is spectrally broadened using a highly non-linear fiber (HNLF) to provide comb light from µm, which is then coupled into a high-finesse Fabry-Pérot cavity (F 30,000). A small amount of the cavity transmission is used to match the laser repetition rate and the cavity free spectral range. The rest of the cavity transmission is dispersed using a 2D VIPA spectrometer and then imaged onto an InSb focal plane array. Raw images with either nitrogen (reference gas) or arsine (AsH3, or other sample gas) in the cavity are converted into a 2D absorption image (1 sample/reference) and then into a 1D spectrum. A single-shot spectrum as shown covers over 20 nm. Figure 2: Trace gases in nitrogen. The spectrum of 10 ppm methane (CH4), 10 ppm carbon dioxide (CO2), 10 ppm hydrogen sulfide (H2S), and 2.5 ppm water (H2O) in nitrogen gas. Measured absorption peaks are shown in black below the axis. For comparison, spectral lines for CH4, CO2, and H2O (line strength divided by 10) available from the HITRAN database as well as H2S lines from the PNNL database are plotted above the central axis. Expanded spectral windows a, b, and c illustrate high-resolution absorption spectra of CO 2 and H 2 S, H 2 O and H 2 S, and H 2 O and CH 4, respectively. Figure 3: Determination of absorption sensitivities. (color online) Double logarithmic plots of measured peak absorption versus predicted peak absorption from the HITRAN database for 10 ppm CO 2 in N 2 (a), 2.5 ppm H 2 O in N 2 (b), and 1 ppm H 2 O in arsine (c). Linear fits (dashed) of the data sets were performed up to a measured absorption of 2x10⁻⁷, where signal saturation
18 becomes noticeable. The corresponding 3 (99.87%) confidence intervals (solid lines) are plotted along with the linear fits. Note that these confidence intervals are for the fits to the entire data. The 3 error on the intercept gives the minimum detectable absorption, the slope of the fit gives a correction factor for the concentration, and the error on the slope gives the uncertainty in the concentration. Figure 4: Trace water in arsine. The measured spectrum of 1.27 ppm of water vapor in arsine gas is plotted in black below the axis and the HITRAN reference lines for water are shown in blue above the axis. The arsine absorption continues to increase both above 5650 cm -1 and below 5350 cm -1, precluding any additional measurements. The two insets show easily resolvable water lines even in a background absorbing gas.


19 Figure 1

20 Figure 2


21 Figure 3


22 Figure 4
Optical phase-coherent link between an optical atomic clock. and 1550 nm mode-locked lasers
 Optical phase-coherent link between an optical atomic clock and 1550 nm mode-locked lasers Kevin W. Holman, David J. Jones, Steven T. Cundiff, and Jun Ye* JILA, National Institute of Standards and Technology
Optical frequency comb spectroscopy
 PAPER www.rsc.org/faraday_d Faraday Discussions Optical frequency comb spectroscopy A. Foltynowicz,* P. Mas1owski, T. Ban, F. Adler, K. C. Cossel, T. C. Briles and J. Ye* Received 11th January 2011, Accepted
Efficient Er:YAG lasers at nm, resonantly pumped with narrow bandwidth diode laser modules at 1532 nm, for methane detection
 Efficient Er:YAG lasers at 1645.55 nm, resonantly pumped with narrow bandwidth diode laser modules at 1532 nm, for methane detection H. Fritsche* a, O. Lux a, C. Schuett a, S. Heinemann b, W. Gries b,
A continuous-wave optical parametric oscillator for mid infrared photoacoustic trace gas detection
 A continuous-wave optical parametric oscillator for mid infrared photoacoustic trace gas detection Frank Müller, Alexander Popp, Frank Kühnemann Institute of Applied Physics, University of Bonn, Wegelerstr.8,
High resolution cavity-enhanced absorption spectroscopy with a mode comb.
 CRDS User meeting Cork University, sept-2006 High resolution cavity-enhanced absorption spectroscopy with a mode comb. T. Gherman, S. Kassi, J. C. Vial, N. Sadeghi, D. Romanini Laboratoire de Spectrométrie
R. J. Jones Optical Sciences OPTI 511L Fall 2017
 R. J. Jones Optical Sciences OPTI 511L Fall 2017 Semiconductor Lasers (2 weeks) Semiconductor (diode) lasers are by far the most widely used lasers today. Their small size and properties of the light output
Quantum-noise-limited optical frequency comb spectroscopy
 Quantum-noise-limited optical frequency comb spectroscopy Aleksandra Foltynowicz *, Ticijana Ban, Piotr Masłowski, Florian Adler and Jun Ye JILA, National Institute of Standards and Technology and University
Doppler-Free Spetroscopy of Rubidium
 Doppler-Free Spetroscopy of Rubidium Pranjal Vachaspati, Sabrina Pasterski MIT Department of Physics (Dated: April 17, 2013) We present a technique for spectroscopy of rubidium that eliminates doppler
MASSACHUSETTS INSTITUTE OF TECHNOLOGY Department of Electrical Engineering and Computer Science
 Student Name Date MASSACHUSETTS INSTITUTE OF TECHNOLOGY Department of Electrical Engineering and Computer Science 6.161 Modern Optics Project Laboratory Laboratory Exercise No. 6 Fall 2010 Solid-State
taccor Optional features Overview Turn-key GHz femtosecond laser
 taccor Turn-key GHz femtosecond laser Self-locking and maintaining Stable and robust True hands off turn-key system Wavelength tunable Integrated pump laser Overview The taccor is a unique turn-key femtosecond
B. Cavity-Enhanced Absorption Spectroscopy (CEAS)
") B. Cavity-Enhanced Absorption Spectroscopy (CEAS) CEAS is also known as ICOS (integrated cavity output spectroscopy). Developed in 1998 (Engeln et al.; O Keefe et al.) In cavity ringdown spectroscopy,
B. Cavity-Enhanced Absorption Spectroscopy (CEAS) CEAS is also known as ICOS (integrated cavity output spectroscopy). Developed in 1998 (Engeln et al.; O Keefe et al.) In cavity ringdown spectroscopy,
A Narrow-Band Tunable Diode Laser System with Grating Feedback
 A Narrow-Band Tunable Diode Laser System with Grating Feedback S.P. Spirydovich Draft Abstract The description of diode laser was presented. The tuning laser system was built and aligned. The free run
Ph 77 ADVANCED PHYSICS LABORATORY ATOMIC AND OPTICAL PHYSICS
 Ph 77 ADVANCED PHYSICS LABORATORY ATOMIC AND OPTICAL PHYSICS Diode Laser Characteristics I. BACKGROUND Beginning in the mid 1960 s, before the development of semiconductor diode lasers, physicists mostly
Vertical External Cavity Surface Emitting Laser
 Chapter 4 Optical-pumped Vertical External Cavity Surface Emitting Laser The booming laser techniques named VECSEL combine the flexibility of semiconductor band structure and advantages of solid-state
A new picosecond Laser pulse generation method.
 PULSE GATING : A new picosecond Laser pulse generation method. Picosecond lasers can be found in many fields of applications from research to industry. These lasers are very common in bio-photonics, non-linear
Individually ventilated cages microclimate monitoring using photoacoustic spectroscopy
 Individually ventilated cages microclimate monitoring using photoacoustic spectroscopy Jean-Philippe Besson*, Marcel Gyger**, Stéphane Schilt *, Luc Thévenaz *, * Nanophotonics and Metrology Laboratory
DIFFERENTIAL ABSORPTION LIDAR FOR GREENHOUSE GAS MEASUREMENTS
 DIFFERENTIAL ABSORPTION LIDAR FOR GREENHOUSE GAS MEASUREMENTS Stephen E. Maxwell, Sensor Science Division, PML Kevin O. Douglass, David F. Plusquellic, Radiation and Biomolecular Physics Division, PML
Pound-Drever-Hall Locking of a Chip External Cavity Laser to a High-Finesse Cavity Using Vescent Photonics Lasers & Locking Electronics
 of a Chip External Cavity Laser to a High-Finesse Cavity Using Vescent Photonics Lasers & Locking Electronics 1. Introduction A Pound-Drever-Hall (PDH) lock 1 of a laser was performed as a precursor to
Photonic Crystal Slot Waveguide Spectrometer for Detection of Methane
 Photonic Crystal Slot Waveguide Spectrometer for Detection of Methane Swapnajit Chakravarty 1, Wei-Cheng Lai 2, Xiaolong (Alan) Wang 1, Che-Yun Lin 2, Ray T. Chen 1,2 1 Omega Optics, 10306 Sausalito Drive,
Introduction to the operating principles of the HyperFine spectrometer
 Introduction to the operating principles of the HyperFine spectrometer LightMachinery Inc., 80 Colonnade Road North, Ottawa ON Canada A spectrometer is an optical instrument designed to split light into
Mid-infrared dual frequency comb spectroscopy based on fiber lasers for the detection of methane in ambient air
 Astro Ltd Laser Physics Letters Laser Phys. Lett. 12 (2015) 095701 (5pp) doi:10.1088/1612-2011/12/9/095701 Mid-infrared dual frequency comb spectroscopy based on fiber lasers for the detection of methane
arxiv: v1 [physics.optics] 11 Jun 2007
![arxiv: v1 [physics.optics] 11 Jun 2007](/thumbs/94/120820155.jpg "arxiv: v1 [physics.optics] 11 Jun 2007") Cavity Enhanced Optical Vernier Spectroscopy Broad Band, High Resolution, High Sensitivity Christoph Gohle, Björn Stein, Albert Schliesser, Thomas Udem, and Theodor W. Hänsch Max-Planck-Institut für Quantenoptik,
Cavity Enhanced Optical Vernier Spectroscopy Broad Band, High Resolution, High Sensitivity Christoph Gohle, Björn Stein, Albert Schliesser, Thomas Udem, and Theodor W. Hänsch Max-Planck-Institut für Quantenoptik,
Introduction Fundamentals of laser Types of lasers Semiconductor lasers
 ECE 5368 Introduction Fundamentals of laser Types of lasers Semiconductor lasers Introduction Fundamentals of laser Types of lasers Semiconductor lasers How many types of lasers? Many many depending on
Measurement of the group refractive index of air and glass
 Application Note METROLOGY Czech Metrology Institute (CMI), Prague Menlo Systems, Martinsried Measurement of the group refractive index of air and glass Authors: Petr Balling (CMI), Benjamin Sprenger (Menlo
Lecture 6 Fiber Optical Communication Lecture 6, Slide 1
 Lecture 6 Optical transmitters Photon processes in light matter interaction Lasers Lasing conditions The rate equations CW operation Modulation response Noise Light emitting diodes (LED) Power Modulation
Spectral phase shaping for high resolution CARS spectroscopy around 3000 cm 1
 Spectral phase shaping for high resolution CARS spectroscopy around 3 cm A.C.W. van Rhijn, S. Postma, J.P. Korterik, J.L. Herek, and H.L. Offerhaus Mesa + Research Institute for Nanotechnology, University
ECEN. Spectroscopy. Lab 8. copy. constituents HOMEWORK PR. Figure. 1. Layout of. of the
 ECEN 4606 Lab 8 Spectroscopy SUMMARY: ROBLEM 1: Pedrotti 3 12-10. In this lab, you will design, build and test an optical spectrum analyzer and use it for both absorption and emission spectroscopy. The
Testing with Femtosecond Pulses
 Testing with Femtosecond Pulses White Paper PN 200-0200-00 Revision 1.3 January 2009 Calmar Laser, Inc www.calmarlaser.com Overview Calmar s femtosecond laser sources are passively mode-locked fiber lasers.
Thermal management and thermal properties of high-brightness diode lasers
 Thermal management and thermal properties of high-brightness diode lasers Jens W. Tomm Max-Born-Institut für Nichtlineare Optik und Kurzzeitspektroskopie Berlin Max-Born-Str. 2 A, D-12489 Berlin, Germany
Fast Widely-Tunable CW Single Frequency 2-micron Laser
 Fast Widely-Tunable CW Single Frequency 2-micron Laser Charley P. Hale and Sammy W. Henderson Beyond Photonics LLC 1650 Coal Creek Avenue, Ste. B Lafayette, CO 80026 Presented at: 18 th Coherent Laser
Applications of Steady-state Multichannel Spectroscopy in the Visible and NIR Spectral Region
 Feature Article JY Division I nformation Optical Spectroscopy Applications of Steady-state Multichannel Spectroscopy in the Visible and NIR Spectral Region Raymond Pini, Salvatore Atzeni Abstract Multichannel
Optical generation of frequency stable mm-wave radiation using diode laser pumped Nd:YAG lasers
 Optical generation of frequency stable mm-wave radiation using diode laser pumped Nd:YAG lasers T. Day and R. A. Marsland New Focus Inc. 340 Pioneer Way Mountain View CA 94041 (415) 961-2108 R. L. Byer
Direct frequency comb saturation spectroscopy with an ultradense tooth spacing of 100 Hz D. A. Long, 1,* A. J. Fleisher, 1 and J. T.
 Direct frequency comb saturation spectroscopy with an ultradense tooth spacing of 100 Hz D. A. Long, 1,* A. J. Fleisher, 1 and J. T. Hodges 1 1 Material Measurement Laboratory, National Institute of Standards
It s Our Business to be EXACT
 671 LASER WAVELENGTH METER It s Our Business to be EXACT For laser applications such as high-resolution laser spectroscopy, photo-chemistry, cooling/trapping, and optical remote sensing, wavelength information
Chemistry 524--"Hour Exam"--Keiderling Mar. 19, pm SES
 Chemistry 524--"Hour Exam"--Keiderling Mar. 19, 2013 -- 2-4 pm -- 170 SES Please answer all questions in the answer book provided. Calculators, rulers, pens and pencils permitted. No open books allowed.
Quantum-Well Semiconductor Saturable Absorber Mirror
 Chapter 3 Quantum-Well Semiconductor Saturable Absorber Mirror The shallow modulation depth of quantum-dot saturable absorber is unfavorable to increasing pulse energy and peak power of Q-switched laser.
SUPPLEMENTARY INFORMATION
 SUPPLEMENTARY INFORMATION doi:10.1038/nature10864 1. Supplementary Methods The three QW samples on which data are reported in the Letter (15 nm) 19 and supplementary materials (18 and 22 nm) 23 were grown
High-frequency tuning of high-powered DFB MOPA system with diffraction limited power up to 1.5W
 High-frequency tuning of high-powered DFB MOPA system with diffraction limited power up to 1.5W Joachim Sacher, Richard Knispel, Sandra Stry Sacher Lasertechnik GmbH, Hannah Arendt Str. 3-7, D-3537 Marburg,
arxiv: v1 [physics.optics] 31 Mar 2008
![arxiv: v1 [physics.optics] 31 Mar 2008](/thumbs/85/92584350.jpg "arxiv: v1 [physics.optics] 31 Mar 2008") Cavity-enhanced direct frequency comb spectroscopy Michael J. Thorpe and Jun Ye JILA, National Institute of Standards and Technology and University of Colorado, Boulder, CO 80309-0440, USA arxiv:0803.4509v1
Cavity-enhanced direct frequency comb spectroscopy Michael J. Thorpe and Jun Ye JILA, National Institute of Standards and Technology and University of Colorado, Boulder, CO 80309-0440, USA arxiv:0803.4509v1
Fast Raman Spectral Imaging Using Chirped Femtosecond Lasers
 Fast Raman Spectral Imaging Using Chirped Femtosecond Lasers Dan Fu 1, Gary Holtom 1, Christian Freudiger 1, Xu Zhang 2, Xiaoliang Sunney Xie 1 1. Department of Chemistry and Chemical Biology, Harvard
DIODE LASER SPECTROSCOPY (160309)
") DIODE LASER SPECTROSCOPY (160309) Introduction The purpose of this laboratory exercise is to illustrate how we may investigate tiny energy splittings in an atomic system using laser spectroscopy. As an
DIODE LASER SPECTROSCOPY (160309) Introduction The purpose of this laboratory exercise is to illustrate how we may investigate tiny energy splittings in an atomic system using laser spectroscopy. As an
Nd: YAG Laser Energy Levels 4 level laser Optical transitions from Ground to many upper levels Strong absorber in the yellow range None radiative to
 Nd: YAG Lasers Dope Neodynmium (Nd) into material (~1%) Most common Yttrium Aluminum Garnet - YAG: Y 3 Al 5 O 12 Hard brittle but good heat flow for cooling Next common is Yttrium Lithium Fluoride: YLF
Diode Laser Systems In Gas Measurement
 Dr Roger Riley, Geotech Diode Laser Systems In Gas Measurement The application of laser diodes for improved biogas analysis Figure 2 Tuneable diode laser measurement technique Introduction The online analysis
Spider Pulse Characterization
 Spider Pulse Characterization Spectral and Temporal Characterization of Ultrashort Laser Pulses The Spider series by APE is an all-purpose and frequently used solution for complete characterization of
771 Series LASER SPECTRUM ANALYZER. The Power of Precision in Spectral Analysis. It's Our Business to be Exact! bristol-inst.com
 771 Series LASER SPECTRUM ANALYZER The Power of Precision in Spectral Analysis It's Our Business to be Exact! bristol-inst.com The 771 Series Laser Spectrum Analyzer combines proven Michelson interferometer
Elimination of Self-Pulsations in Dual-Clad, Ytterbium-Doped Fiber Lasers
 Elimination of Self-Pulsations in Dual-Clad, Ytterbium-Doped Fiber Lasers 1.0 Modulation depth 0.8 0.6 0.4 0.2 0.0 Laser 3 Laser 2 Laser 4 2 3 4 5 6 7 8 Absorbed pump power (W) Laser 1 W. Guan and J. R.
Luminous Equivalent of Radiation
 Intensity vs λ Luminous Equivalent of Radiation When the spectral power (p(λ) for GaP-ZnO diode has a peak at 0.69µm) is combined with the eye-sensitivity curve a peak response at 0.65µm is obtained with
The Theta Laser A Low Noise Chirped Pulse Laser. Dimitrios Mandridis
 CREOL Affiliates Day 2011 The Theta Laser A Low Noise Chirped Pulse Laser Dimitrios Mandridis dmandrid@creol.ucf.edu April 29, 2011 Objective: Frequency Swept (FM) Mode-locked Laser Develop a frequency
UNMATCHED OUTPUT POWER AND TUNING RANGE
 ARGOS MODEL 2400 SF SERIES TUNABLE SINGLE-FREQUENCY MID-INFRARED SPECTROSCOPIC SOURCE UNMATCHED OUTPUT POWER AND TUNING RANGE One of Lockheed Martin s innovative laser solutions, Argos TM Model 2400 is
3 General Principles of Operation of the S7500 Laser
 Application Note AN-2095 Controlling the S7500 CW Tunable Laser 1 Introduction This document explains the general principles of operation of Finisar s S7500 tunable laser. It provides a high-level description
Timing Noise Measurement of High-Repetition-Rate Optical Pulses
 564 Timing Noise Measurement of High-Repetition-Rate Optical Pulses Hidemi Tsuchida National Institute of Advanced Industrial Science and Technology 1-1-1 Umezono, Tsukuba, 305-8568 JAPAN Tel: 81-29-861-5342;
Doppler-free Fourier transform spectroscopy
 Doppler-free Fourier transform spectroscopy Samuel A. Meek, 1 Arthur Hipke, 1,2 Guy Guelachvili, 3 Theodor W. Hänsch 1,2 and Nathalie Picqué 1,2,3* 1. Max-Planck-Institut für Quantenoptik, Hans-Kopfermann-Straße
Thermoelectrically cooled quantum-cascade-laser-based sensor for the continuous monitoring of ambient atmospheric carbon monoxide
 Thermoelectrically cooled quantum-cascade-laser-based sensor for the continuous monitoring of ambient atmospheric carbon monoxide Anatoliy A. Kosterev, Frank K. Tittel, Rüdeger Köhler, Claire Gmachl, Federico
Ultrafast instrumentation (No Alignment!)
") Ultrafast instrumentation (No Alignment!) We offer products specialized in ultrafast metrology with strong expertise in the production and characterization of high energy ultrashort pulses. We provide
Ultrafast instrumentation (No Alignment!) We offer products specialized in ultrafast metrology with strong expertise in the production and characterization of high energy ultrashort pulses. We provide
Spectrometer using a tunable diode laser
 Spectrometer using a tunable diode laser Ricardo Vasquez Department of Physics, Purdue University, West Lafayette, IN April, 2000 In the following paper the construction of a simple spectrometer using
Lecture 21. Wind Lidar (3) Direct Detection Doppler Lidar
 Direct Detection Doppler Lidar") Lecture 21. Wind Lidar (3) Direct Detection Doppler Lidar Overview of Direct Detection Doppler Lidar (DDL) Resonance fluorescence DDL Fringe imaging DDL Scanning FPI DDL FPI edge-filter DDL Absorption
Lecture 21. Wind Lidar (3) Direct Detection Doppler Lidar Overview of Direct Detection Doppler Lidar (DDL) Resonance fluorescence DDL Fringe imaging DDL Scanning FPI DDL FPI edge-filter DDL Absorption
APPLICATION NOTE Frequency Comb Research Advances Using Tunable Diode Lasers
 APPLICATION NOTE Frequency Comb Research Advances Using Tunable Diode Lasers 59 Frequency Comb Research Advances Using Tunable Diode Lasers The discovery of the optical frequency comb and the breakthrough
arxiv: v1 [physics.optics] 27 Apr 2016
![arxiv: v1 [physics.optics] 27 Apr 2016](/thumbs/74/70939917.jpg "arxiv: v1 [physics.optics] 27 Apr 2016") Scanning micro-resonator direct-comb absolute spectroscopy Alessio Gambetta, 1 Marco Cassinerio, 2 Davide Gatti, 2 Paolo Laporta, 1,2 and Gianluca Galzerano 2,1, 1 Dipartimento di Fisica - Politecnico
Scanning micro-resonator direct-comb absolute spectroscopy Alessio Gambetta, 1 Marco Cassinerio, 2 Davide Gatti, 2 Paolo Laporta, 1,2 and Gianluca Galzerano 2,1, 1 Dipartimento di Fisica - Politecnico
Evaluation of high power laser diodes for space applications: effects of the gaseous environment
 Evaluation of high power laser diodes for space applications: effects of the gaseous environment Jorge Piris, E. M. Murphy, B. Sarti European Space Agency, Optoelectronics section, ESTEC. M. Levi, G. Klumel,
Trace-gas detection based on the temperature-tuning periodically poled MgO: LiNbO 3 optical parametric oscillator
 JOUNAL OF OPTOELECTONICS AND ADVANCED MATEIALS Vol. 8, No. 4, August 2006, p. 1438-14 42 Trace-gas detection based on the temperature-tuning periodically poled MgO: LiNbO 3 optical parametric oscillator
Thermo Scientific icap 7000 Plus Series ICP-OES: Innovative ICP-OES optical design
 TECHNICAL NOTE 43333 Thermo Scientific icap 7000 Plus Series ICP-OES: Innovative ICP-OES optical design Keywords Optical design, Polychromator, Spectrometer Key Benefits The Thermo Scientific icap 7000
Nonlinear Optics (WiSe 2015/16) Lecture 9: December 11, 2015
 Lecture 9: December 11, 2015") Nonlinear Optics (WiSe 2015/16) Lecture 9: December 11, 2015 Chapter 9: Optical Parametric Amplifiers and Oscillators 9.8 Noncollinear optical parametric amplifier (NOPA) 9.9 Optical parametric chirped-pulse
Nonlinear Optics (WiSe 2015/16) Lecture 9: December 11, 2015 Chapter 9: Optical Parametric Amplifiers and Oscillators 9.8 Noncollinear optical parametric amplifier (NOPA) 9.9 Optical parametric chirped-pulse
Characterization of an external cavity diode laser based ring cavity NICE-OHMS system
 Characterization of an external cavity diode laser based ring cavity NICE-OHMS system C.L. Bell, G. Hancock *, R. Peverall, G.A.D. Ritchie, J.H. van Helden, and N.J. van Leeuwen Department of Chemistry,
How to build an Er:fiber femtosecond laser
 How to build an Er:fiber femtosecond laser Daniele Brida 17.02.2016 Konstanz Ultrafast laser Time domain : pulse train Frequency domain: comb 3 26.03.2016 Frequency comb laser Time domain : pulse train
External-Cavity Tapered Semiconductor Ring Lasers
 External-Cavity Tapered Semiconductor Ring Lasers Frank Demaria Laser operation of a tapered semiconductor amplifier in a ring-oscillator configuration is presented. In first experiments, 1.75 W time-average
A transportable optical frequency comb based on a mode-locked fibre laser
 A transportable optical frequency comb based on a mode-locked fibre laser B. R. Walton, H. S. Margolis, V. Tsatourian and P. Gill National Physical Laboratory Joint meeting for Time and Frequency Club
Lecture 25. Wind Lidar (3) Direct Detection Doppler Lidar
 Direct Detection Doppler Lidar") Lecture 25. Wind Lidar (3) Direct Detection Doppler Lidar Overview of Direct Detection Doppler Lidar (DDL) Fringe imaging DDL Scanning FPI DDL FPI edge-filter DDL Iodine absorption-line edge-filter DDL
Lecture 25. Wind Lidar (3) Direct Detection Doppler Lidar Overview of Direct Detection Doppler Lidar (DDL) Fringe imaging DDL Scanning FPI DDL FPI edge-filter DDL Iodine absorption-line edge-filter DDL
Low loss silica hollow core fibers for 3 4µm spectral region
 Low loss silica hollow core fibers for 3 4µm spectral region Fei Yu, * William J. Wadsworth, and Jonathan C. Knight Centre for Photonics and Photonic Materials, Department of Physics, University of Bath,
Diamond Analysis. Innovation with Integrity. Reliable identification and type determination by FTIR spectroscopy FTIR
 Diamond Analysis Reliable identification and type determination by FTIR spectroscopy Innovation with Integrity FTIR FTIR Diamond Analysis Since the appearance of synthetic diamonds, nearly perfect imitates
Basic Components of Spectroscopic. Instrumentation
 Basic Components of Spectroscopic Ahmad Aqel Ifseisi Assistant Professor of Analytical Chemistry College of Science, Department of Chemistry King Saud University P.O. Box 2455 Riyadh 11451 Saudi Arabia
High Power and Energy Femtosecond Lasers
 High Power and Energy Femtosecond Lasers PHAROS is a single-unit integrated femtosecond laser system combining millijoule pulse energies and high average powers. PHAROS features a mechanical and optical
Cavity QED with quantum dots in semiconductor microcavities
 Cavity QED with quantum dots in semiconductor microcavities M. T. Rakher*, S. Strauf, Y. Choi, N.G. Stolz, K.J. Hennessey, H. Kim, A. Badolato, L.A. Coldren, E.L. Hu, P.M. Petroff, D. Bouwmeester University
Extremely simple device for measuring 1.5-µm ultrashort laser pulses
 Extremely simple device for measuring 1.5-µm ultrashort laser pulses Selcuk Akturk, Mark Kimmel, and Rick Trebino School of Physics, Georgia Institute of Technology, Atlanta, Georgia 30332-0430, USA akturk@socrates.physics.gatech.edu
Photonics and Optical Communication
 Photonics and Optical Communication (Course Number 300352) Spring 2007 Dr. Dietmar Knipp Assistant Professor of Electrical Engineering http://www.faculty.iu-bremen.de/dknipp/ 1 Photonics and Optical Communication
Powerful Single-Frequency Laser System based on a Cu-laser pumped Dye Laser
 Powerful Single-Frequency Laser System based on a Cu-laser pumped Dye Laser V.I.Baraulya, S.M.Kobtsev, S.V.Kukarin, V.B.Sorokin Novosibirsk State University Pirogova 2, Novosibirsk, 630090, Russia ABSTRACT
Wavelength Control and Locking with Sub-MHz Precision
 Wavelength Control and Locking with Sub-MHz Precision A PZT actuator on one of the resonator mirrors enables the Verdi output wavelength to be rapidly tuned over a range of several GHz or tightly locked
A Novel Multipass Optical System Oleg Matveev University of Florida, Department of Chemistry, Gainesville, Fl
 A Novel Multipass Optical System Oleg Matveev University of Florida, Department of Chemistry, Gainesville, Fl BACKGROUND Multipass optical systems (MOS) are broadly used in absorption, Raman, fluorescence,
Basic concepts. Optical Sources (b) Optical Sources (a) Requirements for light sources (b) Requirements for light sources (a)
 Optical Sources (a) Requirements for light sources (b) Requirements for light sources (a)") Optical Sources (a) Optical Sources (b) The main light sources used with fibre optic systems are: Light-emitting diodes (LEDs) Semiconductor lasers (diode lasers) Fibre laser and other compact solid-state
Optical Sources (a) Optical Sources (b) The main light sources used with fibre optic systems are: Light-emitting diodes (LEDs) Semiconductor lasers (diode lasers) Fibre laser and other compact solid-state
SUPPLEMENTARY INFORMATION
 Frequency-agile dual-comb spectroscopy Guy Millot 1, Stéphane Pitois 1, Ming Yan 2,3, Tatevik Hovannysyan 1, Abdelkrim Bendahmane 1, Theodor W. Hänsch 2,3, Nathalie Picqué 2,3,4,* 1. Laboratoire Interdisciplinaire
Analytical Spectroscopy Chemistry 620: Midterm Exam Key Date Assigned: April 15, Due April 22, 2010
 Analytical Spectroscopy Chemistry 620: Key Date Assigned: April 15, Due April 22, 2010 You have 1 week to complete this exam. You can earn up to 100 points on this exam, which consists of 4 questions.
A CW seeded femtosecond optical parametric amplifier
 Science in China Ser. G Physics, Mechanics & Astronomy 2004 Vol.47 No.6 767 772 767 A CW seeded femtosecond optical parametric amplifier ZHU Heyuan, XU Guang, WANG Tao, QIAN Liejia & FAN Dianyuan State
Ultrahigh precision synchronization of optical and microwave frequency sources
 Journal of Physics: Conference Series PAPER OPEN ACCESS Ultrahigh precision synchronization of optical and microwave frequency sources To cite this article: A Kalaydzhyan et al 2016 J. Phys.: Conf. Ser.
PERFORMANCE OF PHOTODIGM S DBR SEMICONDUCTOR LASERS FOR PICOSECOND AND NANOSECOND PULSING APPLICATIONS
 PERFORMANCE OF PHOTODIGM S DBR SEMICONDUCTOR LASERS FOR PICOSECOND AND NANOSECOND PULSING APPLICATIONS By Jason O Daniel, Ph.D. TABLE OF CONTENTS 1. Introduction...1 2. Pulse Measurements for Pulse Widths
Fiber Laser Chirped Pulse Amplifier
 Fiber Laser Chirped Pulse Amplifier White Paper PN 200-0200-00 Revision 1.2 January 2009 Calmar Laser, Inc www.calmarlaser.com Overview Fiber lasers offer advantages in maintaining stable operation over
GRENOUILLE.
 GRENOUILLE Measuring ultrashort laser pulses the shortest events ever created has always been a challenge. For many years, it was possible to create ultrashort pulses, but not to measure them. Techniques
Ring cavity tunable fiber laser with external transversely chirped Bragg grating
 Ring cavity tunable fiber laser with external transversely chirped Bragg grating A. Ryasnyanskiy, V. Smirnov, L. Glebova, O. Mokhun, E. Rotari, A. Glebov and L. Glebov 2 OptiGrate, 562 South Econ Circle,
Elements of Optical Networking
 Bruckner Elements of Optical Networking Basics and practice of optical data communication With 217 Figures, 13 Tables and 93 Exercises Translated by Patricia Joliet VIEWEG+ TEUBNER VII Content Preface
CO 2 Remote Detection Using a 2-µm DIAL Instrument
 CO 2 Remote Detection Using a 2-µm DIAL Instrument Erwan Cadiou 1,2, Dominique Mammez 1,2, Jean-Baptiste Dherbecourt 1,, Guillaume Gorju 1, Myriam Raybaut 1, Jean-Michel Melkonian 1, Antoine Godard 1,
Evaluation of Scientific Solutions Liquid Crystal Fabry-Perot Etalon
 Evaluation of Scientific Solutions Liquid Crystal Fabry-Perot Etalon Testing of the etalon was done using a frequency stabilized He-Ne laser. The beam from the laser was passed through a spatial filter
Optical Spectrum Analyzers
 Optical Spectrum Analyzers Broadband Spectrometer and Wavelength Meter in One Thorlabs Optical Spectrum Analyzers obtain highly accurate measurements of the spectra of unknown light sources. They are continuously
Improving the Collection Efficiency of Raman Scattering
 PERFORMANCE Unparalleled signal-to-noise ratio with diffraction-limited spectral and imaging resolution Deep-cooled CCD with excelon sensor technology Aberration-free optical design for uniform high resolution
Communication using Synchronization of Chaos in Semiconductor Lasers with optoelectronic feedback
 Communication using Synchronization of Chaos in Semiconductor Lasers with optoelectronic feedback S. Tang, L. Illing, J. M. Liu, H. D. I. barbanel and M. B. Kennel Department of Electrical Engineering,
레이저의주파수안정화방법및그응용 박상언 ( 한국표준과학연구원, 길이시간센터 )
") 레이저의주파수안정화방법및그응용 박상언 ( 한국표준과학연구원, 길이시간센터 ) Contents Frequency references Frequency locking methods Basic principle of loop filter Example of lock box circuits Quantifying frequency stability Applications
레이저의주파수안정화방법및그응용 박상언 ( 한국표준과학연구원, 길이시간센터 ) Contents Frequency references Frequency locking methods Basic principle of loop filter Example of lock box circuits Quantifying frequency stability Applications
SUPPLEMENTARY INFORMATION
 SUPPLEMENTARY INFORMATION Supplementary Information Real-space imaging of transient carrier dynamics by nanoscale pump-probe microscopy Yasuhiko Terada, Shoji Yoshida, Osamu Takeuchi, and Hidemi Shigekawa*
Study of Multiwavelength Fiber Laser in a Highly Nonlinear Fiber
 Study of Multiwavelength Fiber Laser in a Highly Nonlinear Fiber I. H. M. Nadzar 1 and N. A.Awang 1* 1 Faculty of Science, Technology and Human Development, Universiti Tun Hussein Onn Malaysia, Johor,
High power VCSEL array pumped Q-switched Nd:YAG lasers
 High power array pumped Q-switched Nd:YAG lasers Yihan Xiong, Robert Van Leeuwen, Laurence S. Watkins, Jean-Francois Seurin, Guoyang Xu, Alexander Miglo, Qing Wang, and Chuni Ghosh Princeton Optronics,
SA210-Series Scanning Fabry Perot Interferometer
 435 Route 206 P.O. Box 366 PH. 973-579-7227 Newton, NJ 07860-0366 FAX 973-300-3600 www.thorlabs.com technicalsupport@thorlabs.com SA210-Series Scanning Fabry Perot Interferometer DESCRIPTION: The SA210
CALIBRATION OF TERAHERTZ SPECTROMETERS
 CALIBRATION OF TERAHERTZ SPECTROMETERS Mira Naftaly and Richard A. Dudley National Physical Laboratory, Teddington TW LW, UK Corresponding author: mira.naftaly@npl.co.uk Abstract Calibration methods for
Miniature gas sensor for monitoring biological space environments
 Miniature gas sensor for monitoring biological space environments Joel A. Silver * and William R. Wood Southwest Sciences, Inc. ABSTRAT A versatile gas sensor for use in gravitational studies and/or long-term
Spectroscopy of Ruby Fluorescence Physics Advanced Physics Lab - Summer 2018 Don Heiman, Northeastern University, 1/12/2018
 1 Spectroscopy of Ruby Fluorescence Physics 3600 - Advanced Physics Lab - Summer 2018 Don Heiman, Northeastern University, 1/12/2018 I. INTRODUCTION The laser was invented in May 1960 by Theodor Maiman.