Millimeter Wave Solutions from R&S
|
|
|
- Deirdre Wright
- 6 years ago
- Views:
Transcription


1 Millimeter Wave Solutions from R&S

![85mm(m)] ZVA50 [2 & 4 ports, 1 or 2 sources, 2.4mm(m)] ZVA40 [2 & 4 ports, 2 or 4 sources,, 2.](/docs-images/80/80530736/images/2-2.jpg "92mm(m), or 2.4mm(m)] ZVA24 [2 & 4 ports, 2 or 4 sources, 3.")
![5mm(m)] ZVA8 [2 & 4 ports, N(f)] ZVT20 [2 to 6 ports, 1 to 3 sources, 3.](/docs-images/80/80530736/images/2-3.jpg "5mm(m)] ZVT8 [2 to 8 ports, 1 to 4 sources, N(f)] ZNB40 [2 ports, 3.")
![5mm(m)] ZNB20 [2 & 4 ports, 3.5mm(m)] ZNB8 [2 & 4 ports, N(f), 8.](/docs-images/80/80530736/images/2-4.jpg "5 GHz] ZNB4 [2 & 4 ports, N(f), 4.")
![5 GHz] Switch Matrix ZN-Z84 [6 to 24 ports, SMA(f)] ZNBT8 [4 to 24 ports, N(f)] ZNC3 [2 ports,](/docs-images/80/80530736/images/2-5.jpg "N(f)] Top Class Multiport & Production - General purpose - High end production - Muli-port 70")
2 R&S Portfolio Network Analyzers 100 khz (biast) 100 khz (biast) ZVA110. ZVA24/40/50/67, ZVT20 with External Converters ZV-Zxyz ZVA67 [2 & 4 ports, 2 or 4 sources, 1.85mm(m)] ZVA50 [2 & 4 ports, 1 or 2 sources, 2.4mm(m)] ZVA40 [2 & 4 ports, 2 or 4 sources,, 2.92mm(m), or 2.4mm(m)] ZVA24 [2 & 4 ports, 2 or 4 sources, 3.5mm(m)] ZVA8 [2 & 4 ports, N(f)] ZVT20 [2 to 6 ports, 1 to 3 sources, 3.5mm(m)] ZVT8 [2 to 8 ports, 1 to 4 sources, N(f)] ZNB40 [2 ports, 3.5mm(m)] ZNB20 [2 & 4 ports, 3.5mm(m)] ZNB8 [2 & 4 ports, N(f), 8.5 GHz] ZNB4 [2 & 4 ports, N(f), 4.5 GHz] Switch Matrix ZN-Z84 [6 to 24 ports, SMA(f)] ZNBT8 [4 to 24 ports, N(f)] ZNC3 [2 ports, N(f)] Top Class Multiport & Production - General purpose - High end production - Muli-port 70 GHz 5 khz ZND [2 ports (uni- or bidirectional)], 4.5/8.5 GHz ZVL13 [2 ports, N(f)] option Compact & Flexible ZVL6 [2 ports, N(f)] ZVL3 [2 ports, N(f)] ZVH4 [2 ports, N(f)] Handheld ZVH8 [2 ports, N(f)]
3 Rohde & Schwarz Converter ZVA-Z GHz to 110 GHz Reflectometer Module Block Diagram REF LNA +20dB Legend: Waveguide WR10 N = 8 Coaxial (PC3,5/SMA) Attenuator (manual) M = 6 TEST PORT x3 x2 RF LO N = 8 +10dB LNA +20dB MEAS


4 Rohde & Schwarz ZVA-Z110 Single T/R Reflectometer Module open View 1. Generator feed path with multiplier stages 2. Waveguide variable attenuation adjustment 3. Two harmonic mixers for the conversion of the measurement and reference channel to IF 4. Bi-directional coupler to separate the transmitted and reflected power

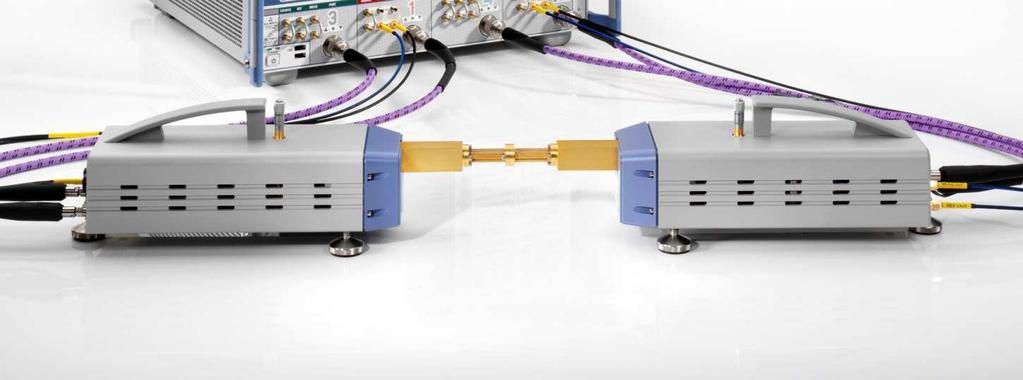
5 Extending the Frequency into the Tera Hertz Range Measurement setup Block diagram of a frequency extender module


6 Extending the Frequency into the Tera Hertz Range

7 Converter Set-Up Schematic Diagram R&S ZVA with B16 Hardware option Meas. Receiver Reflectometer 2 Source R&S ZVA-B32 Ref. Receiver Meas. Receiver Ref. Receiver R&S ZVA-B22 R&S ZVA-B34 Bias T Reflectometer 4 Bias T PORT 2 PORT 4 Ref LO Meas T/R VNA Reflectometer module R&S ZVA-B24 Meas. Receiver Reflectometer 1 DUT R&S ZVA-B31 Ref. Receiver Meas. Receiver Ref. Receiver R&S ZVA-B21 R&S ZVA-B33 Bias T Reflectometer 3 Bias T PORT 1 PORT 3 Meas Ref LO T/R VNA Reflectometer module R&S ZVA-B23 Source


8 RPG, The Rohde&Schwarz Company R&S is the only company in the world offering VNA solutions up to 500GHz without the need to rely on third party companies MM-wave technology Microwave sensing Space technology
 A R&S company")


9 Radiometer Physics GmbH (RPG) A R&S company Microwave, sub-mm & THz Turn-key Radiometers, Space Technology Components, Design & Scientific Expertise Design Development Manufacturing Integration and Test

10 Product Spectrum

")
11 Measurement and Instrumentation Transmit / Receive Systems, Spectrum Analyser Solution Fullband 50-75GHz, 60-90GHz, GHz, GHz, GHz, GHz, GHz, GHz, GHz High Dynamic Receivers for 90 GHz, 183 GHz, 220 GHz, 324 GHz, 502GHz, 640 GHz for compact ranges (antenna measurement facilities, phase + amplitude) 11 11
: 8 local oscillator chains")
, FIRST/HIFI, MARFEQ, SAPHIR (CNES), MLS (NASA),")
12 Space Components & sub-systems Space qualified local oscillators (Herschel / ESA): 8 local oscillator chains from 480 GHz to 1100 GHz Other space projects: EOS (NASA), ODIN (SSA), FIRST/HIFI, MARFEQ, SAPHIR (CNES), MLS (NASA), FY-3 (China),

13 Use of ZVA with Converters up to 0,5 THz

14 Automatic Configuration with Option ZVA-K8 ı SW option ZVA-K8 - Functions: Selection of the measurement setup Automatic configuration of internal sources to provide RF, LO Adoption of the x-axis scaling Installation of the R&D wave guide calibration kit (any other can be installed as well)
15 R&S ZVA-Z110 Millimeter-Wave Converter l Source Input (from NWA): l Frequency Range: 12.5 GHz (11,1 GHz for ZVA110) to GHz (x6) l Input power range: +4 dbm to +10 dbm l Local Oscillator Input (from NWA / ext SRC) l Frequency Range: GHz (8,375 GHz for ZVA110) to GHz (x8) l Input power Range: +5 dbm to +10dBm l Measurement/Reference Output (to NWA) l Frequency Range: 10 MHz to 300 MHz here 279 MHz

16 Port Config Setup Table Multiplication Factors 6 and 8

17 The R&S Waveguide Calibration Kits ı A high quality calibration kit is an important condition to achieve a good measurement accuracy. ı In case of WR08 and smaller waveguide dimensions, the calibration standards through, reflect, and line are verified by their mechanic tolerances. The match standard is verified based on a TRL calibration.


18 Calibration Level adjustment Connect calibration standards to both converters and press ok Fixed match Short Offset short + Through Shim Direct connection of both test ports
19 Mechanical Tolerances

20 The R&S Waveguide Calibration Kits A fly sitting next to a 500 GHz shim


21 The R&S Waveguide Calibration Kits Verification of a WR03 shim at R&S fab in Teisnach WFP Ø 89,97µm Ball Diameter 89,97µm Werth Fiber Probe WFP 3D Werth VIDEO-CHECK UA 400 Ultra accuracy coordinate measuring machine in a fixed bridge design Smallest and most accurate fiber probe in the world allows measurement of smallest details, such as holes, radii, Tactile measurement without the typical problems of optical probes

22 The R&S Waveguide Calibration Kits Mechanical measurement accuracy Resolution: 0,001 µm Maximum permissible error (MPE): Fundamental MPE of machine + Sensor-related MPE = worst case MPE of measurement Maximum permissible error for this application Task Drill position Drill diameter Combined MPE worst case: µm µm
 ZVA-Z220 / ZC220 J Band (WR03) ZC170 G Band (WR05) ZVA-Z140 D")
 W Band (WR10) Manual Attenuator Electronic Attenuator V Band")
23 Millimeter Converter Family ZVA-Z500 / ZC500 ZVA-Z325 / ZC330 Y Band (WR02) ZVA-Z220 / ZC220 J Band (WR03) ZC170 G Band (WR05) ZVA-Z140 D Band (WR06) ZVA-Z110E F Band (WR08) ZVA-Z110 ZVA-Z75 ZVA-Z90 E Band (WR12) W Band (WR10) Manual Attenuator Electronic Attenuator V Band (WR15)
24 Power Calibration and Power Sweep Fußzeile: >Einfügen >Kopf- und Fußzeile 24
 S-Parameters of waveguide")

25 Precise power calibration up to 110GHz Unique power measurements from DC up to 110GHz with 1.0mm connector First millimeter power sensor that is traceable to a national metrology institute (NMI) S-Parameters of waveguide transition can be loaded directly into sensor for accurate power measurements USB interface means the power sensor can be used directly with the ZVA or PC running the free NRP analysis software. Lowest uncertainty to 0.318dB Highest Linearity 30% faster than competition

26 ZVA-Z110E to 110 GHz with electronic Power Control using variable Attenuation ı 67 GHz to 110 GHz with electronic power control ı 0 to 25 db (35 db typ.) attenuation ı Allows power sweep and compression point measurement on amplifiers


27 Electronic Power Control with ZVA-B8

28 Electronic power control Full automatic compression point measurement at 110 GHz Only possible with R&S ZVA-B8 option and R&S ZVA-Z110E frequency converter with elec. attenuator 25dB Electronic Power Sweep Range (typ. 40dB) Option R&S ZVA-B8
29 Power Control by RF-Input Power Variation ı Power sweep range of 70dB by RF input power variation ı Frequency dependency can be calibrated out by software tool Output power relative to max output power / 75, 80, 85, 90, 95, 100, 105 and 110 GHz RFin power / dbm
30 Leveling Tool RF-Input Power Variation RF-Input mm-wave output
31 Power Sweep (e.g. ZC220 Converter) 70dB power sweep range
32 ZVA GHz in one Sweep Fußzeile: >Einfügen >Kopf- und Fußzeile 32

33 The Diplexer combines the ZVA67 with the Converter Controllable attenuator

34 Configuring the ZVA110

35 Configuring the ZVA110

36 ZVA 110 Key Data ı Dynamic range 80 db 120 db ı Max output power -10 dbm.10 dbm ı Points ı 1 Hz..30 MHz IFBw ı Effective directivity and load port match > 32 db (typ.)


37 ZVA110 - Principle

38 1 mm Connector System
39 Accurate S-Parameter Measurements Fußzeile: >Einfügen >Kopf- und Fußzeile 39
40 Measurements with different orientations of the modules ı Two measurements of the phase with different orientations of the frequency extender modules 0 orientation 90 orientation
41 Measurement results at 0 deg. orientation LRL Calibration 0 orientation Phase
42 Measurement results at 90 deg. orientation 90 orientation

43 Measurement results at 90 deg. orientation LRL Calibration vs. UOSM Data at 0 orientation ı Phase of the measurement data based on LRL changed by 14 ı Phase of the measurement data based on UOSM calibration maintains stable
44 Measurement results LRL Calibration vs. UOSM What is the reason for this effect and why does UOSM provide a better result than LRL calibration technique?

45 Multiplication of VNA signal

 ı This requires, that the")

46 Impact of the cable movement ı The LRL calibration on wave guide is done with 2 or more shims, with different length (Reflec t) ı This requires, that the calibration has to be done by a horizontal alignment of the two frequency extender modules

47 Impact of the Cable Movement ı For the LRL: the frequency converter gets moved in 90 to each other after the calibration ı Depending of the quality of the LO-cables, this leads to a small, constant phase error: Cable bending at 0 deg orientation Cable bending at 90 deg orientation

48 Impact of the cable movement ı The phase error due to the cable movement gets multiplied by the factor M of the frequency extender modules M: * 0.5 Calculated phase error: 12
49 Impact of the cable movement ı Due to the 90 alignment of the frequency extender modules, the RF and LO cables are bent ı As shown in the measurement results, a phase error of up to 14 due to the LO cable movement can be seen Cable bending Cable bending ma 1 mb 1 1 EDF ESF ERF S21 S11 S22 S12 ELF ETF mb 2 Frequency extender module DUT Frequency extender module
50 Calibration &Technique: UOSM ı UnknownThru-Open-Short-Match ı The calibration technique UOSM (for waveguide, the open gets replaced by an Offset Short) allows to have a thru, which has been not specified in the calkit data ı UOSM: 7 Term calibration technique ı Thru can be also lossy, 10 db or more attn. are OK UOSM calibration technique allows to perform the calibration in the final position No cable bending required after calibration ı Requirement: Thru has to be reciprocal, it can be also the DUT itself
51 Summary 0 orientation 90 orientation - For the UOSM calibration the DUT can be used as the Thru standard. ( Reciprocal) - The cables do not have to be bent after the calibration

52 Example H. Rashid, V. Desmaris, V. Belitsky, M. Ruf, T. Bednorz and A. Henkel, "Design of Wideband Waveguide Hybrid With Ultra-Low Amplitude Imbalance," in IEEE Transactions on Terahertz Science and Technology, vol. 6, no. 1, pp , Jan doi: /TTHZ DUT is 90 waveguide hybrid with ultra-low amplitude imbalance Designed for GHz band Multiple branch waveguide design Amplitude and phase imbalance are simulated and compared to measurement.

53 Example H. Rashid, V. Desmaris, V. Belitsky, M. Ruf, T. Bednorz and A. Henkel, "Design of Wideband Waveguide Hybrid With Ultra-Low Amplitude Imbalance," in IEEE Transactions on Terahertz Science and Technology, vol. 6, no. 1, pp , Jan doi: /TTHZ Converters are rotated between measurements Errors in phase measurements occur Solution: Calibrate UOSM before rotation Recall O, S, M data after 90 rotation, re-measure U.


54 Example H. Rashid, V. Desmaris, V. Belitsky, M. Ruf, T. Bednorz and A. Henkel, "Design of Wideband Waveguide Hybrid With Ultra-Low Amplitude Imbalance," in IEEE Transactions on Terahertz Science and Technology, vol. 6, no. 1, pp , Jan doi: /TTHZ Through, Coupled Phase Reflection Isolation Amplitude Very small deviation between simulated and measured phase
55 Amplifier & Mixer Measurements Fußzeile: >Einfügen >Kopf- und Fußzeile 55


56 Pulsed Measurements at 110 GHz
57 Pulsed Measurements at 110 GHz ı Modulator in source path of freq. converter Frequency range 12 GHz.20 GHz ı Modulator in source path of VNA part Frequency range GHz ı Pulsing the supply voltage ı Low loss (no retuning of RF power level necessary) ı For average pulse, point in pulse and pulse profile test
58 Pulsed Measurements at 110 GHz Trc1 a1 db Mag 10 db / Ref 0 dbm RGa M 1 M ns dbm 1 Ch1 Arb Channel Base Profile Start 0 s Freq 90 GHz Pwr 0 dbm Stop 2 µs Trc2 S21 db Mag 1 db / Ref 0 db Ca? Trc4 S11 db Mag 5 db / Ref -30 db Ca? RGS M 1 M 1 Ch1 Arb Channel Base Profile Start 0 s Freq 90 GHz Pwr 0 dbm Stop 2 µs 1/8/2008, 5:27 AM M 1 M ns ns db db


59 Set-up for Mixer Measurements


60 Mixer Measurement Set-up Cabling Required with ZVA24/40/50 LO_DUT LO_IN REF MEAS LO_DUT RF_IN LO_DUT 1 6 R&S ZVA-Z110 RF_DUT DUT IF_DUT
 Conversion loss calculated from RF_DUT and")
61 Mixer Measurement Results RF_DUT power at waveguide test port (receiver level calibrated) IF_DUT power at mixer IF/LO port (corrected by value of step 1) Conversion loss calculated from RF_DUT and IF_DUT

62 Mixer Measurement Results RF Signal a1 IF Signal b2 calculated Conversion Loss

63 Set-up for Amplifier Measurements

64 Amplifier Measurement Results (Sweep Mode)

65 Amplifier Measurement Results (Pwr Sweep Mode)

66 Amplifier Measurements Results (Intermodulation)
67 Measurements with wideband modulated Signals Fußzeile: >Einfügen >Kopf- und Fußzeile 67
68 Measurement with modulated Signals Typical Applications l Multicarrier systems l Used for wideband communication application as 4G l OFDM signals with multiple carriers generate nonlinear effects different to single carrier stimulation lradar systems luse of pulsed chirp signals lresolution is dependent on the bandwith of the freq. chirp lrange resolution = (c 0 ) / (bandwidth x 2) 68

69 Setup for Analysis with modulated Signals ı Modulated signal injected into generator path of VNA ı Measurement and reference signal are modulated ı Power-, ratio- and S-parameter measurements in forward direction possible ı Trigger signal from sig.-gen. 69
70 Frequency Extension to 500 GHz and above with Frequency Converters ı RF signal of VNA source is multiplied e.g. with factor 6 15 GHz -> 90 GHz Modulation bandwidth 160 MHz -> 960 MHz ı Reference and measurement signal is down converted by using a harmonic mixer e.g. using the 8th Lo harmonic ı Ref & Meas out Down converted to 500 MHz ± 480 MHz

 N=6 2-2016 71")
71 S-Parameter Measurements with Chirp Signals in the mm-wave Range ı Generation of chirp signals with 960 MHz bandwidth ı 160 MHz 15 GHz ı 960 MHz 90 GHz (multiplied with 6) N=
 ı Sampling time pulse width Set by appropriate measurement bandwidth Sampling mainly during the on-time")
72 Measurement with Chirp Signals versus Frequency ı Point trigger mode (VNA triggered by sig.-gen) ı Sampling time pulse width Set by appropriate measurement bandwidth Sampling mainly during the on-time of the pulse
73 Sampling Times of the IF Filters Filter Sampling Time us Filter Sampling Time in us Normal 5 MHz 0,41 High 5 MHz 0,41 Normal 3 MHz 0,68 High 3 MHz 0,83 Normal 2 MHz 1,01 High 2 MHz 1,24 Normal 1 MHz 1,81 High 1 MHz 2,44 Normal 500 khz 2,93 High 500 khz 4,80 Normal 300 khz 4,54 High 300 khz 8,13 Normal 200 khz 6,13 High 200 khz 12,38 Normal 100 khz 11,96 High 100 khz 24,75 Normal 50 khz 22,33 High 50 khz 49,88 Normal 30 khz 34,13 High 30 khz 84,81 Normal 20 khz 51,19 High 20 khz 126,85 Normal 10 khz 94,50 High 10 khz 258,13 Normal 5 khz 185,25 High 5 khz 525,00 Normal 3 khz 309,56 High 3 khz 883,50 Normal 2 khz 464,75 High 2 khz 1325,25 Normal 1 khz 923,31 High 1 khz 2697,00 Normal 500 Hz 1857,38 High 500 Hz 5425,00 Normal 300 Hz 3095,63 High 300 Hz 9120,00 Normal 200 Hz 4541,23 High 200 Hz 13893,75 Normal 100 Hz 8888,00 High 100 Hz 27812,

74 Usable Bandwidth of Chirp Signal ı Direct down conversion of VNA receiver to IF frequency ı Second receiver window So-called image frequency window Distance = 2*IF frequency ı IF frequency of ZVA 17 MHz => Image window 34 MHz apart ı For wide Chirp frequency span simultaneous detection at measurement and image receiver window possible => 34 MHz of usable chirp bandwidth
75 Influence of the Image Receiver Window Trc4 Trc5 S21 S21 db Mag db Mag 10 db / 10 db / Ref -5 db Ref -5 db Ch2 Ch4 1 S21 12 IF Image M 1 M GHz GHz Original Signal Chirp Pulse db db M 1 IF Image above measurement frequency Original Signal Chirp Pulse M 1 IF Image IF image below measurement frequency Ch2 Ch4 Center Center 13 GHz 13 GHz Pwr Pwr 0 dbm 0 dbm Span Span 200 MHz 200 MHz 75
 1.004118 GHz -0.0869 db -10-20 -30-40 -50-60 60 MHz -70 Ch3 Arb fb Start 950 MHz Pb 0 dbm Stop 1.")
76 S-Parameter Measurements using a 60 MHz Chirp Trc7 Trc8 S S21 db Mag 10 db / Ref 0 db b2(p1s) db Mag 10 db / Ref 0 dbm Cal M1 M1 4 (Max) GHz db MHz -70 Ch3 Arb fb Start 950 MHz Pb 0 dbm Stop 1.05 GHz
77 How to avoid Problems due to Image Frequency ı Pulsed Chirp will provide discrete spectrum as soon as sampling time >> chirp repetition rate ı 100 us pulse frequency -> 10 khz tone spacing Trc4 b2(p1s) db Mag 10 db / Ref 0 dbm RG b2(p1s) time domain 100 us frequeny domain Trc1 b2(p1s)db Mag10 db /Ref -50 dbm b2(p1s) 10 khz R R ? M ?M1 GHz khz 1 (Max) dBm db Ch1 Arb Profile Start -1 µs fb 1 GHz Pb 0 dbm Stop 1 ms Ch1 Arb fbcenter1 GHz Pb 0 dbm Span100 khz 77
78 Shifting Image Frequency Window between the Carriers ı Multi-carrier signals have less problems with image frequency ı Reason: Odd value for the ZVA - IF frequency 17,12345 MHz ı Image receiver window : f meas ± 34,2469 MHz ı Example: Freq. carriers on 10 khz grid Image always 3,1 khz apart IF filter < 1 khz recommended 3,1 khz N*10 khz 78

79 High selective IF Filters to suppress adjacent Carriers Trc1 a1 db Mag 10 db / Ref 20 dbm a Ch1 Arb Center 1 GHz Pwr 20 dbm Span 500 khz Trc2 a1 db Mag 10 db / Ref 20 dbm a Ch2 Arb Center 1 GHz Pwr 20 dbm Span 500 khz

80 Measurement of a Waveguide Adapter with a 960 MHz Chirp 80
81 True Differential Measurements Fußzeile: >Einfügen >Kopf- und Fußzeile 81


82 The Setup with Converters in the mm-wave Range Base unit ZVT20 LO ZVT20 with 6 Ports and 3 sources RF 82


83 Setup with Converters in the mm-wave Range Base Unit ZVA LO ı External generator as LO source ı Controlled by ZVA via GPIB or LAN 83
84 Test Setup for TruDi up to 70 GHz ZVA Meas. Receiver Reflectometer 2 Ref. Receiver PORT 2 Reflectometer 4 Meas. Receiver Error corrected Mag Phase detection Ref. Receiver Meas. Receiver Reflectometer 1 PORT 4 differential DUT Logical PORT 2 and control by software Ref. Receiver PORT 1 Logical PORT 1 Reflectometer 3 Meas. Receiver Ref. Receiver PORT 3 84
85 Generating True Differential and Common Mode Stimulus Signals ı Phase detection of the sources is done by the reference (a-) receivers ı Phase setting is accomplished by increasing the frequency of one source by a small amount for a defined time interval: f = ϕw ϕa 360 τ ı f: Frequency increment (adjustable) ı ϕ w : Wanted phase difference ı ϕ a : Actual phase difference ı τ: Time interval (fixed) 85
86 Stability of the Phase Phase accuracy depends on: ı Accuracy of system error correction ı S/N for phase measurement in the reference receiver ı System clock and IF frequency ı Used frequency offset for phase adjustment of the synthesizers ı Desired measurement time ı Current settings for 1 of phase stability 86
87 Phase Stability vs. Frequency and Power Trc1 a1/a3 Phase 1 / Ref Trc1 Trc2 a1/a3 a1 Phase 1 / Ref -90 db Mag 10 db / Ref 0 dbm 1 a1/a3 M GHz a1 M dbm dbm M M Ch1 Arb Channel Base Start 10 MHz 5/23/2008, 8:32 AM Pwr 0 dbm Stop 50 GHz Ch1 Arb Channel Base Start -55 dbm Freq 24 GHz 5/23/2008, 8:43 AM Stop -5 dbm 87


 88")
88 A linear Waveguide DUT Example (Magic Tee) 88
 1st Step: Power")

 2nd Step:")


89 A linear Waveguide DUT Example (Magic Tee) 1st Step: Power calibration of all reference receivers and generators using converter leveling tool and a power meter (waveguide sensor) 2nd Step: System error correction (waveguide cal. kit + bends as unknown Throughs Note: Different polarization with E bends (compare ) 3rd Step: Balanced port assignment and activation of true differential mode (without check mark VirDi is used) 89
90 A linear Waveguide DUT Example (Magic Tee) Result: Collinear ports to port Trc4 Ssc21 db Mag 10 db / Ref 0 db Ca? PCai Trc10 Ssd21 db Mag 10 db / Ref 0 db Ca? PCai Ssd VirDi Trc4 Ssc21 db Mag 10 db / Ref 0 db Cal PCai Trc10 Ssd21 db Mag 10 db / Ref 0 db Cal PCai Ssd TruDi 1 Ch1 Arb Channel Base Start 75 GHz Pwr 0 dbm Stop 90 GHz Ch1 TrD Arb Channel Base Start 75 GHz Pwr 0 dbm Stop 90 GHz Trc3 Ssd21 Phase 45 / Ref 0 Ca? PCai Trc9 Ssc21 Phase 45 / Ref 0 Ca? PCai Ssd Trc3 Ssd21 Phase 45 / Ref 0 Cal PCai Trc9 Ssc21 Phase 45 / Ref 0 Cal PCai Ssd Ch1 Arb Channel Base Start 75 GHz Pwr 0 dbm Stop 90 GHz Ch1 TrD Arb Channel Base Start 75 GHz Pwr 0 dbm Stop 90 GHz Result: Colinear ports to Σ port Trc4 Ssc21 db Mag 10 db / Ref 0 db Ca? PCai Trc10 Ssd21 db Mag 10 db / Ref 0 db Ca? PCai 1 Ssd VirDi Trc4 Ssc21 db Mag 10 db / Ref 0 db Cal PCai Trc10 Ssd21 db Mag 10 db / Ref 0 db Cal PCai Ssd TruDi 1 Ch1 Arb Channel Base Start 75 GHz Pwr 0 dbm Stop 90 GHz Ch1 TrD Arb Channel Base Start 75 GHz Pwr 0 dbm Stop 90 GHz Trc3 Ssd21 Phase 45 / Ref 0 Ca? PCai Trc9 Ssc21 Phase 45 / Ref 0 Ca? PCai Ssd Trc3 Ssd21 Phase 45 / Ref 0 Cal PCai Trc9 Ssc21 Phase 45 / Ref 0 Cal PCai Ssd Σ Ch1 Arb Channel Base Start 75 GHz Pwr 0 dbm Stop 90 GHz Ch1 TrD Arb Channel Base Start 75 GHz Pwr 0 dbm Stop 90 GHz 90

")
91 A nonlinear on-wafer DUT Example (Amplifier) WR10 Wafer 91


92 A nonlinear on-wafer DUT Example (Amplifier) 1st Step: UOSM cal. to characterize the connection between coaxial interface and onwafer reference plane Power loss list for each port 1 mm Match ISS-Match 2nd Step: Power cal. At the coaxial interfaces using the power loss list from 1st step. 3rd Step: System error correction with on-wafer using ZVA firmware or WinCal TM with downloading error terms to ZVA Unknown Through 4th Step: Balanced port assignment and activation of TruDi (without check mark VirDi is used) 92
 Results: Power sweep")

93 Nonlinear on-wafer DUT Example (Amplifier) Results: Power sweep at 80 GHz Memory traces Active traces = TruDi results = VirDi results 93
94 Wafer Prober Measurements Fußzeile: >Einfügen >Kopf- und Fußzeile 94
95 OnWafer System Providers Cascade ı WinCal support of ZVA, ZVT ı Mechanical adaption of mm-wave converters, ZVA110 Semiprobe ı Support of ZVA MPI ı Support of ZVA, ZNB, ZVT in QAlibria software ı Mechanical adaption of mm-wave converters, ZVA110 Signatone (local cooperation) 95


96 Millimeter On Wafer setups Rohde & Schwarz converters have been developed to work in conjunction with many manufactures of wafer probers Probe stations already prepared for mounting of Rohde & Schwarz converters The ZVA network analyser is fully integrated into the software packages


97 TS150-THZ Millimeter Wave System 97


98 Power Calibration on the Wafer WR10 Wafer


99 Challenges for accurate Power Levels Goal : Power calibration in the reference plane of the DUT (amplifier) Problem : No access with coaxial power meter possible Solution: ı Characterization of the S-parameter between coaxial interface and the wafer prober tip ı Correction of the coaxial power calibration with this loss list

100 Power Correction with Loss List Coax plane Loss list Wafer
101 Material Measurements


102
103 Material Characterization Kit Image of WR 5.1 band ( GHz) UG-387/UM Gap for sample or sample holder Corrugated Gap size adjusted by a converter micrometric screw
104 Material Characterization Kit (MCK) Concept: 2-Port configuration (S11, S21) movable VNA Converter VNA Converter Corrugated Converter Corrugated Waveguide Sample The sample is clamped into a gap between two Corrugated waveguides guided free-space approach Samples are exposed to a beam with a plane phase front Minimum measurement configuration, needs only S21 and S11 data
105 Material Characterization Kit (MCK) Fast Measurement Sequence Re-normalize the S21 raw data: through configuration Re-normalize the S11 raw data : short configuration Clamp the sample, Acquire S21 and S11 Post-process the S parameter data with a dedicated software to extract material properties (Epsilon and Tan(delta)) µ currently not possible to extract
106 Material Measurement Example : Schott Borofloat 33
107 Rohde & Schwarz The Partner for mm-wave Applications We design, produce and service the complete portfolio in house ı Components ı Frequency multipliers ı Harmonic mixers ı Modules for generators, spectrum analyzers and network analyzers ı Power meters up to 110 GHz We don t have to rely on or wait for third party companies Fußzeile: >Einfügen >Kopf- und Fußzeile 107
Amplifier Characterization in the millimeter wave range. Tera Hertz : New opportunities for industry 3-5 February 2015
 Amplifier Characterization in the millimeter wave range Tera Hertz : New opportunities for industry 3-5 February 2015 Millimeter Wave Converter Family ZVA-Z500 ZVA-Z325 Y Band (WR02) ZVA-Z220 J Band (WR03)
R&S ZVA-Zxx Millimeter-Wave Converters Network analysis up to 500 GHz
 ZVA-Zxx_bro_en_5214-2033-12.indd 1 Product Brochure 06.02 Test & Measurement R&S ZVA-Zxx Millimeter-Wave Converters Network analysis up to 500 GHz 28.10.2014 21:05:04 R&S ZVA-Zxx Millimeter-Wave Converters
Testing Millimeter-Wave Mixers Using Converters of the R&S ZVA Family
 Products: R&S ZVA-Z75, R&S ZVA-Z110, R&S ZVA-Z325, R&S ZVA24, R&S ZVA40, R&S ZVA50, R&S ZVT20, R&S SM100A, R&S ZV-WR15, R&S ZV-WR10, R&S ZV-WR03, R&S NRP, R&S NRP-Z22 Testing Millimeter-Wave Mixers Using
Millimeter Signal Measurements: Techniques, Solutions and Best Practices
 New Network Analyzer platform Millimeter Signal Measurements: Techniques, Solutions and Best Practices Phase Noise measurements update 1 N522XA PNA Series Network Analyzer Introducing Highest Performance
Pulsed S-Parameter Measurements using the ZVA network Analyzer
 Pulsed S-Parameter Measurements using the ZVA network Analyzer 1 Pulse Profile measurements ZVA Advanced Network Analyser 3 Motivation for Pulsed Measurements Typical Applications Avoid destruction of
Platform Migration 8510 to PNA. Graham Payne Application Engineer Agilent Technologies
 Platform Migration 8510 to PNA Graham Payne Application Engineer Agilent Technologies We set the standard... 8410 8510 When we introduced the 8510, we changed the way S-parameter measurements were made!
Configuration of PNA-X, NVNA and X parameters
 Configuration of PNA-X, NVNA and X parameters VNA 1. S-Parameter Measurements 2. Harmonic Measurements NVNA 3. X-Parameter Measurements Introducing the PNA-X 50 GHz 43.5 GHz 26.5 GHz 13.5 GHz PNA-X Agilent
R&S ZVT Vector Network Analyzer Specifications
 R&S ZVT Vector Network Analyzer Specifications Test & Measurement Data Sheet 08.00 CONTENTS Definitions... 3 Specifications... 4 Measurement range...4 Measurement speed...5 Measurement accuracy...6 Effective
Vector Network Analyzer
 Vector Network Analyzer VNA Basics VNA Roadshow Budapest 17/05/2016 Content Why Users Need VNAs VNA Terminology System Architecture Key Components Basic Measurements Calibration Methods Accuracy and Uncertainty
Testing S-Parameters on Pulsed Radar Power Amplifier Modules
 Application Note Mahmud Naseef, Roland Minihold, Thilo Bednorz 3.2013-1MA126_2E Testing S-Parameters on Pulsed Radar Power Amplifier Modules Application Note Products: ı ı ı ı ı R&S ZVA8 R&S ZVAX24 R&S
Compact Series: S5065 & S5085 Vector Network Analyzers KEY FEATURES
 Compact Series: S5065 & S5085 Vector Network Analyzers KEY FEATURES Frequency range: 9 khz - 6.5 or 8.5 GHz Measured parameters: S11, S12, S21, S22 Wide output power adjustment range: -50 dbm to +5 dbm
A True Differential Millimeter Wave System with Port Power Control. Presented by: Suren Singh
 A True Differential Millimeter Wave System with Port Power Control Presented by: Suren Singh Agenda Need for True Differential and RF Power Control Vector Network Analyzer RF Port Power Control Port Power
Keysight Technologies PNA-X Series Microwave Network Analyzers
 Keysight Technologies PNA-X Series Microwave Network Analyzers Active-Device Characterization in Pulsed Operation Using the PNA-X Application Note Introduction Vector network analyzers (VNA) are the common
AV3672 Series Vector Network Analyzer
 AV3672 Series Vector Network Analyzer AV3672A/B/C/D/E (10MHz 13.5 GHz/26.5 GHz/43.5 GHz/50 GHz/67 GHz) Product Overview: AV3672 series vector network analyzer include AV3672A (10MHz 13.5GHz), AV3672B (10MHz
PLANAR 814/1. Vector Network Analyzer
 PLANAR 814/1 Vector Network Analyzer Frequency range: 100 khz 8 GHz Measured parameters: S11, S12, S21, S22 Wide output power range: -60 dbm to +10 dbm >150 db dynamic range (1 Hz IF bandwidth) Direct
PLANAR S5048 and TR5048
 PLANAR S5048 and TR5048 Vector Network Analyzers KEY FEATURES Frequency range: 20 khz 4.8 GHz COM/DCOM compatible for LabView Measured parameters: and automation programming S11, S12, S21, S22 (S5048)
PNA Family Microwave Network Analyzers (N522x/3x/4xB) CONFIGURATION GUIDE
 CONFIGURATION GUIDE") PNA Family Microwave Network Analyzers (N522x/3x/4xB) CONFIGURATION GUIDE Table of Contents PNA Family Network Analyzer Configurations... 05 Test set and power configuration options...05 Hardware options...
PNA Family Microwave Network Analyzers (N522x/3x/4xB) CONFIGURATION GUIDE Table of Contents PNA Family Network Analyzer Configurations... 05 Test set and power configuration options...05 Hardware options...
Agilent Technologies Gli analizzatori di reti della serie-x
 Agilent Technologies Gli analizzatori di reti della serie-x Luigi Fratini 1 Introducing the PNA-X Performance Network Analyzer For Active Device Test 500 GHz & beyond! 325 GHz 110 GHz 67 GHz 50 GHz 43.5
Conversion Gain Measurements on Mixers with Different Input and Output Impedances
 Products: ZVRE, ZVR, ZVCE, ZVC, ZVM, ZVK Conversion Gain Measurements on Mixers with Different Input and Output Impedances This Application Note describes how to configure and calibrate R&S ZVR network
Noise Figure Measurement in the 60 GHz Range Application Note
 Noise Figure Measurement in the 60 GHz Range Application Note Products: R&S FSU67 Noisecom Noise Figure Test Set - NC5115-60G - NC5115-60GT This application note describes how noise figure and gain of
R&S ZNB Vector Network Analyzer Specifications
 Umschlag_ZNB4-8_dat-sw_en_5214-5384-22.indd 1 Data Sheet 02.00 Test & Measurement R&S ZNB Vector Network Analyzer Specifications 07.11.2011 10:03:35 CONTENTS Definitions... 3 Measurement range... 4 Measurement
PXIe Contents. Required Software CALIBRATION PROCEDURE
 CALIBRATION PROCEDURE PXIe-5160 This document contains the verification and adjustment procedures for the PXIe-5160. Refer to ni.com/calibration for more information about calibration solutions. Contents
Compact Series: S5048 & TR5048 Vector Network Analyzers KEY FEATURES
 Compact Series: S5048 & TR5048 Vector Network Analyzers KEY FEATURES Frequency range: 20 khz - 4.8 GHz Measured parameters: S11, S12, S21, S22 (S5048) S11, S21 (TR5048) Wide output power adjustment range:
Keysight Technologies PNA Microwave Network Analyzers
 Keysight Technologies PNA Microwave Network Analyzers Application Note Banded Millimeter-Wave Measurements with the PNA 02 Keysight PNA Microwave Network Analyzers Application Note Table of Contents Introduction...
R&S ZVA Vector Network Analyzer High performance up to 110 GHz with up to four test ports
 ZVA_bro_en_5213-5680-12_v1001.indd 1 Product Brochure 10.01 Test & Measurement R&S ZVA Vector Network Analyzer High performance up to 110 GHz with up to four test ports 26.03.2014 10:44:11 R&S ZVA Vector
5 ESSENTIAL HINTS TO IMPROVE Millimeter-wave Network Analysis
 5 ESSENTIAL HINTS TO IMPROVE Millimeter-wave Network Analysis Contents 5 Essential Hints to Improve Millimeter-wave Network Analysis Ensure Accurate, Repeatable Results Go to Hint 1 > Calibrate for Better
THz Vector Network Analyzer Development & Measurements
 THz Vector Network Analyzer Development & Measurements Jeffrey L Hesler, Yiwei Duan, Brian Foley and Thomas Crowe Virginia Diodes Inc., Charlottesville, VA, USA Abstract: Virginia Diodes has been developing
Advanced Test Equipment Rentals ATEC (2832)
") Established 1981 Advanced Test Equipment Rentals www.atecorp.com 800-404-ATEC (2832) Agilent 2-Port and 4-Port PNA-X Network Analyzer N5249A - 10 MHz to 8.5 GHz N5241A - 10 MHz to 13.5 GHz N5242A - 10
Established 1981 Advanced Test Equipment Rentals www.atecorp.com 800-404-ATEC (2832) Agilent 2-Port and 4-Port PNA-X Network Analyzer N5249A - 10 MHz to 8.5 GHz N5241A - 10 MHz to 13.5 GHz N5242A - 10
R&S ZVT Vector Network Analyzer Specifications
 ZVT_dat-sw_en_0758-065-22_v0900_cover.indd Data Sheet 09.00 Test & Measurement R&S ZVT Vector Network Analyzer Specifications 06.03.205 5:50:4 CONTENTS Definitions... 3 Specifications... 4 Measurement
Pulsed VNA Measurements:
 Pulsed VNA Measurements: The Need to Null! January 21, 2004 presented by: Loren Betts Copyright 2004 Agilent Technologies, Inc. Agenda Pulsed RF Devices Pulsed Signal Domains VNA Spectral Nulling Measurement
R&S ZNC Vector Network Analyzer Specifications
 ZNC3_dat-sw_en_5214-5610-22_v0300_cover.indd 1 Data Sheet 03.00 Test & Measurement R&S ZNC Vector Network Analyzer Specifications 04.09.2012 13:39:47 CONTENTS Definitions... 3 Measurement range... 4 Measurement
Test & Measurement. Technical Information. R&S ZV-WR10 / -WR12 / -WR15 Calibration Kits
 Test & Measurement 1307.7174.92 03 Technical Information R&S ZV-WR10 / -WR12 / -WR15 Calibration Kits This technical information describes the following calibration kits: R&S ZV-WR10 (without Sliding Match
PXIe Contents CALIBRATION PROCEDURE
 CALIBRATION PROCEDURE PXIe-5632 This document contains the verification and adjustment procedures for the PXIe-5632 Vector Network Analyzer. Refer to ni.com/calibration for more information about calibration
Vector Network Analyzers ZVB
 Specifications Version 05.00 Vector Network Analyzers ZVB September 2005 Specifications MEASUREMENT RANGE...3 MEASUREMENT SPEED...5 MEASUREMENT ACCURACY...6 EFFECTIVE SYSTEM DATA...8 TEST PORT OUTPUT...8
E-band and mmwave Components & Sub-Assemblies testing Challenges New Technology. VNA Roadshow Budapest 17/05/2016
 E-band and mmwave Components & Sub-Assemblies testing Challenges New Technology VNA Roadshow Budapest 17/05/2016 Agenda Applications drive the need Challenges faced by device characterization engineers
Spurious and Stability Analysis under Large-Signal Conditions using your Vector Network Analyser
 Spurious and Stability Analysis under Large-Signal Conditions using your Vector Network Analyser An application of ICE June 2012 Outline Why combining Large-Signal and Small-Signal Measurements Block Diagram
Agilent Technologies PSA Series Spectrum Analyzers Test and Adjustment Software
 Test System Overview Agilent Technologies PSA Series Spectrum Analyzers Test and Adjustment Software Test System Overview The Agilent Technologies test system is designed to verify the performance of the
MS2760A a new approach for mm-wave and 5G spectrum measurements
 MS2760A a new approach for mm-wave and 5G spectrum measurements RF Technology Days 2018 Ferdinand Gerhardes EMEA BDM April 2018 Agenda Anritsu SPA product portfolio MS2760A feature overview What is NLTL?
RF and Microwave Test and Design Roadshow 5 Locations across Australia and New Zealand
 RF and Microwave Test and Design Roadshow 5 Locations across Australia and New Zealand Advanced VNA Measurements Agenda Overview of the PXIe-5632 Architecture SW Experience Overview of VNA Calibration
Keysight 2-Port and 4-Port PNA-X Network Analyzer
 Keysight 2-Port and 4-Port PNA-X Network Analyzer N5249A - 0 MHz to 8.5 GHz N524A - 0 MHz to 3.5 GHz N5242A - 0 MHz to 26.5 GHz Data Sheet and Technical Specifications Documentation Warranty THE MATERIAL
Lightning D Vector Network Analyzers. Network Analysis Solutions for Design and Manufacturing. 40 MHz to 65 GHz
 Lightning 37000D Vector Network Analyzers 40 MHz to 65 GHz Network Analysis Solutions for Design and Manufacturing Vector Network Analyzers that offer... The 37000D Lightning Vector Network Analyzers are
Wafer-Level Calibration & Verification up to 750 GHz. Choon Beng Sia, Ph.D. Mobile:
 Wafer-Level Calibration & Verification up to 750 GHz Choon Beng Sia, Ph.D. Email: Choonbeng.sia@cmicro.com Mobile: +65 8186 7090 2016 Outline LRRM vs SOLT Calibration Verification Over-temperature RF calibration
Antenna Measurement using Vector Network Analyzer. Jong-hwan Keum Agilent Technologies
 Antenna Measurement using Vector Network Analyzer Jong-hwan Keum Agilent Technologies Agenda Overview Antenna Measurement System Configuration(Examples) Antenna Measurement System Design Considerations
High Performance, Broadband Network Analysis Solutions
 Advanced Test Equipment Rentals E stablished 1981 www.atecorp.com 800-404-ATEC (2832) Technical Data Sheet & Configuration Guide High Performance, Broadband Network Analysis Solutions ME7838A Series Vector
Compact VNA - TR7530. Extended Specifications EXTEND YOUR REACH TM
 Compact VNA - TR7530 TM Extended Specifications Frequency range: 20 khz - 3 GHz Wide output power adjustment range: -50 dbm to +5 dbm Dynamic range: 123 db (10 Hz IF bandwidth) typ. Measurement time per
Optoelectronic Components Testing with a VNA(Vector Network Analyzer) VNA Roadshow Budapest 17/05/2016
 VNA Roadshow Budapest 17/05/2016") Optoelectronic Components Testing with a VNA(Vector Network Analyzer) VNA Roadshow Budapest 17/05/2016 Content Introduction Photonics & Optoelectronics components Optical Measurements VNA (Vector Network
Optoelectronic Components Testing with a VNA(Vector Network Analyzer) VNA Roadshow Budapest 17/05/2016 Content Introduction Photonics & Optoelectronics components Optical Measurements VNA (Vector Network
S3602A/B Vector Network Analyzer Datasheet
 S3602A/B Vector Network Analyzer Datasheet Saluki Technology Inc. The document applies to the vector network analyzers of the following models: S3602A vector network analyzer (10MHz-13.5GHz). S3602B vector
Agilent N5250A PNA Millimeter-Wave Network Analyzer 10 MHz to 110 GHz
 Agilent N5250A PNA Millimeter-Wave Network Analyzer 10 MHz to 110 GHz Technical Overview High Performance Bench-Top Network Analyzer Maximize your frequency coverage with a single sweep from 10 MHz to
Power Added Efficiency Measurement with R&S ZNB/ R&S ZVA
 Power Added Efficiency Measurement with R&S ZNB/ R&S ZVA Application Note Products: R&S ZNB R&S ZVA Power Added Efficiency (PAE) is a key parameter for the characterization of an amplifier. This application
Group Delay measurements with Signal and Spectrum Analyzers Application Note
 Group Delay measurements with Signal and Spectrum Analyzers Application Note Products: ı ı R&S FSW R&S FSW-K17 Phase distortions in a transmission channel are determined using group delay measurements,
Wideband Passive Circuits for Sideband Separating Receivers
 Wideband Passive Circuits for Sideband Separating Receivers Hawal Rashid 1*, Denis Meledin 1, Vincent Desmaris 1, and Victor Belisky 1 1 Group for Advanced Receiver Development (GARD), Chalmers University,
NATIONAL UNIVERSITY of SINGAPORE
 NATIONAL UNIVERSITY of SINGAPORE Faculty of Engineering Electrical & Computer Engineering Department EE3104 Introduction to RF and Microwave Systems & Circuits Experiment 1 Familiarization on VNA Calibration
External Source Control
 External Source Control X-Series Signal Analyzers Option ESC DEMO GUIDE Introduction External source control for X-Series signal analyzers (Option ESC) allows the Keysight PXA, MXA, EXA, and CXA to control
EXTEND YOUR REACH. Copper Mountain Technologies USB VNAs. S-parameter measurement solutions from 9 khz to 110 GHz Measured parameters from S 11
 Copper Mountain Technologies USB VNAs S-parameter measurement solutions from 9 khz to 110 GHz Measured parameters from S 11 to S 44 Dynamic range as high as 162 db typ. (1 Hz IF bandwidth) Measurement
Agilent Millimeter-Wave Network Analyzers 10 MHz to 110 GHz, with Extensions to 1.1 THz. Technical Overview
 Agilent Millimeter-Wave Network Analyzers 10 MHz to 110 GHz, with Extensions to 1.1 THz Technical Overview Single Sweep 10 MHz to 110 GHz Measurement Solutions Currently there are two solutions that offer
R&S ZNBT8 Vector Network Analyzer Specifications
 E stablished 1981 Advanced Test Equipment Rentals www.atecorp.com 800-404-ATEC (2832) ZNBT8_dat-sw_en_3606-9727-22_v0200_cover.indd 1 Data Sheet 02.00 Test & Measurement R&S ZNBT8 Vector Network Analyzer
Agilent PNA Microwave Network Analyzers
 Agilent PNA Microwave Network Analyzers Application Note 1408-15 Banded Millimeter-Wave Measurements with the PNA Table of Contents Introduction...3 System Configuration...4 System Operation...8 Configuring
Vector Network Analysis
 Portfolio Brochure Vector Network Analysis Product Portfolio Vector Network Analysis VNA Innovation Timeline In 1965, Anritsu filed the patent that defined the first modern Vector Network Analyzer (VNA).
Characterization of Satellite Frequency Up-Converters Application Note
 Characterization of Satellite Frequency Up-Converters Application Note Products: R&S ZVA R&S FSW R&S NRP R&S SMB100A Frequency converters e.g. in satellite transponders need to be characterized in terms
Keysight Technologies 8 Hints for Making Better Measurements Using RF Signal Generators. Application Note
 Keysight Technologies 8 Hints for Making Better Measurements Using RF Signal Generators Application Note 02 Keysight 8 Hints for Making Better Measurements Using RF Signal Generators - Application Note
HP Archive. This vintage Hewlett Packard document was preserved and distributed by www. hparchive.com Please visit us on the web!
 HP Archive This vintage Hewlett Packard document was preserved and distributed by www. hparchive.com Please visit us on the web! On-line curator: Glenn Robb This document is for FREE distribution only!
Keysight Technologies E5071C ENA Vector Network Analyzer. E5092A Configurable Multiport Test Set
 Keysight Technologies E5071C ENA Vector Network Analyzer 9 khz to 4.5/6.5/8.5 GHz 100 khz to 4.5/6.5/8.5 GHz (with bias tees) 300 khz to 14/20 GHz (with bias tees) E5092A Configurable Multiport Test Set
Keysight Technologies Amplifier and CW Swept Intermodulation - Distortion Measurements using the PNA Microwave Network Analyzers.
 Keysight Technologies Amplifier and CW Swept Intermodulation - Distortion Measurements using the PNA Microwave Network Analyzers Application Note Introduction This application note covers testing of an
Spectrum and signal analyzers for every requirement an overview
 Spectrum and signal analyzers for every requirement an overview The introduction of the Handheld Spectrum Analyzer R&S FSH6 (page 26) expands an already full range of analyzers from Rohde & Schwarz, covering
PLANAR 804/1. Vector Network Analyzer
 PLANAR 804/1 Vector Network Analyzer Frequency range: 100 khz 8 GHz Measured parameters: S11, S12, S21, S22 Wide output power range: -60 dbm to +10 dbm >145 db dynamic range (1 Hz IF bandwidth) Time domain
Ultra High Frequency Measurements
 Ultra High Frequency Measurements Desmond Fraser desmond@rheintech.com 703.689.0368 360 Herndon Parkway Suite 1400 Herndon, VA 20170 IEEE EMC DC / N. VA Chapter 31 January 2012 Overview We ll review Millimeter
1 Introduction: frequency stability and accuracy
 Content 1 Introduction: frequency stability and accuracy... Measurement methods... 4 Beat Frequency method... 4 Advantages... 4 Restrictions... 4 Spectrum analyzer method... 5 Advantages... 5 Restrictions...
Keysight Technologies Making Accurate Intermodulation Distortion Measurements with the PNA-X Network Analyzer, 10 MHz to 26.5 GHz
 Keysight Technologies Making Accurate Intermodulation Distortion Measurements with the PNA-X Network Analyzer, 10 MHz to 26.5 GHz Application Note Overview This application note describes accuracy considerations
Keysight Technologies Gustaaf Sutorius
 1 1 mmw Seminar 2017 Keysight Technologies 18-04-2018 Gustaaf Sutorius Introduction & Agenda Why mmwave Industry needs & mmwave challenges Generating mmwave Analyzing mmwave Characterizing mmwave components
CobaltFx Series EXTEND YOUR REACH. Frequency Extender System from. Frequency bands from: GHz, GHz, GHz
 CobaltFx Series TM Frequency Extender System from TM Frequency bands from: 50-75 GHz, 60-90 GHz, 75-110 GHz EXTEND YOUR REACH USA: +1.17..5400 61 E. New York St Indianapolis, IN 460 www.coppermountaintech.com
Vector network analysis Calibration and advanced measurements
 Vector network analysis Calibration and advanced measurements Application examples (I) Production-line testing On-wafer testing Datum VNA training Titel R&S 2 Canada 2 Application examples (II) RCS measurement
Advanced Test Equipment Rentals ATEC (2832) Agilent 8510 System Solutions
 Agilent 8510 System Solutions") E stablished 1981 Advanced Test Equipment Rentals www.atecorp.com 800-404-ATEC (2832) Agilent 8510 System Solutions Your bridge to the future Application guide The guide below shows Agilent Technologies
E stablished 1981 Advanced Test Equipment Rentals www.atecorp.com 800-404-ATEC (2832) Agilent 8510 System Solutions Your bridge to the future Application guide The guide below shows Agilent Technologies
PXIe Contents CALIBRATION PROCEDURE. Reconfigurable 6 GHz RF Vector Signal Transceiver with 200 MHz Bandwidth
 IBRATION PROCEDURE PXIe-5646 Reconfigurable 6 GHz Vector Signal Transceiver with 200 MHz Bandwidth This document contains the verification and adjustment procedures for the PXIe-5646 vector signal transceiver.
X-Parameters with Active and Hybrid Active Load Pull
 X-Parameters with Active and Hybrid Active Load Pull Gary Simpson, CTO Maury Microwave EuMW 2012 www.maurymw.com 1 General Load Pull Overview 2 Outline 1. Introduction to Maury Microwave 2. Basics and
Reflectometer Series:
 Reflectometer Series: R54, R60 & R140 Vector Network Analyzers Clarke & Severn Electronics Ph +612 9482 1944 Email sales@clarke.com.au BUY NOW - www.cseonline.com.au KEY FEATURES Patent: US 9,291,657 No
Using the FREQUENCY CONVERSION Mode of Vector Network Analyzer ZVR
 Using the FREQUENCY CONVERSION Mode of Vector Network Analyzer ZVR Application Note 1EZ47_0E Subject to change January 1999, Albert Gleissner Products: ZVRL, ZVRE, ZVR, ZVC, ZVCE with Option ZVR-B4 1 ABSTRACT...
Compact VNA - TR1300/1
 Compact VNA - TR1300/1 TM Extended Specifications Frequency range: 300 khz - 1.3 GHz Wide output power adjustment range: -55 dbm to +3 dbm Dynamic range: 135 db (10 Hz IF bandwidth) typ. Measurement time
S3602C Vector Network Analyzer Datasheet
 S3602C Vector Network Analyzer Datasheet Saluki Technology Inc. The document applies to the vector network analyzers of the following models: S3602C vector network analyzer (10MHz - 43.5GHz). Options of
Network Analysis Basics
 Adolfo Del Solar Application Engineer adolfo_del-solar@agilent.com MD1010 Network B2B Agenda Overview What Measurements do we make? Network Analyzer Hardware Error Models and Calibration Example Measurements
Agilent PNA Microwave Network Analyzers
 Agilent PNA Microwave Network Analyzers Application Note 1408-3 Improving Measurement and Calibration Accuracy using the Frequency Converter Application Table of Contents Introduction................................................................2
Fast network analyzers also for balanced measurements
 GENERAL PURPOSE Network analyzers 44297/5 FIG 1 The new Vector Network Analyzer R&S ZVB, here with four-port configuration. Vector Network Analyzers R&S ZVB Fast network analyzers also for balanced measurements
Exercise 5: Power amplifier measurement
 Exercise 5: Power amplifier measurement The objective of this laboratory exercise is the calibrated measurement of important parameters of a power amplifier. This includes performance parameters like gain,
Agilent Millimeter-Wave Network Analyzers 10 MHz to 110 GHz, with Extensions to 1.1 THz. Technical Overview
 Agilent Millimeter-Wave Network Analyzers 10 MHz to 110 GHz, with Extensions to 1.1 THz Technical Overview Single Sweep 10 MHz to 110 GHz Measurement Solution Agilent currently offers the N5251A single
MICROWAVE MICROWAVE TRAINING BENCH COMPONENT SPECIFICATIONS:
 Microwave section consists of Basic Microwave Training Bench, Advance Microwave Training Bench and Microwave Communication Training System. Microwave Training System is used to study all the concepts of
Reconfigurable 6 GHz RF Vector Signal Transceiver with 1 GHz Bandwidth
 CALIBRATION PROCEDURE PXIe-5840 Reconfigurable 6 GHz RF Vector Signal Transceiver with 1 GHz Bandwidth This document contains the verification procedures for the PXIe-5840 vector signal transceiver. Refer
Agilent. E5071C ENA Network Analyzer 9 khz to 4.5/6.5/8.5 GHz 100 khz to 4.5/6.5/8.5 GHz (with bias tees) 300 khz to 14/20 GHz (with bias tees)
 300 khz to 14/20 GHz (with bias tees)") Agilent E5071C ENA Network Analyzer 9 khz to 4.5/6.5/8.5 GHz 0 khz to 4.5/6.5/8.5 GHz (with bias tees) 300 khz to 14/20 GHz (with bias tees) E5091A Multiport Test Set E5092A Configurable Multiport Test
Agilent E5071C ENA Network Analyzer 9 khz to 4.5/6.5/8.5 GHz 0 khz to 4.5/6.5/8.5 GHz (with bias tees) 300 khz to 14/20 GHz (with bias tees) E5091A Multiport Test Set E5092A Configurable Multiport Test
Understanding RF and Microwave Analysis Basics
 Understanding RF and Microwave Analysis Basics Kimberly Cassacia Product Line Brand Manager Keysight Technologies Agenda µw Analysis Basics Page 2 RF Signal Analyzer Overview & Basic Settings Overview
R3477. Ideal for mobile communication applications including base stations and handsets, from the development stage to production and installation
 R3477 Signal Analyzers Ideal for mobile communication applications including base stations and handsets, from the development stage to production and installation Frequency range: 9 khz to 13.5 GHz World
DSA700 Series Spectrum Analyzer
 DSA700 Series Spectrum Analyzer Product Features: All-Digital IF Technology Frequency Range from 100 khz up to 1 GHz Min. -155 dbm Displayed Average Noise Level (Typ.) Min.
Cobalt Series 20 GHz EXTEND YOUR REACH TM
 Cobalt Series 20 GHz TM Frequency range: 100 khz - 20 GHz Wide output power range: -60 dbm to +10 dbm Dynamic range: 135 db (10 Hz IF bandwidth) typ. Measurement time per point: 10 µs per point, min typ.
Pulsed Measurement Capability of Copper Mountain Technologies VNAs
 Introduction Pulsed S-parameter measurements are important when testing a DUT at a higher power than it can handle without damage in the steady state, or when the normal operating mode of the DUT involves
product note Using Power Leveling to Control Test Port Output Power Product Note 8510XF XF Network Analyzer
 This literature was published years prior to the establishment of Agilent Technologies as a company independent from Hewlett-Packard and describes products or services now available through Agilent. It
Impedance 50 (75 connectors via adapters)
") VECTOR NETWORK ANALYZER PLANAR 304/1 DATA SHEET Frequency range: 300 khz to 3.2 GHz Measured parameters: S11, S21, S12, S22 Dynamic range of transmission measurement magnitude: 135 db Measurement time
VECTOR NETWORK ANALYZER PLANAR 304/1 DATA SHEET Frequency range: 300 khz to 3.2 GHz Measured parameters: S11, S21, S12, S22 Dynamic range of transmission measurement magnitude: 135 db Measurement time
Agilent Antenna and RCS Measurement Configurations Using PNA Microwave Network Analyzers. White Paper
 Agilent Antenna and RCS Measurement Configurations Using PNA Microwave Network Analyzers White Paper Abstract As technology changes, new and different techniques for measuring and characterizing antenna
Calibration and Accuracy in Millimeter Systems. Keith Anderson
 IMS2011 in Baltimore: A Perfect Match Calibration and Accuracy in Millimeter Systems Keith Anderson Agilent Technologies Copyright 2010 Agilent Technologies, Inc. Agenda Interfaces S-parameter calibration
Introduction to On-Wafer Characterization at Microwave Frequencies
 Introduction to On-Wafer Characterization at Microwave Frequencies Chinh Doan Graduate Student University of California, Berkeley Introduction to On-Wafer Characterization at Microwave Frequencies Dr.
Keysight Technologies PNA and PNA-L Series Microwave Network Analyzers
 Ihr Spezialist für Mess- und Prüfgeräte Keysight Technologies PNA and PNA-L Series Microwave Network Analyzers The standard in microwave network analysis datatec Ferdinand-Lassalle-Str. 52 72770 Reutlingen
Millimeter Wave Product Catalogue VivaTech Consulting S.A.R.L.
 VivaTech Consulting S.A.R.L. sales@vivatech.biz Telephone: +33 04 89 01 14 61 Fax: +33 04 93 87 08 66 Table of Contents Millimeter Wave Low Noise Amplifiers VTLNA Series...3 Millimeter Wave Power Amplifiers
10 V (Vpp) into 50 Ω load < 115 dbc (1 Hz) (typ.) 70 dbc (f < 1 MHz) AM, FM, pulse, PWM, 70 dbc + (f = 1 GHz)
 into 50 Ω load < 115 dbc (1 Hz) (typ.) 70 dbc (f < 1 MHz) AM, FM, pulse, PWM, 70 dbc + (f = 1 GHz)") /designation Frequency range Max. output power/voltage SSB phase noise Nonharmonics Modulation HMF arbitrary function generator 10 μhz to 25 MHz/50 MHz 10 V (Vpp) into 50 Ω load < 115 dbc (1 Hz) (typ.)
/designation Frequency range Max. output power/voltage SSB phase noise Nonharmonics Modulation HMF arbitrary function generator 10 μhz to 25 MHz/50 MHz 10 V (Vpp) into 50 Ω load < 115 dbc (1 Hz) (typ.)
FieldFox Handheld Education Series Part 3: Calibration Techniques for Precise Field Measurements
 FieldFox Handheld Education Series Part 3: Calibration Techniques for Precise Field Measurements FieldFox Handheld Education Series Interference Testing Cable and Antenna Measurements Calibration Techniques