HRV spectrum bands & single peak Coherence
|
|
|
- Cecily Lester
- 6 years ago
- Views:
Transcription


) during the breathing session.")
 The LF band (9 to 24 cycles per minute) The HF")

1 HRV spectrum bands & single peak Coherence HRV Coherence was originally defined as the size of the biggest LF peak compared to the amplitude of the broad HRV spectra (VLF+LF+HF). This way of analysis assumes you are breathing at a constant and fixed frequency (using a pacer around 0.1 Hz - 6 cycles/minute)) during the breathing session. 3 bands are usually described in HRV spectrum: The VLF band (up to 2.4 cycles per minute) The LF band (9 to 24 cycles per minute) The HF band (9 to 24 cycles per minute) If the frequency of your breathing is changing during the session, the LF peak will be larger and its size will be affected, resulting a lower coherence value. biggest LF peak

.")
 ratios.")
2 Broad spectra Coherence (FFT3) Another way to analyse the coherence from the heart HRV spectrum, is to analyse the relationship between all the peaks present in the spectrum. The more these peaks will be related to musical (or golden) ratios, the more your HRV will be coherent (harmonic inclusiveness, fractal). We have developped a new kind of mathematical analysis of 3rd order FFT (Fast Fourier Transform) of the broad HRV spectra. The musical relationship between the peaks is defined by musical (or golden) ratios. These ratios are related by the respective sizes of the peaks and their relative position in the spectrum. This could be visualized as an analysis for regularly spaced patterns in the shape of the purple line linking all the peaks of the spectrum.
 during the")

")


3 Evolution of HRV & PPG (blood pressure spectrum) during the last 4 minutes of the recording (averaging over increasing times intervals displays higher resolution) Also the vertical blue lines indicate golden ratio harmonics spacing - scaled to Planck; the vertical purple lines indicate the golden ratio harmonics scaled to your own frequency max peak.

, the lower harmonics (here in")


4 Breath coherence peak When you choose to synchronize breath at 0.1Hz, then in addition to indicating coherence/lf amplitude (here at 6 cycles/minute - 0.1Hz, related to Mayer Wave), the lower harmonics (here in light blue and orange) are said to indicate Short Term vs Long Term Stress levels. Also the vertical blue lines indicate golden ratio harmonics spacing - scaled to Planck; the vertical purple lines indicate the golden ratio harmonics scaled to your own frequency max peak.

, between the yellow LFppg")
 period.")


5 HRV waves summary 4 last minutes of HRV VLF, LF, HF and blood pressure waves. It is useful to note the phase lock (where the peaks line up), between the yellow LFppg (Mayer blood pressure wave) versus the light blue (HRV LF wave) period. This efficient entrainment of the bodies blood pressure resonance synchronize with the LF from the HRV electrical peak - can be a profound indicator of relaxation vs stress. See article: «how ithrve measure stress»
.")
6 0.1 Hz breathing records TRAINING Graphs LF_hrv & LF_ppg waves phase lock Example of efficient «relaxed» resonant entrainment, showing the green wave summation of the constructive combination of HRV LF wave and PPG LF wave (clicking on the FFT LFs button enables this display).


7 Example of less efficient «relaxed» resonant entrainment, showing the green wave summation of the constructive combination of HRV LF wave and PPG LF wave (clicking on the FFT LFs button enables this display).

8 Dash Board of a training breathing record TRAINING Graphs


9 Your mood Moon phase Musical Ratios of peaks in the HRV VLF, LF & HF spectrum analysis ratios (dots turn green when they fit a musical ratio).
.")
10 Third order spectrum analysis related to the coherence of the breathing. HRV analysis in pink; PPG/blood pressure wave analysis in green (only available with light sensors). The coherence is related to the amplitude of the peak.

11 Analysis of the musical keys in your heart/hrv. The amplitude of the displayed musical notes indicates the key signatures of your heart music! (you can tune to your lover, DJ or guru)


 LF")


12 Stress vs Relaxation indicator: % Fit between HRV and PPG (blood pressure) LF waves (only available with light sensors) Last 4 minutes Last 2 minutes Evolution Previous 2 minutes during 4 minutes COLORS: < 50% >=50% & < 60% Comparison 2 first minutes 2 last minutes >=60% & < 70% >= 70%


13 Last 4 minutes averaging TRAINING Graphs Coherence display options: full FFT3 coherence vs simple dominant harmonic amplitude coherence see : «How ithrve measures coherence»


 curve by simple single")
14 HRV % Coherence evolution over time Options to display graphs: - Long Term Stress Level - Short Term Stress Level - LF/HF - FFT3: heart/breath Coherence (by third order spectrum analysis) - Coher(ence) curve by simple single dominant harmonic amplitude


15 Evolution / History Coherence Breath Training 4 kinds of graphs

16 Breathing Practice history HISTORY displays 3 main curves: white curve is the size of the coherence peak (computed by single peak analysis); the red curve is the percentage of the worst part of the coherence graph; the green curve is the percentage of the best part of the coherence graph. The progress should show an increase of the white and green curves and a decrease of the red curve. [ZOOM] will display more or less data on the screen The lower little stars are related to the level you selected for the practice (beginner... expert).


17 Breathing Practice history All buttons can be used together or separately to compare all these parameters VLF Stress is related to short term stress; LF Stress is related to long term stress; HF Stress is related to emotional baggage. [ZOOM] will display more or less data on the screen The lower little stars are related to the level you selected for the practice (beginner... expert).
; pink curve is the coherence of the whole HRV spectrum (using a third order FFT of the HRV spectrum, allowing to")

18 Breathing Practice history HISTORY displays 3 curves: white curve is the size of the coherence peak - computed by single peak analysis (as in the previous graph); pink curve is the coherence of the whole HRV spectrum (using a third order FFT of the HRV spectrum, allowing to compute the whole HRV spectrum coherence - not only a single peak as in the previous analysis); blue curve is the LF/HF ratio. [ZOOM] will display more or less data on the screen The lower little stars are related to the level you selected for the practice (beginner... expert).
; red bars = HRV amplitude. [ZOOM] will display more or less data on the screen The lower little stars are related to the level you selected for the practice (beginner.")
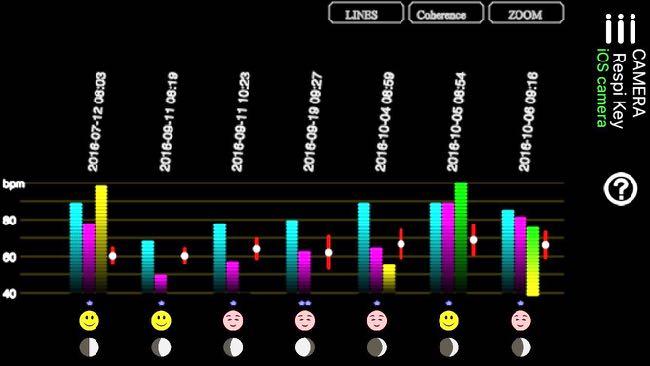
19 Breathing Practice history light blue = LF/HF ratio; pink = coherence (FFT3) of the whole HRV spectrum; yellow/green = single peak coherence (from yellow to green); white dots = average heart rate (bpm); red bars = HRV amplitude. [ZOOM] will display more or less data on the screen The lower little stars are related to the level you selected for the practice (beginner... expert).
HRV spectrum bands & single peak Coherence
 Coherence & Stress HRV spectrum bands & single peak Coherence HRV Coherence was originally defined as the size of the biggest LF peak compared to the amplitude of the broad HRV spectra (VLF+LF+HF). This
Spectral Analysis and Heart Rate Variability: Principles and Biomedical Applications. Dr. Harvey N. Mayrovitz
 Spectral Analysis and Heart Rate Variability: Principles and Biomedical Applications Dr. Harvey N. Mayrovitz Why Spectral Analysis? Detection and characterization of cyclical or periodic processes present
Experiment P01: Understanding Motion I Distance and Time (Motion Sensor)
") PASCO scientific Physics Lab Manual: P01-1 Experiment P01: Understanding Motion I Distance and Time (Motion Sensor) Concept Time SW Interface Macintosh file Windows file linear motion 30 m 500 or 700 P01
PASCO scientific Physics Lab Manual: P01-1 Experiment P01: Understanding Motion I Distance and Time (Motion Sensor) Concept Time SW Interface Macintosh file Windows file linear motion 30 m 500 or 700 P01
3.2 Measuring Frequency Response Of Low-Pass Filter :
 2.5 Filter Band-Width : In ideal Band-Pass Filters, the band-width is the frequency range in Hz where the magnitude response is at is maximum (or the attenuation is at its minimum) and constant and equal
APPENDIX T: Off Site Ambient Tests
 Appendix T1 APPENDIX T: Off Site Ambient Tests End of Blowholes road Substation access Surf Club East end of Blowholes Road Appendix T2 West end of Blowholes Road Appendix T3 West end of Blowholes Rd west
Acoustics, signals & systems for audiology. Week 4. Signals through Systems
 Acoustics, signals & systems for audiology Week 4 Signals through Systems Crucial ideas Any signal can be constructed as a sum of sine waves In a linear time-invariant (LTI) system, the response to a sinusoid
Lab Report #10 Alex Styborski, Daniel Telesman, and Josh Kauffman Group 12 Abstract
 Lab Report #10 Alex Styborski, Daniel Telesman, and Josh Kauffman Group 12 Abstract During lab 10, students carried out four different experiments, each one showing the spectrum of a different wave form.
ENGR 210 Lab 12: Sampling and Aliasing
 ENGR 21 Lab 12: Sampling and Aliasing In the previous lab you examined how A/D converters actually work. In this lab we will consider some of the consequences of how fast you sample and of the signal processing
Sound of Music. This lab is due at the end of the laboratory period
 Name: Partner(s): 1114 section: Desk # Date: Purpose Sound of Music This lab is due at the end of the laboratory period To create and play musical notes using standing waves in a pipe closed at one end.
Physics 1021 Experiment 3. Sound and Resonance
 1 Physics 1021 Sound and Resonance 2 Sound and Resonance Introduction In today's experiment, you will examine beat frequency using tuning forks, a microphone and LoggerPro. You will also produce resonance
Experiment P02: Understanding Motion II Velocity and Time (Motion Sensor)
") PASCO scientific Physics Lab Manual: P02-1 Experiment P02: Understanding Motion II Velocity and Time (Motion Sensor) Concept Time SW Interface Macintosh file Windows file linear motion 30 m 500 or 700
PASCO scientific Physics Lab Manual: P02-1 Experiment P02: Understanding Motion II Velocity and Time (Motion Sensor) Concept Time SW Interface Macintosh file Windows file linear motion 30 m 500 or 700
Acoustics and Fourier Transform Physics Advanced Physics Lab - Summer 2018 Don Heiman, Northeastern University, 1/12/2018
 1 Acoustics and Fourier Transform Physics 3600 - Advanced Physics Lab - Summer 2018 Don Heiman, Northeastern University, 1/12/2018 I. INTRODUCTION Time is fundamental in our everyday life in the 4-dimensional
Next Generation Biometric Sensing in Wearable Devices
 Next Generation Biometric Sensing in Wearable Devices C O L I N T O M P K I N S D I R E C T O R O F A P P L I C AT I O N S E N G I N E E R I N G S I L I C O N L A B S C O L I N.T O M P K I N S @ S I L
Sound. Use a Microphone to analyze the frequency components of a tuning fork. Record overtones produced with a tuning fork.
 Sound PART ONE - TONES In this experiment, you will analyze various common sounds. You will use a Microphone connected to a computer. Logger Pro will display the waveform of each sound, and will perform
From Ladefoged EAP, p. 11
 The smooth and regular curve that results from sounding a tuning fork (or from the motion of a pendulum) is a simple sine wave, or a waveform of a single constant frequency and amplitude. From Ladefoged
Reading: Johnson Ch , Ch.5.5 (today); Liljencrants & Lindblom; Stevens (Tues) reminder: no class on Thursday.
; Liljencrants & Lindblom; Stevens (Tues) reminder: no class on Thursday.") L105/205 Phonetics Scarborough Handout 7 10/18/05 Reading: Johnson Ch.2.3.3-2.3.6, Ch.5.5 (today); Liljencrants & Lindblom; Stevens (Tues) reminder: no class on Thursday Spectral Analysis 1. There are
L105/205 Phonetics Scarborough Handout 7 10/18/05 Reading: Johnson Ch.2.3.3-2.3.6, Ch.5.5 (today); Liljencrants & Lindblom; Stevens (Tues) reminder: no class on Thursday Spectral Analysis 1. There are
Biosignal filtering and artifact rejection, Part II. Biosignal processing, S Autumn 2017
 Biosignal filtering and artifact rejection, Part II Biosignal processing, 521273S Autumn 2017 Example: eye blinks interfere with EEG EEG includes ocular artifacts that originates from eye blinks EEG: electroencephalography
Validation of the Happify Breather Biofeedback Exercise to Track Heart Rate Variability Using an Optical Sensor
 Phyllis K. Stein, PhD Associate Professor of Medicine, Director, Heart Rate Variability Laboratory Department of Medicine Cardiovascular Division Validation of the Happify Breather Biofeedback Exercise
Chapter 5. Signal Analysis. 5.1 Denoising fiber optic sensor signal
 Chapter 5 Signal Analysis 5.1 Denoising fiber optic sensor signal We first perform wavelet-based denoising on fiber optic sensor signals. Examine the fiber optic signal data (see Appendix B). Across all
Determination of an unknown frequency (beats)
") Teacher's/Lecturer's Sheet Determination of an unknown frequency (beats) (Item No.: P6011900) Curricular Relevance Area of Expertise: Physics Education Level: Age 16-19 Topic: Acoustics Subtopic: Wave
Teacher's/Lecturer's Sheet Determination of an unknown frequency (beats) (Item No.: P6011900) Curricular Relevance Area of Expertise: Physics Education Level: Age 16-19 Topic: Acoustics Subtopic: Wave
Advanced Lab LAB 6: Signal Acquisition & Spectrum Analysis Using VirtualBench DSA Equipment: Objectives:
 Advanced Lab LAB 6: Signal Acquisition & Spectrum Analysis Using VirtualBench DSA Equipment: Pentium PC with National Instruments PCI-MIO-16E-4 data-acquisition board (12-bit resolution; software-controlled
Signals & Systems for Speech & Hearing. Week 6. Practical spectral analysis. Bandpass filters & filterbanks. Try this out on an old friend
 Signals & Systems for Speech & Hearing Week 6 Bandpass filters & filterbanks Practical spectral analysis Most analogue signals of interest are not easily mathematically specified so applying a Fourier
Worksheet for the afternoon course Tune measurements simulated with a DSP card
 Worksheet for the afternoon course Tune measurements simulated with a DSP card CAS Tuusula, June 2018 D. Alves, S. Sadovich, H. Schmickler 1. Introduction In this course we will be replacing the betatron
Activity P40: Driven Harmonic Motion - Mass on a Spring (Force Sensor, Motion Sensor, Power Amplifier)
") Name Class Date Activity P40: Driven Harmonic Motion - Mass on a Spring (Force Sensor, Motion Sensor, Power Amplifier) Concept DataStudio ScienceWorkshop (Mac) ScienceWorkshop (Win) Harmonic motion P40
Name Class Date Activity P40: Driven Harmonic Motion - Mass on a Spring (Force Sensor, Motion Sensor, Power Amplifier) Concept DataStudio ScienceWorkshop (Mac) ScienceWorkshop (Win) Harmonic motion P40
Presented on. Mehul Supawala Marine Energy Sources Product Champion, WesternGeco
 Presented on Marine seismic acquisition and its potential impact on marine life has been a widely discussed topic and of interest to many. As scientific knowledge improves and operational criteria evolve,
Objective Explain design concepts used to create digital graphics.
 Objective 102.01 Explain design concepts used to create digital graphics. PART 1: ELEMENTS OF DESIGN o Color o Line o Shape o Texture o Watch this video on Fundamentals of Design. 2 COLOR o Helps identify
LAB #7: Digital Signal Processing
 LAB #7: Digital Signal Processing Equipment: Pentium PC with NI PCI-MIO-16E-4 data-acquisition board NI BNC 2120 Accessory Box VirtualBench Instrument Library version 2.6 Function Generator (Tektronix
Relation between HF HRV and Respiratory Frequency
 Proc. of Int. Conf. on Emerging Trends in Engineering and Technology Relation between HF HRV and Respiratory Frequency A. Anurupa, B. Dr. Mandeep Singh Ambedkar Polytechnic/I& C Department, Delhi, India
Test Equipment. PHYS 401 Physics of Ham Radio
 Test Equipment Voltmeter - an instrument that is used to measure voltage. It is used in parallel with a circuit to be measured. a series resistor extends the range of the meter. Ammeter - an instrument
Testing Sensors & Actors Using Digital Oscilloscopes
 Testing Sensors & Actors Using Digital Oscilloscopes APPLICATION BRIEF February 14, 2012 Dr. Michael Lauterbach & Arthur Pini Summary Sensors and actors are used in a wide variety of electronic products
8A. ANALYSIS OF COMPLEX SOUNDS. Amplitude, loudness, and decibels
 8A. ANALYSIS OF COMPLEX SOUNDS Amplitude, loudness, and decibels Last week we found that we could synthesize complex sounds with a particular frequency, f, by adding together sine waves from the harmonic
Complex Sounds. Reading: Yost Ch. 4
 Complex Sounds Reading: Yost Ch. 4 Natural Sounds Most sounds in our everyday lives are not simple sinusoidal sounds, but are complex sounds, consisting of a sum of many sinusoids. The amplitude and frequency
Experiment 8: An AC Circuit
 Experiment 8: An AC Circuit PART ONE: AC Voltages. Set up this circuit. Use R = 500 Ω, L = 5.0 mh and C =.01 μf. A signal generator built into the interface provides the emf to run the circuit from Output
Experiment No. 2 Pre-Lab Signal Mixing and Amplitude Modulation
 Experiment No. 2 Pre-Lab Signal Mixing and Amplitude Modulation Read the information presented in this pre-lab and answer the questions given. Submit the answers to your lab instructor before the experimental
MASSACHUSETTS INSTITUTE OF TECHNOLOGY /6.071 Introduction to Electronics, Signals and Measurement Spring 2006
 MASSACHUSETTS INSTITUTE OF TECHNOLOGY.071/6.071 Introduction to Electronics, Signals and Measurement Spring 006 Lab. Introduction to signals. Goals for this Lab: Further explore the lab hardware. The oscilloscope
SigCalRP User s Guide
 SigCalRP User s Guide . . Version 4.2 Copyright 1997 TDT. All rights reserved. No part of this manual may be reproduced or transmitted in any form or by any means, electronic or mechanical, for any purpose
14 fasttest. Multitone Audio Analyzer. Multitone and Synchronous FFT Concepts
 Multitone Audio Analyzer The Multitone Audio Analyzer (FASTTEST.AZ2) is an FFT-based analysis program furnished with System Two for use with both analog and digital audio signals. Multitone and Synchronous
ZONESCAN net Version 1.4.0
 ZONESCAN net.0 REV 1. JW ZONESCAN net 2 / 56 Table of Contents 1 Introduction... 5 1.1 Purpose and field of use of the software... 5 1.2 Software functionality... 5 1.3 Function description... 6 1.3.1
BIOMEDICAL SIGNAL PROCESSING (BMSP) TOOLS
 TOOLS") BIOMEDICAL SIGNAL PROCESSING (BMSP) TOOLS A Guide that will help you to perform various BMSP functions, for a course in Digital Signal Processing. Pre requisite: Basic knowledge of BMSP tools : Introduction
BIOMEDICAL SIGNAL PROCESSING (BMSP) TOOLS A Guide that will help you to perform various BMSP functions, for a course in Digital Signal Processing. Pre requisite: Basic knowledge of BMSP tools : Introduction
Improved pattern for testing optical transmitters. Piers Dawe Mellanox
 Improved pattern for testing optical transmitters Piers Dawe Mellanox Introduction Recent optical transmitter and receiver specs in 82.3 are defined with long scrambled signals. Measurements are representative
Tutorial for Force Spectrum Analysis using CAEPIPE
 Tutorial for Force Spectrum Analysis using CAEPIPE The following are the Steps for performing the Force Spectrum Analysis using CAEPIPE. General Force spectrum analyses are generally performed to determine
Experiment P20: Driven Harmonic Motion - Mass on a Spring (Force Sensor, Motion Sensor, Power Amplifier)
") PASCO scientific Physics Lab Manual: P20-1 Experiment P20: - Mass on a Spring (Force Sensor, Motion Sensor, Power Amplifier) Concept Time SW Interface Macintosh file Windows file harmonic motion 45 m 700
PASCO scientific Physics Lab Manual: P20-1 Experiment P20: - Mass on a Spring (Force Sensor, Motion Sensor, Power Amplifier) Concept Time SW Interface Macintosh file Windows file harmonic motion 45 m 700
Experiment P55: Light Intensity vs. Position (Light Sensor, Motion Sensor)
") PASCO scientific Vol. 2 Physics Lab Manual: P55-1 Experiment P55: (Light Sensor, Motion Sensor) Concept Time SW Interface Macintosh file Windows file illuminance 30 m 500/700 P55 Light vs. Position P55_LTVM.SWS
PASCO scientific Vol. 2 Physics Lab Manual: P55-1 Experiment P55: (Light Sensor, Motion Sensor) Concept Time SW Interface Macintosh file Windows file illuminance 30 m 500/700 P55 Light vs. Position P55_LTVM.SWS
Name Date: Course number: MAKE SURE TA & TI STAMPS EVERY PAGE BEFORE YOU START EXPERIMENT 10. Electronic Circuits
 Laboratory Section: Last Revised on September 21, 2016 Partners Names: Grade: EXPERIMENT 10 Electronic Circuits 1. Pre-Laboratory Work [2 pts] 1. How are you going to determine the capacitance of the unknown
Getting Started. MSO/DPO Series Oscilloscopes. Basic Concepts
 Getting Started MSO/DPO Series Oscilloscopes Basic Concepts 001-1523-00 Getting Started 1.1 Getting Started What is an oscilloscope? An oscilloscope is a device that draws a graph of an electrical signal.
Experiment P49: Transistor Lab 2 Current Gain: The NPN Emitter-Follower Amplifier (Power Amplifier, Voltage Sensor)
") PASCO scientific Vol. 2 Physics Lab Manual: P49-1 Experiment P49: Transistor Lab 2 Current Gain: The NPN Emitter-Follower Amplifier (Power Amplifier, Voltage Sensor) Concept Time SW Interface Macintosh
PASCO scientific Vol. 2 Physics Lab Manual: P49-1 Experiment P49: Transistor Lab 2 Current Gain: The NPN Emitter-Follower Amplifier (Power Amplifier, Voltage Sensor) Concept Time SW Interface Macintosh
ZOOM Software Measurement and Graph Types
 ZOOM Software Measurement and Graph Types AN002 The ZOOM software operates under two measurement modes: Automatic and Test. The Automatic mode records data automatically at user-defined intervals or alarm
Glossary of VCO terms
 Glossary of VCO terms VOLTAGE CONTROLLED OSCILLATOR (VCO): This is an oscillator designed so the output frequency can be changed by applying a voltage to its control port or tuning port. FREQUENCY TUNING
Music 171: Amplitude Modulation
 Music 7: Amplitude Modulation Tamara Smyth, trsmyth@ucsd.edu Department of Music, University of California, San Diego (UCSD) February 7, 9 Adding Sinusoids Recall that adding sinusoids of the same frequency
Setting up a Multi sine impedance measurement
 Setting up a Multi sine impedance measurement Case study: how do I setup a Multi Sine impedance measurement? 1 Single sine vs Multi sine Traditional electrochemical impedance spectroscopy measurements
INTRODUCTION TO ACOUSTIC PHONETICS 2 Hilary Term, week 6 22 February 2006
 1. Resonators and Filters INTRODUCTION TO ACOUSTIC PHONETICS 2 Hilary Term, week 6 22 February 2006 Different vibrating objects are tuned to specific frequencies; these frequencies at which a particular
Objectives. Abstract. This PRO Lesson will examine the Fast Fourier Transformation (FFT) as follows:
 as follows:") : FFT Fast Fourier Transform This PRO Lesson details hardware and software setup of the BSL PRO software to examine the Fast Fourier Transform. All data collection and analysis is done via the BIOPAC MP35
: FFT Fast Fourier Transform This PRO Lesson details hardware and software setup of the BSL PRO software to examine the Fast Fourier Transform. All data collection and analysis is done via the BIOPAC MP35
The Tracking and Trending Module collects the reduced data for trending in a single datafile (around 10,000 coils typical working maximum).
.") AVAS VIBRATION MONITORING SYSTEM TRACKING AND TRENDING MODULE 1. Overview of the AVAS Tracking and Trending Module The AVAS Tracking and Trending Module performs a data-acquisition and analysis activity,
AVAS VIBRATION MONITORING SYSTEM TRACKING AND TRENDING MODULE 1. Overview of the AVAS Tracking and Trending Module The AVAS Tracking and Trending Module performs a data-acquisition and analysis activity,
Physics 115 Lecture 13. Fourier Analysis February 22, 2018
 Physics 115 Lecture 13 Fourier Analysis February 22, 2018 1 A simple waveform: Fourier Synthesis FOURIER SYNTHESIS is the summing of simple waveforms to create complex waveforms. Musical instruments typically
PART I: The questions in Part I refer to the aliasing portion of the procedure as outlined in the lab manual.
 Lab. #1 Signal Processing & Spectral Analysis Name: Date: Section / Group: NOTE: To help you correctly answer many of the following questions, it may be useful to actually run the cases outlined in the
Chapter 5. Frequency Domain Analysis
 Chapter 5 Frequency Domain Analysis CHAPTER 5 FREQUENCY DOMAIN ANALYSIS By using the HRV data and implementing the algorithm developed for Spectral Entropy (SE), SE analysis has been carried out for healthy,
LRC Circuit PHYS 296 Your name Lab section
 LRC Circuit PHYS 296 Your name Lab section PRE-LAB QUIZZES 1. What will we investigate in this lab? 2. Figure 1 on the following page shows an LRC circuit with the resistor of 1 Ω, the capacitor of 33
Experiences on using gapless waveform data & synchronized harmonic phasors
 1 Panel Session: New Techniques for Power Quality Measurement and Field Experiences 15PESGM3040 Experiences on using gapless waveform data & synchronized harmonic phasors Wilsun Xu University of Alberta
Musical Acoustics, C. Bertulani. Musical Acoustics. Lecture 13 Timbre / Tone quality I
 1 Musical Acoustics Lecture 13 Timbre / Tone quality I Waves: review 2 distance x (m) At a given time t: y = A sin(2πx/λ) A -A time t (s) At a given position x: y = A sin(2πt/t) Perfect Tuning Fork: Pure
Arterial pulse waves measured with EMFi and PPG sensors and comparison of the pulse waveform spectral and decomposition analysis in healthy subjects
 Arterial pulse waves measured with EMFi and PPG sensors and comparison of the pulse waveform spectral and decomposition analysis in healthy subjects Matti Huotari 1, Antti Vehkaoja 2, Kari Määttä 1, Juha
SigCal32 User s Guide Version 3.0
 SigCal User s Guide . . SigCal32 User s Guide Version 3.0 Copyright 1999 TDT. All rights reserved. No part of this manual may be reproduced or transmitted in any form or by any means, electronic or mechanical,
Spectrum Analysis: The FFT Display
 Spectrum Analysis: The FFT Display Equipment: Capstone, voltage sensor 1 Introduction It is often useful to represent a function by a series expansion, such as a Taylor series. There are other series representations
Properties of Sound. Goals and Introduction
 Properties of Sound Goals and Introduction Traveling waves can be split into two broad categories based on the direction the oscillations occur compared to the direction of the wave s velocity. Waves where
Lab 8: Beer Bottle Symphony
 Lab 8. Beer Bottle Symphony Lab 8: Beer Bottle Symphony Introduction In college, a group of students and professors get together to build a beer bottle symphony. Beer bottles of various sizes and shapes
The oscilloscope and RC filters
 (ta initials) first name (print) last name (print) brock id (ab17cd) (lab date) Experiment 4 The oscilloscope and C filters The objective of this experiment is to familiarize the student with the workstation
A Brief Introduction to the Discrete Fourier Transform and the Evaluation of System Transfer Functions
 MEEN 459/659 Notes 6 A Brief Introduction to the Discrete Fourier Transform and the Evaluation of System Transfer Functions Original from Dr. Joe-Yong Kim (ME 459/659), modified by Dr. Luis San Andrés
Compulsory Exercise no. 1 Deadline: 1 May 2014
 Side 1 hans@phys.au.dk 6 April 014 Compulsory Exercise no. 1 Deadline: 1 May 014 The goal of the present compulsory exercise is to construct software that can be used for time series analysis. In order
ZONESCAN net Version 1.4.1
 ZONESCAN net REV 3 JW ZONESCAN net 2 / 59 Table of Contents 1 Introduction... 5 1.1 Purpose and field of use of the software... 5 1.2 Software functionality... 5 1.3 Function description... 6 1.3.1 Structure...
Your first NMR measurement
 Your first NMR measurement Introduction Select 10mM water in D2O as NMR sample. The NMR spectrum of such sample consists of only two signals: the water signal and the peak of the reference (TSP). Follow
Microtremor Array Measurements and Three-component Microtremor Measurements in San Francisco Bay Area
 Microtremor Array Measurements and Three-component Microtremor Measurements in San Francisco Bay Area K. Hayashi & D. Underwood Geometrics, Inc., United States SUMMARY: Microtremor array measurements and
 RC_Circuits RC Circuits Lab Q1 Open the Logger Pro program RC_RL_Circuits via the Logger Launcher icon on your desktop. RC Circuits Lab Part1 Part 1: Measuring Voltage and Current in an RC Circuit 1. 2.
Advanced Machine Diagnostics and Condition Monitoring
 The Australian Acoustical Society and the Department of Mechanical Engineering, Curtin University, present: Acoustics 2012 Fremantle. Pre-conference workshop on: Advanced Machine Diagnostics and Condition
Copyright 2017 by Turbomachinery Laboratory, Texas A&M Engineering Experiment Station
 HIGH FREQUENCY VIBRATIONS ON GEARS 46 TH TURBOMACHINERY & 33 RD PUMP SYMPOSIA Dietmar Sterns Head of Engineering, High Speed Gears RENK Aktiengesellschaft Augsburg, Germany Dr. Michael Elbs Manager of
The RC30 Sound. 1. Preamble. 2. The basics of combustion noise analysis
 1. Preamble The RC30 Sound The 1987 to 1990 Honda VFR750R (RC30) has a sound that is almost as well known as the paint scheme. The engine sound has been described by various superlatives. I like to think
Transfer Function (TRF)
") (TRF) Module of the KLIPPEL R&D SYSTEM S7 FEATURES Combines linear and nonlinear measurements Provides impulse response and energy-time curve (ETC) Measures linear transfer function and harmonic distortions
(TRF) Module of the KLIPPEL R&D SYSTEM S7 FEATURES Combines linear and nonlinear measurements Provides impulse response and energy-time curve (ETC) Measures linear transfer function and harmonic distortions
2128. Study of Sarasvati Veena a South Indian musical instrument using its vibro-acoustic signatures
 2128. Study of Sarasvati Veena a South Indian musical instrument using its vibro-acoustic signatures Akshay Sundar 1, Hancel P V 2, Pravin Singru 3, Radhika Vathsan 4 BITS Pilani KK Birla Goa Campus, NH
INTRODUCTION TO AC FILTERS AND RESONANCE
 AC Filters & Resonance 167 Name Date Partners INTRODUCTION TO AC FILTERS AND RESONANCE OBJECTIVES To understand the design of capacitive and inductive filters To understand resonance in circuits driven
Introduction. Physics 1CL WAVES AND SOUND FALL 2009
 Introduction This lab and the next are based on the physics of waves and sound. In this lab, transverse waves on a string and both transverse and longitudinal waves on a slinky are studied. To describe
A bluffer s guide to Radar
 A bluffer s guide to Radar Andy French December 2009 We may produce at will, from a sending station, an electrical effect in any particular region of the globe; (with which) we may determine the relative
DIGITAL SIGNAL PROCESSING TOOLS VERSION 4.0
 (Digital Signal Processing Tools) Indian Institute of Technology Roorkee, Roorkee DIGITAL SIGNAL PROCESSING TOOLS VERSION 4.0 A Guide that will help you to perform various DSP functions, for a course in
DESIGN, CONSTRUCTION, AND THE TESTING OF AN ELECTRIC MONOCHORD WITH A TWO-DIMENSIONAL MAGNETIC PICKUP. Michael Dickerson
 DESIGN, CONSTRUCTION, AND THE TESTING OF AN ELECTRIC MONOCHORD WITH A TWO-DIMENSIONAL MAGNETIC PICKUP by Michael Dickerson Submitted to the Department of Physics and Astronomy in partial fulfillment of
Voltage Current and Resistance II
 Voltage Current and Resistance II Equipment: Capstone with 850 interface, analog DC voltmeter, analog DC ammeter, voltage sensor, RLC circuit board, 8 male to male banana leads 1 Purpose This is a continuation
Introduction. In the frequency domain, complex signals are separated into their frequency components, and the level at each frequency is displayed
 SPECTRUM ANALYZER Introduction A spectrum analyzer measures the amplitude of an input signal versus frequency within the full frequency range of the instrument The spectrum analyzer is to the frequency
SPEECH AND SPECTRAL ANALYSIS
 SPEECH AND SPECTRAL ANALYSIS 1 Sound waves: production in general: acoustic interference vibration (carried by some propagation medium) variations in air pressure speech: actions of the articulatory organs
MUSC 316 Sound & Digital Audio Basics Worksheet
 MUSC 316 Sound & Digital Audio Basics Worksheet updated September 2, 2011 Name: An Aggie does not lie, cheat, or steal, or tolerate those who do. By submitting responses for this test you verify, on your
GROUND MOTION IN THE INTERACTION. ensured that the final focus quadrupoles on both. rms amplitudes higher than some fraction of the
 GROUND MOTION IN THE INTERACTION REGION C.Montag, DESY Abstract Ground motion and according quadrupole vibration is of great importance for all Linear Collider schemes currently under study, since these
Advanced Test Equipment Rentals ATEC (2832)
") Established 1981 Advanced Test Equipment Rentals www.atecorp.com 800-404-ATEC (2832) Electric and Magnetic Field Measurement For Isotropic Measurement of Magnetic and Electric Fields Evaluation of Field
Established 1981 Advanced Test Equipment Rentals www.atecorp.com 800-404-ATEC (2832) Electric and Magnetic Field Measurement For Isotropic Measurement of Magnetic and Electric Fields Evaluation of Field
Problems from the 3 rd edition
 (2.1-1) Find the energies of the signals: a) sin t, 0 t π b) sin t, 0 t π c) 2 sin t, 0 t π d) sin (t-2π), 2π t 4π Problems from the 3 rd edition Comment on the effect on energy of sign change, time shifting
Fourier Signal Analysis
 Part 1B Experimental Engineering Integrated Coursework Location: Baker Building South Wing Mechanics Lab Experiment A4 Signal Processing Fourier Signal Analysis Please bring the lab sheet from 1A experiment
Rub & Buzz Detection with Golden Unit AN 23
 Rub & Buzz etection with Golden Unit A 23 Application ote to the KLIPPEL R& SYSTEM Rub & buzz effects are unwanted, irregular nonlinear distortion effects. They are caused by mechanical or structural defects
Part I. Open Open Pipes. A 35 cm long string is played at its fundamental frequency.
 Part I Open Open Pipes A 35 cm long pipe is played at its fundamental frequency. 1. What does the waveform look like inside the pipe? 2. What is this frequency s wavelength? 3. What is this frequency being
What frequencies does the larynx produce?
 HPP Activity 48v3 What frequencies does the larynx produce? Exploration Open up the DataStudio file with the microphone setup: SoundBasic.ds. Make the oscilloscope view active. Press Start and hum an ahhh
Lab 10 - INTRODUCTION TO AC FILTERS AND RESONANCE
 159 Name Date Partners Lab 10 - INTRODUCTION TO AC FILTERS AND RESONANCE OBJECTIVES To understand the design of capacitive and inductive filters To understand resonance in circuits driven by AC signals
Chapter 9: Color. What is Color? Wavelength is a property of an electromagnetic wave in the frequency range we call light
 Chapter 9: Color What is color? Color mixtures Intensity-distribution curves Additive Mixing Partitive Mixing Specifying colors RGB Color Chromaticity What is Color? Wavelength is a property of an electromagnetic
PHYSICS LAB. Sound. Date: GRADE: PHYSICS DEPARTMENT JAMES MADISON UNIVERSITY
 PHYSICS LAB Sound Printed Names: Signatures: Date: Lab Section: Instructor: GRADE: PHYSICS DEPARTMENT JAMES MADISON UNIVERSITY Revision August 2003 Sound Investigations Sound Investigations 78 Part I -
HIGH FREQUENCY FILTERING OF 24-HOUR HEART RATE DATA
 HIGH FREQUENCY FILTERING OF 24-HOUR HEART RATE DATA Albinas Stankus, Assistant Prof. Mechatronics Science Institute, Klaipeda University, Klaipeda, Lithuania Institute of Behavioral Medicine, Lithuanian
RDworks and Basic Rabbit Laser Operation Tutorial
 RDworks and Basic Rabbit Laser Operation Tutorial File Setup Layer color is how the Rabbit Software designates different operations so, regardless of design software, you will want to organize geometry
Spectrum Analyzer TEN MINUTE TUTORIAL
 Spectrum Analyzer TEN MINUTE TUTORIAL November 4, 2011 Summary The Spectrum Analyzer option allows users who are familiar with RF spectrum analyzers to start using the FFT with little or no concern about
EWGAE 2010 Vienna, 8th to 10th September
 EWGAE 2010 Vienna, 8th to 10th September Frequencies and Amplitudes of AE Signals in a Plate as a Function of Source Rise Time M. A. HAMSTAD University of Denver, Department of Mechanical and Materials
SIA Software Company, Inc.
 SIA Software Company, Inc. One Main Street Whitinsville, MA 01588 USA SIA-Smaart Pro Real Time and Analysis Module Case Study #2: Critical Listening Room Home Theater by Sam Berkow, SIA Acoustics / SIA