Wonkyu Song Kyle Carpenter May 3, 2013
|
|
|
- Logan Bryan
- 6 years ago
- Views:
Transcription
1 Wonkyu Song Kyle Carpenter May 3, 2013 Don Cripps Electrical and Computer Engineering Department Utah State University Dr. Cripps Enclosed is the final report for our senior design project. We have chosen to build an FM radio simultaneous digital demodulator under the guidance of Dr. Jake Gunther. As radio listeners, our team is all too familiar with the long-time problem that FM radio presents to us and others like us: we must choose to enjoy just one program out of two being broadcasted simultaneously. To resolve this, we have undertaken a digital signal processing (DSP) approach to FM radio demodulation for the purpose of demodulating multiple FM radio channels at once. Although this could be accomplished with an analog design, DSP allows us easier radio tunability and greater flexibility in our demodulation scheme. Thank you for your help and support throughout the semester. We look forward to your feedback of the final results of our project. Sincerely, Wonkyu Song Kyle Carpenter 1
2 Senior Design Final Report FM Simultaneous Digital Demodulator Prepared for ECE 4850/5680 Prepared by Wonkyu Song Kyle Carpenter May 3, 2013 Instructor Approval Don Cripps Electrical and Computer Engineering Department Utah State University Date Instructor Approval Jake Gunther Electrical and Computer Engineering Department Utah State University Date 2
3 Abstract This project explored the idea of a software-defined radio. By using digital signal processing to filter, down-sample, and demodulate a radio signal, simultaneous channel recovery of the FM band was achieved. The digital signal processing code was written in both MATLAB and the C++ language. Free software called GNURadio Companion was used to interface with the Universal Software Radio Peripheral that we used. The ultimate goal of this project was to create a real time processing block inside of the GNURadio Companion workspace environment by slightly altering our C++ code. Because we were not able to obtain real time performance with the program that we created, we abandoned this final step of the project. We do believe that with certain code optimizations and by implementing our code on a DSP chip, real time performance of our software-defined radio could be achieved. 3
4 Acknowledgments This project was made possible by the contributions of several individuals. We would like to give special recognition to Dr. Gunther, who patiently helped us through all the little issues that came up. He always made time for us and gave us a lot of ideas to implement. He also made sure that we had all the hardware resources that we might need. Dr. Cripps was also very helpful whenever we discussed our project with him, particularly during the design review stage. Laura Vernon was also very encouraging to us throughout the development of this project, and her feedback helped us tremendously in our writing, presentation, and professionalism. 4
5 Table of Contents 1. Introduction Subject and Purpose Problem Statement Conceptual and Preliminary Design Problem Analysis Problem Review Summary of Specifications Discussion of Main Features Summary of Engineering Approach Organization and Summary of Report Decision Analysis Solution Alternatives Discussion of Decision Analysis and Final Design Theory of Operation Analog RF Receiver Digital FM Demodulator Basic Solution Description Schematics and Flow Sheets RF Front End USRP and GNU Radio ADC DDC DDS LPF Down-sampler Demodulation Calculations Modulation and Demodulation RF, LO, IF Specifications General Formulas Component-Level Specifications Antenna Preselection Filter Low Noise Amplifier Mixer Voltage Controlled Oscillator Intermediate Frequency Filter SMA Connectors
6 4. Performance Optimization and Design of System Components Description of Components Antenna Preselection Filter Low Noise Amplifier Mixer Voltage Controlled Oscillator Intermediate Frequency Filter Design Criteria Used Linearity Analysis Noise Analysis Mixer Spur Analysis Rejection of Image Band Excess Gain Real Time Application Discussion of Design Details Frequency Shifting Filter Design Summary of Final Design Results & Performance Evaluation Design Successes Problems Encountered Project Implementation and Assessment Operational Test Results Evaluation of Results Suggested Changes Final Scope of Work What Has Been Done What Needs to Be Done Lessons Learned Project Management Issues Other Issues Component Manufacture Cost Estimation System Cost Design Cost Project Management Summary Tasks Completed Tasks to Be Completed Gantt Chart Personnel
7 10. Conclusion Main Points Recommendations Contact Information Appendix A. MATLAB Code Appendix B. C++ Code Appendix C. MATLAB Spur Analysis Code Appendix D. Resumes Appendix E. Data Sheets (Attached in PDF Form) 7
8 List of Tables Table 1. Significant Power Signals 25 Table 2. Cascaded Analysis Table 3. Budget
9 List of Equations Equation 1 FM Modulation 23 Equation 2 Convolution Definition 24 Equation 3 FM Demodulation Equation 4 Intermediate Frequency Equation 5 Image Frequency. 24 9
10 List of Figures Figure 3.0 System Overview...19 Figure 3.1 Analog Front End Figure 3.2 USRP DDC Block Diagram. 21 Figure 3.3 Demodulation Diagram Figure 3.4 Monopole Antenna Figure 3.5 Preselection Filter. 26 Figure 3.6 Low Noise Amplifier 26 Figure 3.7 Mixer 27 Figure 3.8 Voltage Controlled Oscillator.. 28 Figure 3.9 Intermediate Frequency Filter Figure 3.10 SMA Cable. 29 Figure 4.1 Band Pass Filter Magnitude Bode Plot 30 Figure 4.2 Preselection Filter Considerations 30 Figure 4.3 Intermediate Frequency Filter.. 33 Figure 4.4 NoiseCalc Analysis.. 36 Figure 4.5 Mixer Spurs.. 37 Figure 4.6 Decimation Filters 40 Figure 4.7 Received 6 MHz Spectrum.. 41 Figure MHz Shifted to BB Figure MHz Shifted to BB Figure 4.10 Channel One khz FFT Plot Figure 4.11 Channel Two khz FFT Plot...43 Figure 5.1 BPF1 Low Test Sign. Gen 48 Figure 5.2 BPF1 Low Test Spectrum
11 Figure 5.3 BPF1 High Test Sign. Gen Figure 5.4 BPF1 High Test Spectrum Figure 5.5 BPF2 Low Test Sign. Gen 49 Figure 5.6 BPF2 Low Test Spectrum Figure 5.7 BPF2 High Test Sign. Gen Figure 5.8 BPF2 High Test Spectrum Figure 5.9 DC Supply Low VCO Test Figure 5.10 Low VCO Test Spectrum Anal.. 50 Figure 5.11 DC Supply High VCO Test 50 Figure 5.12 High VCO Test Spectrum Anal Figure 5.13 Antenna Output.. 51 Figure 5.14 Preselection Filter Output Figure 5.15 Amplifier Output Figure 5.16 Mixer Output.. 51 Figure 5.17 IF Filter Output Figure 5.18 Receiver Front End w/ USRP Figure 9.1 Gantt Chart
12 1. Introduction Radio frequency (RF) modulation is a technique that has been around for a long time. Modulation is the process of changing specific properties of a high frequency carrier signal with a modulating signal. The modulated carrier signal is transmitted at some high frequency and demodulated in an RF receiver. The receiver s demodulation process leaves the original modulating signal which contains the desired information. In RF communications, it so happens that the modulated carrier frequency can range from roughly 3 khz to 300 GHz. Because the carrier signal frequency can vary so widely, transmitters and receivers are designed for specific applications. Examples include GPS communications (1.575 GHz), LFID ( khz), air traffic control ( MHz), FM radio ( MHz), and a myriad of other applications. 1.1 Subject and Purpose The focus of our project is on frequency modulation (FM), and a hybrid analog/digital FM receiver was built. What makes our receiver special is that it solves the problem we have identified with FM radio: That a person can only listen to one station at a time and so miss things they d like to hear on other radio stations. During the course of our project, the FM radio band was used to collect data for processing. Although some analog components were needed in our design to receive the analog RF signals, virtually all demodulation and processing of the received signals was done in the discrete (digital) time domain. Using digital signal processing allowed us to build a receiver which can efficiently demodulate more than one FM channel simultaneously, which is the significant advantage our receiver has over a traditional analog receiver. 12
13 1.2 Problem Statement The problem we have identified is that modern FM radio receivers can only demodulate one channel. This means that a person can only listen to one FM radio station at any given time, even though they might want to enjoy two radio programs which are being broadcasted simultaneously on two different FM channels. The problem of single channel demodulation has already been identified and solved for television with the invention of the TiVo, or digital video recorder. A person is able to watch one show, and at the same time record another. This allows them to come back at a later time to the show they missed. Obviously, this is an attractive feature for TV viewers. The project we chose to undertake is to accomplish the same simultaneous reception of multiple channels for an FM radio application. Our proposed solution is to accomplish this using traditional analog parts, an intermediary Universal Software Radio Peripheral (USRP), and digital signal processing (DSP). A recording device was also included in the final design. 2. Conceptual and Preliminary Design Our conceptual design, as described in the abstract of this document, included analog RF hardware, software running on a PC, and a Universal Software Radio Peripheral. We also anticipated using GNURadio Companion, free Linux software, to access the USRP and run our code on the samples it produced. As will be illustrated below, we followed our conceptual design quite closely. 2.1 Problem Analysis This section revisits the problem we identified, and also lists the specifications and main features we defined for the receiver prototype we built. 13
14 2.1.1 Problem Review As discussed earlier, we saw that there was a problem with the traditional FM Radio receiver, which is only able to tune in to one station at a time. Our solution to this problem was to build a custom software-defined radio which would provide simultaneous channel recovery, so that multiple FM stations could be listened to and/or recorded at once Summary of Specifications The receiver prototype was to be able to do the following: Operate in real time Simultaneously demodulate up to 2 channels Though the receiver we built was able to successfully demodulate at least 2 channels, it was not able to operate in real time due to the amount of time it took for the C++ code to run. This is explained in more detail below Discussion of Main Features Features of the design were to be as follows: Channels can be played and/or recorded at the same time Channels are user-selectable USRP functionality is limited to digitizing and decimating the received signal In our final design, the USRP was actually used to digitize and down-convert the received intermediate frequency (IF) signal. We learned that the complex downconversion process is a default operation which the URSP performs, so we did not try to change this. We were required to further down-convert (shift) each received FM station to baseband (or zero) frequency later in our own C++ code so this alleviated some of 14
15 the pain of the RF down-conversion process. The USRP was also not used to decimate the IF signal, due to the large signal bandwidth which we needed to process. In our final receiver design, all decimation was performed in our C++ algorithm Summary of Engineering Approach To effectively approach our problem, we first identified several tasks to perform. The first stage of the project was dedicated to research, and we learned about the GNURadio Companion software and about the USRP. We also researched FM modulation and FM demodulation algorithms. In addition to this research, we also reviewed material learned in our digital signal processing class, such as up-sampling, down-sampling, filter design, and convolution. The second stage of our project dealt with RF analysis of hardware components and with our frequency plan. In this stage, we developed specifications for our RF, IF, and LO frequency bands and also began to search for parts which would work for our system. There was some difficulty in finding the two band pass filters for our design, but we were able to order these components online after some further research. We also found some parts in the Anderson Wireless Lab which met our specifications and began to experiment with these. The third stage of our project involved the first draft of our MATLAB code. For this draft we were only interested in demodulation of one FM channel. One difficulty which we experienced was that at this point in time, we did not have the required RF hardware to capture any FM signals. We consulted Dr. Gunther quite often at this point, and he suggested FM modulating an audio file which we already had so that we could start working with some real data. We heeded Dr. Gunther s advice, and got a working FM demodulator up and running. 15
16 The fourth stage of our project dealt with the first draft of our C++ code. We converted our MATLAB file into C++ syntax, and found out that the C++ version ran really slowly. We knew this would be a problem, and so began to think about ways to make our code run faster. The fifth and final stage of our project dealt with the final draft of the MATLAB and C++ codes. In these programs, we received actual data from the USRP through our RF front end, and processed it to demodulate two FM stations. As before, the programs ran slowly, and we were not able to work on the C++ version enough to make it a real time application. Dr. Gunther did try to offer suggestions to make improvements to our code s performance, and we implemented some of these, but at the end we still did not achieve real time operation. We do, however, have some ideas for future improvements and will discuss these below Organization and Summary of Report As can be seen by the Table of Contents, this report contains information regarding the details of our system, including RF analysis, component specification, hardware implementation, and code implementation. Difficulties we encountered are also discussed, as are design alternatives which were considered. We also delve into some of the lessons which we learned during the course of this project. 2.2 Decision Analysis In designing our receiver, initially many different alternatives were considered. These solutions are discussed briefly below Solution Alternatives One of our proposed designs required a field-programmable gate array (FPGA). An FPGA is an integrated circuit designed to be configured by a customer or a designer. 16
17 With an FPGA we would be able to implement our DSP processes in a stand-alone device. This would allow for great compactness and portability of our radio receiver. However, the cost of the FPGA is quite high. Also, due to time constraints we determined that we would not be able to learn how to interface with and operate this device proficiently enough to complete our entire project. Other alternatives that were considered involve different frequency plans for our receiver. The processes of mixing, filtering, amplifying, and attenuating define analog receiver architecture, and we decided that we would try to be as cost effective as possible by reducing the number of analog components used. Further variability in design implementation involves the USRP. This device is able to complete many of the processes that we desired to accomplish with our own DSP code. In order to challenge ourselves with this project, we determined which basic operations it was necessary for the URSP to perform, and decided to use it only for these. The section below outlines the design that we chose to implement. It describes the theory of operation and functional partitions of the final design Discussion of Decision Analysis and Final Design Theory of Operation After the radio antenna received the signal, two general areas of signal processing were considered. The first area involved shifting the received signal band to baseband frequency. The second area involved FM demodulation of the baseband signal. These two areas of signal processing encompassed both the analog and digital domains. 17
18 The frequency shift to baseband occurred in the analog front end, the USRP, and the C++ code, using multiple stages. The analog front end filtered the FM radio band to present the USRP with a narrower frequency band (20 or 30 FM radio channels, roughly 6 MHz). This narrower frequency band was user-selectable via a Voltage Controlled Oscillator. The analog signals contained in the narrow band were digitized and decimated by the USRP. Note that the signals were decimated to present fewer samples to the PC. This was necessary because the PC can only process so much information at once. If the incoming signals are extremely oversampled, the PC s job is harder and it would not be able to keep up in a real time application. After the PC received the samples from the USRP, specific digital signals were mixed with these samples to select different radio signals in the 6 MHz input spectrum. These signals were then separately low-pass filtered and FM demodulated to yield their respective modulating (information) signals. By interfacing with the PC s soundcard, these signals could then be played on the PC s speakers Analog RF Receiver The analog receiver selected a section of the FM channel band and passed it to the USRP. It consisted of the multiple components described in Section RF Front End Digital FM Demodulator The FM demodulator was used to recover the information contents from the modulated carrier wave. It extracted the original information signal from a modulated carrier signal. The demodulator was implemented in C++ code and included digital 18

19 adders, digital mixers, digital delays, digital differentiators, and digital FIR low pass filters. 3. Basic Solution Description 3.1 Schematics and Flow Sheets Our project was implemented in three stages as shown in the following figure. We will take a more detailed look at each of these stages in the sections below. Figure 3.0 System Overview RF Front End In our heterodyne receiver, as shown in Figure 3.1, the RF front end preselection filter serves to remove out-of band signal energy as well as partially reject image band signals. After this pre-filtering, the received signal is amplified by a lownoise amplifier (LNA). Although heterodyne receivers typically include an IR filter and/or amplifier following the LNA to further attenuate undesired signals at the image band frequencies, our design specifies a high enough IF that the RF filter can sufficiently attenuate the image band. Hence, an IR filter has not been included, and the desired signal at the output of the LNA is down-converted from the carrier frequency to a fixed IF by mixing with the output of a local oscillator (LO). A high-performance, low-phasenoise voltage-controlled oscillator (VCO) has been employed as the LO in this case. At 19
20 the output of the mixer an IF filter selects the desired channel band and reduces the distortion and dynamic range requirements of the subsequent receiver blocks. The signal is shifted to baseband inside the USRP, as shown in Figure 3.2, and is finally demodulated in C++ code running on a PC. Figure 3.1 Analog Front End USRP and GNU Radio The Universal Software Radio Peripheral serves as an analog to digital converter (ADC), and also as a digital down converter (DDC). A brief description of these internal components along with their influence on our received signal is included here. Note that we are using the Ettus Research Basic Rx card to receive the 6 MHz band which is centered at the specified IF of 10.7 MHz ADC An analog-to-digital converter (ADC) is a device that converts a continuous physical quantity (usually voltage) to a digital number that represents the quantity's amplitude. The conversion involves quantization of the input, so it necessarily introduces a small amount of error. The result of continuous ADC conversions is a sequence of discrete-time, discrete-amplitude digital values which represent the 20
 to a baseband complex signal centered at zero frequency.")
21 continuous time signal. The ADC converts our received signal into a discrete-time signal, which is a basic requirement for digital signal processing of the signal in C DDC A DDC converts a digitized real signal centered at an intermediate frequency (IF) to a baseband complex signal centered at zero frequency. In addition to downconversion, DDCs typically decimate to a lower sampling rate, allowing follow-on signal processing by lower speed processors (i.e. general purpose PCs). The USRP s DDC centers our received signal IF spectrum at zero frequency, which allows us to subsequently further decimate and down-convert each selected FM channel to baseband and demodulate each of these in our C++ DSP algorithm. The DDC can be seen in Figure 3.2 below. The DDC consists of three subcomponents: a direct digital synthesizer (DDS), a low-pass filter (LPF), and a down-sampler (which may be integrated into the low-pass filter). Brief descriptions of these subcomponents are included below. Figure 3.2 USRP DDC Block Diagram 21
22 DDS The DDS generates a complex sinusoid at the intermediate frequency. Multiplication of the intermediate frequency with the input signal creates images centered at the sum and difference frequencies. These phenomena result from the frequency shifting properties of the Fourier transform LPF The low-pass filters pass the difference (i.e. baseband) frequency while rejecting the sum frequency image, resulting in a complex baseband representation of the original signal Down-sampler The down-sampler reduces the data rate and data size of the incoming signal. A down-sample factor of M will result in an output data sample rate of 1/M. Lower sample rates require less computing power and can speed up our signal processing. Audio quality of the output signal is not compromised if the down-sample factor is constrained within a reasonable limit Demodulation FM demodulation is used in our system to recover the information contents from the modulated carrier wave. In other words, the demodulation extracts the original information signal from a modulated carrier signal to produce the audio output. A more detailed description of the demodulation can be seen in Section 3.2 Calculations. A schematic of the demodulator can be seen in Figure 3.3. The FM demodulator is implemented in C++ code and includes the following components: 1 Digital Adder 22
23 2 Digital Mixers 3 Digital Delays 4 Digital Differentiators 5 Digital Finite Impulse Response (FIR) Low Pass Filters Figure 3.3 Demodulation Diagram 3.2 Calculations The sections here describe formulas and calculations which were used in the analysis and design of our system Modulation and Demodulation An FM modulated signal is described mathematically by Eq.1. Note that x(t) is the original sound data which is modulated for transmission. Eq.2 is the definition of convolution. x(t) is the input data (a signal) and h(t) is the filter that is convolved with (or applied to) the signal. Eq.1 23
24 The demodulation equation for FM radio is shown as Eq.3, where x0 and x1 are the I and Q branches of the received signal. Note that diff denotes differentiation and del denotes a delay necessary to time-align the two signal branches. This equation can be derived by studying Figure 3.3 above RF, LO, IF Specifications Our RF frequency band is MHz, which is the FM Radio band. Our IF frequency is chosen as 10.7 MHz, which is a common IF for commercial receivers. By consequence, the LO frequency band is MHz for LSLO, which is the downconversion scheme that we have implemented. The image band is MHz. The two band pass filters in use are the KR Electronics 2722 and Our system is a narrowband system, which means that less than one octave of bandwidth is processed at each point in the system General Formulas The Intermediate Frequency band is shown as Eq.4 for LSLO. Eq.2 Eq.3 IF = RF LO Eq. 4 The Image Frequency band is given by Eq.5 for LSLO. IM = RF 2*LO Eq Component-level Specifications Antenna Below is an image of the monopole antenna which was used to receive the signal. It allowed reception of multiple FM Radio channels at significant power levels. A 24


25 table of some specific FM Radio channels and their respective power levels is included here. Figure 3.4 Monopole Antenna Table 1. Significant Power Signals Preselection Filter The KR Electronic 2722 filter was used to pre-select the MHz FM band. It is a 98 MHz filter with a 20 MHz 3 db bandwidth. It features a sharp transition to the 60 db stop-band, and is designed for 50 Ohm source and load impedance. The filter s insertion loss is less than 3 db. The attenuation at both 80 and 120 MHz is greater than 60 db. An image of this filter is shown here. 25

 of the amplifier is 14dBm.")
26 Figure 3.5 Preselection Filter One difficulty encountered was finding a band pass filter with the above characteristics. This specific filter had to be constructed for our project by KR Electronics, and it took 4 to 5 weeks for the filter to arrive after being ordered Low Noise Amplifier The ZFL-500LN+ was used to boost the signals in our desired frequency band. The amplifier s input was the pre-selection filter output. It can amplify signals from 0.1 to 500 MHz. The noise figure is 2.9 db typical. The gain is 24.5 db at our RF with an input voltage of 15 V. The third order intercept point (IP3) of the amplifier is 14dBm. For more detailed specs, please see the ZFL-500LN+ datasheet in the Appendix. An image of the ZFL-500LN+ with power and ground leads attached is shown here. Figure 3.6 Low Noise Amplifier Another difficulty encountered was finding an amplifier which operated in the range we desired and which had a low noise figure. Ideally, this LNA would have a 26

27 noise figure of about 1 db, instead of 3 db. This might be a consideration for future implementations Mixer The ZFM-3-S+ was used to shift the FM band frequency spectrum to our IF band of MHz. The mixer uses the output of the voltage controlled oscillator and the output of the low noise amplifier as inputs. The LO-RF Isolation is 60 db typical. The LO-IF isolation is 55 db typical. The frequency range is 0.4 to 400 MHz. The conversion loss is 4.78dB. The IP3 is dbm at an LO input power of +7 dbm. For more detailed specs, please see the ZFL-500LN+ datasheet in the Appendix. An image of the ZFM-3-S+ is shown here. Figure 3.7 Mixer Voltage Controlled Oscillator The ZOS-150 from Minicircuits was used as a variable local oscillator (LO) to tune our frequency band to an IF. It was powered by a variable DC power supply. An image of the VCO is shown here. 27


28 Figure 3.8 Voltage Controlled Oscillator Intermediate Frequency Filter The KR Electronic 2567 filter was used as our IF filter to subsequently select two channels in the FM band. It is a 10.7 MHz filter with a 6 MHz 3 db bandwidth. It features a sharp transition to the 60 db stop-band, and is designed for 50 Ohm source and load impedance. The filter s insertion loss is less than 3 db. The attenuation at both 5 and 16.5 MHz is greater than 60 db. An image of this filter is shown here. Figure 3.9 Intermediate Frequency Filter SMA Connectors SMA cables were used to interconnect the different analog components. This provided quick and easy prototyping and troubleshooting of the different components. An image of an SMA Cable is shown here. 28

29 Figure 3.10 SMA Cable 4. Performance Optimization and Design of System Components 4.1 Description of Components The front end of our receiver performed the frequency translation, channel selection and amplification of the signal. To accomplish this, we used an antenna, preselection filter, low noise amplifier, mixer, voltage controlled oscillator, and intermediate frequency filter. A description of each of these components and their function is found here Antenna A monopole antenna has an omnidirectional radiation pattern, and is adequate enough to capture FM radio frequencies. Our requirements of the antenna were that it must to be able to be connected to the rest of the RF system via SMA Cable, and must be 50 Ohm impedance Preselection Filter A pre-selection filter is a band pass filter which is used to pass a desired band of frequencies and attenuate frequencies outside of this band. In this way, a pre-selection filter selects a band of interest. In our case, the FM band of 88 to 108 MHz was preselected. 29

30 A pre-selection filter is also used to attenuate image band frequencies and second order distortion can also be eliminated if less than an octave of bandwidth is processed by the filter. A frequency band s width is termed an octave when the upper band frequency is twice that of the lower band frequency. A plot of a typical band pass filter magnitude versus frequency curve is shown below in Figure 4.1. A graphical description of what analysis was performed in considering the pre-selection band pass filter is shown below in Figure 4.2. Figure 4.1 Band Pass Filter Magnitude Bode Plot Figure 4.2 Preselection Filter Considerations 30
31 4.1.3 Low Noise Amplifier Noise present in the signal and in the system needs to be reduced as much as possible. One way we planned to accomplish this was with a low noise amplifier placed after the pre-selection filter. The low noise amplifier boosts the output signals of the preselection filter, and in our system the output of the amplifier was connected directly to the frequency mixer. The overall noise figure of a receiver s front end is dominated by the first couple stages, so choosing an amplifier with a low noise figure was critical. A more detailed explanation of noise and the cascaded analysis can be seen in Section Noise Analysis Mixer A frequency mixer can be used to either down-convert or up-convert the RF input signal. Up-conversion is a frequency shift, or frequency translation, to a higher intermediate frequency. Down-conversion is a frequency shift to a lower intermediate frequency. Receivers typically perform down-conversion. As shown in Eq. 4, the formula which governs the mixer is IF = RF ± LO. Although the mixer produces the outputs at these sum and difference frequencies, it also produced undesired multiples of these frequencies as well. The undesired output of a mixer is termed spurious output, and the designers of an RF system (us, in this case) must provide a way to remove the undesired output of the mixer, usually by filtering. Mixer spur analysis plays a crucial role in the design of a RF system, and our mixer analysis can be seen in Section Mixer Spur Analysis. 31
32 4.1.5 Voltage Controlled Oscillator A voltage controlled oscillator allows us to tune our radio by sweeping the local oscillator through a specific frequency band. A local oscillator frequency is one which will down-convert an RF frequency to an IF frequency through the mixer. As an example, if we desire to tune 89.5 MHz to an intermediate frequency of 10.7 MHz, then the LO frequency must be 89.5 MHz MHz = 78.8 MHz. The voltage controlled oscillator allows tuning of the local oscillator frequency via DC voltage. A specific DC voltage fed to the VCO will output a specific local oscillator frequency. As an example, when we provide a DC voltage of V, the LO output is 77.3 MHz. This specific result can be verified by studying the figures of Section 5.2 Operational Test Results Intermediate Frequency Filter The IF filter is a band pass filter, whose magnitude vs. frequency plot looks like that of Figure 4.1. This filter operates exactly like the pre-selection filter, but is used to select the shifted, selected spectrum. In our case the intermediate frequency is 10.7 MHz, and the filter bandwidth is 6 MHz. Figure 4.3 below depicts the frequency spectrum at the point of the intermediate frequency band pass filter and lists some of the requirements we specified. Note that the units of the x-axis are MHz. 32
33 Figure 4.3 Intermediate Frequency Filter 4.2 Design Criteria Used Linearity Analysis Table 2 below shows an analysis of the input third order intercept (ITOI) specification of each component. Note that the higher the ITOI specification, the more linear the component is (which is desirable). Table 2 also shows the contribution of each component to the cascaded values for ITOI. The third order intercept point is related to third order distortion. Because we designed our system to only process an octave of bandwidth at any given time, our system is a narrowband system. Narrowband systems do not suffer from 2nd Order Distortion, and so only 3rd Order Distortion has been analyzed. The weakest component in terms of linearity is the mixer. Although its ITOI of dbm is higher than the low noise amplifier s, in the system the mixer s ITOI drops to a mere 0.42 dbm. This indicates that the mixer is the first component in the system 33

34 which will go non-linear. As cascaded ITOI is calculated much like the equivalent resistance of resistors in parallel, it is not surprising that the cascaded ITOI is dominated by the smallest ITOI in the system, and is essentially equal to it. This can be observed in the table. Table 2. Cascaded Analysis Noise Analysis A large part of our design analysis and component criteria had to do with the signal to noise ratio. As our system dealt with audio, signal to noise ratio was a crucial part of how our resulting audio samples sounded. We tried to select components with low noise figures so that our output was as high-fidelity as possible. The table above (Table 2) shows an analysis of the signal and noise power levels. It shows the gain (Gp), noise figure (F), noise temperature (T), and input third order intercept (ITOI) specification of each component. It also shows the contribution of 34
35 each component to the cascaded values for noise temperature, noise figure, and ITOI. The excess gain after each component is shown as well. The minimum detectable signal (MDS) is computed using the following equation: SMDS,dBm = Fsys,dB - 174dBm/Hz + 10log(Bn), where Bn is the bandwidth of the noise. Taking Bn = Hz, SMDS = -95 dbm. The noise floor of the system is computed as follows: Gp,dB + SMDS,dBm = = dbm. The spur free dynamic range (SFDR) is computed as such: SFDRdB = ⅔(ITOIdBm - SMDS,dBm) = ⅔( ) = db. As can be seen by the table, the weakest component in terms of noise is the low noise amplifier, which has a noise temperature of K in the system. Though this seems ironic, it is mostly due to the division by the very small gain of the component preceding the amplifier. Third party software, NoiseCalc, was also used to compute some of the cascaded values for our system. This was done mainly to test our own analysis. Though some of the numbers agreed with ours, many others differed. This is due largely to the inability of the software to accept certain parameters, such as noise bandwidth and input third order intercept. The NoiseCalc analysis can be seen in Figure 5.1. It does provide a nice gain and noise figure analysis, but the MDS, ITOI (IP3), noise floor, and SFDR deviate from our calculated values. As we were able to specify each needed parameter in our own spreadsheet analysis, we decided to trust our own calculations and left the NoiseCalc figure in solely for educational value. 35

36 Figure 4.4 NoiseCalc Analysis Mixer Spur Analysis In Figure 4.5 below, the red circles show the potential frequency spurs in the IF range of MHz. These spurs were calculated using software we wrote in MATLAB which conforms to equations found in the ECE 5680 class text. The MATLAB code can be found in the Appendix. As can easily be seen, all spurs which the mixer produces are so low power that they will not affect our system. Note that 40 db corresponds to a linear factor of 10000, and so a spur of -41 dbc should be well below our signal power. 36
 will mix down to the same output (IF) frequency, a band pass pre-selection filter was used ahead of the mixer to suppress the image signal.")
37 Figure 4.5 Mixer Spurs Rejection of Image Band The equation describing the RF and image mixing behavior is provided here. RF - LO = LO - IM = IF. Because two inputs to a mixer (desired RF and undesired IM) will mix down to the same output (IF) frequency, a band pass pre-selection filter was used ahead of the mixer to suppress the image signal. The IF and LO frequencies were carefully selected to avoid image frequencies that were too close to the desired RF frequency to be effectively filtered Excess Gain Calculations of the excess gain have been included in Table 2. The excess gain is the instantaneous gain of the system after each component. As expected, the band pass filter attenuates 3 db, the amplifier boosts about 21 db, the mixer attenuates about 5 db, and the second band pass filter attenuates 1 db. These numbers correspond to a system gain of about 16 db. 37
38 To measure excess gain, the frequency 89.5 MHz was tracked through our system. Images of what the spectrum analyzer recorded at specific points can be seen below in Section 5.2 Operational Test Results. Note the excess gain at each stage. After the antenna the excess gain is -29 db, after the pre-selection filter the excess gain is db, after the LNA the excess gain is -16 db, after the mixer the excess gain is - 17 db, and after the IF filter the excess gain is -18 db. The total system gain is measured as 11 db, rather than the calculated db. We assume that this is due to us powering the amplifier at 13 V rather than 15 V, because it was overheating when the datasheet-specified 15 V was being fed to it from our DC power supply Real Time Application Real time processing was a criterion for our system, but did not get achieved. We have determined that this would require a lot more time and research. The little we know about real time processing is that we should not dynamically allocate and deallocate memory in our loops, that conditional statements inside of loops also slows down the compiler, that the Release Mode of MS Visual Studio should be selected instead of Debug, that a nested loop structure could be unrolled into a list of sequential executable commands, that file input and output operations (file IO) slow down the compiler, that type casting is an expensive operation, and that parallel processing should be implemented as often as possible. At a minimum, these things should be taken into consideration for faster future implementations of software-defined simultaneous FM demodulators. 4.3 Discussion of Design Details Our actual design followed our conceptual design quite closely. As mentioned above, we implemented an RF front end and C++ software. The information provided in 38
39 Section 3.3 Component-level Specifications details the design of the RF front end. The design details of the C++ software are included in the following two sections Frequency Shifting The output signal of the USRP contains information of interest from two FM stations. In order to demodulate both FM signals at once, we are required to shift each signal s frequency spectrum to baseband. As our processing is done one sample at a time, each sample of the two signals of interest is shifted to baseband at the same time in our code Filter Design Three different filters were designed using MATLAB s FDATool. These three filters are used to decimate (low pass filter then down-sample) the output signal of the USRP by 40. This gives a sample rate of 8.82e6/40 = khz. At this point in the processing chain, FM demodulation and further down-sampling by a factor of 10 gives the output audio signals sampled at a rate of khz. Figure 4.6 below describes the frequency spectrum of the decimated-by-40 signal through the three down-sampling stages. As should be obvious from the figure, the stages of down-sampling are: (1) Down-sample by two, (2) Down-sample by 4, and (3) Down-sample by 5. Figure 4.6 also shows how the frequency information of interest is spreading to fill the FFT plot. MATLAB plots of the received 6 MHz spectrum, the shifted-to-baseband signals, and these decimated-by-40 baseband signals are shown in Figures 4.7, 4.8, 4.9, 4.10 and 4.11 below. 39
40 Figure 4.6 Decimation Filters 40

41 Figure 4.7 Received 6 MHz Spectrum Figure MHz Shifted to BB 41
42 Figure MHz Shifted to BB Figure 4.10 Channel One khz FFT Plot 42
43 Figure 4.11 Channel Two khz FFT Plot 4.4 Summary of Final Design Results & Performance Evaluation Design Successes In our design, the RF hardware works really well. We were able to test these components thoroughly and determined that our system did not suffer from any major noise or linearity problems. This is largely due to the extensive analysis that we performed during the early stages of the project. The C++ software we wrote also performs simultaneous FM demodulation, which we consider to be a success Problems Encountered 43
44 There were many difficulties encountered when coding in C++. The first was proper anti-aliasing filter design. We eventually achieved the designed filters described in Section 4.3 Discussion of Design Details with the help of Dr. Gunther. The second major problem encountered was how to convolve our signal with the low pass and decimating filters in a timely manner. This problem of time constraints led to many smaller issues we had to deal with. We explored using filters with fewer taps, using different methods of convolution, and finally ended up using a sample-by-sample approach to the problem, rather than the sequential processing method we had initially started with. A problem plaguing our first program was file IO issues. Because MS Visual Studio would not let us use all the memory that we needed, we had to read in chunks of data, process, and then output. To process the entire data file and produce the demodulated output, we opened and closed temporary files several times during the course of the program, which made our code run very slowly. Another major problem encountered in our first program was related to the file IO issue, and was the lack of available memory for our program. We experimented with dynamically allocated memory in the first couple versions of our code, but eventually determined that the dynamic allocation and deletion of memory space was also causing our code to run slowly. Problems related to the final version of our code consisted of figuring out how to read in the 32 bit float complex data file, getting the circular convolution buffer to operate correctly, figuring out how to decimate our signal properly in code, and figuring 44
45 out why our audio output signal was ramping. Here we will briefly discuss the variations we made to our DSP code, starting from the beginning. Our first C++ program accepted two files of float values. At this point, we were using MATLAB to read in the complex data and then saved the real and imaginary parts in separate files, which we read into our C++ program. The file data was sampled at khz. This roughly corresponds to one 200 khz-wide FM channel, and our program simply demodulated the data contained in this file then down-sampled by a factor of 5 to produce an audio output signal sampled at 44.1 khz. We implemented overlap-add convolution in this version. Our second program was identical to the first, but implemented FFT convolution with overlap-add. In both C++ programs, the data was processed in chunks and saved at intermediary steps in data files. Our third program used dynamically allocated memory to obtain a larger data chunk size. We noticed that if we processed larger data chunks, our code ran faster, probably due to the fewer IO operations. Unfortunately, even though we were able to use a larger data chunk size, we found that the dynamically allocated memory operations cancelled out any benefit the larger data chunk size gave us. We also began to analyze the FFT in use. As it was a Radix-5 FFT, its performance was not very good. There was no optimization by reducing the additions per butterfly such as that performed by the Radix FFT. At this point the FFTW, or Fastest Fourier Transform in the West, was considered but was not implemented. Our final program tried a new approach. Instead of chunking the original data file and processing those chunks with overlap-add convolution, we processed the data file 45
46 sample-by-sample, using circular buffers. We still took chunks of the original data file to fill up an initial linear buffer, but were able to shift samples into other buffers at specific points in the code to convolve with the appropriate filters, delays, and differentiators. We also started with a data file sampled at 8.82 MHz and at this point were able to extract audio from two FM channels. We modified our earlier versions of the code to accept the 32 bit float complex data file directly, and read the file into arrays of type complex. By using decrementing counters and a nested loop structure, we were able to downsample in our code while also convolving with filters at the same time. The four file outputs of our program are two baseband FM channels sampled at khz before demodulation, and two FM demodulated audio signals sampled at khz. The program can accept any input length of data, and can run continuously. However, it cannot run in real time. It performs the simultaneous channel demodulation at a factor roughly 60 times slower than the length in time of the audio signals it outputs. To make the code run faster, there are some changes which could be made to future implementations of this receiver. As a first optimization, the loops could be unrolled so that instead of evaluating conditional statements, the compiler could just execute commands sequentially. We believe that this would improve performance dramatically. Secondly, the amount of data coming into the buffers could be reduced. The sampling rate of the USRP could be lowered to around 6 Msamples/second, so that instead of 6 MHz maybe 3 MHz is received and processed. It is still feasible that quite a few combinations of two FM channels could be received with this bandwidth. Thirdly, more minute changes could be made to our code. One change would be to decrement using a modulo operation instead of using a conditional statement to reset the counter. 46
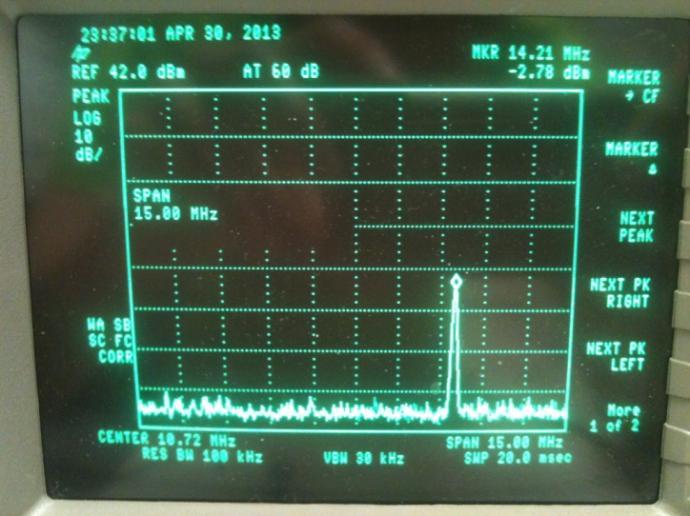
47 Another change could be to remove any type casting which is present. There are probably a myriad of other changes which could be implemented to optimize our code, but the changes we suggested should provide a good start on making the program process data in real time. In conclusion, we were not able to make our C++ code fast enough to run in real time. Had we been able to accomplish this, we could have converted our code into a GNURadio Companion Module so that we could test its real time performance. This was the ultimate goal for our project, and could be implemented in the future to provide a more dynamic experience. We did use GNURadio Companion s FM Demod block to test our RF hardware, and it worked very well to demodulate a single FM Radio station. 5. Project Implementation and Assessment 5.1 Operational Test Results Provided here is a description of the procedure we used to test and verify the functionality of the components in our receiver and the receiver overall. In order to test the functionality of our analog RF system, we performed physical testing of the individual components and also tracked a signal through the entire front end in order to determine that the receiver was working as it should. The tools which were used for testing include (1) HP E3632A Variable Power Supply, (2) HP ESG-D3000A Digital Signal Generator, and (3) HP 8594E Spectrum Analyzer. Individual testing of each analog component is included here. The first parts tested were the two band pass filters from KR Electronics, the KR 2722 and KR To test these filters, the signal generator was hooked up directly to the band pass filter 47


48 and specific signals were passed through them to see the performance of their passband to the stop-band transitions. In order to test the KR 2722, signals were sent through the band pass filter at 86 MHz and at MHz, which are close to the specified 3 db frequency points. The spectrum analyzer shows that the signal levels for 86 and MHz are and db, respectively. Images of the signal generator screen and spectrum analyzer are shown in Figures 5.1, 5.2, 5.3, and 5.4 below for these two frequencies. To test the KR 2567, signals were sent through the band pass filter at 7.46 MHz and at MHz, which are close to the specified 3 db frequency points. The spectrum analyzer shows that the signal levels for 7.46 and MHz are and db, respectively. Images of the signal generator screen and spectrum analyzer are shown in Figures 5.5, 5.6, 5.7, and 5.8 below for these two frequencies. Figure 5.1 BPF1 Low Test Sign. Gen. Figure 5.2 BPF1 Low Test Spectrum 48


49 Figure 5.3 BPF1 High Test Sign. Gen. Figure 5.4 BPF1 High Test Spectrum Figure 5.5 BPF2 Low Test Sign. Gen. Figure 5.6 BPF2 Low Test Spectrum Figure 5.7 BPF2 High Test Sign. Gen. Figure 5.8 BPF2 High Test Spectrum 49


50 In order to test the VCO, the variable DC power supply was hooked to it and the voltage was swept from V to V, which gives the LO frequency range from 77.3 MHz to 97.3 MHz. The DC voltage and corresponding LO frequency can be seen in Figures 5.9, 5.10, 5.11, and Figure 5.9 DC Supply Low VCO Test Figure 5.10 Low VCO Spectrum Anal. Figure 5.11 DC Supply High VCO Test Figure 5.12 High VCO Spectrum Anal. As a final test, the frequency 89.5 MHz was tracked through our system. Images of what the spectrum analyzer recorded at specific points are seen below in Figures 50


51 5.13, 5.14, 5.15, 5.16, and Note the excess gain at each stage. After the antenna the excess gain is -29 db, after the pre-selection filter the excess gain is db, after the LNA the excess gain is -16 db, after the mixer the excess gain is -17 db, and after the IF filter the excess gain is -18 db. The total system gain is measured as 11 db, rather than the calculated db. We assume that this is due to us powering the amplifier at 13 V rather than 15 V, because it was overheating when the datasheetspecified 15 V was being fed to it from our DC power supply. Figure 5.13 Antenna Output Figure 5.14 Preselection Filter Output Figure 5.15 Amplifier Output Figure 5.16 Mixer Output 51


52 Figure 5.17 IF Filter Output 5.2 Evaluation of Results All our components were determined to be in good working condition by the tests which we performed. A picture of the entire system is shown here in Figure 5.18 Figure 5.18 Receiver Front End w/ USRP 52
53 5.3 Suggested Changes We suggest that the low noise amplifier be traded out for one with a lower noise figure and a higher ITOI. The one we used had a noise figure of 3 db and an ITOI of 14 dbm. Values closer to 1 db for the noise figure and 25 dbm for ITOI would be much more ideal. The amplifier gain is a negligible consideration. We also suggest the C++ code optimizations we identified in Section Problems Encountered. 6. Final Scope of Work 6.1 What Has Been Done We completed offline demodulation of two FM channels using C++ code. 6.2 What Needs to Be Done We failed to complete real time demodulation of two FM channels. We would go about this using C++ code optimization and code-wrapping to create a GNURadio Companion Module. 6.3 Lessons Learned We mostly learned about RF hardware and the analysis related to each of the RF components we used. We also solidified concepts about filter design and decimation in digital signal processing. We got a lot of experience with different methods of convolution using the C++ language. We became decently proficient in the use of MATLAB for signal processing. 6.4 Project Management Issues Sometimes it was hard to align our schedules so that we could work on every part of the project together. Doing everything together made it so that we learned a lot 53
54 as a unit, but we could probably have made more progress if we had divided up the work between us and focused on separate parts of the project. There were no budgetary problems for our project, but we did have to wait for some components to arrive, which is discussed below in Section 7.1 Component Manufacture. 7. Other Issues 7.1 Component Manufacture Because it was difficult to find band pass filters with the specifications we needed, KR Electronics built both of these filters for us. Because these filters were custom made, we had to wait about 6 weeks for these parts to arrive. This issue made it difficult to obtain the raw RF data that we needed to develop and test our MATLAB and C++ code. 8. Cost Estimation 8.1 System Cost Table 3 gives the cost of the RF front end components. The total budget of our project was $ As all components except the mixer and two band pass filters were already in the Anderson Wireless Lab, the gross cost of this project was $

55 Table 3. Budget 8.2 Design Cost We estimate that we each put roughly 200 hours into this project. 9. Project Management Summary 9.1 Tasks Completed We completed offline demodulation of two FM channels using C++ code. 9.2 Tasks to Be Completed We failed to complete real time demodulation of two FM channels. We would go about this using C++ code optimization and code-wrapping to create a GNURadio Companion Module. 9.3 Gantt Chart The Gantt Chart below shows the tasks we identified for our project. It also depicts the work done and the portion of work which still needs to be completed. 55

56 Figure 9.1 Gantt Chart 9.4 Personnel Our team consisted of Wonkyu Song and Kyle Carpenter. Our combined prior experience with DSP, filter design, and analog circuit design made us capable of success. In addition, we also both possessed the ability to learn quickly and apply critical thinking to the problem at hand. Please reference our attached resumes to see a more complete list of our qualifications and skills. 10. Conclusion 10.1 Main Points 56
RADIO RECEIVERS ECE 3103 WIRELESS COMMUNICATION SYSTEMS
 RADIO RECEIVERS ECE 3103 WIRELESS COMMUNICATION SYSTEMS FUNCTIONS OF A RADIO RECEIVER The main functions of a radio receiver are: 1. To intercept the RF signal by using the receiver antenna 2. Select the
Introduction to Receivers
 Introduction to Receivers Purpose: translate RF signals to baseband Shift frequency Amplify Filter Demodulate Why is this a challenge? Interference Large dynamic range required Many receivers must be capable
Receiver Architecture
 Receiver Architecture Receiver basics Channel selection why not at RF? BPF first or LNA first? Direct digitization of RF signal Receiver architectures Sub-sampling receiver noise problem Heterodyne receiver
APPLICATION NOTE 3942 Optimize the Buffer Amplifier/ADC Connection
 Maxim > Design Support > Technical Documents > Application Notes > Communications Circuits > APP 3942 Maxim > Design Support > Technical Documents > Application Notes > High-Speed Interconnect > APP 3942
Wideband Receiver for Communications Receiver or Spectrum Analysis Usage: A Comparison of Superheterodyne to Quadrature Down Conversion
 A Comparison of Superheterodyne to Quadrature Down Conversion Tony Manicone, Vanteon Corporation There are many different system architectures which can be used in the design of High Frequency wideband
Developing a Generic Software-Defined Radar Transmitter using GNU Radio
 Developing a Generic Software-Defined Radar Transmitter using GNU Radio A thesis submitted in partial fulfilment of the requirements for the degree of Master of Sciences (Defence Signal Information Processing)
Design Analysis of Analog Data Reception Using GNU Radio Companion (GRC)
") World Applied Sciences Journal 17 (1): 29-35, 2012 ISSN 1818-4952 IDOSI Publications, 2012 Design Analysis of Analog Data Reception Using GNU Radio Companion (GRC) Waqar Aziz, Ghulam Abbas, Ebtisam Ahmed,
World Applied Sciences Journal 17 (1): 29-35, 2012 ISSN 1818-4952 IDOSI Publications, 2012 Design Analysis of Analog Data Reception Using GNU Radio Companion (GRC) Waqar Aziz, Ghulam Abbas, Ebtisam Ahmed,
RF/IF Terminology and Specs
 RF/IF Terminology and Specs Contributors: Brad Brannon John Greichen Leo McHugh Eamon Nash Eberhard Brunner 1 Terminology LNA - Low-Noise Amplifier. A specialized amplifier to boost the very small received
High Dynamic Range Receiver Parameters
 High Dynamic Range Receiver Parameters The concept of a high-dynamic-range receiver implies more than an ability to detect, with low distortion, desired signals differing, in amplitude by as much as 90
Receiver Design. Prof. Tzong-Lin Wu EMC Laboratory Department of Electrical Engineering National Taiwan University 2011/2/21
 Receiver Design Prof. Tzong-Lin Wu EMC Laboratory Department of Electrical Engineering National Taiwan University 2011/2/21 MW & RF Design / Prof. T. -L. Wu 1 The receiver mush be very sensitive to -110dBm
RFID Systems: Radio Architecture
 RFID Systems: Radio Architecture 1 A discussion of radio architecture and RFID. What are the critical pieces? Familiarity with how radio and especially RFID radios are designed will allow you to make correct
HF Receivers, Part 2
 HF Receivers, Part 2 Superhet building blocks: AM, SSB/CW, FM receivers Adam Farson VA7OJ View an excellent tutorial on receivers NSARC HF Operators HF Receivers 2 1 The RF Amplifier (Preamp)! Typical
Radio Receiver Architectures and Analysis
 Radio Receiver Architectures and Analysis Robert Wilson December 6, 01 Abstract This article discusses some common receiver architectures and analyzes some of the impairments that apply to each. 1 Contents
Session 3. CMOS RF IC Design Principles
 Session 3 CMOS RF IC Design Principles Session Delivered by: D. Varun 1 Session Topics Standards RF wireless communications Multi standard RF transceivers RF front end architectures Frequency down conversion
Measuring Non-linear Amplifiers
 Measuring Non-linear Amplifiers Transceiver Components & Measuring Techniques MM3 Jan Hvolgaard Mikkelsen Radio Frequency Integrated Systems and Circuits Division Aalborg University 27 Agenda Non-linear
EE470 Electronic Communication Theory Exam II
 EE470 Electronic Communication Theory Exam II Open text, closed notes. For partial credit, you must show all formulas in symbolic form and you must work neatly!!! Date: November 6, 2013 Name: 1. [16%]
1 Introduction to Highly Integrated and Tunable RF Receiver Front Ends
 1 Introduction to Highly Integrated and Tunable RF Receiver Front Ends 1.1 Introduction With the ever-increasing demand for instant access to data over wideband communication channels, the quest for a
UNIT-3. Electronic Measurements & Instrumentation
 UNIT-3 1. Draw the Block Schematic of AF Wave analyzer and explain its principle and Working? ANS: The wave analyzer consists of a very narrow pass-band filter section which can Be tuned to a particular
A LOW-COST SOFTWARE-DEFINED TELEMETRY RECEIVER
 A LOW-COST SOFTWARE-DEFINED TELEMETRY RECEIVER Michael Don U.S. Army Research Laboratory Aberdeen Proving Grounds, MD ABSTRACT The Army Research Laboratories has developed a PCM/FM telemetry receiver using
This tutorial describes the principles of 24-bit recording systems and clarifies some common mis-conceptions regarding these systems.
 This tutorial describes the principles of 24-bit recording systems and clarifies some common mis-conceptions regarding these systems. This is a general treatment of the subject and applies to I/O System
RF Integrated Circuits
 Introduction and Motivation RF Integrated Circuits The recent explosion in the radio frequency (RF) and wireless market has caught the semiconductor industry by surprise. The increasing demand for affordable
ELT Receiver Architectures and Signal Processing Exam Requirements and Model Questions 2018
 TUT/ICE 1 ELT-44006 Receiver Architectures and Signal Processing Exam Requirements and Model Questions 2018 General idea of these Model Questions is to highlight the central knowledge expected to be known
VLSI Implementation of Digital Down Converter (DDC)
") Volume-7, Issue-1, January-February 2017 International Journal of Engineering and Management Research Page Number: 218-222 VLSI Implementation of Digital Down Converter (DDC) Shaik Afrojanasima 1, K Vijaya
Volume-7, Issue-1, January-February 2017 International Journal of Engineering and Management Research Page Number: 218-222 VLSI Implementation of Digital Down Converter (DDC) Shaik Afrojanasima 1, K Vijaya
Simulating and Testing of Signal Processing Methods for Frequency Stepped Chirp Radar
 Test & Measurement Simulating and Testing of Signal Processing Methods for Frequency Stepped Chirp Radar Modern radar systems serve a broad range of commercial, civil, scientific and military applications.
MAKING TRANSIENT ANTENNA MEASUREMENTS
 MAKING TRANSIENT ANTENNA MEASUREMENTS Roger Dygert, Steven R. Nichols MI Technologies, 1125 Satellite Boulevard, Suite 100 Suwanee, GA 30024-4629 ABSTRACT In addition to steady state performance, antennas
EECS 307: Lab Handout 2 (FALL 2012)
") EECS 307: Lab Handout 2 (FALL 2012) I- Audio Transmission of a Single Tone In this part you will modulate a low-frequency audio tone via AM, and transmit it with a carrier also in the audio range. The
EECS 307: Lab Handout 2 (FALL 2012) I- Audio Transmission of a Single Tone In this part you will modulate a low-frequency audio tone via AM, and transmit it with a carrier also in the audio range. The
Experiment 6: Multirate Signal Processing
 ECE431, Experiment 6, 2018 Communications Lab, University of Toronto Experiment 6: Multirate Signal Processing Bruno Korst - bkf@comm.utoronto.ca Abstract In this experiment, you will use decimation and
Real-Time Digital Down-Conversion with Equalization
 Real-Time Digital Down-Conversion with Equalization February 20, 2019 By Alexander Taratorin, Anatoli Stein, Valeriy Serebryanskiy and Lauri Viitas DOWN CONVERSION PRINCIPLE Down conversion is basic operation
Keywords: GPS, receiver, GPS receiver, MAX2769, 2769, 1575MHz, Integrated GPS Receiver, Global Positioning System
 Maxim > Design Support > Technical Documents > User Guides > APP 3910 Keywords: GPS, receiver, GPS receiver, MAX2769, 2769, 1575MHz, Integrated GPS Receiver, Global Positioning System USER GUIDE 3910 User's
A COMPACT, AGILE, LOW-PHASE-NOISE FREQUENCY SOURCE WITH AM, FM AND PULSE MODULATION CAPABILITIES
 A COMPACT, AGILE, LOW-PHASE-NOISE FREQUENCY SOURCE WITH AM, FM AND PULSE MODULATION CAPABILITIES Alexander Chenakin Phase Matrix, Inc. 109 Bonaventura Drive San Jose, CA 95134, USA achenakin@phasematrix.com
Dan Allen, Joshua Bullard, Tommy Morse
 Dan Allen, Joshua Bullard, Tommy Morse Dan.a@aggiemail.usu.eu Joshua.a.bullard@aggiemail.usu.edu Thomas.morse@aggiemail.usu.edu May 6, 2010 Dr. Donald Cripps Department of Electrical and Computer Engineering
Lecture 6. Angle Modulation and Demodulation
 Lecture 6 and Demodulation Agenda Introduction to and Demodulation Frequency and Phase Modulation Angle Demodulation FM Applications Introduction The other two parameters (frequency and phase) of the carrier
Antenna Measurements using Modulated Signals
 Antenna Measurements using Modulated Signals Roger Dygert MI Technologies, 1125 Satellite Boulevard, Suite 100 Suwanee, GA 30024-4629 Abstract Antenna test engineers are faced with testing increasingly
Radar Shield System Design
 University of California, Davis EEC 193 Final Project Report Radar Shield System Design Lit Po Kwong: lkwong853@gmail.com Yuyang Xie: szyuyxie@gmail.com Ivan Lee: yukchunglee@hotmail.com Ri Liang: joeliang914@gmail.com
Tutorial 3: Entering the World of GNU Software Radio
 Tutorial 3: Entering the World of GNU Software Radio Dawei Shen August 3, 2005 Abstract This article provides an overview of the GNU Radio toolkit for building software radios. This tutorial is a modified
Digital Signal Processing (DSP) Algorithms for CW/FMCW Portable Radar
 Algorithms for CW/FMCW Portable Radar") Digital Signal Processing (DSP) Algorithms for CW/FMCW Portable Radar Muhammad Zeeshan Mumtaz, Ali Hanif, Ali Javed Hashmi National University of Sciences and Technology (NUST), Islamabad, Pakistan Abstract
Digital Signal Processing (DSP) Algorithms for CW/FMCW Portable Radar Muhammad Zeeshan Mumtaz, Ali Hanif, Ali Javed Hashmi National University of Sciences and Technology (NUST), Islamabad, Pakistan Abstract
HY448 Sample Problems
 HY448 Sample Problems 10 November 2014 These sample problems include the material in the lectures and the guided lab exercises. 1 Part 1 1.1 Combining logarithmic quantities A carrier signal with power
THIS work focus on a sector of the hardware to be used
 DISSERTATION ON ELECTRICAL AND COMPUTER ENGINEERING 1 Development of a Transponder for the ISTNanoSAT (November 2015) Luís Oliveira luisdeoliveira@tecnico.ulisboa.pt Instituto Superior Técnico Abstract
Outline. Communications Engineering 1
 Outline Introduction Signal, random variable, random process and spectra Analog modulation Analog to digital conversion Digital transmission through baseband channels Signal space representation Optimal
ADI 2006 RF Seminar. Chapter II RF/IF Components and Specifications for Receivers
 ADI 2006 RF Seminar Chapter II RF/IF Components and Specifications for Receivers 1 RF/IF Components and Specifications for Receivers Fixed Gain and Variable Gain Amplifiers IQ Demodulators Analog-to-Digital
PN9000 PULSED CARRIER MEASUREMENTS
 The specialist of Phase noise Measurements PN9000 PULSED CARRIER MEASUREMENTS Carrier frequency: 2.7 GHz - PRF: 5 khz Duty cycle: 1% Page 1 / 12 Introduction When measuring a pulse modulated signal the
4. Digital Measurement of Electrical Quantities
 4.1. Concept of Digital Systems Concept A digital system is a combination of devices designed for manipulating physical quantities or information represented in digital from, i.e. they can take only discrete
Single Conversion LF Upconverter Andy Talbot G4JNT Jan 2009
 Single Conversion LF Upconverter Andy Talbot G4JNT Jan 2009 Mark 2 Version Oct 2010, see Appendix, Page 8 This upconverter is designed to directly translate the output from a soundcard from a PC running
ADVANCED EMBEDDED MONITORING SYSTEM FOR ELECTROMAGNETIC RADIATION
 98 Chapter-5 ADVANCED EMBEDDED MONITORING SYSTEM FOR ELECTROMAGNETIC RADIATION 99 CHAPTER-5 Chapter 5: ADVANCED EMBEDDED MONITORING SYSTEM FOR ELECTROMAGNETIC RADIATION S.No Name of the Sub-Title Page
Radio Frequency Design to Support Software Transceiver for Wireless Communications
 Radio Frequency Design to Support Software Transceiver for Wireless Communications Author: Cazzie Williams Western Michigan University Whirlpool Corporation Advisor/Sponsor: Dr. Frank Severance and Dr.
An Investigation into the Effects of Sampling on the Loop Response and Phase Noise in Phase Locked Loops
 An Investigation into the Effects of Sampling on the Loop Response and Phase oise in Phase Locked Loops Peter Beeson LA Techniques, Unit 5 Chancerygate Business Centre, Surbiton, Surrey Abstract. The majority
VHF LAND MOBILE SERVICE
 RFS21 December 1991 (Issue 1) SPECIFICATION FOR RADIO APPARATUS: VHF LAND MOBILE SERVICE USING AMPLITUDE MODULATION WITH 12.5 khz CARRIER FREQUENCY SEPARATION Communications Division Ministry of Commerce
Introduction. In the frequency domain, complex signals are separated into their frequency components, and the level at each frequency is displayed
 SPECTRUM ANALYZER Introduction A spectrum analyzer measures the amplitude of an input signal versus frequency within the full frequency range of the instrument The spectrum analyzer is to the frequency
SCA COMPATIBLE SOFTWARE DEFINED WIDEBAND RECEIVER FOR REAL TIME ENERGY DETECTION AND MODULATION RECOGNITION
 SCA COMPATIBLE SOFTWARE DEFINED WIDEBAND RECEIVER FOR REAL TIME ENERGY DETECTION AND MODULATION RECOGNITION Peter Andreadis, Martin Phisel, Robin Addison CRC, Ottawa, Canada (peter.andreadis@crc.ca ) Luca
Wideband Receiver Design
 Wideband Receiver Design Challenges and Trade-offs of a Wideband Tuning Range in Wireless Microphone Receivers in the UHF Television Band About this White Paper Professional wireless microphone systems
ECE 4670 Spring 2014 Lab 1 Linear System Characteristics
 ECE 4670 Spring 2014 Lab 1 Linear System Characteristics 1 Linear System Characteristics The first part of this experiment will serve as an introduction to the use of the spectrum analyzer in making absolute
ISSCC 2006 / SESSION 33 / MOBILE TV / 33.4
 33.4 A Dual-Channel Direct-Conversion CMOS Receiver for Mobile Multimedia Broadcasting Vincenzo Peluso, Yang Xu, Peter Gazzerro, Yiwu Tang, Li Liu, Zhenbiao Li, Wei Xiong, Charles Persico Qualcomm, San
EEC 134 Final Report
 EEC 134 Final Report Team Falcon 9 Alejandro Venegas Marco Venegas Alexis Torres Gerardo Abrego Abstract: EEC 134 By Falcon 9 In the EEC 134 course the focus is on RF/microwave systems design. The main
LIMITATIONS IN MAKING AUDIO BANDWIDTH MEASUREMENTS IN THE PRESENCE OF SIGNIFICANT OUT-OF-BAND NOISE
 LIMITATIONS IN MAKING AUDIO BANDWIDTH MEASUREMENTS IN THE PRESENCE OF SIGNIFICANT OUT-OF-BAND NOISE Bruce E. Hofer AUDIO PRECISION, INC. August 2005 Introduction There once was a time (before the 1980s)
PXIe Contents SPECIFICATIONS. 14 GHz and 26.5 GHz Vector Signal Analyzer
 SPECIFICATIONS PXIe-5668 14 GHz and 26.5 GHz Vector Signal Analyzer These specifications apply to the PXIe-5668 (14 GHz) Vector Signal Analyzer and the PXIe-5668 (26.5 GHz) Vector Signal Analyzer with
Third-Method Narrowband Direct Upconverter for the LF / MF Bands
 Third-Method Narrowband Direct Upconverter for the LF / MF Bands Introduction Andy Talbot G4JNT February 2016 Previous designs for upconverters from audio generated from a soundcard to RF have been published
TSEK02: Radio Electronics Lecture 8: RX Nonlinearity Issues, Demodulation. Ted Johansson, EKS, ISY
 TSEK02: Radio Electronics Lecture 8: RX Nonlinearity Issues, Demodulation Ted Johansson, EKS, ISY 2 RX Nonlinearity Issues, Demodulation RX nonlinearities (parts of 2.2) System Nonlinearity Sensitivity
Superheterodyne Receiver Tutorial
 1 of 6 Superheterodyne Receiver Tutorial J P Silver E-mail: john@rfic.co.uk 1 ABSTRACT This paper discusses the basic design concepts of the Superheterodyne receiver in both single and double conversion
David Fisher EEC 134 Application Note
 David Fisher EEC 134 Application Note RF System Design and Component Selection for a FMCW Radar System Introduction Since their initial development in the first half of the twentieth century, radar systems
Sampling. A Simple Technique to Visualize Sampling. Nyquist s Theorem and Sampling
 Sampling Nyquist s Theorem and Sampling A Simple Technique to Visualize Sampling Before we look at SDR and its various implementations in embedded systems, we ll review a theorem fundamental to sampled
2) How fast can we implement these in a system
 How fast can we implement these in a system") Filtration Now that we have looked at the concept of interpolation we have seen practically that a "digital filter" (hold, or interpolate) can affect the frequency response of the overall system. We need
Filtration Now that we have looked at the concept of interpolation we have seen practically that a "digital filter" (hold, or interpolate) can affect the frequency response of the overall system. We need
Reference Clock Distribution for a 325MHz IF Sampling System with over 30MHz Bandwidth, 64dB SNR and 80dB SFDR
 Reference Clock Distribution for a 325MHz IF Sampling System with over 30MHz Bandwidth, 64dB SNR and 80dB SFDR Michel Azarian Clock jitter introduced in an RF receiver through reference clock buffering
Keysight Technologies Pulsed Antenna Measurements Using PNA Network Analyzers
 Keysight Technologies Pulsed Antenna Measurements Using PNA Network Analyzers White Paper Abstract This paper presents advances in the instrumentation techniques that can be used for the measurement and
Appendix B. Design Implementation Description For The Digital Frequency Demodulator
 Appendix B Design Implementation Description For The Digital Frequency Demodulator The DFD design implementation is divided into four sections: 1. Analog front end to signal condition and digitize the
Multiple Reference Clock Generator
 A White Paper Presented by IPextreme Multiple Reference Clock Generator Digitial IP for Clock Synthesis August 2007 IPextreme, Inc. This paper explains the concept behind the Multiple Reference Clock Generator
A 3 TO 30 MHZ HIGH-RESOLUTION SYNTHESIZER CONSISTING OF A DDS, DIVIDE-AND-MIX MODULES, AND A M/N SYNTHESIZER. Richard K. Karlquist
 A 3 TO 30 MHZ HIGH-RESOLUTION SYNTHESIZER CONSISTING OF A DDS, -AND-MIX MODULES, AND A M/N SYNTHESIZER Richard K. Karlquist Hewlett-Packard Laboratories 3500 Deer Creek Rd., MS 26M-3 Palo Alto, CA 94303-1392
Definitions. Spectrum Analyzer
 SIGNAL ANALYZERS Spectrum Analyzer Definitions A spectrum analyzer measures the magnitude of an input signal versus frequency within the full frequency range of the instrument. The primary use is to measure
BandPass Sigma-Delta Modulator for wideband IF signals
 BandPass Sigma-Delta Modulator for wideband IF signals Luca Daniel (University of California, Berkeley) Marco Sabatini (STMicroelectronics Berkeley Labs) maintain the same advantages of BaseBand converters
Analog and Telecommunication Electronics
 Politecnico di Torino - ICT School Analog and Telecommunication Electronics E1 - Filters type and design» Filter taxonomy and parameters» Design flow and tools» FilterCAD example» Basic II order cells
TSEK02: Radio Electronics Lecture 8: RX Nonlinearity Issues, Demodulation. Ted Johansson, EKS, ISY
 TSEK02: Radio Electronics Lecture 8: RX Nonlinearity Issues, Demodulation Ted Johansson, EKS, ISY RX Nonlinearity Issues: 2.2, 2.4 Demodulation: not in the book 2 RX nonlinearities System Nonlinearity
Time Matters How Power Meters Measure Fast Signals
 Time Matters How Power Meters Measure Fast Signals By Wolfgang Damm, Product Management Director, Wireless Telecom Group Power Measurements Modern wireless and cable transmission technologies, as well
TSEK38 Radio Frequency Transceiver Design: Project work B
 TSEK38 Project Work: Task specification A 1(15) TSEK38 Radio Frequency Transceiver Design: Project work B Course home page: Course responsible: http://www.isy.liu.se/en/edu/kurs/tsek38/ Ted Johansson (ted.johansson@liu.se)
Microwave Metrology -ECE 684 Spring Lab Exercise I&Q.v3: I&Q Time and Frequency Domain Measurements
 Lab Exercise I&Q.v3: I&Q Time and Frequency Domain Measurements In this lab exercise you will perform measurements both in time and in frequency to establish the relationship between these two dimension
Presentation Outline. Advisors: Dr. In Soo Ahn Dr. Thomas L. Stewart. Team Members: Luke Vercimak Karl Weyeneth. Karl. Luke
 Bradley University Department of Electrical and Computer Engineering Senior Capstone Project Presentation May 2nd, 2006 Team Members: Luke Vercimak Karl Weyeneth Advisors: Dr. In Soo Ahn Dr. Thomas L.
RF System Design and Analysis Software Enhances RF Architectural Planning
 RF System Design and Analysis Software Enhances RF Architectural Planning By Dale D. Henkes Applied Computational Sciences (ACS) Historically, commercial software This new software enables convenient simulation
TSEK38: Radio Frequency Transceiver Design Lecture 3: Superheterodyne TRX design
 TSEK38: Radio Frequency Transceiver Design Lecture 3: Superheterodyne TRX design Ted Johansson, ISY ted.johansson@liu.se 2 Outline of lecture 3 Introduction RF TRX architectures (3) Superheterodyne architecture
Design Implementation Description for the Digital Frequency Oscillator
 Appendix A Design Implementation Description for the Frequency Oscillator A.1 Input Front End The input data front end accepts either analog single ended or differential inputs (figure A-1). The input
The Discussion of this exercise covers the following points:
 Exercise 3-2 Frequency-Modulated CW Radar EXERCISE OBJECTIVE When you have completed this exercise, you will be familiar with FM ranging using frequency-modulated continuous-wave (FM-CW) radar. DISCUSSION
Pre-Lab. Introduction
 Pre-Lab Read through this entire lab. Perform all of your calculations (calculated values) prior to making the required circuit measurements. You may need to measure circuit component values to obtain
UNIVERSITY OF CALIFORNIA College of Engineering Department of Electrical Engineering And Computer Sciences MULTIFREQUENCY CELL IMPEDENCE MEASUREMENT
 UNIVERSITY OF CALIFORNIA College of Engineering Department of Electrical Engineering And Computer Sciences MULTIFREQUENCY CELL IMPEDENCE MEASUREMENT EE247 Term Project Eddie Ng Mounir Bohsali Professor
DIGITAL FILTERING OF MULTIPLE ANALOG CHANNELS
 DIGITAL FILTERING OF MULTIPLE ANALOG CHANNELS Item Type text; Proceedings Authors Hicks, William T. Publisher International Foundation for Telemetering Journal International Telemetering Conference Proceedings
Co-existence. DECT/CAT-iq vs. other wireless technologies from a HW perspective
 Co-existence DECT/CAT-iq vs. other wireless technologies from a HW perspective Abstract: This White Paper addresses three different co-existence issues (blocking, sideband interference, and inter-modulation)
and RTL-SDR Wireless Systems
 Laboratory 4 FM Receiver using MATLAB and RTL-SDR Wireless Systems TLEN 5830 Wireless Systems This Lab introduces the working of FM Receiver using MATLAB and Software Defined Radio This exercise encompasses
ELEN 701 RF & Microwave Systems Engineering. Lecture 2 September 27, 2006 Dr. Michael Thorburn Santa Clara University
 ELEN 701 RF & Microwave Systems Engineering Lecture 2 September 27, 2006 Dr. Michael Thorburn Santa Clara University Lecture 2 Radio Architecture and Design Considerations, Part I Architecture Superheterodyne
DATA INTEGRATION MULTICARRIER REFLECTOMETRY SENSORS
 Report for ECE 4910 Senior Project Design DATA INTEGRATION IN MULTICARRIER REFLECTOMETRY SENSORS Prepared by Afshin Edrissi Date: Apr 7, 2006 1-1 ABSTRACT Afshin Edrissi (Cynthia Furse), Department of
EET 223 RF COMMUNICATIONS LABORATORY EXPERIMENTS
 EET 223 RF COMMUNICATIONS LABORATORY EXPERIMENTS Experimental Goals A good technician needs to make accurate measurements, keep good records and know the proper usage and limitations of the instruments
RF Amplifier with Mirror Frequency Filter
 Radio Project ETI 041 RF Amplifier with Mirror Frequency Filter Qiran Zhou 07SOC Lunds tekniska högskola Supervisor: Göran Jönsson Abstract When using traditional RF filter, we usually need 7 to 8 orders
Low Cost Transmitter For A Repeater
 Low Cost Transmitter For A Repeater 1 Desh Raj Yumnam, 2 R.Bhakkiyalakshmi, 1 PG Student, Dept of Electronics &Communication (VLSI), SRM Chennai, 2 Asst. Prof, SRM Chennai, Abstract - There has been dramatically
Lecture 3 Review of Signals and Systems: Part 2. EE4900/EE6720 Digital Communications
 EE4900/EE6720: Digital Communications 1 Lecture 3 Review of Signals and Systems: Part 2 Block Diagrams of Communication System Digital Communication System 2 Informatio n (sound, video, text, data, ) Transducer
Charan Langton, Editor
 Charan Langton, Editor SIGNAL PROCESSING & SIMULATION NEWSLETTER Baseband, Passband Signals and Amplitude Modulation The most salient feature of information signals is that they are generally low frequency.
Radio Receivers. Al Penney VO1NO
 Radio Receivers Al Penney VO1NO Role of the Receiver The Antenna must capture the radio wave. The desired frequency must be selected from all the EM waves captured by the antenna. The selected signal is
High Speed & High Frequency based Digital Up/Down Converter for WCDMA System
 High Speed & High Frequency based Digital Up/Down Converter for WCDMA System Arun Raj S.R Department of Electronics & Communication Engineering University B.D.T College of Engineering Davangere-Karnataka,
New System Simulator Includes Spectral Domain Analysis
 New System Simulator Includes Spectral Domain Analysis By Dale D. Henkes, ACS Figure 1: The ACS Visual System Architect s System Schematic With advances in RF and wireless technology, it is often the case
For the system to have the high accuracy needed for many measurements,
 Sampling and Digitizing Most real life signals are continuous analog voltages. These voltages might be from an electronic circuit or could be the output of a transducer and be proportional to current,
Understanding RF and Microwave Analysis Basics
 Understanding RF and Microwave Analysis Basics Kimberly Cassacia Product Line Brand Manager Keysight Technologies Agenda µw Analysis Basics Page 2 RF Signal Analyzer Overview & Basic Settings Overview
THE BASICS OF RADIO SYSTEM DESIGN
 THE BASICS OF RADIO SYSTEM DESIGN Mark Hunter * Abstract This paper is intended to give an overview of the design of radio transceivers to the engineer new to the field. It is shown how the requirements
Piezoelectric Discriminators
 Introduction Piezoelectric Discriminators Ceramic discriminators are designed to be used in quadrature detection circuits to remove a FM carrier wave. These circuits receive a FM signal, like in a FM radio,
Department of Electronic Engineering NED University of Engineering & Technology. LABORATORY WORKBOOK For the Course SIGNALS & SYSTEMS (TC-202)
") Department of Electronic Engineering NED University of Engineering & Technology LABORATORY WORKBOOK For the Course SIGNALS & SYSTEMS (TC-202) Instructor Name: Student Name: Roll Number: Semester: Batch:
Department of Electronic Engineering NED University of Engineering & Technology LABORATORY WORKBOOK For the Course SIGNALS & SYSTEMS (TC-202) Instructor Name: Student Name: Roll Number: Semester: Batch:
Lab Assignment #3 Analog Modulation (An Introduction to RF Signal, Noise and Distortion Measurements in the Frequency Domain)
") Lab Assignment #3 Analog Modulation (An Introduction to RF Signal, Noise and Distortion Measurements in the Frequency Domain) By: Timothy X Brown, Olivera Notaros, Nishant Jadhav TLEN 5320 Wireless Systems
Lab Assignment #3 Analog Modulation (An Introduction to RF Signal, Noise and Distortion Measurements in the Frequency Domain) By: Timothy X Brown, Olivera Notaros, Nishant Jadhav TLEN 5320 Wireless Systems
Preliminary features of the SDR-X receiver SDR-X , PowerSDR Winrad Winrad DDS SFDR SFDR AD995 AD99 1
 Preliminary features of the SDR-X receiver The SDR-X receiver, in its full version is capable of continuously tuning the entire HF spectrum, 6m ( 50-52 MHz) band included. SSB, AM etc. demodulation, bandpass