Evaluation of a modified sinar 54M digital camera at the National Gallery of Art, Washington DC during April, 2005
|
|
|
- Amice Blake
- 5 years ago
- Views:
Transcription
1 Rochester Institute of Technology RIT Scholar Works Articles 2005 Evaluation of a modified sinar 54M digital camera at the National Gallery of Art, Washington DC during April, 2005 Roy Berns Lawrence Taplin Follow this and additional works at: Recommended Citation Art-SI.org (Art Spectral Imaging) This Technical Report is brought to you for free and open access by RIT Scholar Works. It has been accepted for inclusion in Articles by an authorized administrator of RIT Scholar Works. For more information, please contact ritscholarworks@rit.edu.

2 Evaluation of a Modified Sinar 54M Digital Camera at the National Gallery of Art, Washington DC during April, 2005 Roy S. Berns and Lawrence A. Taplin July 2005
3
4 Table of Contents Introduction... 1 Workflows... 1 Lighting... 4 Test Target Evaluations... 6 Summary of Analysis and Results... 6 Statistical Data Tables Gretag Macbeth ColorChecker Color Rendition Chart Performance Plots Gamblin Conservation Colors Target Performance Plots GretagMacbeth ColorChecker DC Performance Plots Blues Pigment Target Performance Plots Henri Mattise s Pot of Geraniums Summary of Results Detailed Analysis Plots National Gallery of Art Visual Editing Procedure Demonstration of MCSL-Sinar System Conclusions References Acknowledgments... 53
5
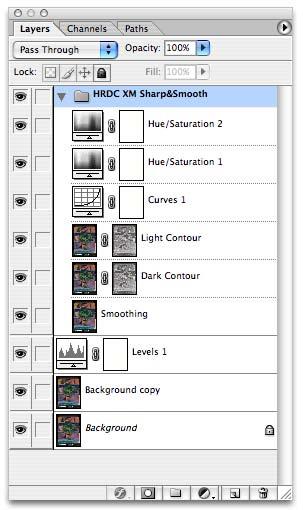
6 Introduction On April , the RIT team brought their prototype Sinar 54M camera system to the National Gallery of Art s Imaging Department. The team included Lawrence Taplin, Mitchell Rosen, and Roy Berns. RIT brought a spectroradiometer to measure the daylight fluorescent viewing illumination and if time allowed, NGA s CRT display. They also brought a Macintosh G5 to control the camera and for image processing. NGA is using a production Sinar 54M. This enabled a direct comparison between NGA s digital imaging workflow and the RIT workflow. Both cameras used the same lighting, Broncolor pulsed Xenon, lighting geometry, and photography studio. A set of test targets was imaged by each camera system. In addition, Matisse s Pot of Geraniums, previously imaged by RIT using their 31-channel spectral camera, 1-3 was also imaged. The digital masters from each camera system were converted to an output profile for an Epson Ultrachrome inkjet printer. One-to-one prints were made for the Matisse painting and compared with the actual painting under the daylight fluorescent viewing environment. The RIT prototype camera and the print comparison were evaluated by NGA staff from the imaging, conservation, and finance departments. Workflows The NGA workflow is diagrammed in Figure 1. The camera software was used for digital flat fielding (applying the shading reference) and for white balance. This raw file was archived. A camera profile was assigned to the raw file and then converted to the ProPhoto RGB working color space. This image was also archived. Visual editing was performed by comparing the original as viewed under daylight fluorescent illumination with its rendering on an ICC-profiled CRT display. Sharpening was also performed. This edited file was the archived digital master and used for all subsequent applications. All the adjustments were stored as layers so that the visual editing was well documented and reversible. 1


7 Figure 1. NGA s digital workflow. Areas in green are camera software processing. Areas in red are Adobe Photoshop software processing. The RIT workflow is diagrammed in Figure 2. Successive RGB images were captured through each of the two custom filters The camera software controlled the image capture and applied a correction for sensor non-uniformities. Each RGB image was actually captured in four shots; every pixel of the sensor is covered by a red, green or blue filter and the sensor is micropositioned four times to recover full color information at each pixel. (The same is true for the production Sinar as used by NGA.) Each four-shot image was reassembled into the usual noninterpolated three-channel image using a suite of imaging processing routines written in Matlab. Next, the two three-channel images (one for each filter) were registered and digitally flat fielded using an image of a white-card taken in the same lighting setup. The resulting six-channel image was converted to a spectral image using a transformation based on a calibration test target with known spectral reflectance. A CIE standard observer and an illuminant were selected to render the image colorimetrically. Since this experiment included output, the CIE standard observer and CIE illuminant D50 were used. The spectral image was then transformed to a 16-bit CIELAB TIFF image, RIT s digital master. The digital master was converted to the Epson s output profile and a print produced. Visual editing was not part of this workflow. 2

8 Figure 2. RIT s digital workflow. Areas in green are camera software processing. Areas in pink are RIT software processing. The RIT mathematical workflow was slightly different than previous experiments. 4,5 Previously, the colorimetric transformation consisted of a nonlinear stage that accounted for stray light, differences in geometry between the reference spectrophotometer and camera system, and any nonlinearities in the camera signal processing. Experimentally, the transfer functions were always linear with a small offset. This allows the transformation to be simplified as shown in Eqs. (1) (5): 3
9 M pinv = R Reference pinv( D Reference ) (1) A = 100 S! y diag ( S )xyz (2) T!E00 = f NonLinOpt (R Reference,A,D Reference ), where T!E00 minimizes # $!E 00 (T!E00 D, A" R Reference )% & (3) M!E00 = A ( A" A) #1 T!E00 + ( I # A ( A" A) #1 A" )M pinv (4) ˆR!E00 = M!E00 D (5) where n is the number of wavelengths, i is the number of camera channels, and j is the number of reference color patches. Matrix M pinv is a [n (i+1)] transformation matrix from digital counts to reflectance computed from R Reference, a [n j] matrix containing the calibration target reference spectrophotometric measurements ranging from zero to unity and D Reference is an [(i+1) j] camera digital count matrix with the last row set to unity (homogenous coordinates). The operation pinv represents the Moore-Penrose singular-value decomposition-based pseudoinverse function in Matlab. A is a [n 3] matrix of tristimulus weights computed from S, a [n 1] vector of the spectral power distribution of the reference light source, y, a [n 1] vector of the reference luminance color matching function, and xyz, a [n 3] matrix of the reference color matching functions. T!E00 is a [3 (i+1)] transformation matrix from digital counts to tristimulus values fit using nonlinear optimization described below. M!E00 [n (i+1)] is a transformation matrix from digital counts to reflectance computed from A, T!E00, I, an [n n] identity matrix, and M!E00. ˆR!E00 is a [n 1] vector of imaging-based estimated reflectances; it is simply the product of M!E00 and D, a [(i+1) 1] vector of camera digital counts with the last element set to unity. In Eq. (3), T!E00 was optimized using a two stage process. First, nonlinear optimization was used to minimize the average E 00 to the reference tristimulus values using a starting value for T!E00 of A! R Reference pinv(d Reference ). These optimized matrix coefficients were used as starting values for a second nonlinear constrained optimization that minimized (Mean(ΔE 00 )/Mean(ΔE 00 ) Optimization 1 + max(δe 00 )/max(δe 00 ) Optimization 1). Both optimizations were subject to the coefficients not changing more than ±50% of their starting values. Lighting The lighting geometry used at NGA was set up to accentuate surface topography. The Xenon strobes without reflectors or diffusers were at approximately a 70 angle from the surface normal 4
10 on either side of the artwork. One side had about twice the irradiance. This resulted in a quite collimated, raking illumination. NGA used a white foam core board to collect a flat field image. The Sinar software used this image to perform a digital flat fielding. In the RIT workflow, this image was also used for digital flat fielding. Upon return to RIT following these experiments, it was discovered that the foam core was slightly curved and scratched. This lack of spatial uniformity affected the transformation accuracy of the RIT workflow. Furthermore, the foam core appeared to have different reflectance properties in the long visible spectrum compared with shorter wavelengths. As a consequence two of the six channels of the RIT camera was over-exposed in part of the image. (This was not discovered at NGA because the modified Sinar capture software only previewed the first three channels. The over-exposure occurred for the fourth and fifth channels.) This is shown as falsecolor images of the foam core for the six channels, Figure 3. Channel four was nearly completely clipped as well as the right-hand side of channel five. Because of the over-exposure, the imaging of the test targets was repeated at RIT using a nearly identical lighting set up and a light gray uniform surface rather than the foam core for digital flat fielding. The painting could not be reimaged. In order to generate a digital master for the painting, the average digital values of channels 1-3 were used to create a digital flat fielding for all six channels. Normally, each channel was treated separately. 5

11 Figure 3. MCSL-Sinar camera system false-color images of the foam core used for digital flat fielding. Areas in dark red correspond to clipped values. Test Target Evaluations Summary of Analysis and Results Three imaging systems were evaluated. The first was a spectral camera consisting of a Quantix area-array monochrome sensor coupled to a CRI liquid-crystal tunable filter. The lighting was diffuse tungsten halogen. This system was the first RIT camera developed for this research project. Details on its construction and performance have been previously described. 1-3 This imaging occurred during December Two targets were used for calibration: the Gretag- Macbeth ColorChecker DC and a custom target of blue acrylic paints mixed with titanium white including ultramarine and cobalt, This system will be abbreviated as the Quantix-LCTF system. The second system was the modified Sinar 54H, described in detail previously. 4-7 The modification included replacing the long-visible NIR blocking filter on the CCD with clear glass, a two-filter slider with custom filters, new Sinar controlling software, and extensive image processing software written in the Matlab software environment. Various targets were used for calibration. This system will be abbreviated as the MCSL-Sinar system. 6
12 The third system was a production Sinar 54H used routinely at NGA. The Gretag-Macbeth ColorChecker SG was used as the calibration target. This system will be abbreviated as the NGA- Sinar system. Table I lists the targets used in this analysis. Images of these targets are shown in Figure 4. Table I. Test targets used for calibration and verification. Target Abbreviation Number of Samples GretagMacbeth ColorChecker Color Rendition Chart GretagMacbeth ColorChecker DC (Digital Camera) ColorChecker or CC ColorChecker DC or CCDC Gamblin Conservation Colors mixed with titanium white Gamblin 63 Blue acrylic Liquitex paints mixed with titanium white Blue Pigments or Blues 56 7


13 Figure 4. Test targets used for calibration and verification. Top left: ColorCheckerDC;top right: ColorChecker; bottom: Blues Pigments and Gamblin Conservation Colors. The colorimetric performance of the three systems is shown in Table II. Both E 00 and E* ab are shown, the former metric having better correlation with subjective evaluations of adjacent uniform color fields 8 and the latter having better correlation with images. 9 The average and 90 th 8
14 percentile rows are highlighted in light green. These are the most important summary statistics. These data for the three systems are plotted in Figures 5 and 6. The Best Case corresponds to the MCSL-Sinar system where a target was used for calibration and verification. This provides a sense of the best that can be achieved using the MCSL-Sinar system and a linear signal processing workflow. The small differences in performance between the Best Case and MCSL- Sinar indicate that the choice of calibration target is important. Research is still required to develop an improved calibration target for imaging paintings. The color management at NGA was very good. The listed results are typical of a well colormanaged area-array color sensor camera system. The modifications to the Sinar camera resulted in marked improvement, particularly for the Gamblin target that consisted of typical artist pigments used in paintings. On average, the MCSL-Sinar system had slightly superior colorimetric performance to the Quantix-LCTF system. This is an important result: A six-channel camera had the average colorimetric accuracy of a 31-channel camera. The maximum and 90 th percentile errors for the Quantix-LCTF system were smaller for the Blue Pigments and Gamblin Conservation Colors targets. The improved average colorimetric performance was a result of the more complex signal processing combining colorimetric and spectral optimization. The colorimetric optimization used nonlinear optimization since color differences are nonlinearly related to incident radiation. This nonlinear optimization was impractical for the Quantix-LCTF since 250,000 independent data points were used to estimate 1,116 coefficients (31 x 36 matrix). The Quantix-LCTF calibration only optimized spectral estimation accuracy. The spectral performance of the Quantix-LCTF and MCSL-Sinar systems are listed in Table III and plotted in Figure 7. MI is an abbreviation for metameric index. This index is a E 00 value for CIE Illuminant A following a slight spectral adjustment 10 such that for CIE Illuminant D65, the colorimetric data are identical, that is a E 00 of zero. srms is an abbreviation for spectral root-mean-square error over the wavelength range of nm. The Quantix-LCTF system had higher spectral accuracy than the MCSL-Sinar system. This was the expected result since it was a true spectral device whereas the MCSL-Sinar was an abridged device. What was unexpected was that the performance of the MCSL-Sinar system was so close to the Quantix- LCTF system. Furthermore, the Best Case results exceeded those of the Quantix-LCTF system. To be fair, it needs to be pointed out that much more effort had been put into development of the MCSL-Sinar system. Once we achieved an acceptable result for the spectral camera, we began looking at more practical approaches. It is likely that if we had selected the Quantix-LCTF system as the recommended system, better performance would be reported herein. 9


15 Figure 5. The average colorimetric performance of each imaging system for each listed target. Figure 6. The 90 th percentile colorimetric performance of each imaging system for each listed target. 10

16 Figure 7. The average spectral root-mean-square performance of each imaging system for each listed target. 11
17 Table II. Colorimetric performance summary for the three camera systems and a best-case computation where the same target was used for both calibration and verification. Matched Calibration and Verification ColorChecker DC and Blues Calibration ColorChecker DC and Blues Calibration ColorChecker SG Calibration Best Case Quantix-LCTF MCSL-Sinar NGA-Sinar E 00 E* ab E 00 E* ab E 00 E* ab E 00 E* ab ColorChecker DC Average Maximum Std. Dev Prctile ColorChecker Average Maximum Std. Dev Prctile Blue Pigments Average Maximum Std. Dev Prctile Gamblin Pigments Average Maximum Std. Dev Prctile
18 Table III. Spectral performance for the two RIT systems and a best-case computation where the same target was used for both calibration and verification Matched Calibration and Verification ColorChecker DC and Blues Calibration ColorChecker DC and Blues Calibration Best Case Quantix-LCTF MCSL-Sinar MI (D65 A) srms MI (D65 A) ColorChecker DC srms MI (D65 A) srms Average % % % Maximum % % % Std. Dev % % % 90Prctile % % % ColorChecker Average % % % Maximum % % % Std. Dev % % % 90Prctile % % % Blue Pigments Average % % % Maximum % % % Std. Dev % % % 90Prctile % % % Gamblin Pigments Average % % % Maximum % % % Std. Dev % % % 90Prctile % % % Statistical Data Tables The following tables list the performance of each camera system. For the colorimetric results, all calculations were carried out for the CIE 1931 Standard Observer and CIE Illuminant D50. For the MCSL-Sinar system, there are tables for each target as the calibration target. For the Quantix-LCTF system, only the ColorChecker DC and Blue Pigments targets were used for calibration. For the NGA-Sinar system, a ColorChecker SG was used for calibration. This target was not evaluated directly in these tests. However the ColorChecker SG includes a traditional, though smaller, ColorChecker. It is likely that the results for the ColorChecker are indicative of the profile accuracy of the NGA-Sinar system with matched calibration and verification targets. 13
19 Table IV. Summary statistics for the NGA-Sinar system for each listed target. The GretagMacbeth ColorChecker SG was used for calibration. Statistic E 00 E* ab ColorChecker DC Average Maximum Std. Dev Prctile ColorChecker Average Maximum Std. Dev Prctile Blue Pigments Average Maximum Std. Dev Prctile Gamblin Pigments Average Maximum Std. Dev Prctile Table V. Summary statistics for the Quantix-LCTF system for each listed target. The GretagMacbeth ColorChecker DC and Blues Pigments targets were used for calibration. MI Statistic E 00 E* ab (D65->A) srms ColorChecker DC Average % Maximum % Std. Dev % 90Prctile % ColorChecker Average % Maximum % Std. Dev % 90Prctile % Blue Pigments Average % Maximum % Std. Dev % 90Prctile % Gamblin Pigments Average % Maximum % Std. Dev % 90Prctile % 14
20 Table VI. Summary statistics for the MCSL-Sinar system for each listed target. The GretagMacbeth ColorChecker DC was used for calibration. Statistic E 00 E* ab MI srms ColorChecker DC Average % Maximum % Std. Dev % 90Prctile % ColorChecker Average % Maximum % Std. Dev % 90Prctile % Blue Pigments Average % Maximum % Std. Dev % 90Prctile % Gamblin Pigments Average % Maximum % Std. Dev % 90Prctile % Table VII. Summary statistics for the MCSL-Sinar system for each listed target. The GretagMacbeth ColorChecker was used for calibration. Statistic E 00 E* ab MI srms ColorChecker DC Average % Maximum % Std. Dev % 90Prctile % ColorChecker Average % Maximum % Std. Dev % 90Prctile % Blue Pigments Average % Maximum % Std. Dev % 90Prctile % Gamblin Pigments Average % Maximum % Std. Dev % 90Prctile % 15
21 Table VIII. Summary statistics for the MCSL-Sinar system for each listed target. The GretagMacbeth ColorChecker DC and Blues Pigments targets were used for calibration. Statistic E 00 E* ab MI srms ColorChecker DC Average % Maximum % Std. Dev % 90Prctile % ColorChecker Average % Maximum % Std. Dev % 90Prctile % Blue Pigments Average % Maximum % Std. Dev % 90Prctile % Gamblin Pigments Average % Maximum % Std. Dev % 90Prctile % Table IX. Summary statistics for the MCSL-Sinar system for each listed target. The Gamblin Conservation Colors target was used for calibration. Statistic E 00 E* ab MI) srms ColorChecker DC Average % Maximum % Std. Dev % 90Prctile % ColorChecker Average % Maximum % Std. Dev % 90Prctile % Blue Pigments Average % Maximum % Std. Dev % 90Prctile % Gamblin Pigments Average % Maximum % Std. Dev % 90Prctile % 16
22 Table X. Summary statistics for the MCSL-Sinar system for each listed target. The Blues Pigments target was used for calibration. Statistic E 00 E* ab MI srms ColorChecker DC Average % Maximum % Std. Dev % 90Prctile % ColorChecker Average % Maximum % Std. Dev % 90Prctile % Blue Pigments Average % Maximum % Std. Dev % 90Prctile % Gamblin Pigments Average % Maximum % Std. Dev % 90Prctile % Gretag Macbeth ColorChecker Color Rendition Chart Performance Plots The following figures compare the accuracy performance of each system s measurement of the ColorChecker, a common target in the imaging industry to judge color performance. The colorimetric differences between the measured spectral data and the digital-masters are plotted in Figure 8. The left-hand plots are a*b* plots, showing chromatic differences. The ends of each arrow are the spectrophotometric-based values. The arrowheads are data extracted from the digital master. These arrows can be thought of as vectors. Vectors pointing away or towards the origin describe differences in chroma while changes in other directions describe differences in hue. The right-hand plots are L*C* ab plots, showing lightness and chroma for the same measurement data. Vectors pointing up or down describe differences in lightness while vectors moving from right to left or vice versa describe differences in chroma. Since the goal of the imaging was to create color-accurate image files, these difference vectors, in fact, are error vectors (based on the reasonable assumption that the spectrophotometer measurements were accurate). Ideally, only the arrowhead should be visible. All three systems had reasonable 17
23 accuracy. For the NGA system, there was a small amount of lightness compression and some chroma reduction for the yellow patch. For the Quantix-LCTF system, the purple patch was darker and more chromatic. Figure 9 is a plot of the histogram of the total color difference calculation, E 00. The goal was to have a small distribution centered at a value near or below unity. This was only achieved for the MCSL-Sinar system. The two RIT systems have spectral capabilities. The measured and estimated spectra for the ColorChecker are plotted in Figure 10. For the chromatic patches, both systems had reasonable performance. For the neutrals, the MCSL-Sinar system had excessive spectral undulation. This is a common result for such an abridged spectrometer. Improving spectral performance for neutrals will be addressed in the future. Figure 11 provides an alternative approach to evaluating spectral error. The average spectral difference as a function of wavelength is plotted as the blue solid line. The Quantix-LCTF system had a nearly flat curve quite close to zero, the desired result whereas the MCSL-Sinar system had a strong undulation. At every wavelength, a scatter plot could be made comparing the spectrophotometer and camera system and a line fit to these data. A correlation coefficient of the line fit would indicate the amount of scatter. In order to have a number with similar magnitude to the spectral differences, the correlation coefficient, ranging between zero and unity, was subtracted from unity. Perfect correlation would yield zero. For both systems, large scatter occurred for short wavelengths. This was largely caused by the calibration targets using titanium dioxide white. It had very low reflectance in this wavelength range and the spectral variation of the target patches was very small. This resulted in large uncertainty when estimating these wavelengths using each camera system. A second reason concerned the low quantum efficiency of CCD sensors in this wavelength range, also increasing uncertainty. 18
24 Figure 8. Error vectors for each listed camera system. Arrowhead represents the digital master while the end of the tail represents the reference value. Top: NGA-Sinar; Middle: MCSL-Sinar; Bottom: Quantix- LCTF. 19
25 Figure 9. Colorimetric histograms for each listed camera system. Arrowhead represents the digital master while the end of the tail represents the reference value. Top: NGA-Sinar; Middle: MCSL-Sinar; Bottom: Quantix-LCTF. 20
 and")
26 Figure 10. Spectral comparison between reference spectrophotometer (red) and imaging system (blue). Top: MCSL-Sinar; Bottom: Quantix-LCTF. 21
27 Figure 11. Spectral comparison between reference spectrophotometer and imaging system. Red dashed line represents unity minus correlation coefficient. Blue line represents the average difference Top: MCSL- Sinar; Bottom: Quantix-LCTF. 22
28 Gamblin Conservation Colors Target Performance Plots The following figures compare the accuracy performance of each system s measurement of the Gamblin target. This is an important target since it is composed of artist pigments. The colorimetric error vectors, plotted in Figure 12, reveal a systematic error in the NGA- Sinar system for yellows, reds, and blues with long-wavelength reflectance tails such as cobalt and ultramarine. Modifying the Sinar system eliminated these systematic errors. The Quantix- LCTF system showed systematic errors for dioxazine purple and cobalt violet. These errors are also revealed in the color-difference histograms, Figure 13. For the NGA-Sinar and Quantix- LCTF systems, the histograms have tails towards large color differences. For the MCSL-Sinar system, the distribution was well centered about 1 E 00. The spectral fits for both RIT systems were good. For this target, the excessive spectral undulation was much smaller for the neutral patches. It seems that the spectral estimation accuracy for neutrals was very sensitive to small changes in digital values. Similar to the results for the ColorChecker, there was large uncertainty at short wavelengths as well as greater undulation for the MCSL-Sinar system in comparison to the Quantix-LCTF system. 23
29 Figure 12. Error vectors for each listed camera system. Arrowhead represents the digital master while the end of the tail represents the reference value. Top: NGA-Sinar; Middle: MCSL-Sinar; Bottom: Quantix- LCTF. 24
30 Figure 13. Colorimetric histograms for each listed camera system. Arrowhead represents the digital master while the end of the tail represents the reference value. Top: NGA-Sinar; Middle: MCSL-Sinar; Bottom: Quantix-LCTF. 25
 and")
31 Figure 14. Spectral comparison between reference spectrophotometer (red) and imaging system (blue). Top: MCSL-Sinar; Bottom: Quantix-LCTF. 26
32 Figure 15. Spectral comparison between reference spectrophotometer and imaging system. Red dashed line represents unity minus correlation coefficient. Blue line represents the average difference Top: MCSL- Sinar; Bottom: Quantix-LCTF. 27
33 GretagMacbeth ColorChecker DC Performance Plots Figure 16. Error vectors for each listed camera system. Arrowhead represents the digital master while the end of the tail represents the reference value. Top: NGA-Sinar; Middle: MCSL-Sinar; Bottom: Quantix- LCTF. 28
34 Figure 17. Colorimetric histograms for each listed camera system. Arrowhead represents the digital master while the end of the tail represents the reference value. Top: NGA-Sinar; Middle: MCSL-Sinar; Bottom: Quantix-LCTF. 29
")
35 Figure 18. Spectral comparison between reference spectrophotometer (red) and imaging system (blue) for the MCSL-Sinar system.. 30
36 Figure 19. Spectral comparison between reference spectrophotometer (red) and imaging system (blue) for the Quantix-LCTF system. 31
37 Figure 20. Spectral comparison between reference spectrophotometer and imaging system. Red dashed line represents unity minus correlation coefficient. Blue line represents the average difference Top: MCSL- Sinar; Bottom: Quantix-LCTF. 32
38 Blues Pigment Target Performance Plots Figure 21. Error vectors for each listed camera system. Arrowhead represents the digital master while the end of the tail represents the reference value. Top: NGA-Sinar; Middle: MCSL-Sinar; Bottom: Quantix- LCTF. 33
39 Figure 22. Colorimetric histograms for each listed camera system. Arrowhead represents the digital master while the end of the tail represents the reference value. Top: NGA-Sinar; Middle: MCSL-Sinar; Bottom: Quantix-LCTF. 34
 and")
40 Figure 23. Spectral comparison between reference spectrophotometer (red) and imaging system (blue). Top: MCSL-Sinar; Bottom: Quantix-LCTF. 35
41 Figure 24. Spectral comparison between reference spectrophotometer and imaging system. Red dashed line represents unity minus correlation coefficient. Blue line represents the average difference Top: MCSL- Sinar; Bottom: Quantix-LCTF. 36

42 Henri Mattise s Pot of Geraniums During the December, 2002 visit, three paintings were imaged using the Quantix-LCTF system: Alvise Vivarini, Saint Jerome Reading; Alexej von Jawlensky, Murnau; and Henri Matisse, Pot of Geraniums; all among the permanent collection of NGA. The Matisse proved to be the most challenging. 1-3 It had the widest range of pigments and spectral properties. This painting was again imaged during the April visit. Furthermore, because of its modest size, fullsize prints could be made and compared with the original painting. An image of the painting captured with the NGA-Sinar system is shown in Figure 25. A mini-checker was included to facilitate several of the NGA workflow color correction processes such as white balance. Figure 25. Henri Matisse, Pot of Geraniums. Image captured using the NGA-Sinar system. Note that this image has been compressed and reduced in resolution for this technical report. Both RIT systems were used to generate 16-bit TIFF CIELAB digital masters. As previously described, the MCSL-Sinar system s fourth channel was over-exposed when the foam core was imaged. A false-color image of each channel of the painting is plotted in Figure 26. Fortunately only the white patch of one of the verification targets was clipped for this channel. Thus, it was possible to evaluate the painting using the MCSL-Sinar system. Preliminary evaluations were performed where each test target was used to derive the calibration transformation converting 37

43 camera signals to spectral reflectance factor and CIELAB. As described above, the results are affected by the choice of calibration target. Not surprising, the Gamblin target was the most successful. There were two reasons. First, the spectral properties of this target span the spectral properties of the paintings. Second, this target was painted on canvas board, resulting in similar surface characteristics to the painting. Because the NGA lighting was so directional, having similar surface properties between the calibration target and the painting helped improve spectral and colorimetric accuracy. This second reason was more important than the first, as evidenced by the Gamblin target having superior performance to the combination of the ColorChecker DC and Blues targets. Figure 26. MCSL-Sinar camera system false-color images of the Matisse painting. Areas in dark red correspond to clipped values. Two images were evaluated from the NGA-Sinar system: the ICC color-managed TIFF file and the final digital master. This digital master included visual editing to improve the color accuracy of the color-managed file. The color matching was performed between the painting illuminated by fluorescent daylight and a color-managed computer display. 38

44 Summary of Results The colorimetric accuracy of the three digital masters and the color-managed NGA-Sinar system image is summarized in Table XI and Figures 27 and 28. The Quantix-LCTF system had the best colorimetric performance, likely a result of using more diffuse illumination, tungsten halogen with Chimera diffusers. This underscores how lighting for aesthetic purposes, as done in the April 2005 session, may not result in optimal images for scientific purposes, as done in the December 2002 session. The MCSL-Sinar system had slightly lower accuracy than the Quantix- LCTF system. Given the aesthetic-oriented lighting and problems with the digital flat fielding, this was an excellent result. The color-managed NGA-Sinar system image had reasonable performance given its intrinsic limitations as a three-channel RGB device. The most surprising result was that the visual editing decreased accuracy dramatically. Average E 00 increased by over 50%. For this test, the ICC color management was superior to the addition of visual editing. Some of the possible reasons for the increased error were a poorly color-managed display, unmatched white points and resulting chromatic adaptation differences between the viewing illuminant and display, differences in image size, and observer metamerism. The color changes were reductions in chroma and lightness. Figure 27. Average E 00 colorimetric error for each listed imaging system. Blue: the MCSL-Sinar system; red: the Quantix-LCTF system; yellow: the color-managed NGA-Sinar system; green: the digital master (following visual editing) NGA-Sinar system. 39
 NGA-Sinar system.")
45 Figure th percentila E 00 colorimetric error for each listed imaging system. Blue: the MCSL-Sinar system; red: the Quantix-LCTF system; yellow: the color-managed NGA-Sinar system; green: the digital master (following visual editing) NGA-Sinar system. The spectral performance is plotted in Figure 29- and shown in Table XII. The Quantix- LCTF system has slightly better performance than the MCSL-Sinar system. Figure 29. The average spectral root-mean-square performance of each imaging system for each listed target. 40
46 Table XI. Colorimetric performance summary for the three camera systems. Gamblin ColorChecker ColorChecker SG Conservation ColorChecker DC and Blues Calibration and Colors SG Calibration Calibration Visual Editing Calibration Quantix-LCTF Digital Master MCSL-Sinar Digital Master NGA-Sinar ICC Color Managed NGA-Sinar Digital Master E 00 E* ab E 00 E* ab E 00 E* ab E 00 E* ab Average Maximum Std. Dev Prctile Table XII. Spectral performance summary for the two RIT camera systems. ColorChecker DC and Blues Calibration Gamblin Conservation Colors Calibration Quantix-LCTF Digital Master MCSL-Sinar Digital Master MI (D65 A) srms MI (D65 A) srms Average Maximum Std. Dev Prctile
47 Detailed Analysis Plots Figure 30. Error vectors for each listed camera system. Arrowhead represents the digital master while the end of the tail represents the reference value. Top: ICC color managed NGA-Sinar; Bottom: NGA-Sinar digital master. 42
48 Figure 31. Error vectors for each listed camera system. Arrowhead represents the digital master while the end of the tail represents the reference value. Top: MCSL-Sinar; Bottom: Quantix-LCTF. 43
49 Figure 32. Colorimetric histograms for each listed camera system. Arrowhead represents the digital master while the end of the tail represents the reference value. Top: NGA-Sinar; Middle: MCSL-Sinar; Bottom: Quantix-LCTF 44
 and")
50 Figure 33. Spectral comparison between reference spectrophotometer (red) and imaging system (blue). Top: MCSL-Sinar; Bottom: Quantix-LCTF. 45
51 Figure 34. Spectral comparison between reference spectrophotometer and imaging system. Red dashed line represents unity minus correlation coefficient. Blue line represents the average difference Top: MCSL- Sinar; Bottom: Quantix-LCTF. 46


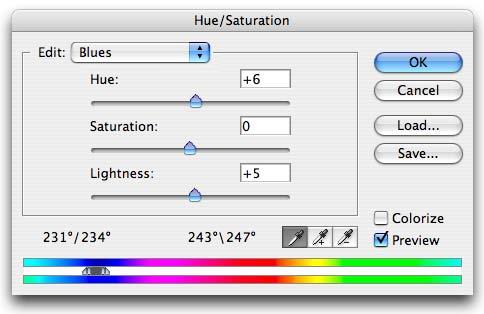
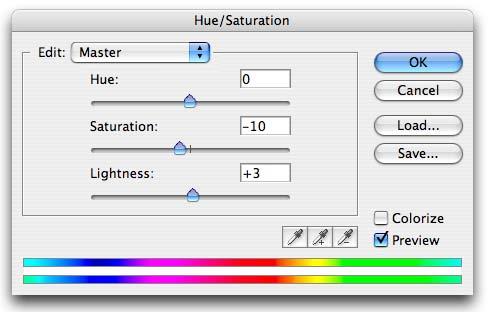
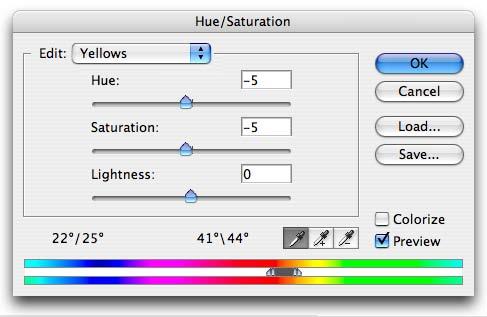
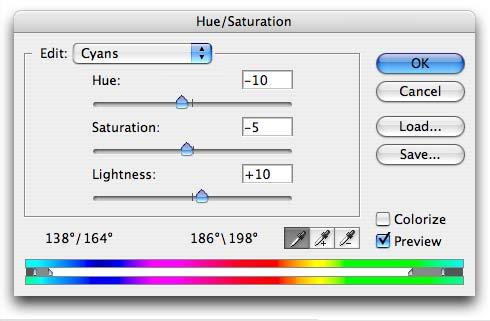
52 National Gallery of Art Visual Editing Procedure The following are screen shots of the various visual editing procedures employed to improve the color matching accuracy between the Matisse and its rendering on a color-managed display. 47


53 48
54 49

55 Demonstration of MCSL-Sinar System On the afternoon of April 27, staff from the imaging, conservation, and finance departments came to the photography studio to observe the MCSL-Sinar system in action and to evaluate prints produced using a color-managed Epson inkjet printer. In addition to the Matisse painting, a Cezanne painting undergoing conservation treatment was also imaged and prints made. The prints were not analyzed for colorimetric accuracy. Based on visual observation, the consensus was that the MCSL-Sinar system produced closer matching prints to the paintings than the NGA-Sinar system. This was consistent with the analyses of the two systems digital masters. Figure 35. Arranging the prints for visual comparison. 50


56 Figure 36. Visual critique and discussions. 51
57 Conclusions A production high-end digital camera was modified successfully to both improve its color accuracy and create a spectral image. The modifications included both hardware and software. The spectral accuracy was similar to a true spectral imager sampling the visible spectrum in 10 nm increments. This system, the MCSL-Sinar system, operates using a high-level programming environment, Matlab. Its proper operation requires extensive computer science, imaging science, and color science expertise. Future research should be aimed at developing software that is automated and photographer friendly. The performance was limited to some extent by the choice of calibration target. This is unavoidable with this type of system that is an abridged spectral device. Another area for future research would be calibration target design for imaging paintings and a general procedure for developing targets for specific types of cultural heritage. The MCSL-Sinar system was compared with a color-managed production Sinar system currently in use at the National Gallery of Art. The MCSL-Sinar system had superior performance. One of its chief advantages is the elimination of visual editing from the imaging workflow, a step that may lead to a reduction in color accuracy, as was found for this one experiment. References 1. R.S. Berns, L.A. Taplin, F.H. Imai, E.A. Day, and D.C. Day, Spectral Imaging of Matisse's Pot of Geraniums: A Case Study, in Proc. of Eleventh Color Imaging Conference: Color Science and Engineering, Systems, Technologies and Applications, IS&T, Springfield, 2003, pp F.H. Imai, L.A. Taplin, D.C. Day, E.A. Day, and R.S. Berns, Imaging at the National Gallery of Art, Washington D.C., MCSL Technical Report, December R.S. Berns, L.A. Taplin, F.H. Imai, E.A. Day, and D.C. Day, A comparison of smallaperture and image-based spectrophotometry of paintings, Studies in Conservation, in press. 4. Y. Zhao, L.A. Taplin, M. Nezamabadi, and R.S. Berns, Using matrix R method in the multispectral image archives, Proc. 10 th Congress of the International Colour Association, 2005, pp
58 5. R.S. Berns, L.A. Taplin, M. Nezamabadi, and M. Mohammadi, Spectral imaging using a commercial color-filter array digital camera, Proc. 14 th Triennial Meeting The Hague, ICOM Committee for Conservation, in press. 6. Y. Zhao, L.A. Taplin, M. Nezamabadi, and R.S. Berns, Methods of Spectral Reflectance Reconstruction for A Sinarback 54 Digital Camera, MCSL Technical Report, December R.S. Berns, L.A. Taplin, M. Nezamabadi, and Y. Zhao, Modifications of a Sinarback 54 Digital Camera for Spectral and High-Accuracy Colorimetric Imaging: Simulations and Experiments, MCSL Technical Report, June M. Melgosa, R. Huertas, R.S. Berns, Relative significance of the terms in the CIEDE2000 and CIE94 color-difference formulas, J. Opt. Soc. Am. A, 21, (2004). 9. M. Stokes, M. D. Fairchild, and R. S. Berns, Colorimetrically quantified tolerances for pictorial images, TAGA 2, 1992 pp H. S. Fairman, Metameric correction using parametric decomposition, Color Research and Application (1997). Acknowledgments The authors would like to thank the National Gallery of Art, Washington, D.C., the Museum of Modern Art, New York, and the Andrew W. Mellon Foundation for their financial support of the Art Spectral Imaging (Art-SI) Project. We also acknowledge the assistance of the Division of Imaging and Photographic Services, particularly Greg Williams, and the Division of Conservation at the National Gallery of Art. 53
Modifications of a sinarback 54 digital camera for spectral and high-accuracy colorimetric imaging: simulations and experiments
 Rochester Institute of Technology RIT Scholar Works Articles 2004 Modifications of a sinarback 54 digital camera for spectral and high-accuracy colorimetric imaging: simulations and experiments Roy Berns
A prototype calibration target for spectral imaging
 Rochester Institute of Technology RIT Scholar Works Articles 5-8-2005 A prototype calibration target for spectral imaging Mahnaz Mohammadi Mahdi Nezamabadi Roy Berns Follow this and additional works at:
Comparative study of spectral reflectance estimation based on broad-band imaging systems
 Rochester Institute of Technology RIT Scholar Works Articles 2003 Comparative study of spectral reflectance estimation based on broad-band imaging systems Francisco Imai Lawrence Taplin Ellen Day Follow
Multispectral Imaging
 Multispectral Imaging by Farhad Abed Summary Spectral reconstruction or spectral recovery refers to the method by which the spectral reflectance of the object is estimated using the output responses of
Technical Report. A New Encoding System for Image Archiving of Cultural Heritage: ETRGB Roy S. Berns and Maxim Derhak
 Technical Report A New Encoding System for Image Archiving of Cultural Heritage: ETRGB Roy S. Berns and Maxim Derhak May 2014 Executive Summary A recent analysis was performed to determine if any current
Technical Report. Evaluating Solid State and Tungsten- Halogen Lighting for Imaging Artwork via Computer Simulation Roy S. Berns
 Technical Report Evaluating Solid State and Tungsten- Halogen Lighting for Imaging Artwork via Computer Simulation Roy S. Berns January 2014 1 Executive Summary Solid- state lighting was evaluated for
Spectral imaging using a commercial colour-filter array digital camera
 VOL II PUBLISHED IN THE 14TH TRIENNIAL MEETING THE HAGUE PREPRINTS 743 Abstract A multi-year research programme is underway to develop and deliver spectral-based digital cameras for imaging cultural heritage
Technical Report Imaging at the National Gallery of Art, Washington D.C.
 Technical Report Imaging at the National Gallery of Art, Washington D.C. As part of end-to-end color reproduction from scene to reproduction using MVSI December 12-13 2002 Francisco H. Imai Lawrence A.
Munsell Color Science Laboratory Technical Report. Direct Digital Imaging of Vincent van Gogh s Self-Portrait A Personal View
 Munsell Color Science Laboratory Technical Report Direct Digital Imaging of Vincent van Gogh s Self-Portrait A Personal View Roy S. Berns berns@cis.rit.edu May, 2000 A Note About This Document in Terms
Munsell Color Science Laboratory Publications Related to Art Spectral Imaging
 Munsell Color Science Laboratory Publications Related to Art Spectral Imaging Roy S. Berns Munsell Color Science Laboratory Chester F. Carlson Center for Imaging Science Rochester Institute of Technology
Spectral reproduction from scene to hardcopy
 Spectral reproduction from scene to hardcopy Part I Multi-spectral acquisition and spectral estimation using a Trichromatic Digital Camera System associated with absorption filters Francisco H. Imai Munsell
Evaluating a Camera for Archiving Cultural Heritage
 Senior Research Evaluating a Camera for Archiving Cultural Heritage Final Report Karniyati Center for Imaging Science Rochester Institute of Technology May 2005 Copyright 2005 Center for Imaging Science
A Quantix monochrome camera with a Kodak KAF6303E CCD 2-D array was. characterized so that it could be used as a component of a multi-channel visible
 A Joint Research Program of The National Gallery of Art, Washington The Museum of Modern Art, New York Rochester Institute of Technology Technical Report March, 2002 Characterization of a Roper Scientific
EOS 5D Mark II EF50mm f/2.5 Compact Macro , Society for Imaging Science and Technology
 https://doi.org/10.2352/issn.2470-1173.2017.15.dpmi-072 2017, Society for Imaging Science and Technology Sensitivity analysis applied to ISO recommended camera color calibration methods to determine how
Luminance Adaptation Model for Increasing the Dynamic. Range of an Imaging System Based on a CCD Camera
 Luminance Adaptation Model for Increasing the Dynamic Range of an Imaging System Based on a CCD Camera Marta de Lasarte, 1 Montserrat Arjona, 1 Meritxell Vilaseca, 1, Francisco M. Martínez- Verdú, 2 and
Comparison of the accuracy of various transformations from multi-band images to reflectance spectra
 Rochester Institute of Technology RIT Scholar Works Articles 2002 Comparison of the accuracy of various transformations from multi-band images to reflectance spectra Francisco Imai Lawrence Taplin Ellen
Evaluation and improvement of the workflow of digital imaging of fine art reproductions in museums
 Evaluation and improvement of the workflow of digital imaging of fine art reproductions in museums Thesis Proposal Jun Jiang 01/25/2012 Advisor: Jinwei Gu and Franziska Frey Munsell Color Science Laboratory,
Colour Management Workflow
 Colour Management Workflow The Eye as a Sensor The eye has three types of receptor called 'cones' that can pick up blue (S), green (M) and red (L) wavelengths. The sensitivity overlaps slightly enabling
CS6640 Computational Photography. 6. Color science for digital photography Steve Marschner
 CS6640 Computational Photography 6. Color science for digital photography 2012 Steve Marschner 1 What visible light is One octave of the electromagnetic spectrum (380-760nm) NASA/Wikimedia Commons 2 What
INK LIMITATION FOR SPECTRAL OR COLOR CONSTANT PRINTING
 INK LIMITATION FOR SPECTRAL OR COLOR CONSTANT PRINTING Philipp Urban Institute of Printing Science and Technology Technische Universität Darmstadt, Germany ABSTRACT Ink limitation in the fields of spectral
Direct Digital Capture of Cultural Heritage Benchmarking American Museum Practices and Defining Future Needs. Project Report
 Direct Digital Capture of Cultural Heritage Benchmarking American Museum Practices and Defining Future Needs Project Report Roy S. Berns, Franziska S. Frey Principal Investigators Mitchell R. Rosen, Erin
Standard Viewing Conditions
 Standard Viewing Conditions IN TOUCH EVERY DAY Introduction Standardized viewing conditions are very important when discussing colour and images with multiple service providers or customers in different
Quantitative Analysis of Pictorial Color Image Difference
 Quantitative Analysis of Pictorial Color Image Difference Robert Chung* and Yoshikazu Shimamura** Keywords: Color, Difference, Image, Colorimetry, Test Method Abstract: The magnitude of E between two simple
Viewing Environments for Cross-Media Image Comparisons
 Viewing Environments for Cross-Media Image Comparisons Karen Braun and Mark D. Fairchild Munsell Color Science Laboratory, Center for Imaging Science Rochester Institute of Technology, Rochester, New York
Using HDR display technology and color appearance modeling to create display color gamuts that exceed the spectrum locus
 Rochester Institute of Technology RIT Scholar Works Presentations and other scholarship 6-15-2006 Using HDR display technology and color appearance modeling to create display color gamuts that exceed the
ABSTRACT INTRODUCTION
 Investigation into the impact of tone reproduction on the perceived image quality of fine art reproductions Susan Farnand* a, Jun Jiang a, Franziska Frey b a Munsell Color Science Lab, Rochester Institute
POTENTIAL OF MULTISPECTRAL TECHNIQUES FOR MEASURING COLOR IN THE AUTOMOTIVE SECTOR
 POTENTIAL OF MULTISPECTRAL TECHNIQUES FOR MEASURING COLOR IN THE AUTOMOTIVE SECTOR Meritxell Vilaseca, Francisco J. Burgos, Jaume Pujol 1 Technological innovation center established in 1997 with the aim
A Statistical analysis of the Printing Standards Audit (PSA) press sheet database
 press sheet database") Rochester Institute of Technology RIT Scholar Works Books 2011 A Statistical analysis of the Printing Standards Audit (PSA) press sheet database Robert Chung Ping-hsu Chen Follow this and additional works
Rochester Institute of Technology RIT Scholar Works Books 2011 A Statistical analysis of the Printing Standards Audit (PSA) press sheet database Robert Chung Ping-hsu Chen Follow this and additional works
Simulation of film media in motion picture production using a digital still camera
 Simulation of film media in motion picture production using a digital still camera Arne M. Bakke, Jon Y. Hardeberg and Steffen Paul Gjøvik University College, P.O. Box 191, N-2802 Gjøvik, Norway ABSTRACT
Capturing the Color of Black and White
 Proc. IS&T s Archiving Conference, IS&T, 96-1, June 21 Copyright IS&T, 21 Capturing the Color of Black and White Don Williams, Image Science Associates and Peter D. Burns*, Carestream Health Inc. Abstract
A simulation tool for evaluating digital camera image quality
 A simulation tool for evaluating digital camera image quality Joyce Farrell ab, Feng Xiao b, Peter Catrysse b, Brian Wandell b a ImagEval Consulting LLC, P.O. Box 1648, Palo Alto, CA 94302-1648 b Stanford
Effect of Capture Illumination on Preferred White Point for Camera Automatic White Balance
 Effect of Capture Illumination on Preferred White Point for Camera Automatic White Balance Ben Bodner, Yixuan Wang, Susan Farnand Rochester Institute of Technology, Munsell Color Science Laboratory Rochester,
Appearance Match between Soft Copy and Hard Copy under Mixed Chromatic Adaptation
 Appearance Match between Soft Copy and Hard Copy under Mixed Chromatic Adaptation Naoya KATOH Research Center, Sony Corporation, Tokyo, Japan Abstract Human visual system is partially adapted to the CRT
The 2 in 1 Grey White Balance Colour Card. user guide.
 The 2 in 1 Grey White Balance Colour Card user guide www.greywhitebalancecolourcard.co.uk Contents 01 Introduction 05 02 System requirements 06 03 Download and installation 07 04 Getting started 08 Creating
Spectral-Based Ink Selection for Multiple-Ink Printing I. Colorant Estimation of Original Objects
 Copyright 998, IS&T Spectral-Based Ink Selection for Multiple-Ink Printing I. Colorant Estimation of Original Objects Di-Yuan Tzeng and Roy S. Berns Munsell Color Science Laboratory Chester F. Carlson
COLOR APPEARANCE IN IMAGE DISPLAYS
 COLOR APPEARANCE IN IMAGE DISPLAYS Fairchild, Mark D. Rochester Institute of Technology ABSTRACT CIE colorimetry was born with the specification of tristimulus values 75 years ago. It evolved to improved
For a long time I limited myself to one color as a form of discipline. Pablo Picasso. Color Image Processing
 For a long time I limited myself to one color as a form of discipline. Pablo Picasso Color Image Processing 1 Preview Motive - Color is a powerful descriptor that often simplifies object identification
Color Reproduction. Chapter 6
 Chapter 6 Color Reproduction Take a digital camera and click a picture of a scene. This is the color reproduction of the original scene. The success of a color reproduction lies in how close the reproduced
Unit 8: Color Image Processing
 Unit 8: Color Image Processing Colour Fundamentals In 666 Sir Isaac Newton discovered that when a beam of sunlight passes through a glass prism, the emerging beam is split into a spectrum of colours The
The optical properties of varnishes and their effects on image quality
 Rochester Institute of Technology RIT Scholar Works Theses Thesis/Dissertation Collections 2001 The optical properties of varnishes and their effects on image quality Collin Day Follow this and additional
SYSTEMATIC NOISE CHARACTERIZATION OF A CCD CAMERA: APPLICATION TO A MULTISPECTRAL IMAGING SYSTEM
 SYSTEMATIC NOISE CHARACTERIZATION OF A CCD CAMERA: APPLICATION TO A MULTISPECTRAL IMAGING SYSTEM A. Mansouri, F. S. Marzani, P. Gouton LE2I. UMR CNRS-5158, UFR Sc. & Tech., University of Burgundy, BP 47870,
Color Restoration of RGBN Multispectral Filter Array Sensor Images Based on Spectral Decomposition
 sensors Article Color Restoration of RGBN Multispectral Filter Array Sensor Images Based on Spectral Decomposition Chulhee Park and Moon Gi Kang * Department of Electrical and Electronic Engineering, Yonsei
Digital Technology Group, Inc. Tampa Ft. Lauderdale Carolinas
 Digital Technology Group, Inc. Tampa Ft. Lauderdale Carolinas www.dtgweb.com Color Management Defined by Digital Technology Group Absolute Colorimetric One of the four Rendering Intents of the ICC specification.
Color Reproduction Algorithms and Intent
 Color Reproduction Algorithms and Intent J A Stephen Viggiano and Nathan M. Moroney Imaging Division RIT Research Corporation Rochester, NY 14623 Abstract The effect of image type on systematic differences
Acquisition Basics. How can we measure material properties? Goal of this Section. Special Purpose Tools. General Purpose Tools
 Course 10 Realistic Materials in Computer Graphics Acquisition Basics MPI Informatik (moving to the University of Washington Goal of this Section practical, hands-on description of acquisition basics general
Spectral Analysis of the LUND/DMI Earthshine Telescope and Filters
 Spectral Analysis of the LUND/DMI Earthshine Telescope and Filters 12 August 2011-08-12 Ahmad Darudi & Rodrigo Badínez A1 1. Spectral Analysis of the telescope and Filters This section reports the characterization
The longevity of ink on paper for fine art prints. Carinna Parraman, Centre for Fine Print Research, University of the West of England, Bristol, UK
 The longevity of ink on paper for fine art prints Carinna Parraman, Centre for Fine Print Research, University of the West of England, Bristol, UK Fine art papers http://www.nasheditions.com http://www.wilhelm-research.com
Color Science. What light is. Measuring light. CS 4620 Lecture 15. Salient property is the spectral power distribution (SPD)
") Color Science CS 4620 Lecture 15 1 2 What light is Measuring light Light is electromagnetic radiation Salient property is the spectral power distribution (SPD) [Lawrence Berkeley Lab / MicroWorlds] exists
Color Science CS 4620 Lecture 15 1 2 What light is Measuring light Light is electromagnetic radiation Salient property is the spectral power distribution (SPD) [Lawrence Berkeley Lab / MicroWorlds] exists
Spectro-Densitometers: Versatile Color Measurement Instruments for Printers
 By Hapet Berberian observations of typical proofing and press room Through operations, there would be general consensus that the use of color measurement instruments to measure and control the color reproduction
Multi-spectral Image Acquisition and Spectral Reconstruction using a Trichromatic Digital. Camera System associated with absorption filters
 Multi-spectral Image Acquisition and Spectral Reconstruction using a Trichromatic Digital Camera System associated with absorption filters Francisco H. Imai Munsell Color Science Laboratory, Rochester
Does CIELUV Measure Image Color Quality?
 Does CIELUV Measure Image Color Quality? Andrew N Chalmers Department of Electrical and Electronic Engineering Manukau Institute of Technology Auckland, New Zealand Abstract A series of 30 split-screen
A Kalman-Filtering Approach to High Dynamic Range Imaging for Measurement Applications
 A Kalman-Filtering Approach to High Dynamic Range Imaging for Measurement Applications IEEE Transactions on Image Processing, Vol. 21, No. 2, 2012 Eric Dedrick and Daniel Lau, Presented by Ran Shu School
Rejuvenating Seurat s Palette Using Color and Imaging Science: A Simulation
 Rejuvenating Seurat s Palette Using Color and Imaging Science: A Simulation ROY S. BERNS It has long been known that Seurat s Sunday on La Grande Jatte 1884 does not have the appearance that the artist
Multispectral imaging: narrow or wide band filters?
 Journal of the International Colour Association (24): 2, 44-5 Multispectral imaging: narrow or wide band filters? Xingbo Wang,2, Jean-Baptiste Thomas, Jon Y Hardeberg 2 and Pierre Gouton Laboratoire Electronique,
Color Management For Digital Photography
 Color Management For Digital Photography By: RAYMOND CHEYDLEUR ICC VICE CHAIR, CGATS CHAIR, USTAG ISO TC130 CHAIR PRINTING AND IMAGING PORTFOLIO MANAGER X-RITE INC 2 What s out, what s in for today Out
Color Image Processing EEE 6209 Digital Image Processing. Outline
 Outline Color Image Processing Motivation and Color Fundamentals Standard Color Models (RGB/CMYK/HSI) Demosaicing and Color Filtering Pseudo-color and Full-color Image Processing Color Transformation Tone
Influence of Background and Surround on Image Color Matching
 Influence of Background and Surround on Image Color Matching Lidija Mandic, 1 Sonja Grgic, 2 Mislav Grgic 2 1 University of Zagreb, Faculty of Graphic Arts, Getaldiceva 2, 10000 Zagreb, Croatia 2 University
Digital Imaging Alliance
 Digital Imaging Alliance 1 2 Camera Calibration & Profiling Little Things Matter! Minor improvements can contribute! toward our quest for perfection! 3 Camera Calibration & Profiling What"s the problem?!
Goal of this Section. Capturing Reflectance From Theory to Practice. Acquisition Basics. How can we measure material properties? Special Purpose Tools
 Capturing Reflectance From Theory to Practice Acquisition Basics GRIS, TU Darmstadt (formerly University of Washington, Seattle Goal of this Section practical, hands-on description of acquisition basics
Digital Photography: Fundamentals of Light, Color, & Exposure Part II Michael J. Glagola - December 9, 2006
 Digital Photography: Fundamentals of Light, Color, & Exposure Part II Michael J. Glagola - December 9, 2006 12-09-2006 Michael J. Glagola 2006 2 12-09-2006 Michael J. Glagola 2006 3 -OR- Why does the picture
Mark D. Fairchild and Garrett M. Johnson Munsell Color Science Laboratory, Center for Imaging Science Rochester Institute of Technology, Rochester NY
 METACOW: A Public-Domain, High- Resolution, Fully-Digital, Noise-Free, Metameric, Extended-Dynamic-Range, Spectral Test Target for Imaging System Analysis and Simulation Mark D. Fairchild and Garrett M.
Using Color Appearance Models in Device-Independent Color Imaging. R. I. T Munsell Color Science Laboratory
 Using Color Appearance Models in Device-Independent Color Imaging The Problem Jackson, McDonald, and Freeman, Computer Generated Color, (1994). MacUser, April (1996) The Solution Specify Color Independent
Case Study #1 Evaluating the Influence of Media on Inkjet Tone And Color Reproduction With the I* Metric
 Case Study #1 Evaluating the Influence of Media on Inkjet Tone And Color Reproduction With the I* Metric by Mark H. McCormick-Goodhart Article #: AaI_27_22_CS-1 Rev: March 7, 27 Source: Aardenburg Imaging
Multispectral. imaging device. ADVANCED LIGHT ANALYSIS by. Most accurate homogeneity MeasureMent of spectral radiance. UMasterMS1 & UMasterMS2
 Multispectral imaging device Most accurate homogeneity MeasureMent of spectral radiance UMasterMS1 & UMasterMS2 ADVANCED LIGHT ANALYSIS by UMaster Ms Multispectral Imaging Device UMaster MS Description
Technical)Report! Farhad!Moghareh!Abed!and!Roy!S.!Berns! August!2014! Spectral Imaging Using a Liquid Crystal Tunable Filter Part II
Report! Farhad!Moghareh!Abed!and!Roy!S.!Berns! August!2014! Spectral Imaging Using a Liquid Crystal Tunable Filter Part II") Technical)Report! Spectral Imaging Using a Liquid Crystal Tunable Filter Part II Farhad!Moghareh!Abed!and!Roy!S.!Berns! August!2014! 1. Abstract* A practical workflow was developed for the spectral calibration
Technical)Report! Spectral Imaging Using a Liquid Crystal Tunable Filter Part II Farhad!Moghareh!Abed!and!Roy!S.!Berns! August!2014! 1. Abstract* A practical workflow was developed for the spectral calibration
Quantifying mixed adaptation in cross-media color reproduction
 Rochester Institute of Technology RIT Scholar Works Presentations and other scholarship 2000 Quantifying mixed adaptation in cross-media color reproduction Sharron Henley Mark Fairchild Follow this and
M1 Simulation by Varying Printing and Proofing Substrates
 M1 Simulation by Varying Printing and Proofing Substrates Robert Chung Keywords: ICC, printing, proofing, simulation, OBA, color, workflow Abstract ICC color management can match color, pixel by pixel,
TRUESENSE SPARSE COLOR FILTER PATTERN OVERVIEW SEPTEMBER 30, 2013 APPLICATION NOTE REVISION 1.0
 TRUESENSE SPARSE COLOR FILTER PATTERN OVERVIEW SEPTEMBER 30, 2013 APPLICATION NOTE REVISION 1.0 TABLE OF CONTENTS Overview... 3 Color Filter Patterns... 3 Bayer CFA... 3 Sparse CFA... 3 Image Processing...
Color Matching with ICC Profiles Take One
 Color Matching with ICC Profiles Take One Robert Chung and Shih-Lung Kuo RIT Rochester, New York Abstract The introduction of ICC-based color management solutions promises a multitude of solutions to graphic
Color appearance in image displays
 Rochester Institute of Technology RIT Scholar Works Presentations and other scholarship 1-18-25 Color appearance in image displays Mark Fairchild Follow this and additional works at: http://scholarworks.rit.edu/other
Application of Kubelka-Munk Theory in Device-independent Color Space Error Diffusion
 Application of Kubelka-Munk Theory in Device-independent Color Space Error Diffusion Shilin Guo and Guo Li Hewlett-Packard Company, San Diego Site Abstract Color accuracy becomes more critical for color
Quantitative Hyperspectral Imaging Technique for Condition Assessment and Monitoring of Historical Documents
 bernard j. aalderink, marvin e. klein, roberto padoan, gerrit de bruin, and ted a. g. steemers Quantitative Hyperspectral Imaging Technique for Condition Assessment and Monitoring of Historical Documents
Color Management and Your Workflow. monaco
 Color Management and Your Workflow Problem in Matching Colors > THE RESULTS Wasted Time and Money Frustration Color Managed > THE RESULTS Save Time Money and Paper Get Great Prints Every Time The Cost
Color Digital Imaging: Cameras, Scanners and Monitors
 Color Digital Imaging: Cameras, Scanners and Monitors H. J. Trussell Dept. of Electrical and Computer Engineering North Carolina State University Raleigh, NC 27695-79 hjt@ncsu.edu Color Imaging Devices
Color images C1 C2 C3
 Color imaging Color images C1 C2 C3 Each colored pixel corresponds to a vector of three values {C1,C2,C3} The characteristics of the components depend on the chosen colorspace (RGB, YUV, CIELab,..) Digital
The Technology of Duotone Color Transformations in a Color Managed Workflow
 The Technology of Duotone Color Transformations in a Color Managed Workflow Stephen Herron, Xerox Corporation, Rochester, NY 14580 ABSTRACT Duotone refers to an image with various shades of a hue mapped
Report on generating a colour circle for testing in screenprinting and inkjet
 Report on generating a colour circle for testing in screenprinting and inkjet In order to test the colour capabilities of a range of inkjet devices and to compare them with screenprint hues, a colour circle
Extending Printing Color Gamut by Optimizing the Spectral Reflectance of Inks
 Extending Printing Color Gamut by Optimizing the Spectral Reflectance of Inks Yongda Chen, Roy S. Berns, Lawrence A. Taplin Munsell Color Science Laboratory, Chester F. Carlson Center for Imaging Science,
PRINT BUSINESS OUTLOOK CONFERENCE 2016
 C R E A T I N G F U T U R E P R I N T T H R O U G H T E C H N O L O G Y A N D I N N O VA T I O N PRINT BUSINESS OUTLOOK CONFERENCE 2016 March 15, 2016 Mumbai, India Color Management for Digital Photography
Quantitative Analysis of ICC Profile Quality for Scanners
 Quantitative Analysis of ICC Profile Quality for Scanners Xiaoying Rong, Paul D. Fleming, and Abhay Sharma Keywords: Color Management, ICC Profiles, Scanners, Color Measurement Abstract ICC profiling software
Color Image Processing. Jen-Chang Liu, Spring 2006
 Color Image Processing Jen-Chang Liu, Spring 2006 For a long time I limited myself to one color as a form of discipline. Pablo Picasso It is only after years of preparation that the young artist should
According to the proposed AWB methods as described in Chapter 3, the following
 Chapter 4 Experiment 4.1 Introduction According to the proposed AWB methods as described in Chapter 3, the following experiments were designed to evaluate the feasibility and robustness of the algorithms.
Color Insight: Color Optimization
 Color Insight: Color Optimization Rev March 2016 Document Outline 1. Function of the optimization process 2. Color Insight terminology 3. Color matching preset creation 4. Optimization process overview
Spectral reproduction from scene to hardcopy I: Input and Output Francisco Imai, a Mitchell Rosen, a Dave Wyble, a Roy Berns a and Di-Yuan Tzeng b
 Header for SPI use Spectral reproduction from scene to hardcopy I: Input and Output Francisco Imai, a Mitchell Rosen, a Dave Wyble, a Roy Berns a and Di-Yuan Tzeng b a Munsell Color Science Laboratory,
Nikon D2x Simple Spectral Model for HDR Images
 Nikon D2x Simple Spectral Model for HDR Images The D2x was used for simple spectral imaging by capturing 3 sets of images (Clear, Tiffen Fluorescent Compensating Filter, FLD, and Tiffen Enhancing Filter,
Rachel Schwen and Roy Berns Fall, Design of LED Clusters for Optimal Museum Lighting
 Rachel Schwen and Roy Berns Fall, 2011 Design of LED Clusters for Optimal Museum Lighting Introduction Museum lighting has historically been a field of trade offs. Museum environments have set guidelines
Color Management User Guide
 Color Management User Guide Edition July 2001 Phase One A/S Roskildevej 39 DK-2000 Frederiksberg Denmark Tel +45 36 46 01 11 Fax +45 36 46 02 22 Phase One U.S. 24 Woodbine Ave Northport, New York 11768
Color Image Processing
 Color Image Processing Jesus J. Caban Outline Discuss Assignment #1 Project Proposal Color Perception & Analysis 1 Discuss Assignment #1 Project Proposal Due next Monday, Oct 4th Project proposal Submit
Color correction software for digital images
 ver. 2.0 Color correction software for digital images User s manual - Windows OS Color balance your images automatically - experience the difference! A must-have for all digital photographers! What does
Chroma. Optical Spectral Analysis and Color Measurement
 Chroma Optical Spectral Analysis and Color Measurement Seeing is not seeing. Seeing is thinking. Contents Methods and Data Sources page 4 // 5 Measurement and Series Measurement page 6 // 7 Spectral Analysis
Spectral-Based Ink Selection for Multiple-Ink Printing II. Optimal Ink Selection
 Copyright 999, IS&T Spectral-Based Ink Selection for Multiple-Ink Printing II. Optimal Ink Selection Di-Yuan Tzeng and Roy S. Berns Munsell Color Science Laboratory RIT Chester F. Carlson Center for Imaging
Color Management for Digital Photography
 Color Management for Digital Photography A Presentation for the Akron Camera Club By Tom Noe Bonnie Janelle Lou Janelle What Is Color Management? An attempt to accurately depict color from initial camera
Imaging Photometer and Colorimeter
 W E B R I N G Q U A L I T Y T O L I G H T. /XPL&DP Imaging Photometer and Colorimeter Two models available (photometer and colorimetry camera) 1280 x 1000 pixels resolution Measuring range 0.02 to 200,000
A Study of Slanted-Edge MTF Stability and Repeatability
 A Study of Slanted-Edge MTF Stability and Repeatability Jackson K.M. Roland Imatest LLC, 2995 Wilderness Place Suite 103, Boulder, CO, USA ABSTRACT The slanted-edge method of measuring the spatial frequency
VIDEO-COLORIMETRY MEASUREMENT OF CIE 1931 XYZ BY DIGITAL CAMERA
 VIDEO-COLORIMETRY MEASUREMENT OF CIE 1931 XYZ BY DIGITAL CAMERA Yoshiaki Uetani Dr.Eng., Associate Professor Fukuyama University, Faculty of Engineering, Department of Architecture Fukuyama 729-0292, JAPAN
Substrate Correction in ISO
 (Presented at the TAGA Conference, March 6-9, 2011, Pittsburgh, PA) Substrate Correction in ISO 12647-2 *Robert Chung and **Quanhui Tian Keywords: ISO 12647-2, solid, substrate, substrate-corrected aims,
ICC Votable Proposal Submission Colorimetric Intent Image State Tag Proposal
 ICC Votable Proposal Submission Colorimetric Intent Image State Tag Proposal Proposers: Jack Holm, Eric Walowit & Ann McCarthy Date: 16 June 2006 Proposal Version 1.2 1. Introduction: The ICC v4 specification
Accelerated Light Fading Test Results
 Accelerated Light Fading Test Results Sample # AaI_008060_SN00 00 Megalux-hours completed Conservation Display Rating * Lower Exposure Limit (Megalux hours) Upper Exposure limit (Megalux hours) 9 * Please
Investigations of the display white point on the perceived image quality
 Investigations of the display white point on the perceived image quality Jun Jiang*, Farhad Moghareh Abed Munsell Color Science Laboratory, Rochester Institute of Technology, Rochester, U.S. ABSTRACT Image
Color Image Processing. Gonzales & Woods: Chapter 6
 Color Image Processing Gonzales & Woods: Chapter 6 Objectives What are the most important concepts and terms related to color perception? What are the main color models used to represent and quantify color?