A BIOMETRIC AUTHENTICATION SYSTEM PAUL GREEN Computing with Management Studies BSc SESSION 2004/2005
|
|
|
- Tiffany Barton
- 5 years ago
- Views:
Transcription
1 A BIOMETRIC AUTHENTICATION SYSTEM PAUL GREEN Computing with Management Studies BSc SESSION 2004/2005 The candidate confirms that the work submitted is their own and the appropriate credit has been given where reference has been made to the work of others. I understand that failure to attribute material which is obtained from another source may be considered as plagiarism. (Signature of student)
2 SUMMARY The aim of this project is to investigate whether images of a person s hand, obtained from a flatbed scanner, are sufficiently distinctive to be used as the basis of an authentication technique. A software prototype is to be planned and implemented, that can analyse a picture of a hand and from it draw conclusions as to who the hand belongs to. The project report will also include an evaluation of the experimental and data analysis techniques that are used to test the prototype. - i -
3 ACKNOWLEDGMENTS First of all I would like to thank my supervisor, Nick Efford, for his guidance and enthusiasm for the project and the topic area. Without his help I wouldn t have known how to get the project off the ground. The advice provided in the mid-project report and the progress meeting by Kristina Vuskovic was very insightful and very much appreciated. I would also like to thank all the participants who allowed me to scan their hands (and free of charge too!). Without their kindness I would have struggled to test the system properly. Last, but by no means least, I d like to thank my friends and family for their support throughout the project, and indeed my time at Leeds University. - ii -
4 CONTENTS Chapter 1: INTRODUCTION 1.1. Overview Project Objectives Minimum Requirements Possible Extensions Motivation Report Structure 2 Chapter 2: BACKGROUND RESEARCH 2.1. Introduction Biometric Authentication Analysis of Current Systems Hand Geometry Hand Shape Hand Texture Hardware Requirements Programming Language Selection Curvature Calculation Matching Techniques Euclidian Distance Hamming Distance Gaussian Mixture Models 10 Chapter 3: METHODOLOGY 3.1. System Framework Design User Interface Hand Image Acquisition Pre-Processing Feature Extraction Storage or Matching Testing Plans Schedule for Project Management 15 Chapter 4: IMPLEMENTATION 4.1. Scanner Control Pre-Processing Operations Feature Extraction Producing the Border 19 - iii -
5 Landmark Identification Calculation of Biometrics Finger Length Finger Width Matching Verification Identification 28 Chapter 5: EVALUATION 5.1. Data Collection Feedback Assessment Criteria Finger Length Experiments Comparison of Inner-Finger Lengths to Outer-Finger Lengths Two Innermost Finger Length Results Finger Width Results Finger Length and Width Combined Results Summary Of Results Robustness Testing Hand Orientation Hand Pressure Finger Separation Impact of Finger Nail Length Time Lapse Experiments Spoofing Identity 43 Chapter 6: CONCLUSION 6.1. General Conclusion Potential Improvements and Further Work Finger Surface Extraction 47 REFERENCES 51 APPENDIX A: A.1. Personal Reflection 54 APPENDIX B: B.1. Computer Hardware Specification 56 B.2. Scanner Hardware Specification 56 APPENDIX C: C.1. Example Scans 59 APPENDIX D: D.1. Width Sample Variation Graphs 66 D.2. Results Tables 68 APPENDIX E: E.1. Code Snippets 74 E.2. Configuration File 83 E.3. Screen Dumps of The System 84 APPENDIX F: F.1. Hand Images Used in Texture Extraction Tests 89 APPENDIX G: G.1. Project Schedule 90 G.2. Progress Log 90 G.3. Original Schedule 91 G.4. Revised Schedule 92 - iv -
6 Chapter 1 INTRODUCTION 1.1. Overview The automated society that we live in is ever changing. We all seem to be leading increasingly fast-paced lives, where waiting around is seen as tedious and often frustrating. At the same time more and more places are requiring access control; logical logins at computer workstations, clocking on and off at work, access to restricted areas and passport control are all examples where security issues are abundant and automation is desirable. No longer are tokens required, where an individual must possess a key or card to be granted access. No longer are knowledge-based approaches the only viable option. Both of these are prone to abuse; it is possible for an unauthorised user to acquire both of these and fraudulently gain access to protected areas. A better way of ensuring the user is who they claim to be, or is at least on a list of allowed users is required. Biometric authentication offers a solution. A way of distinguishing an individual uniquely from all others is possible using biometrics. Scanning and identification can all be carried out in well under a second with some of the current commercially available systems, making access control a much more secure, efficient and user-friendly process. A topical subject, biometrics continue to receive attention in current news with the Government s proposals to incorporate the technique into passports in the near future, and potentially into a compulsory national identity card scheme [1,2]. Computer manufacturers IBM have recently marketed a new laptop model [3] with a biometric finger scanner for higher security login control without the need for passwords. Microsoft has also recently produced a computer keyboard with a built-in CCD sensor for scanning fingerprints [4]. At around 58, and sure to go down in price, these keyboards have the potential of being available at all login screens and either replace or compliment current knowledge-based passwords, increasing the security of workstations Project Objectives This report aims to investigate whether images of a person s hand, obtained from a flatbed scanner, are sufficiently distinctive to be used as the basis of an authentication technique. The minimum requirements and possible extensions are provided below, and the main objectives are discussed further in the Methodology section (Chapter 3)
7 Minimum Requirements The minimum requirements of the project are to: Produce a system to perform biometric analysis of scanned images of the hand. Provide an evaluation of system accuracy and reliability using a selection of hand images Conduct some experiments to investigate the potential for spoofing Possible Extensions Possible extensions to the project are: Implement scanner control using the chosen programming language. Produce a graphical user interface Allow the scan to be conducted in real-time, displaying the captured image to the screen If in authentication mode, then display the matched username to the screen, and if authorised then provide some indication of acceptance i.e. access granted Extensively test the system, trying all ways possible to cause it to fail and where it does fail, look at ways of improving Motivation As a Computing student, artificial intelligence and computer vision has fascinated me. The topics covered in the AI modules studied at level two and three have fuelled my interest in this field. I have also enjoyed the challenges posed by the programming modules throughout my degree programme and felt that this project title encompassed both of these areas pleasingly. I wanted to develop a working prototype rather than simply analyse a current system, as I feel that producing a tangible product is very rewarding Report Structure A further look into biometrics and an analysis of systems currently available is provided in the Background Research section (page 3), coupled with a literature review of the relevant references obtained from the library where necessary. This is followed by a discussion of the proposed Methodology (page 4) and Implementation (page 16) of a software prototype to analyse an image of a hand, and from it draw conclusions as to who the hand belongs to. The results of extensive testing of the system are detailed in the Evaluation section (page 29), and an investigation to see if it can be compromised. An evaluation of the experimental and data analysis techniques that are used to test the prototype are also provided. Finally, a summary followed by suggested improvements to overcome failure (if necessary) and further work are discussed in the Conclusion section (page 44)
8 Chapter 2 BACKGROUND RESEARCH 2.1. Introduction This project is highly specialised, so there are few relevant research papers in this field. Those considered useful are outlined in the bibliography, and a literature review is provided below. Firstly, an explanation of biometrics and an analysis of systems currently available are provided, then a look at hardware requirements, followed by a discussion of programming language alternatives. There are several major obstacles in overcoming the problem of producing a biometric authentication system, as outlined in Chapter 3. Feature extraction requires the landmarks of the hand image to be known (discussed later in Chapter 4), and to aid this process information on curvature calculation is provided here. Once calculated, the system must then compare the biometrics of the scanned image with those stored in the database, therefore research relating to matching techniques is also provided in this chapter Biometric Authentication As discussed briefly in the introduction, this topic is receiving an increasing amount of current interest, namely in the news with the Government s plans to incorporate the technique into their proposed compulsory national identity card scheme [1,2]. Although this has received a great deal of political debate, controversially a strategy has already been put into place (very recently) which looks highly likely to require biometric data to be stored on all new passports within the next five years [5,6] - potentially using fingerprints as the chosen biometric. Civil liberties campaigners see this as an intrusion on privacy and undemocratic, as passports are issued under Royal Prerogative the scheme will bypass the objections aired in Parliament. A pilot scheme took place between April and December 2004 with 10,000 volunteers using facial biometrics, results of which are anticipated soon. Authentication is the process of verifying a person is who they say they are, or at least recognising his or her identity. In order for the system to make this decision the user must provide at least one of the following: a) Proof of knowledge (for example, a password, PIN number or answer to a secret question) b) Proof of possession (for example, an ID card or some other hardware token ) c) Proof of being (the claimed person) The problem is that an unauthorised individual can compromise any one of these security requirements. A password can be acquired various ways; including through packet sniffing, a brute force attack, social - 3 -
9 engineering techniques where an unsuspecting authorised user discloses their login credentials, or observed over the shoulder of an authorised user. Possession of a hardware token, such as an identity card, is also susceptible to security vulnerabilities. An unauthorised user could steal an ID card, or skim an authorised card and make a copy for himself. Although proof of being is considerably more difficult to masquerade for an attacker, it is not impossible. Physically forcing an authorised user to comply, or even measures as extreme as removing those features required (such as fingers, hands, etc) could be carried out. It is arguable however, that login stations should be under supervision, so such a threat should not exist. So what is biometric authentication? And why are the proposed Government plans receiving so many objections? Biometric authentication can be used stand-alone for an access granting system, or can offer an extra layer of security for an existing system. A set of biometric measurements should be unique to each individual. They can be measured from physical features, such as the retina, iris [7], face [8,9,10], hand geometry, hand texture and perhaps the most commonly known, fingerprints [11,12,13,14]. Biometrics can also be obtained from behavioural characteristics; such as the way an individual signs their name [15], their speech signature (based on the movement of vocal organs) or gesture, for example. The more well known techniques have been available long before computers. Fingerprint recognition in particular dates back as far as the seventh century, where in China they were accepted as a legal alternative to a seal or signature [16]. The main objection to such systems is generally with regard to a user s privacy. Society feel uneasy about their personal information being stored in a database, and with regard to the Government s compulsory identification card scheme, stored in a national biometric database. There are also psychological reasons for rejection, for example, some people link fingerprint scanning to criminals, as it is common knowledge that the police use this identification technique at crime scenes. Generally however, biometric authentication offers the opportunity for automatic access control, and a way of eliminating the need to carry, or the risk of loosing a token, key or ID card around. It also prevents an unauthorised user learning/guessing a password or PIN number. A combination of knowledge, possession and being has the benefit of further mitigating the threat of unauthorised access to a system. A discussion of currently available systems, relating to hand biometrics, is discussed below Analysis of Current Systems As mentioned earlier, there are very few references available relating to hand biometric systems. However, the prior work in this field can be divided into three subsections: hand geometry, hand shape and hand texture based. Each of these are explored below: Hand Geometry This is the most popular and commonly found of the hand biometric systems. Generally measurements are made from features such as finger length and widths, and also the width of the palm. Such systems are normally only awarded a medium security confidence level, as the measurements made are - 4 -
10 not assumed to have a very high discriminative power. Despite this, there are number of commercially available systems on the market, ranging from tracking employee attendance and punctuality [17] to verifying the identity of border crossing travellers [18], staff at schools, hospitals and nuclear power plants. Recognition Systems Inc. [19] (supplier of the technology for the INSPASS programme [18]) offers a range of hand geometry and fingerprint readers, and complimentary software. The user s hand is used as a replacement to a conventional card reader, therefore the risk of time-card fraud (or buddy punching ) is eliminated. However, details of how the commercial system s software is configured, and the algorithms used are often protected by patents [20,21,22,23]. Although few papers exist, researchers have produced similar systems with comparable results, and published details of their findings. Sanchez-Reillo et al [24] discuss one such system, where the hand is guided to a fixed position on a platform, and the image is acquired using a CCD colour camera, positioned above. A mirror is fixed to the edge of this platform to capture a side view of the hand as well as the topdown contour. This enables not only measurements of the finger widths, separation of inter-finger points and the width of the palm to be extracted, but also the height of the palm, little and middle fingers as well. The prototype produced achieves results of up to 97% success in identification, and error rates much below 10% in verification. Further details are also provided in this paper relating to feature selection and matching techniques. These are discussed later in this chapter, in section 2.5. Another prototype developed by researchers is the HaSIS system [25]. This system captures the image in much the same way, again with a side elevation acquired with the aid of a mirror. A platform is again used to guide the hand to a fixed location, with the aid of pegs. These ensure the hand is not only correctly placed; but the separation of the fingers is also consistent. Seventeen features are then extracted from the hand image, with measurements made from finger widths, palm width, finger and palm heights. However, unlike the system by Sanchez-Reillo et al [24], finger lengths are also measured, and furthermore the thumb is used in the extraction process. This system has been tested with 800 images (taken from 100 people, 8 images each). Results from this prototype also look promising, with a false acceptance rate of 0.57% and a false rejection rate of 0.68%. Hand geometry systems have some major advantages, which make them an attractive technique to develop. Firstly, the cost of the required hardware is fairly inexpensive; generally only a low resolution CCD camera (for example) is required. The template used to store each user s measurements is small, potentially the smallest of all the biometric systems, therefore storage requirements are low. As an added benefit of this, the computational cost is also reduced Hand Shape As the location where the hand will be placed in the above systems is known, measurements can be made fairly easily. However, this is a huge limitation of the system. It would be far better to have no such requirement, making the system more robust and appealing to users. Jain and Duta [26] solve this problem by using the whole hand shape, or contour, as the basis to make the measurements from. The - 5 -
11 hand is represented by a series of points on the perimeter. Before extracting the features, the image is aligned. The mean alignment error between point pairs is used to indicate the match score, or quality. This system was tested using 353 images, taken from 53 people (varying from 2 to 15 images each). The results are very good, with a false acceptance rate of 2% and a false rejection rate of 1.5%. These are comparable to the commercial systems discussed above. Although this approach is more flexible, unfortunately it attracts a disadvantage. Because the template is represented by hundreds of points on the perimeter of the hand, not only is more storage space required for each user, more computing time is necessary to manipulate those points and extract the measurements. When matching a probe image to the database, more comparisons will also be necessary, again having an impact on computational cost. Another system [27] researched, pursues a different approach altogether of the use of hand shape. Instead of representing the hand image as a contour (a series of points), the hand is projected onto a plane and the difference between the hand being present and an empty scene is used to derive the shape of the hand. The user is responsible for the positioning of their hand, and a real-time live view of the current scene is provided as feedback. Once the user is happy that their hand will be acquired acceptably, the image is captured. Unlike the system developed by Jain and Duta, this prototype has a much smaller storage requirement for the templates produced, and encodes the binary image captured using a quad-tree for efficient comparisons in the matching stage. Tested using 100 images, results are also excellent with a verification rate of 99.04%, and both false acceptance rate and false rejection rate of 0.48% Hand Texture Instead of making measurements of finger length, width etc. some researchers have attempted to develop a recognition system based on the texture of the hand surface. The most obvious texture analysis is based on the pattern of the fingertips. However, other parts of the hand have proven to offer effective identification potential. One such area is the palm. Several palm-print systems exist, one of which developed commercially by NEC [28] for use in criminal applications. For civil use, where the system is required to be robust to a much higher number of users, Zhang et al [29] offer a prototype which provides reliable performance using a large database, in real-time. This system is an adaptation of that discussed in [30]. Because of the large size of the palm-print area compared to, say, the fingertip, the technique was proven to be robust to noise. The area contains copious information to extract, including the principal lines and wrinkles, in addition to the texture itself. After testing with 400 palm images, the system achieves a commendable false acceptance rate of 0.02%, and a high genuine acceptance rate of 98.83%. In verification tests, the prototype produces an even better false acceptance rate of 0.017% and a false rejection rate of 0.86%, showing this is a viable biometric technique. Woodard and Flynn [31] investigate another texture-based recognition approach. Instead of the palm, the texture of the finger surface is used. Shape index images are then extracted using the first (index) finger, middle finger and ring fingers. The hand images are captured using a colour 3D scanner [32]. For - 6 -


![2 Handpunch Biometric Terminal [33] Figure 2.](/docs-images/88/114800683/images/12-3.jpg "3 - VeryFast Access Control Terminal [34] The devices used in [24] and [25] also capture the side view of the hand, with the aid of a mirror attached to")

12 testing purposes, a space of one week between captures was given to investigate the effects of time on robustness. Results obtained are promising, with the middle finger providing better results than the other two, mainly due to its a larger size and subsequent surface area. Same day test images performed much better ( % matching probability) than those collected on different days (60-70%) Hardware Requirements The systems discussed above use a range of different hardware set-ups. Most, however involve some variation of a hand-scanning device, which uses a camera or sensor to capture the hand-image. Figure 2.1, below shows the Recognition Systems Inc. terminal discussed in section above. Notice the pegs in all of these scanners. These are used to guide the hand into a specific, fixed position: Figure 2.1 IR Recognition Systems scanner [17] Figure 2.2 Handpunch Biometric Terminal [33] Figure VeryFast Access Control Terminal [34] The devices used in [24] and [25] also capture the side view of the hand, with the aid of a mirror attached to the right of the scanning platform. When the camera takes the photograph of the hand, the image produced shows a side elevation in addition to the top-down view of the hand silhouette (Figures ): Above: Figure 2.4 The hardware used in [22]. Right: Figure 2.5 A diagram of the hardware used in the HaSIS system [23]. Notice the pegs to position the hand, and the mirror that is used to capture the side elevation of for measuring finger and palm height
13 The system in this paper is required to operate using a standard flatbed scanner. Details of the hardware used for the prototype are provided in Appendix B. No pegs or mirrors are attached, and therefore no supposition of hand location can be made. The only valid assumption is that of the general hand orientation, as the hand must be placed in the scanner from the top (as described in Appendix B) Programming Language Selection There is an abundance of programming languages available to the software developer, and a major decision before designing a system is the choice of which language to use. Each has its own advantages and disadvantages, and these must be examined in relation to the problem at hand. The first influencing factor with this system is the requirement for image handling. In many respects Java offers superior support through its class libraries and APIs. Although this should not be the principal reason for choosing the language, it is a valid factor. Image libraries are available for Python and C++, however there is no built-in support as default, unlike Java. Another factor is the familiarity of the language to the developer. Again this on its own should not be used to influence the decision, as there is an abundant source of books and tutorials available to learn the various languages. On this occasion, through other modules in the School of Computing, Java is the most familiar of those languages available. Java also has the benefit of being freely available and platform-independent. As discussed in the introduction, control of the scanner from within the software is desirable. On investigation, an API for Java is available to assist with this process. Morena [35] offers control of the hardware though the standard platform-independent TWAIN architecture. This would mean the software is portable and, coupled with the other aspects above, is the deciding factor in choosing Java as the programming language to use Curvature Calculation Two methods have been studied for calculating curvature. The first is vector based and is founded on work by Rosenfeld et al. [36,37]. The equation below (1) is used to compute curvature (C k ), measured between 0 and 1. This is calculated at a scale k and the sign (S k ) gives the sense of that curvature (either convex or concave). C k ak bk = ½ 1+ (1) k k a b S k [ ak bk]z = (2) The vectors a k and b k are defined by the diagram, in Figure 2.6 below: - 8 -
14 (x i, y i ) a k b k Ө (x i+k, y i+k ) (x i-k, y i-k ) Figure 2.6 Vector-based curvature calculation. The second technique incorporates a Gaussian smoothing operation during the curvature calculation and is therefore likely to be a more efficient method. This alternative approach based upon Ansari et al. [38, 39], uses the standard parametric formula: xy &&& yx &&& k( t, σ ) = (3) 2 2 ( x& + y& ) 3/ 2 Where derivatives x &,&& x, y& and & y are computed from coordinates that have been smoothed with a Gaussian kernel and t is the path length along the curve. The width of this kernel, σ, controls the scale at which the curvature is estimated. This one-dimensional filter is shown in equation 4 below: 2 [ 0.5( t / ) ] 1 k ( t, σ) = exp σ (4) 2πσ The approach used in the adapted Border algorithm (included in the AI31 libraries [40]) involves calculating the curvature whilst traversing the boundary of an object. This is performed using the vectorbased method and the values are stored in an array. This array is then smoothed with a Gaussian filter, of specified width Matching Techniques Of the various systems discussed above, once the features have been extracted and stored in a database, probe images must be compared with those enrolled and a level of closeness should be provided. Depending on how close the match is, the system should be able to make a decision as to the identity of the user. The hand geometry prototype discussed in [24] explores four different matching techniques: Euclidian distance, Hamming distance, Gaussian mixture models and radian basis function neural networks. The first three are considered the most relevant to this system, and are discussed below: - 9 -
15 Euclidian Distance This comparison technique is the most widely found of those mentioned above. It takes each measurement feature in turn and compares a probe image with a gallery (or enrolled) image. The difference between each feature is totalled and then square-rooted to produce a distance, or matching score. A small score signifies a close match. Equation 5 below expresses this process mathematically: d = N i= 1 2 ( p i g i ) (5) N is the total number of features in the template, p i and g i represent corresponding features in the probe and gallery images respectively, and d is the total distance for that particular probe-gallery pair Hamming Distance Instead of comparing each feature in turn and calculating an overall distance for a probe-gallery pair, the Hamming distance is based on the number of corresponding features that differ in value. To use this method, multiple templates are required for each user. It is assumed that the feature components follow a Gaussian distribution and therefore each feature consists of not only the mean of the values for a particular component, but a standard deviation as well. As a result, twice the storage space needed for each template is required, which is a disadvantage of this technique. i m i m { i { 1,..., N} p g g } d ( p, g ) = # / > (6) d is the Hamming distance, i is the current feature, N the total number of features in the template, # the sum of the matched features, component) respectively. m g i and i i v gi the mean and standard deviation of the current feature (the ith v i Gaussian Mixture Models This technique is based on the approach taken by Reynolds and Rose [41,42]. The method must be trained on all the enrolled users and classifies each user template as a separate Gaussian mixture model (GMM). When testing a probe image against those enrolled, the probability ( x ) of the probe belonging to each particular GMM is computed and the highest probability GMM (potentially above a certain threshold) is used to identify the user. Equation (7) below shows the probability of a sample belonging to a class u is: M r wi 1 r r T x( p / u) = exp ( p µ ) 1/ 2 i N / 2 i= 1 (2π) 2 i 1 i r r ( p µ i ) (7) wi and i represent weighting and covariance of each of the GMMs respectively, i µ the mean of the current feature (i). M is the number of models (and therefore enrolled users), and N is the total number of features in the template
16 Chapter 3 METHODOLOGY 3.1. System Framework Design To illustrate the design process, the task must be broken down into various stages. The Biometric Authentication System must consist of the following six principal components: 1. User Interface (ideally graphical) 2. Hand image acquisition 3. Pre-processing 4. Feature extraction 5. Storage 6. Matching Each of these elements is explored in detail below, including a discussion of design issues. The UML activity diagram below (Figure 3.1) shows how these processes are linked together to form the system. Figure 3.1 UML activity diagram illustrating the system framework
17 3.2. User Interface For the system to be broadly accepted an interface must be provided. A graphical interface is desirable. Essentially two separate systems should be produced: one to authenticate and the other to enrol users. The identification/verification system can then be deployed at all access points (for example: login stations, secure doors, etc.), with the enrolment system deployed at a secure location, accessible only to authorised personnel Hand Image Acquisition The hardware to be used to capture the hand images is a standard flatbed scanner. (Appendix B provides further details). To acquire the image the user will place his/her hand as flat as possible on the glass surface and then the scanner will obtain the image. The first major decision for the design regards the image resolution and colour depth. There are obvious processing issues with using large images, and colour images will cause a greater impact on performance. Firstly is colour information required? If the images are acquired in colour then more information is available for further work, analysing skin tonality or pattern recognition for example. However if the system is only to analyse the geometric shape of the hand, a silhouette is adequate. Resolution must then be chosen. A larger image will hold greater information, containing more hand texture detail, such as clearer fingerprints, lines and patterns on the palm. Again this is at the expense of extra computing time, with larger images requiring more processing. Not only do larger images take longer for the scanner to acquire, scanning in colour increases the capture time and also the amount of disk space required for (albeit possibly temporary) storage. A compromise must be established so as to have enough detail, and yet still allow the system to function at a reasonable speed. Users become frustrated waiting for an unresponsive system, so for a biometric system like this to be accepted it must work as quickly as possible. The results in Figure 3.2 below illustrate the relative effect of varying these attributes on the time required to capture images from the scanner. Depending on the hardware used the absolute time required would differ, therefore a hardware specification is also provided in Appendix B. GREYSCALE COLOUR Median Filter (7x7) 3400x3840 Resolution 2549x x x Time (seconds) Figure 3.2 Chart illustrating the effect of increasing resolution and colour information on capture time from the scanner

18 From Figure 3.2 above, colour images of resolution 850 x 960 meet this compromise and will be used. There is little variation in the time required to capture the image in colour or greyscale at this resolution, therefore they will be captured in colour to allow future work (relating to skin tonality/pattern for example) on the dataset. Also the time required to perform a median filter operation is substantially smaller compared to the larger resolution images. Appendix C provides some examples of images acquired using these settings Pre-Processing There shall be no requirement to align the images before processing, unlike systems such as [24,25] which attempt to fix the orientation and location of the hand and require alignment if the image deviates from this specified position. Alignment is constricted in such systems by adding pegs to the scanning device. As the flatbed scanner has no such pegs, there can be no assumption that the hand will be placed in a fixed place, or that the fingers will be spread consistently across all scans. Instead the system will use the whole shape [26,27] of the hand to calculate the biometrics. To obtain the silhouette of the hand it must first be segmented from the background. A black surround for the scanner (see Appendix B) simplifies this process, as the image acquired can be thresholded above a specified grey-level to remove this black background. After thresholding however, there may be artefacts in the binary image produced by dust or marks on the scanner. Also, the further away the subject is from the glass plate of the scanner, the darker the image. Therefore if the wrist is not placed as flat as possible this will produce a dark image which, after thresholding, can lead to disjointed portions of the hand Feature Extraction The next stage is feature extraction, and uses the binary image produced by the previous two stages. This involves computing those features suitable for distinguishing the individual from other users: the biometrics. Figure 3.5 An example of pressing hard against the glass of Figure 3.6 An example of the same hand, however applying the scanner surface. less pressure against the glass of the scanner surface
19 Finding suitable areas to measure is crucial and those chosen will impact the rest of the system considerably. It is important to use measurements that will not only be consistent with different scans of the same person, but will also separate users significantly enough to identify them accurately. Variations in pressure of the hand on the scanner plate affect the quality of the images obtained. The harder the hand is pressed against the scanner the whiter it becomes and the more the detail is lost. Therefore texture analysis of the palm [28,29,30] or fingers [31] will not produce consistent results. Although a texture analysis technique is discussed later (see Conclusion: Further Work) it will not be explored further for this particular system. [31] describes two different categories for hand-based biometric systems: hand geometry and hand shape. The approach of this system involves a combination of both, taking measurements of various features based on the hand shape. Hand geometry systems such as [24,25] are often based on an expectation of where the hand will be placed (as described in Chapter 2). However, as the exact position and orientation of the hand are unknown there can be no such assumption. Potential biometrics to consider are illustrated in the Figure 3.7 below, and are adapted from the hand geometry system discussed in [24]: Figure 3.7 Example of possible biometric features that could be used to identify the user. Not all of these will be suitable for this system however (discussed in Chapter 4)
20 Choosing which measurements to make, and experiments demonstrating the effectiveness of those chosen are detailed in Chapter 4 and Chapter 5 respectively Storage or Matching Once the template of the user has been established the system will have two options: either to store the details in a database, and therefore enrol the user on the system; or to match the scanned template with those already stored in the database. To enrol a user on the system, a storage procedure must be established. Whether to use only one scan to enrol, or several, is an issue discussed in Chapter 5. For matching there are also choices to be made as to how the system should function. To verify, a user must claim to be someone stored in the database. A comparison of how close the scanned template is to the claimed template will establish whether the user is an impostor. Identification is more of a challenge however, and involves comparing the scanned image with all of those stored. The system must then decide who is the closest match, but perhaps more importantly reject the user if they do not match closely enough anyone enrolled on the system. The procedure is broadly similar for identification and verification, the only difference being the number of templates the probe image is compared with. Results and a discussion of the two are provided in the Evaluation section (Chapter 5) Testing Plans Once the system has been produced, rigorous testing is required to ensure the robustness of the technique. These tests will consist of: Threshold acceptance level variation Variation of hand orientation Hand pressure variation Separation of fingers Impact of finger nail length Effect of time lapse to results Attempts at spoofing identity A series of experiments relating to these are discussed in Chapter Schedule for Project Management Appendix G details the proposed schedule for managing the project. This is taken from the midproject report, and modified where necessary. A project log containing progress updates will be kept on a website, online. Further information is provided in Appendix G
21 Chapter 4 IMPLEMENTATION 4.1. Scanner Control A major influencing factor in choosing Java over other programming languages is the extensive range of libraries available. One such API is Morena [35]. This framework is built upon the standard platform-independent TWAIN interface that provides hardware control of the scanner from the computer. As Java is also platform-independent the system produced should be portable between different operating systems. An image acquisition class named GetHand was developed to incorporate the features offered by Morena. The following settings are specified: Image frame area: the target area of the scanner surface is fixed, and scanning begins two inches from the start position to ensure as much of the hand and wrist is scanned as possible, but as little of the arm. Brightness/Contrast: both of these values are fixed to 0 to ensure consistent images are produced. The results for the particular scanner used (see Appendix B) were ideal with brightness and contrast at 0, but depending on the hardware variation these values may need adjusting to improve segmentation results. Resolution: This is set to 100dpi in both X and Y to produce images of size 850x960 (as chosen in section 3.3.) Scanner Dialogue Box: this is disabled so no direct scanning control is provided to the user. All that is displayed is a progress bar as the scanner is operating. The constructor for the GetHand class allows specification of the filename to store the acquired image to, and the format is.jpeg Pre-Processing Operations As mentioned in section 3.4., the hand must be segmented from the background before any processing operations can take place. The first stage of the segmentation is a threshold operation. As the images are acquired in RGB format, this must be applied across all three colour channels. The minimum level chosen for each channel will obviously affect the resulting binary image considerably, and a balance must be reached as to provide consistent results for different scans, segmenting the whole hand and as much of the wrist as possible. The images below illustrate the effect of thresholding at different levels, with the threshold value applied equally to all three colour channels:

22 Figure 4.1 Original Scan Figure 4.2 Threshold at 10 Figure 4.3 Threshold at 20 Figure 4.4 Threshold at 30 Figure 4.5 Threshold at 50 Figure 4.6 Threshold at 70 Figure 4.7 Threshold at 90 Figure 4.8 Threshold at 110 It is clear that the higher the threshold, the more the hand shape erodes. This is due to the hand not lying completely flat to the scanner plate. Objects further away from the plate are captured darker than those flush with the glass. Therefore, because of the rounded shape of the fingers, when scanned they appear darker towards the edges. The centre of the palm is also notably darker as this does not lie completely flat against the plate. A threshold level of 23 across all three channels provides optimum results for all of the images acquired; this value may be hardware dependent however. Altering the brightness and contrast settings will also have an effect on the threshold value chosen. For this reason all variables that will affect the system behaviour are defined in a configuration file (see Appendix E). If different hardware is used at a later date, the settings can be modified accordingly. Figure 4.9 Close up of a colour, scanned image after applying threshold of 23, 23, 23. Artefacts detected on the scanner pane have not been removed as a result of thresholding
.")
23 Once the thresholding is complete the next stage is to apply a median filter. This is required to remove any artefacts remaining after the threshold operation, as a result of dust or marks present on the scanning surface for example (shown in Figure 4.9 above). The outline of the silhouette is very jagged after applying the threshold operation. By median filtering the image not only are the small artefacts removed, but the boundary is also smoothed. Figure 4.10 below shows the effect of applying a 7x7 median filter to the image shown in Figure 4.9. Figure 4.10 Close up of the same scan after a median filter is applied to the thresholded image above. Notice the artefacts have been removed and the edge of the hand (especially the wrist) is smoother. After image acquisition from the scanner, the median filter is the next major bottleneck for the system. Operations involving a kernel being passed across an image run much slower in Java than if they were written and executed in other languages, such as C++. The larger the kernel, and the slower the computer, the longer it will take for the process to complete. Therefore it is essential to use a filter just big enough to remove the artefacts. A 7x7 window is successful for all the test images, and only takes approximately 3 seconds to complete, so this is implemented. As the configuration file allows for the scanning resolution to be altered, the size of the median filter kernel can also be modified if necessary, but the default value is set to 7. Using a fairly low resolution of 850x960 has the benefit of not only less pixels to process, but a smaller kernel can be used. With higher resolution images the same unwanted artefacts are produced much bigger, and therefore, a larger kernel is required to remove them by median filtering. Using an increased image and therefore kernel size would obviously increase the computing time required considerably Feature Extraction This stage will completely affect the rest of the system. The features extracted are those that will be used to distinguish the difference between users enrolled on the system. Choices of what measurements to use and how these will be computed are discussed below
24 Producing the Border As mentioned earlier, the system does not know where exactly the location of the hand will be, the spread of the fingers, or the orientation. Any calculations of measurements must therefore be based on the entire shape of the hand. From the median filtered binary image the outline of the hand silhouette is produced using an adaptation the border algorithm [40] provided in the AI31 libraries. The default algorithm requires a white object on a black background. It starts from the top left of the image and searches line by line until it locates the first white pixel, then traces anti-clockwise the outline of the object found. Original border also contains unused functionality relating to curvature. This is calculated using the vector-based method described in section 2.6. The algorithm was adapted to start searching from a specified position (described below), and to store the curvature values at each pixel on the boundary, in an array Landmark Identification From the curvature array, points of extreme curvature can be identified. These points define the landmarks of the hand, i.e fingertips, inter-finger points and where the wrist intersects the image (highlighted with numbered black squares in Figure 4.11, below): Figure 4.11 Extremes of curvature are the landmarks of the image, eleven should be located on a normal hand
25 The border algorithm is set to start at row 250 (shown by the red arrow in Figure 4.11, above). This is to ensure no landmark is detected in the area identified by the green circle. Depending on the amount the hand is rotated in relation to the wrist, this area will range from being relatively smooth to having quite a sharp curve in the outline. (See also section ). As described in section 2.6., there are two variables that influence the result of the curvature array. These are the window size used, and the amount of Gaussian smoothing of the values calculated. With a small window size and no smoothing the curvature array produces a fairly noisy graph (Figure 4.12), however using a window size of 65 and a Gaussian kernel of width 40 a graph is produced that clearly identifies peaks (Figure 4.13). These peaks are the extremes of curvature and correspond to the landmarks illustrated in Figure Figure 4.12 Using the default window size and no Gaussian smoothing (as in the original Border algorithm), the curvature array produced is too noisy to use. Note the gap between 3467 and 3678 corresponds to the flat section between landmarks 9 and 10. Figure 4.13 However, by altering the window size and amount of Gaussian blurring of the array, a much clearer graph is produced, showing the extremes of curvature. The numbers at each peak correspond to those points identified in Figure At each point on the boundary not only is the curvature calculated, the x and y-coordinates are also stored. Therefore it is possible to work out exactly where the peaks on the graph are in relation to the border. The problem is however, how to locate these peaks in the curvature array. At first glance it appears that they could be roughly in the same position on the graph and that simply finding the highest
26 curvature value between eleven specified ranges would work. However under closer inspection, variances in hand position and between different hands, produce peaks in different positions. Also, the total border length for individual hands will be different depending on the overall size, and therefore perimeter of the hand. Therefore, although the graphs produced are of similar shape there can be no assumption of where the peaks will be, only the order in which they will appear, as the start position of the border and direction to trace is known. The graph of curvature and the border for three separate hands are shown below. The darker sections of the hand outline relate to curvature that is above a threshold of 0.12, shown as a horizontal dotted line on the graphs. Figure 4.14 Hand 1 Notice the total length is 3930 and the peaks are not located in the same position in the other hands below. Figure 4.15 Hand 2 - The total border length for this hand is only 3665, although the pattern looks similar. Figure 4.16 Hand is the border length here, the longest of the three. Again a similar pattern is produced however. Notice the peaks here (and in Hand 2 above) are not in the same place as Hand 1 (shown by the three vertical dashed lines on the left hand side of the graphs) In an attempt to normalise the length of the curvature array, the above three graphs are shown below on a percentage scale (Figure 4.17). The grey shaded regions show the ranges to search for the peaks, each a certain percentage distance along the array. Although the peaks are in similar positions, only three hands are shown. With hundreds of hands they could overlap these ranges, so an alternative method of extracting the peaks is required

27 Figure 4.17 All three graphs above scaled to same length along the x-axis. Grey regions show potential ranges to extract the peaks from. The technique implemented is as follows. The curvature array is read through, checking to see if the next value in the array is larger than the previous value. If it is, then the current array location is on the left hand side of a peak. Providing the value is above a specified threshold (0.1), the curvature is compared with the maximum found so far. If greater than this maximum, the current maximum is modified and the location on the border of where this maximum was discovered is updated in the temporary variables plotx and ploty. The next array value is then fetched, and if it s curvature value is less than the current maximum, then it is assumed that the peak has been reached. Once the peak has been found, the location is stored as the landmark, and then current maximum is reset back to 0. The process repeats until the end of the curvature array is reached. The result of applying this algorithm (see Figure E.1 of Appendix E) to the same three hand images above (in Figures ) produces the following results; notice the landmark positions are relatively stable across all the images: Figure 4.18 Hand 1 landmarks Figure 4.19 Hand 2 landmarks Figure 4.20 Hand 3 landmarks
28 Calculation of Biometrics Now that the landmarks and their locations are known, the next stage is to calculate the biometrics, and therefore the features to be extracted. From section 3.5., possible measurements to use are finger length and finger width. These were implemented separately, finger length first. Comparisons of the two methods are discussed later, in Chapter Finger Length From the landmarks known it is possible to work out the length of the two innermost fingers (shown in blue in Figure 4.21 below). This is achieved by using the fingertip and the midpoint of the interfinger points. The distance between these points (χ below) is then computed using Pythagoras theorem. Calculating the length of the outer-most two fingers proves more difficult however, as we do not know the landmarks at the bottom of the fingers on the outer boundary. A proposed way of finding these points is to plot a line through two of the known inter-finger landmarks and then project the point on the boundary that lies on this line. This provides the green landmarks illustrated in Figure 4.21, and now the mid-point can be calculated and the lengths measured for these outer fingers in the same way as the innermost fingers. The lengths produced by this method rely heavily on where the interfinger landmarks (numbered 1, 3, 5 in Figure 4.11) are located. Landmark 7 varies greatly depending on the amount χ χ χ χ Figure 4.21 Possible ways of measuring the finger lengths. The method used to extract the lengths identified by the blue lines is more likely to be stable across various images; the spread of the fingers should not affect the results substantially. the thumb is moved between scans. The landmarks at the top of the image are also highly likely to be inconsistent, due to how far the hand is placed into the scanner, and the pressure of the wrist on the pane. Depending on the placement of the hand, and the rotation of the hand in relation to the wrist there is also a possibility of extra landmarks being detected in the regions highlighted by the green circles above. Therefore landmarks 7, 9 and 10 cannot be reliably used in the processing of measurements. As the proposed methods for calculating biometrics only involve the four fingers, extra landmarks detected in the wrist area will not effect the processing. Results from experiments using only finger length are provided in section 5.3., and the algorithm to calculate all four lengths can be found in Appendix E (Figure E.2)

![The prototypes proposed by [24 and 25] use finger widths in the feature extraction process, but this is aided by the position and stretching of the fingers being known to the system.](/docs-images/88/114800683/images/29-1.jpg "As this is not the case with this system, a way of measuring widths using the landmarks calculated earlier is therefore desirable.")

29 Finger Width The more measurements taken for each user, the more likely there will be separation between individuals. Each measurement adds an extra dimension to the user, an extra vector to distinguish from others. The prototypes proposed by [24 and 25] use finger widths in the feature extraction process, but this is aided by the position and stretching of the fingers being known to the system. As this is not the case with this system, a way of measuring widths using the landmarks calculated earlier is therefore desirable. Although the interfinger landmarks are not overly stable, depending on the separation of the fingers (see later - section ), the landmarks detected at the fingertips appear to be. Several images of the same user s hand, with fingers spread differently and the hand positioned in alternative Figure 4.22 [Yellow] Figure 4.23 [Red] Figure 4.24 [Dark Purple] Position 1, little finger Position 2, little finger Position 3, little finger extracted. extracted and aligned. extracted and aligned. places, produce fingertip landmarks that are consistent among the images. These points are therefore taken as constants among different scans of the same person. To prove that the finger widths vary between individuals, but are consistent for the same user regardless of their hand placement in the scanner, fingers from separate scans were extracted and aligned. Figures (above) show the little finger cut from each image and aligned to the same position as that in Figure Figure 4.25 below shows these three aligned fingers stacked on top of each other in the order yellow red dark purple. Notice that although the Figure 4.25 Little fingers from aligned and then stacked on top of each other. The length of the top (yellow) finger has been trimmed on the right hand side so to show the colour of the finger(s) layered underneath. finger is positioned differently in each of the scans, there is little variation in the width extracted, as expected. Although this consistency makes measuring the widths a viable option, there must be differences between users. To prove that this is indeed the case, fingers from other users were aligned in the same way and stacked on top of each other. Where there is little difference between scans of the same user (Figure 4.25 shows that the edges
30 are mostly green with very little deviation from the blue and red images underneath), there should be much more significant deviations between individuals. Figures below show two different users and the alignment of their little finger matched to the same as that of Figure All three individual s little fingers are stacked on top of each other in Figure 4.28, in narrowest to widest order. Figure 4.26 [Dark Blue] Different user, notice the little finger extracted appears wider than that in Figure Figure 4.27 [Magenta] Another user, again with the little finger positioned to the same alignment as that in Figure It is clear that the differences in width between the stacked fingers in Figure 4.28 are much greater than that of Figure 2.25 (i.e those of the same user). Although the separation between DB (dark blue) and Y (yellow) may not be huge, that of DB and M (magenta) is. The results from using finger width for all four fingers are discussed in section 5.4 (Chapter 5). The proposed method to extract the widths uses the fingertip landmark as a starting point. The idea is to extract approximately the same length of finger regardless of the user, and sample the widths of that length at specified intervals. Although some users will have wider fingers than others, the length of a user s fingers will also play a part in the width measured. Variations in width due to where the finger joints are positioned will produce different results, depending on how long the individual s fingers are. Only the upper-most part of longer-fingered individuals will be extracted, whereas the whole finger may be sampled for shorter-fingered users. Figure 4.29 (below) shows the dark shaded Figure 4.28 The little finger extracted from three different users aligned and stacked on top of each other. Notice the difference in the widths, making finger width a potentially viable biometric to use. finger region used to sample the widths from. The two minimum points reached for each finger, i.e. the most distant shaded sections before and after the fingertip landmark, are determined by the constant value specified for the particular finger. These values are different for each finger, as generally the little finger is the smallest, middle finger largest and the ring finger and index finger are approximately the same length. The regions extracted in Figure 4.29 seem to be fairly small compared to the length of the fingers, but the hand shown has long fingers in comparison with others
31 Fixed values for α, β and λ must be chosen that are suitable for all the users enrolled in the database. The lengths shown may look small, but this is necessary for the criteria to be met. The next major decision is how many samples to take from the highlighted regions. Obviously the more samples taken, the greater the approximation to the actual finger shape, and the more information obtained. Storing more measurements however not only takes up more disk space, but the amount of time required to extract and match them will also increase. The system in [24] makes four measurements for the index finger, ring finger and little finger, and five for the middle finger. Other measurements are also taken - made possible by the fixed location of the α β λ β hand. As these other biometrics are not possible with this system, more measurements per finger are implemented here, and a discussion of how varying the number of measurements taken affects the results obtained is discussed in section 5.4. Although the system is tested with different sampling amounts, the final implementation uses six width measurements for each finger. Firstly, two points on the border are computed, and their location in the border array and co-ordinates stored. These are the furthest away points that make α, β and λ (Figure 4.29) equal to the specified values. The function takes the position in the border array where the fingertip landmark is located, as a parameter. Using this as a starting point the border is searched forward until a point is found ( f in Figure 4.30, right) that is within ±1 of α, β or λ (depending on the finger). Once the co-ordinates are obtained and the forward_border location is calculated, the algorithm then searches backwards from the fingertip starting point and calculates the point on the border before the fingertip that again makes α, β or λ within ±1 ( b in Figure 4.30). The co-ordinates of both of these two points can be calculated from their location in the border array, as each element in the Figure 4.29 The regions to sample the finger widths from are highlighted by the darker border. Constants α, β and λ are used to extract these regions. b f α α - + Figure 4.30 The border array is firstly incremented, then decremented until the distance from the start point equals α. array is a coord object. Once the positions in the border array before ( b ) and after ( f ) the fingertip are known, the next stage is to sample the distance between these points at specified intervals. The number of measurements to make for the finger is passed to the function
32 b b* f b* f* b* f* b* f* b* f* f* b* s f* f * = f start position number of measurements start position b b* = number of measurements Figure 4.31 The widths are measured at equal intervals forwards/backwards from the start point. The difference between the start position in the border array and b and f, is divided by the number of measurements to give equal increments ( f* ) or decrements ( b* ) depending whether the point is forward or backward of the fingertip (start). The point distance between the consecutive increment-decrement pairs (starting from the fingertip) are the measurements made (Figure 4.31 above). The function is called for all four fingers and for each finger the six measurements made are stored in the UserMeasurements object which is passed to the function. This object type holds the biometrics required for the matching stage, discussed below. b There is an alternative way of locating f and b so to ensure (as w much as possible) exactly the same length of finger is extracted regardless of f finger thickness. This involves increasing distance between the start position and f and b until the length specified (l in Figure 4.32, left) is reached. By using this technique however, a lot more processing is required. The algorithm discussed above (shown in Appendix E, Figure E.3) has to repeat with increasing start forward/backward-point lengths until l is attained. For all the test images available however, the difference between the length of a finger from the widest-fingered user and the narrowestfingered user, extracted with this method compared to the implemented one, is only 3 pixels. There is still likely to be a potential error of ±1 pixel by this alternative method, as the image is essentially made up of a grid of l - + Figure 4.32 An alternative method of calculating f and b that ensures the length of finger extracted is consistent regardless of finger width. pixels. Values used for α, β or λ are large enough (180, 230 and 260 respectively) so that differences in w (Figure 4.32) due to finger thickness cause an insignificant effect on the actual length of finger extracted. Therefore implementing this alternative technique was not considered necessary Matching Once the biometrics have been calculated and stored in a UserMeasurements object, the next task is to either authenticate or identify the user. This involves a comparison of the measurements made from a live scan, and those stored in the database of enrolled users. The closeness of the match will determine the system behaviour - whether to grant or deny access
33 Of the systems discussed in the background research, various different methods are used for this process. For example, in [30] normalised Hamming distance is implemented, and in [31] a simple correlation score is computed. [24] discusses several techniques and compares them. More information is provided in Background Research (Chapter 2). The method chosen is based on Euclidean distance. Each measurement of the live image is compared with the enrolled image(s). Depending on whether verification or identification is used, and how many enrolment scans for each user are stored, the matching process will be different (discussed below). The formula to calculate the distance is as follows: d = N i= 1 ( p i g i ) The live image to test against the database is labelled a probe, and those stored in the database as gallery images. For each measurement ( i ) the difference is calculated between the probe and the gallery biometrics. N is the total number of features to compare. For both verification and identification a decision must be made based on the distance calculated. If the smallest distance produced is above a certain threshold (specified) then access should be denied. This threshold is varied in the testing stage, and the effect made on the results is shown in Chapter 5. 2 (8) Verification Where the system is set up to verify, the user must supply some sort of claim to the program. This could be the supplying of a username, or the swiping of an ID card for example. Either way the comparison is only made between the probe and the gallery image(s) of the claimed user. If more than one enrolment image is stored, the lowest distance produced ( d ) is taken as the match score. The smaller the score, the closer the match Identification To identify, no claim is made to the system as to who the user is. The system must therefore compare the probe image to all of the gallery images and then decide on the closest match. The number of enrolment images stored for each user determines how many potential correct matches there should be, but the lowest distance is used as the match score. Identification therefore involves a lot more processing than authentication, and depending on the number of users enrolled on the system, can have a detrimental effect on performance. This is one of the reasons why only a limited set of biometrics is stored. Comparing hundreds for each probe-gallery pair for example may provide more accurate results, but at the expense of an unrealistic processing time. The effect of varying the number of, and locations of the biometrics is illustrated in the testing phase, discussed in Chapter 5. System performance and a comparison of verification and identification authentication modes are also discussed
34 Chapter 5 EVALUATION 5.1. Data Collection In order to evaluate the system thoroughly, test data is required. Using the same hardware as described in Appendix B, 179 images were acquired over a period of six weeks. The participants involved in the data collection ranged from nineteen to fifty five years old, with mean age of twenty-eight. Of the 179 images obtained, these came from twenty-two individuals, 68% of which were male. Between five and ten images were acquired from each participant, with three of these chosen for enrolment purposes. The average number of images acquired from each user was seven. For the majority of participants all of their scans were performed in one session. However, for the purposes of testing robustness, extra scans were made from some of the participants - with up to a six weeks gap between those and their original scans. The effect of time-lapse on results is discussed later in this chapter. All images acquired are stored in.jpeg format, RGB colour and of size 850 x 960 (for reasons discussed in Chapters 3 and 4) Feedback Assessment Criteria Some way of measuring system performance is essential to draw conclusions on how robust each technique described in Chapter 4 is, and therefore decide on how to configure the system for optimum performance. Common criteria to measure authentication systems are based on four possible system outcomes, and therefore there are four rates to measure: Genuine Acceptance Rate true positive genuine accepted GAR = 100 genuine probes Genuine Rejection Rate true negative impostors rejected GAR = 100 impostor probes False Acceptance Rate false positive False Rejection Rate false negative false acceptance total* GAR = 100 genuine rejected GAR = 100 genuine probes + impostor probes genuine probes * false acceptance total = accepted with incorrect name + impostors acepted
35 These rates are provided for all the biometric systems discussed in the background research (Chapter 2). Ideally the GAR and GRR should be as close to 100%, and FRR and FAR as close to 0% as possible. The rates will differ between identification and verification modes, and also the number of enrolment images stored. To test the FAR and GRR, images must be used that do not correspond to any enrolled on the system. For this purpose, three individuals have been isolated from the rest of the test data and their hand images will be used as impostors, to see how the system reacts. There are therefore 82 probe images (70 genuine and 12 impostor), and up to 57 gallery images depending on the number of enrolment images required in each particular experiment. Testing the various implementations discussed in Chapter 4 now follows with results from using finger length, width, and both finger length and width combined. The results for each experiment are broken down into identification and verification. The same scans are used as gallery and probe images, to ensure a fair testing environment. For each experiment there are several variables that will change the outcome of the results. These are altered to see how the system performs: The threshold acceptance level: the maximum score accepted as a match The number of enrolment images stored in the database for each user: either 1, 2 or 3 Whether to take the lowest overall score of all the enrolled images, or the lowest average score. When using the lowest overall score the smallest distance is returned from {number of users x no. of enrolment image}. When using the lowest average score, the smallest distance is returned from {number of users}. Authentication mode. In identification mode, the system compares the genuine probe against all those enrolled and can grant access (GA), deny access (FR) or grant access under a different username (FA). If the probe is of an impostor there are two possibilities; if access is granted it is a false acceptance (FA), or if denied it is a genuine rejection (GR). In verification mode, the probe image is compared only to those enrolled images for the claimed user. If there is a match below the acceptance threshold then access is granted (GA), otherwise access is denied (FR). In identification mode an extra rate is computed in addition to the GAR, GRR, FAR and FRR. This is the FMBT rate, or false match below threshold rate. Each time a genuine probe image is tested against the database, the system can either return one of three possibilities: GA, FR or FA. This decision is made based on the lowest (overall or average) match score of the probe against all those enrolled; all the other scores are discarded even if they are below the threshold. If these other scores correspond to a different user than the genuine probe image, there is a risk that on subsequent tests the lowest score returned could be of another user. The system could therefore mistake the genuine user for someone else, potentially providing extra privileges upon login. This rate illustrates the discriminating power of each technique in distinguishing users from each other, and should be as low as possible to ensure robustness of the system
.")
36 5.3. Finger Length Experiments The method described in Chapter 4 discusses a possible way of extracting the finger lengths for all four fingers. However, the technique described for measuring the innermost two fingers is different from that of the two outer fingers (the little finger and first/index finger). To calculate the outer finger lengths two extra landmarks must be derived, and the reliability of this method depends on this process Comparison of Inner-Finger Lengths to Outer-Finger Lengths The two techniques discussed in Section are compared below to see whether the measurements produced for the outer-fingers are stable between images of the same user. If the results are consistent then further experiments will be carried out using all four fingers, otherwise only the innermost finger lengths will be used. Figure 5.1 A graph illustrating the consistency of the measurements of the four fingers, ring finger and middle finger are the most consistent. The graph in Figure 5.1 above compares the lengths computed for each finger, from eleven images (labelled a to k ) of the same user s hand. Between scans the hand was re-positioned to a different orientation, and the finger separation altered. The average length of each finger was computed and then the deviation from this average (shown as the normal ) plotted for each scan. Obviously, the closer the line plotted for each finger is to the normal of zero mean deviation, the more consistent the measurements are of that particular finger. The graph illustrates that the inner-two fingers, the ring finger and the middle finger, produce the most stable results of the four, with the lengths deviating only ±3 of the normal. The lengths produced for the outer two fingers are much less stable. Outer-finger biometric calculation is subsequently abandoned at this stage. Results from using only the two innermost finger lengths as the sole basis of distinction between users, follows Two Innermost Finger Length Results The results below show how increasing the threshold acceptance level affects the performance of both identification and verification. Lowest overall score, and lowest average score results are shown graphically, and a table of system performance at an acceptance threshold of 120 follows in Table


37 Identification Figure 5.2 & 5.3 Overall and average score results, increasing the threshold and number of enrolment images used. By increasing the threshold, the false rejection rate decreases. However, the false acceptance rate increases, identifying a genuine image as of a different user, or granting access to a user who is not enrolled on the system. Using the lowest average score, results improve for the FAR, halving from 14.6% to 7.3%, when using three enrolment images. This is at the expense of denying more genuine images at thresholds of less than 70, but this is far better than granting unauthorised access. The FAR is smaller in both graphs when more enrolment images are used, three enrolment images providing optimum results here. Verification As a claim must be made as to whom the probe image belongs to, there are only two possible outcomes from this type of test; either a genuine accept, or a false reject. The graphs in Figures 5.4 and 5.5 below show how increasing the threshold, and the number of enrolment images, affects these results: Figure 5.4 & 5.5 Overall and average verification results, effect of increasing the threshold and number of enrolment images used on GAR & FRR. The overall score rule achieves better results at lower thresholds than the average score. Using three enrolment images, the overall score tests return a GAR of 100% at a very low threshold of 20. The same number of enrolment images requires a threshold acceptance level of 60 using the average score test. Performance is poorest using only one enrolment image
38 Performance A full table of results is provided in Appendix D. The largest threshold tested is 120, and Table 5.1 below shows the results of how identification and verification compare at this level. Values shown are a rate, so are relative to the number of genuine and impostor test images used. IDENTIFICATION VERIFICATION GAR GRR FAR FRR FMBT* GAR FRR Enrol. Images Threshold Table 5.1 Comparison of results at threshold acceptance level of 120, varying the no. of enrolment images and scoring type (overall or average) As discussed in Section 5.2. above, the GAR and GRR should both be as close to 100% as possible. The FAR and FRR should be as close to 0% as possible. In identification mode, the best performance is achieved using the lowest average score method, with three enrolment images providing optimum results with a GAR of 97.1%, GRR of 66.7%, FAR of 7.3% and FRR of 0%. The FAR is low, but is not very impressive. As the prototype system only contains 19 enrolled users, this rate is likely to scale dramatically with a larger database, producing unsatisfactory results. The FRR of 0% looks as though the system is performing well, but instead of rejecting a genuine probe for being above the threshold, it is being accepted as being of a different user. This is a problem and illustrates how unreliable this method on its own is. Verification mode performs well at this acceptance level however this is expected at such a high threshold. As the probe image is only compared with 1,2 or 3 enrolled images of the claimed user the GAR is based on the closeness of this match. If the threshold is too high, all probes will be accepted regardless of whom they belong to, as the control of distance between the probe-gallery pairs will be too loose. An indication of how well the technique separates users is useful, and as mentioned earlier this is calculated as the FMBT rate. This is only applicable in identification mode, and is fairly high at close to 18% - regardless of the number of enrolment images. Ideally this rate should be as near to 0% as possible to ensure the robustness of the system. Using finger length as the chosen biometric is therefore not likely to be stable on its own. To reduce this high FMBT rate, other features of hand geometry should be included as well as, or instead of the length of the two innermost fingers Finger Width Results The experiments that follow show how the system performs using only finger widths as the distinguishing features between users. Firstly however, as described in Section , the number of samples to be extracted for each finger must be specified. The graphs in Appendix D show how varying this number affects the separation of users in vector space
39 The main difference noticed between the graphs is how the lines for each image drop for the measurements made at the start of each finger. This shows that the widths near the fingertips are too similar between users, and therefore do not help in distinguishing users from each other. Other than these troughs, the general shapes of the lines are similar between the graphs. Extracting more features will make the template a closer match to the actual shape of the fingers; but this is at the expense of extra storage required for each user. More measurements mean more comparisons are required in the matching stage. For a system with few enrolled users the effect on performance is likely to be negligible, however upon scaling, with perhaps hundreds or thousands of user templates stored in the database, identification will undoubtedly take much longer with more features to compare. As described in section , and for this reason, six samples per finger are used in the following tests. The graph representing six samples is shown in Figure 5.6 below. Graphs showing different sampling rates are detailed in Appendix D. Figure 5.6 [Compared to the graphs shown in Appendix D, Figures D.1-D.3]. Using six samples per finger improves the [separation] situation however. There is clearer separation of user a from d in the middle and first finger measurements. c is still fairly close to a, but there are more features further away which it is hoped will impact the score during the matching stage significantly enough to distinguish between the two users. Notice, the first feature measured for each finger seems to be converging to a similar value. Each line on the graph represents a complete set of finger widths from one image, extracted from all four fingers. Lines coloured the same correspond different images of the same user. The x-axis represents the particular feature measured (i.e. little finger width measurement one ( lf_1 ), little finger width measurement two ( lf_2 ) etc.) Ideally, these lines of different users should be as far away from each other as possible with the distance between them significant at enough features to clearly differentiate individuals from each other. Using the same probe images as the previous experiments, the results of the system using finger widths as the only biometrics are shown below. Following the graphs a brief discussion of how widths perform compared to the use of finger length is provided

40 Identification Figure 5.7 & 5.8 Overall and average identification results, effect of increasing the threshold and no. of enrolment images used on FAR & FRR The false acceptance rate is fairly consistent irrespective of the number of enrolment images, or score mode. When in overall score mode, the FRR is significantly higher (and the poorest performance noticed) using only one enrolment image, compared to two or three. The FRR using the average score rule produces very similar results to the overall score rule, when using only one enrolment image. In comparison to the results obtained for finger length only, the false acceptance rates are similar above a threshold acceptance level of approximately 30. However, the false rejection rates are much higher, and regardless of the number of enrolment images or the threshold level, they never fall to 0%. Unlike the results for finger length, the overall score rule achieves better performance than using the average score. In general however, performance is better using finger length, three enrolment images and the lowest average score for matching. Verification Again, by contrast to the finger length results, the performance of verification is poorer. The GAR curves in the length experiments reach 100% by a low threshold of approximately 30 for two or three enrolment images, unlike the steady increase shown in the graphs below, which never reach 100%. Following the trend so far, three enrolment images produce the best results, and like the length experiments, using the overall score provides better performance for verification. Figure 5.9 & 5.10 Overall and average verification results, effect of increasing the threshold and no. of enrolment images used on GAR & FRR
41 Performance Like the finger length experiments, a full table of results is provided in Appendix D. Table 5.2 below shows how this technique performs at the same threshold as the results provided in Table 5.1: IDENTIFICATION VERIFICATION GAR GRR FAR FRR FMBT* GAR FRR Enrol. Images Threshold Table 5.2 Comparison of results at threshold acceptance level of 120, and varying the no. of enrolment images and scoring type (overall or average) It should be clear by the graphs that, although this technique does not appear to perform as well at lower levels, above a threshold of 100 the results are comparable to the length-only results. Strangely, two enrolment images seem to produce a better overall genuine acceptance rate (in identification mode) than three images. Like the length results, overall average scores perform better in identification mode, with optimum performance of 92.9% GAR, 58.3% GRR, 9.8% FAR and 2.9% FRR. Notice that the FMBT rate is significantly lower using this technique than the finger length method (which was around 18%). This is a good indication that, although the FAR is still high, the separation of user s measurements in feature space is greater - so the technique is likely to be more robust against false acceptances using further probe scans. Verification rates, although not as successful as those achieved using the length method, are still admirable. With an increased threshold the verification scores will undoubtedly improve, at the expense of being less strict however, and at an increased risk of granting access to an unauthorised user Finger Length and Width Combined Results The next logical step is to see if combining the lengths of the two innermost fingers, and the widths of all four fingers, can improve results. After all, the more biometrics used, the more unique the template produced is likely to be. Some people may have short but broad fingers, whilst others long but narrow, or vice versa. The higher discriminative power of the widths may add enough differentiation between users to reduce the FAR and FMBT rates of finger length on its own, considerably. Again, using the same probe images as the previous tests, the results below show how combining the two innermost finger lengths, and the widths of all four fingers perform. Identification and verification graphs are provided in Figures , and a performance table follows in Table
42 Identification Figure 5.11 & 5.12 Overall and average identification results, effect of increasing the threshold and no. of enrolment images used on FAR & FRR In comparison to the results obtained for the other experiments, this approach looks very promising in significantly distinguishing users from each other. The false acceptance rates are zero across all tests and all thresholds. This is a great improvement over using length or width in isolation. Although the false rejection rates are higher than the other techniques, it is more important to have a low false acceptance rate. At higher thresholds the FRR is close to zero, and like the other experiments, three enrolment images produce better results. Like the separate width-only results, overall score mode produces the best performance, which is only really shown by the improved genuine acceptance rate and reduced false rejection rate. The false acceptance rate and genuine rejection rates are at the maximum of 0% and 100% respectively - regardless of the threshold used, or the number of enrolment images. Verification Although the FRR does not reach 0%, increasing the acceptance threshold further will result in the FRR becoming 0% and consequently the GAR 100%. Above a threshold of 100 though, the GAR is 97.1% for two or three enrolment images, whether using the overall or average score set-up, which is still very impressive. Figure 5.13 & 5.14 Overall and average verification results, effect of increasing the threshold and no. of enrolment images used on GAR & FRR
43 Performance The results of combining the length and width measurements are shown in Table 5.3 below. (Further results in Appendix D.) Notice that two or three enrolment images produce the best results, and both produce identical genuine acceptance rates and false rejection rates for identification and verification. IDENTIFICATION VERIFICATION GAR GRR FAR FRR FMBT* GAR FRR Enrol. Images Threshold Table 5.3 Comparison of results at threshold acceptance level of 120, and varying the no. of enrolment images and scoring type (overall or average) Although there is no clear difference in the results of two or three enrolment images, only 82 test images are used against 19 enrolled users. Looking at the results from the previous experiments however, using three enrolment images produces optimum results, so this should be the chosen setting. Upon scaling, testing with a larger database and more probe images may further quantify this decision. Notice that the FMBT rate is extremely low at only 0.4%. This provides clear evidence that combining length and width separates users substantially from each other. As this rate is so low, the risk of the system producing a false acceptance is greatly reduced. Even with the highest tested threshold of 120 only 16 matches out of a possible 4,674 comparisons were of a different user than the probe image was of; compared with 677 when using length only or 163 with width only. This is a substantial improvement Summary Of Results Although the GAR using length only seems quite high at 92.9%, unfortunately the FAR and FMBT rates are also high. Using the overall score rule the FAR is as high as 14.6%. Coupled with this, the GRR is too low, and therefore these results are unacceptable. Finger length in isolation is not very distinguishing as the basis of biometric representation, subsequently the verification results are the highest using this approach. This is because the maximum difference between the shortest-fingered registered user and the longest-fingered is approximately 80, when using only two fingers. Width-only produces slightly inferior (but still admirable) verification results, but with the benefit of more robust identification performance. In identification mode, although the GAR is slightly lower than length-only, the GRR performs better using the overall score rule; and perhaps more importantly the FAR is lower. The FMBT is substantially lower, demonstrating the potential of widths as more distinguishing features to use. This is quite predictable though; the more features extracted the more unique the representation is likely to be. Using only two finger lengths to determine the authenticity of a user is unlikely to be reliable on large
44 scaling of the number of users enrolled. By combining the lengths and widths, system performance of identification improves considerably. With a GAR of 97.1%, GRR of 100%, FAR of 0% and FRR of 2.9% - robustness of the technique looks very promising; this is credited by an extremely low FMBT rate of 0.4%. Table 5.4 below shows the results of the three approaches discussed above, shown in a single table for clearer comparison. This summary table only provides details of the performance of three enrolment images; as from all the experiments the results produced were best with this setting. IDENTIFICATION VERIFICATION GAR GRR FAR FRR FMBT* GAR FRR Length Only Width Only Length and Width Table 5.4 Overall summary table, showing results from all three experiments. Values shown correspond to a threshold acceptance level of 120. The three ROC curves (shown left) compare the genuine acceptance rate with the false acceptance rate for each technique. Three lines are plotted for each graph, representing the number of enrolment images used in each experiment. Looking at the first graph, the largest FAR is fairly high, at close to 20% for one enrolment image. Ideally this rate should be minimized, and as close to 0% as possible. Using finger width (graph two) improves this rate to a maximum of approximately 15%, as demonstrated by the shift of the three curves to the left. By combining the lengths and widths (graph three), the FAR is reduced to zero across all thresholds, and is minimised as much as is possible. As a result, by increasing the acceptance level threshold the GAR improves without any affect on the FAR. This is ideal and system performance using both length and width combined provides the most robust results
45 5.7. Robustness Testing Now that length and width combined have been proven to provide the best results, the system is configured to this set-up. Although the results discussed above are very encouraging, the next stage is to test how robust the technique is to various usage conditions. These are explained below, and resulting system behaviour is discussed afterwards Hand Orientation Placement of the hand on the scanner plate is uncontrolled. However, it is assumed that the hand will be placed fairly straight-up. Although the system calculates the measurements based on the entire shape of the hand, the effects of varying the positioning as much as possible are shown in Figures above, and graphically in Figure These images are of an enrolled user. The normal on the graph represents the values expected for each biometric feature for the particular individual, based on their three enrolled images. Each test image is shown as a line on Figure 5.15 Test 1 Match score = Figure 5.16 Test 2 Match score = Figure 5.17 Test 3 Match score = Figure 5.18 How the test image measurements differ from the average of 3 enrolled images (the normal ). Notice how test 2 is closer to the normal compared to 1 and 3. the graph. The more the lines deviate from the normal, the greater the effect of hand orientation on results. Test image 2 (Figure 5.16) is expected to be the most common orientation of the hand, and is the most natural way of placing the hand in the scanner. Test images 1 and 3 required the hand to be twisted as far as it could clockwise and anti-clockwise. These two images therefore represent the extremes of values expected by varying hand orientation. Although test image 2 provides the lowest score, using a minimum threshold of 100, all three images would be accepted by the system Hand Pressure As mentioned earlier (Chapter 3, section 3.5.) the amount of pressure applied to the scanner plate effects the quality of the captured image. The harder the hand is pressed, the whiter the image produced is. Therefore, if the fingers (in particular) are not placed as flat as possible, they could appear thinner after thresholding due to this darkening effect at the finger edges. Like the orientation tests above, Figure 5.22 compares three test images against the average of three enrolled images. Fig 5.19 and 5.21 are examples of little/no pressure and pressing as hard as possible against the scanner plate without breaking the glass. Test 2 is again an example of an ordinary scan, with the pressure applied as naturally as possible

46 The results are good for the normal pressure and still good for Figure 5.19 Test 1 Figure 5.20 Test 2 Figure 5.21 Test 3 Match score = Match score = Match score = pressing as hard as possible. Problems occur however with too little pressure applied by the user. Looking at test image 1 (Figure 5.19), the hand is very dark, particularly near the bottom of the fingers and the palm. When the threshold operation is applied this can remove portions of the hand like this since it appears too dark. If this is the case, feature extraction will generally fail, as an incorrect number of landmarks will be detected. However, if feature extraction succeeds (as it does with test 1), the result is unlikely to be satisfactory. The score produced for Figure 5.19 (over 2,400) is way beyond any sensible threshold and will Figure 5.22 How the test image feature measurements differ from the average of three enrolled images. Notice how test 2 is closer to the normal compared to 1 and 3. consequently report a false rejection. Looking at the border produced for this test image makes it clear why the score is so high (Figure 5.23 below). The middle finger is captured darkest out of the four, and after thresholding a lot of the finger shape is lost. As a result the width measurements for this finger will be very different from the ordinary scan (Figures 5.20/5.24), and this is shown distinctly by the large trough in the test 1 line in Figure 5.22 above. As the fingertips and the little finger are produced sufficiently well in test 1, the line produced is quite near to the normal for these Figure 5.23 Border produced from Figure 5.19 measurements. It is only near the bottom of the fingers where measurements the deviate substantially, due to the inadequate pressure of the hand against the plate during scanning Figure 5.24 Border produced from Figure 5.20

47 Finger Separation The third major factor that could influence results is the separation of the fingers whilst scanning. As the system calculates the biometrics based on the landmarks, the fingers must be sufficiently far away from each other so that the border can be traced round the whole shape of the hand successfully. If, after thresholding, the fingers seem to join up, then the inter-finger landmarks will be plotted in the wrong location, see Figures above. This aside, assuming there is a sufficient gap between the fingers, how does the size of this gap affect the results? Test images 1 to 3 (shown in Figures , right) show various finger poses, ranging from being very close together (but not too close as to cause an error), to being as far stretched as possible. Test image 2 is again an ordinary scan, with fingers separated as naturally as possible. The results show that the scores produced for all three tests are still acceptable regardless of finger separation, with a minimum acceptance threshold of 80 required in order to accept these images. Figure 5.25 The two innermost fingers (ring and middle) are too close together in this scanned image. Figure 5.26 Therefore landmark 3 is plotted in the wrong location, and finger widths are incorrectly calculated. Figure 5.27 Test 1 Match score = Figure 5.28 Test 2 Match score = Figure Test 3 Match score = Figure 5.30 How the test image feature measurements differ from the average of three enrolled images. Notice how test 2 is closer to the normal compared to 1 and Impact of Finger Nail Length Finger length and width calculation relies on the fingertip landmark being stable across multiple scans of a user. However, finger nail-length could cause inconsistency of this location over time. This is more likely to impact female users of the system who may have longer nails on occasion. To see how length affects the matching score of genuine users, two of the individuals enrolled on the system grew their nails longer than they were when the enrolment images were captured
48 The tests carried out show how extreme nail length impacts the performance of the system for enrolled users. After thresholding the fingers appear to be longer than they actually are due to the extra long nail lengths. Consequently the landmarks are plotted in the wrong location and the lengths and widths measured are not close enough to the enrolled images for the system to accept the probe images. The only way to overcome this problem using the measurement method implemented here, is to re-new the enrolment images for the user if they intend to have long nails on a long term basis. Appendix D details the results Time Lapse Experiments As discussed in the background research, the prototype developed by [29] reported better results for test images captured same day as opposed to those on different days. To see how time lapse affects the performance of the system, extra images from some enrolled users were acquired several weeks after the original enrolment images were captured, and tested. Appendix D, again, details the results. The results suggest that same day results do indeed perform better. Although the system did perform reasonably well with more recent scanned images, those captured on the same day produced much better results. The GAR dropped to 84% and the FAR increased to 4% using recent images. This could be because of a different amount of pressure being applied by the test participants, compared to their original scans. Further investigation is required to better understand the impact of time lapse Spoofing Identity The tests above show how robust the prototype is to conventional usage. However, unauthorised users may try and misuse the system in attempt to gain access. As the feature extraction technique relies on the silhouette of the hand, this section discusses spoofing identity by attempting to login with a drawn outline, photocopy, or stencil of an authorised user s hand. Firstly, testing using a sheet of A4 paper containing only the outline of the hand was carried out. This test failed however, due to the pre-processing operations. When the image is acquired, after thresholding a median filter is applied, and this causes the thin outline to be removed. Therefore an outline of the hand is insufficient to break the security of the system. Next a colour photocopy of the hand was tested. Due to the way in which the toner dried on the photocopies they were unsuitable for use with the system, as the background segmentation stage failed. Instead colour printouts were tested (See Appendix C). All scores were above the acceptance threshold, however not convincingly high enough to rule out the potential of an unauthorised user spoofing the system by this method. Following this an attempt at using a cut-out (or stencil) of the hand shape was tested. From a photocopy of a genuine user s hand, the shape was cut out of a sheet of A4 and placed into the scanner (an example is shown in Appendix C, on page 65). The system accepted this image and granted access, with a match score of 63. This is obviously a problem; assuming an unauthorised user can acquire an outline of an authorised user s hand and produce a stencil like that shown in Appendix C, they could be granted access. Further discussion is provided in the Conclusion, section
49 Chapter 6 CONCLUSION 6.1. General Conclusion Looking back at the introduction, requirements were set for the system to meet. Using the minimum requirements and the possible extensions as a checklist, the first issue to address is whether a solution for the initial problem has been produced. The minimum requirements specified that a system be developed to perform biometric analysis of scanned images of the hand. The prototype produced investigated the possibilities of using finger length, and finger widths as a basis of biometric authentication. It also incorporated the extension of scanner control from within the software, and a graphical user interface (screen dumps are provided in Appendix E, section E.3). This interface allows the user to scan their hand for identification purposes. A separate program is available for the administrator to enrol new users to the database. The administrator must log-in to receive this privilege, by scanning his/her hand. If the system verifies that the captured image is of an authorised user, then access is granted. Once the software prototype was implemented, the system was extensively tested as shown in the previous chapter (Evaluation). Various measurement methods were investigated, and their results detailed and discussed. Several other prototype systems were discussed in the Background Research chapter. The best performance for this system was achieved using length and width measurements combined. Table 6.1 (below) provides a comparison between the published systems and the prototype developed in this report. Most of the published papers do not state all of the rates indicated in the table, therefore blanks have been printed where the rate is unknown. IDENTIFICATION VERIFICATION GAR GRR FAR FRR GAR FRR Reference [24] 97.00% > 90.00% < 10.00% Reference [25] % 0.68% - - Reference [26] % 1.50% - - Reference [27] % 0.48% 99.04% 0.96% Reference [29] 98.83% % % 0.86% Reference [31] %* 3.20% THIS SYSTEM 97.10% % 0.00% 2.90% 97.10% 2.90% Table 6.1 A comparison of performance against the systems discussed in the background research chapter. *reported results ranged from % in Reference [31]. The performance of this system is comparable to those discussed in the background research section, showing that the techniques developed in this report provide good discriminative power between users and that finger lengths and widths combined are suitable as the basis of a biometric authentication system
50 Part of the possible extensions listed in the introduction chapter specified that, where possible, ways of improving the system should be suggested, and these follow Potential Improvements and Further Work The first major decision made during the configuration of the system was when investigating the use of four fingers for extracting measurements from. However, in section the inconsistencies in the lengths of the two outer fingers resulted in only the two innermost fingers receiving further analysis. Although the outer fingers were used later for width extraction, there is the potential for exploiting the lengths of these fingers to help further separate users in vector space. Another method for calculating the finger lengths could be investigated to see if these extra two measurements add any additional distinguishing power to the system. The next major influencing factor was the number of samples to take from each finger when calculating the finger widths. After investigation, the decision was made to use six samples per finger. Changing this value will undoubtedly impact the performance of the system, and a trade-off between the quantity of stored measurements, matching time and accuracy resulted in six being the chosen value. Further analysis may lead to a different value selected which may yield better results. It may make sense to extract more measurements from the middle finger than the others, with it being the largest finger, for example. Further investigation into the threshold acceptance level for the length and width combined set-up may prove that a higher threshold improves the results without any negative impact on the system performance. The threshold could also be altered by the security level required, or perhaps learnt from analysis of all of the enrolled users and choosing a value that will ensure false acceptances are minimal, ideally zero. The results from all the experiments illustrated that three enrolment images provided the best system performance. Further investigation may prove that four, five or six could improve the situation further, enhancing results. Using more images may have no impact on the performance however, and could even have a negative effect. More enrolled images requires more storage space and more processing in the matching stage. Deeper analysis would be required before any conclusions could be made as to whether more enrolment images would be beneficial. Perhaps one of the most obvious further developments to explore is the use of the right hand. The system has been implemented to function based on the left hand. The expected order of the finger landmarks is the foundation on which the feature extraction is built upon. If the right hand is scanned instead however, either the thumb or the first finger will be identified first and the other fingers in reverse order to how the system is currently set-up. This problem can be overcome by either configuring the border program to begin from the opposite side of the image and traverse the boundary clockwise instead of anti-clockwise; or simply reversing the settings specified for the fingers so that they relate to the corresponding fingers on the right hand. Either way, incorporating the right hand into the user template will add extra dimensions to the vector space and undoubtedly improve identification performance. This is
51 obviously at the expense of requiring extra enrolment scans, additional storage and more time to login. Alternatively, the right hand could be used in situations where there is no clear distinction between two users. Perhaps there are two individuals with close left-hand templates; requesting an extra scan from the right hand may then add enough separation to make it clearer to identify the user. This could be implemented as an extra option to be used where necessary, rather than built into the standard login procedure. An important issue surrounding the use of biometrics is how the details are stored. People are often sceptical about their personal details being kept on a central database and public concerns over security can hinder the deployment of such systems. Once the biometrics have been calculated and a template produced, secure storage is essential. As mentioned in section 4.2., after acquiring the image from the scanner, the median filter operation (part of the pre-processing stage) is the next major bottleneck of the system. As shown in Figure 3.2 of Chapter 3, it takes approximately 3 seconds to median filter an 850x960pixel image. Once preprocessed, the matching stage takes less than a second. Therefore another way of removing the artefacts and smoothing the image is desirable. Median filters sort the pixels in the neighbourhood by their greylevel, however the median filter implemented in this prototype works on a binary rather than a greyscale image. An alternative technique could involve a binary morphological operation. By applying a BinaryOpen operation [43], using a circular 7x7 array as the structure element (the same size as the median filter used), the artefacts are removed in approximately 1.8 seconds - with similar results. This is almost half the time the median filter requires but further investigation is necessary to see if this operation is suitable, and will provide consistent results for all of the test data. The main drawback of the system, as identified in the evaluation, is that the authentication of users is based on their hand silhouette. In section , when testing to see if an authorised user s identity could be spoofed, scanning a 2D stencil of an authorised user s hand shape allowed access to be granted. This is obviously a problem for the system, but there are potential ways of solving the situation. One way is to capture a side elevation of the hand, like two of the systems discussed in the background research chapter [24, 25]. The platform, where the hand is placed for these systems, has a mirror attached, so when the camera above takes the photo of the top-down view of the hand, the side and therefore heights of the fingers and wrist are also acquired. Not only does this ensure an actual 3D hand is present in the capture device, but further biometrics can be extracted such as the finger heights etc. However, there are still unresolved issues here. Although it may sound absurd, an unauthorised user could place a 3D-mould of an authorised user s hand in the scanner and assuming the shape is a close enough match gain access. The argument here though, is that access points should be supervised and if any suspicious behaviour is detected, then security personnel should carry out further investigation. Attaching a mirror to a flatbed scanner is unlikely to achieve suitable results, but this idea warrants further thought. Another extension is to incorporate skin tonality into the user templates. All of the test images were acquired in colour to allow further work on the colour of the hand surface to be investigated. Issues
52 with the hand pressure making the captured image appear whiter could cause problems however. Nevertheless, certain areas of the hand could produce more consistent results across images, meaning colour analysis could be incorporated into the system to further distinguish between users. One stage further would involve some degree of texture analysis of the hand surface. As discussed in the background research, some biometric systems are based on palm patterns [28, 29, 30]. Another system uses the surface texture from three fingers to identify a user [31]. In the Methodology (Chapter 3) and Evaluation (Chapter 5), examples are provided that show how the pressure applied by the user affects the quality of the image captured. Generally however, the pressure of the fingers seems to be fairly consistent for the test images acquired in the data collection stage. Most of the pressure is applied at the fingertips and around the palm of the hand, so fingerprint or palm print analysis would not be possible. An investigation into analysis of finger textures could prove useful however. If results can be obtained close to (or better than) that of the prototype discussed in [31], then this approach would be a very valuable extension to the system. Like the suggestion of using the right hand as an extra if the system cannot clearly make a decision as to which user the image belongs to, texture analysis could add an additional, optional level to the system. Where a user s biometrics are similar to one or more other user s, the textures of the fingers could also be compared. This should make distinguishing between this short-list much easier, and with increased accuracy. This would also mean that there would be no performance hit for the majority of logins only where it is necessary to further analyse the scanned image before making an authenticating decision Finger Surface Extraction Realising the potential benefits of incorporating finger surface analysis into the prototype, some preliminary work to extract the textures from a scanned image has already been carried out. Based on the method for extracting the finger widths, this technique relies on first calculating the points on the hand border corresponding to a specified distance in-front of, and behind the fingertip landmarks ( f and b in Figure 6.1). Once these points are located, the texture is extracted from the original scanned image, scan-line by scan-line until the fingertip is reached. The way this is carried out depends on whether b or f has the smallest y value (calculated from the top of the image). If b has the smallest y value (as in Figure 6.1), it is selected as x1 and the finger outline is traversed anti-clockwise until the b f Figure 6.1 An example of how the texture is extracted scan-line by scan-line, between x1 and x2 calculated in relation to the finger border. point on the border is reached that corresponds to the same y value. Where this point does not lie in the darker region shown in Figure 6.1, the x value for f is used as x2. All the pixels between x1 and x2 are then extracted. Following this the point b on the border is incremented to the next y value and the process is repeated until the fingertip is reached


53 If f has the smallest y value, the border is traversed clockwise until the corresponding point is found on the opposite finger edge. The extraction process is the same once x1 and x2 have been identified for the particular scan-line. Appendix E includes some program code snippets illustrating how this algorithm works. Figures below show the fingers extracted from the scanned image shown in Figure 6.2, below. Figure 6.2 A scanned image of a user s hand Figure 6.3 After producing the outline and identifying the landmarks of the hand image shown in Figure 6.2. Figure 6.4 The little finger extracted (corresponds to the example shown in Figure 6.1) Figure 6.5 The ring finger Figure 6.6 The middle finger Figure 6.7 The first/index finger Once the texture has been extracted, the next stage is to rotate it so the finger is vertical, then align and write to a separate file. The textures could be stored in matrices within the user object instead of outputting to separate files; meaning no storage of the images would be required and also offering higher security, as the matrices could be encrypted as part of the user template


54 Figures show the same extracted fingers rotated and aligned. The widths of all the images are constant, and the heights of the images are also fixed but are different depending on the particular finger. This is because the method described in Chapter 4 for calculating the finger widths extracted a smaller length from the little finger (being the smallest), a larger length for both the ring and first finger, and the largest length from the middle finger. Figure 6.8 Figure 6.9 Figure 6.10 Figure 6.11 Little finger Ring finger Middle finger First finger Once aligned, the next stage is to see if the textures are suitable for comparison with those from other users. To illustrate how the patterns of the finger surface vary between individuals, Figures below compare corresponding fingers from several scans of different users. The fingers are extracted from various different images (shown in Appendix F), all with varying hand placement, finger spread and hand orientation. Notice how the textures produced are almost identical for sets from different scans of the same user. This is very promising, and further validates the stability of the fingertip landmarks location. Figure different middle fingers extracted from user a', notice how similar they are after alignment Figure different middle fingers extracted from user b Figure different middle fingers extracted from user c Figure different ring fingers extracted from user a', notice how similar they are after alignment Figure different ring fingers extracted from user b Figure different ring fingers extracted from user c
55 Using the extracted textures, the final stage is to compare the images and come to some conclusion as to how close they match. One such way is to compare corresponding pixels, one-by-one, between the two images and then total the number of identical matches. This is the approach taken in the system described in [31], where the following formula is used: 1 score( p, g) = I( p( i, j) g( i, j) (9) N ( i, j) valid p and g represent the probe and gallery images, N is the number of valid pixels in both images, and i and j are the co-ordinates of the current pixel. I is the indicator function and returns unity (1) if the pixels are identical, or zero otherwise. The score produced is the total number of identical pixel matches between the two images. To compensate for potential alignment error, this formula is applied several times - with the probe image shifted a pixel in each direction each time. The highest score produced is taken as the match score, and this is tested against an acceptance threshold to decide whether the images correspond to the same individual. Another matching technique is to use normalised greyscale correlation. This method removes the mean value calculated for each image from each pixel to reduce the effects of global lighting changes (although this should be irrelevant using a flatbed scanner with fixed settings). The distance between the two images (probe and gallery) is then computed as follows: ( pi p)( gi g) i NGC( p, g) = (10) 2 2 ( p p) ( g g) i i i i where pi represents the current pixel (i) in the probe image, and pixel in the gallery image. gi represents the corresponding current p and g are the mean grey-level values in the probe and gallery images respectively. For normalised greyscale correlation to produce reasonable results using the images shown in Figures , only the middle region of the images is suitable. Using all of the pixels in the image will skew the results; as a high percentage of the pixels are black and this would affect the mean calculation. The main problem with any matching techniques relating to texture is the consistency and quality of the images captured. Those images shown in Figures above have lost a lot of detail at the fingertips due to the pressure applied on the scanner surface. Therefore the usable area is greatly reduced to quite a small region. Whether the amount of detail in this region is enough to distinguish between users needs further investigation. Acquiring the hand images in a higher resolution could be a solution to obtaining more useful features but this is at the expense of additional time required to capture, process and store (if necessary) the images
56 REFERENCES 1 Home Office: Identity Cards. April Identity Cards Bill. April IBM ThinkPad X41. Released 5 th April Microsoft Wireless Optical Desktop with Fingerprint Reader Released 21 st September The United Kingdom Passport Service: Entitlement Cards. April The United Kingdom Passport Service: Improving Passport Security and Tackling ID Fraud. April W. Shen, R. Khanna. Iris Recognition: An Emerging Biometric Technology. Proceedings of the IEEE, Vol. 85, No. 9, September J. Kim, J. Choi, J. Yi. Face Recognition Based on Locally Salient ICA Information. Proceedings of the ECCV 2004 International Workshop, BioAW, May L. Zhang, D. Samaras. Pose Invariant Face Recognition Under Arbitrary Unknown Lighting Using Spherical Harmonics. Proceedings of the ECCV 2004 International Workshop, BioAW, May L. Nanni, A. Franco, R. Cappelli. Towards a Robust Face Detector. Proceedings of the ECCV 2004 International Workshop, BioAW, May W. Shen, R. Khanna. Fingerprint Features: Statistical Analysis and System Performance Estimates. Proceedings of the IEEE, Vol. 85, No. 9, September W. Shen, R. Khanna. An Identity-Authentication System Using Fingerprints. Proceedings of the IEEE, Vol. 85, No. 9, September A. Ross, A. Jain. Biometric Sensor Interoperability: A Case Study in Fingerprints. Proceedings of the ECCV 2004 International Workshop, BioAW, May H.L. Lee, R.E. Haensslen. Advances in Fingerprint Technology. Eds. Second ed., Boca Raton, Fla.: CRC Press, S. Hangai, T. Higuchi. Writer Identification Using Finger-Bend in Writing Signature. Proceedings of the ECCV 2004 International Workshop, BioAW, May
57 16 R.J. Anderson. Security Engineering. Wiley, A.K. Jain, R. Bolle, S. Pankanti. BIOMETRICS Personal Identification in a Networked Society. Kluwer Academic, R.J. Hays. INS Passenger Accelerated Service System (INSPASS). December Recognition Systems Inc. December I.H. Jacoby, A.J. Giordano, W.H. Fioretti. Personal Identification Apparatus. U.S. Patent No , R.H. Ernst. Hand ID System. U.S. Patent No , D. Sidlauskas. 3D Hand Profile Identification Apparatus. U.S. Patent No , R.P. Miller. Finger Dimension Comparison Identification System. U.S. Patent No , R. Sanchez-Reillo, C. Sanchez-Avila, A. Gonzalez-Marcos. Biometric Identification though Hand Geometry Measurements. IEEE Transactions on Pattern Analysis and Machine Intelligence, 22(10): , October University of Bologna. HaSIS: A Hand Shape Identification System. December A.K. Jain, N. Duta. Deformable Matching Of Hand Shapes For Verification. In Proceedings of International Conference on Image Processing, October Y.L. Lay. Hand Shape Recognition. Optics and Laser Technology, 32(1):1-5, February NEC automatic palmprint identification system. April D. Zhang, G. Lu, A.W.-K. Kong, M.Wong. Palmprint Authentication System for Civil Applications. Proceedings of the ECCV 2004 International Workshop, BioAW, May D. Zhang, W.K. Kong, J. You, M. Wong. On-line palmprint identification. IEEE Transactions on Pattern Analysis and Machine Intelligence, vol. 25, no. 9, pp , D.L. Woodard, P.J. Flynn. 3D Finger Biometrics. Proceedings of the ECCV 2004 International Workshop, BioAW, May Konica Minolta Vivid 910 3D scanner. April Handpunch Biometric Hand-Geometry Recognition Terminal. December VeryFast Access Control Terminal. December
58 35 Gnome. Morena 6 is Image Acquisition Framework for Java Platform. December A. Rosenfeld, E. Johnston. Angle detection in digital curves. IEEE Transactions on Computers, 22: , N. Ansari, K.-W. Huang. Non-parametric dominant point detection. Pattern Recognition, 24(9): , N. Ansari, E.J. Delp. On detecting dominant points. Pattern Recognition, 24(5): , F. Mokhtarian, A. Mackworth. Scale-based description and recognition of planar curves and 2D shapes. IEEE Transactions on Pattern Analysis and Machine Intelligence, 8(1):34-43, A. Bulpitt, N. Efford. Border algorithm. AI31 Libraries, School of Computing, University of Leeds, October D.A. Reynolds and R.C. Rose. Robust Text-Independent Speaker Identification Using Gaussian Mixture Speaker Models. IEEE Transactions on Speech and Audio Processing, vol. 3, no. 1, pp , D.A. Reynolds. Speaker Identification and Verification Using Gaussian Mixture Speaker Models. Speech Communications, vol. 17, pp , N. Efford. BinaryOpen algorithm. Digital Image Processing: A Practical Introduction Using Java, Pearson Education Ltd.,
59 APPENDIX A A.1. Personal Reflection When choosing a final year project, I wasn t sure what exactly I wanted to do. Searching through the list of ideas proposed seemed very daunting at first, until I noticed the title Biometric Authentication System posted by Nick Efford. I was intrigued immediately by the topic area and hoped that I would be allocated the assignment. I didn t think it would be possible to identify an individual from their hand shape, and was very sceptical at first but after my first supervisor meeting I went away with some ideas and was eager to start implementing a prototype. One of the goals I wanted to reach from the beginning was scanner control from within a prototype program. I was very interested in trying to get this to work and investigated possible ways of doing it near the start of the project development. Which programming language to use was a key factor and influenced how to tackle this problem. After searching the Internet, a library for Java called Morena [35] was found and this proved very useful. Although scanner control was achieved fairly early on, one of the major problems was the actual hardware used. Originally I was using my very old parallel-port controlled scanner. This was very slow, and regardless of the resolution of images chosen, proved to be very frustrating. I knew that I would need to acquire as many hand images as possible for testing the system. After a few weeks of attempting various ways of speeding up the image acquisition I was still unsatisfied that the hardware was suitable. Therefore I decided to purchase a more up-to-date scanner in the hope that it would work faster. Luckily the money was well spent, and the new scanner boasted USB 2.0 capabilities - meaning image acquisition (even in colour and at high resolutions) was very fast, and much more efficient than the old parallel-port relic. In hindsight, instead of wasting time with the old scanner I should have bought the new one at the beginning of the project. As part of looking at ways of extending the system for improved reliability, more background research was carried out after the January exam period. Originally, only finger lengths were investigated as the basis of biometric authentication. However after reading these extra papers, new ideas were discovered. Subsequently finger widths and texture analysis were explored. Looking back I should have maybe carried out deeper research at the beginning of the project rather than doing this at a later stage. However I was happy with my progress and the stage I had reached by the Christmas vacation. Having achieved scanner control and landmark identification from the captured images, this allowed me to start measuring finger
60 lengths, but I hadn t considered using finger widths at this stage. The extra research carried out therefore offered further improvements for the prototype and built upon these system foundations. In order to test the system thoroughly, it is important to use as many hand images as possible. Although I acquired images from twenty-two individuals, ideally using many more would have validated the results of the evaluation further. For someone considering continuation of work on this system, I would recommend they start capturing images as early as possible. Maybe try and set up the scanner in a busy place, possibly, and see if images can be obtained from members of the public. The whole idea of biometric authentication has attracted interest with friends, and seeing people getting their hands scanned is bound to raise curiosity amongst passer-bys. At around ten seconds to capture an image, people shouldn t have a problem participating. This is well worth a try, although potentially embarrassing, it ensures a diverse and comprehensive test data set. All in all, I am very pleased with the outcome of the project. I have produced a system that successfully identifies all of the enrolled users based on their hand geometry, and rejects images of those who are not enrolled. I am therefore very satisfied with the results and the system performance achieved. Although at times the project has been frustrating, it has been fun and rewarding, and I hope that if anyone continues the work I have started here, they will enjoy the challenges posed as much as I have
61 APPENDIX B B.1. Computer Hardware Specification The computer hardware specification used in the development of the project is as follows: AMD Athlon XP GHz 512MB DDR RAM 160GB HDD USB 1.1 Running Microsoft Windows XP, Service Pack 2 However, a faster laptop was used in the progress meeting presentation in March The specifications for this system are as follows: 3.06GHz Mobile Intel Pentium 4 512MB DDR RAM 60GB HDD USB 2.0 Hi-Speed Running Microsoft Windows XP, Service Pack 2 B.2. Scanner Hardware Specification The capture device used in this project for acquiring hand images is a standard flatbed scanner. At around 50 and available from a range of different shops, the full specification of capabilities is as follows: Canon CanoScan LiDE x 2400dpi 48-bit input/output USB 2.0 Hi-Speed (where supported, otherwise USB 1.1) Power supplied via USB port. In order to facilitate the segmentation process (as discussed in section 3.4.), a black surround was produced to ensure that light would not affect the image captured and also ensure consistency of the images captured. Constructed from a thick, black cardboard box the enclosure simply rests on the scanner surface, acting as a wedge holding the scanner lid at a fixed height


62 The photographs in Figures B.1 B.6 below illustrate the scanner and the enclosure produced. Figure B.1 Scanner and surround, shown separately, notice the gap in the surround to place hand through for scanning Figure B.2 Scanner lid open, with surround resting against the lid Figure B.3 Scanner with surround placed on top of the scanner surface, lid open still Figure B.4 The lid holds the surround in place, therefore no physical attachment to the scanner is necessary


63 Figure B.5 A side view of the scanner with the surround in place, notice how the surround keeps the lid open at a fixed angle. Figure B.6 Corner view of the scanner with surround
64 APPENDIX C C.1. Example Scans The following pages provide examples of the scanned images acquired. These printouts are also used in the testing described in the Evaluation (section ) for the spoofing identity experiments. As the software is configured so the scanner captures the image from a specified window (default a 8.5 by 9.6 ) the images shown on the following pages have been aligned so after printing they can be placed into the scanner aligned to the A4 paper guides on the actual hardware. The final image shown is the stencil used in section of the Evaluation. The actual stencil tested is included in this document, and if further are required then the page can be printed and the green hand image cut out and used
65 - 60 -
66 - 61 -
67 - 62 -
68 - 63 -
69 - 64 -
70 - 65 -
71 APPENDIX D D.1. Width Sample Variation Graphs As discussed in section 5.4. of the Evaluation chapter, (and also in section of Chapter4), the number of samples chosen when extracting the finger widths from each finger, will have a significant impact on the results obtained. The three graphs on the following page (Figures D.1 D.3) show how using three, nine and twelve samples per finger separate four different users in vector space. Six samples were used in the final implementation, and the graph showing six samples per finger is shown in the Evaluation, section 5.4. D.2. Results Tables Following the graphs, results tables are provided detailing the outcome of the extensive tests varied out when evaluating the system. Tables are provided showing the full sets of results of identification and verification, for thresholds of 10 to 120, and for all the experiments discussed in Chapter 5: Finger length Finger Width Finger length and width combined (used in the final implementation) Impact of finger nail length Time lapse experiments Spoofing identity (by trying to login with the images shown in Appendix C above)

72 Figure D.1 With three samples for each finger, there is a clear separation between different users, however only twelve biometric dimensions per user. The green line representing user a comes very close to that of d for some of the middle finger measurements and all the first finger measurements. Therefore only seven out of these twelve features are useful in distinguishing user a from d, this may not be enough. Figure D.2 The converging of the first and second measurements for each finger is more apparent here. Therefore measurements nearer the fingertip seem less discriminative than those sampled further down the length of the finger. Thirty-six measurements per user here, although perhaps only twenty-eight are useful - the first two widths sampled for each finger could be discarded. Figure D.3 Twelve measurements per finger in this example, providing a potential of forty-eight features for each enrolled image. The measurements made at the tip of the fingers are too similar to be considered worthwhile for inclusion in the template stored for each user. Discarding the first three samples extracted for each finger though, and thirty-nine potentially useful features remain
73 Two Innermost Finger Length Results Probe images: 70 genuine, 12 impostor IDENTIFICATION VERIFICATION GAR GRR FAR FRR FMBT* GAR FRR Enrol. Images THRESHOLD *FMBT = False Matches Below Threshold
74 Finger Width Results Probe images: 70 genuine, 12 impostor (4 fingers, 6 measurements each) IDENTIFICATION VERIFICATION GAR GRR FAR FRR FMBT* GAR FRR Enrol. Images THRESHOLD *FMBT = False Matches Below Threshold
75 Finger Length and Width Combined Results Probe Images: 70 genuine, 12 impostor IDENTIFICATION VERIFICATION GAR GRR FAR FRR FMBT* GAR FRR Enrol. Images THRESHOLD *FMBT = False Matches Below Threshold
76 Impact of Finger Nail Length Results Probe images: 10 genuine, 0 impostor Results shown are using three enrolment images and an acceptance threshold of 120. The SCORES are the match of the test against the 1 st, 2 nd and 3 rd enrolment images stored for the corresponding user. Scores marked in red are above an acceptance threshold of 120 and therefore would be rejected. IDENTIFICATION VERIFICATION GAR GRR FAR FRR FMBT* GAR FRR Threshold NORMAL NAIL LENGTH* EXTRA LONG NAILS SCORE 1 SCORE 2 SCORE 3 SCORE 1 SCORE 2 SCORE 3 TEST TEST USER A TEST TEST TEST TEST TEST USER B TEST TEST TEST *Images captured on the same day as the enrolment images
77 Time Lapse Results Probe images: 24 genuine, 0 impostor Results shown are using three enrolment images and an acceptance threshold of 120. The SCORES are the match of the test against the 1 st, 2 nd and 3 rd enrolment images stored for the corresponding user. Scores marked in red are above an acceptance threshold of 120 and therefore would be rejected. IDENTIFICATION VERIFICATION GAR GRR FAR FRR FMBT* GAR FRR Threshold SAME DAY IMAGES TIME LAPSE SCORE 1 SCORE 2 SCORE 3 SCORE 1 SCORE 2 SCORE 3 TEST TEST USER A TEST TEST TEST TEST TEST USER B TEST TEST TEST TEST USER C TEST TEST TEST TEST TEST USER D TEST TEST TEST TEST TEST USER E TEST TEST TEST
78 Spoofing Identity With Colour Printouts Results Probe images: 5 colour printouts Results shown are using three enrolment images and an acceptance threshold of 120. The SCORES are the match of the test against the 1 st, 2 nd and 3 rd enrolment images stored for the corresponding user. Scores marked in red are above an acceptance threshold of 120 and therefore would be rejected. TYPICAL SCORE OF A GENUINE SCAN SPOOF SCORE SCORE 1 SCORE 2 SCORE 3 SCORE 1 SCORE 2 SCORE 3 USER USER USER USER USER
79 APPENDIX E E.1. Code Snippets Figure E.1 The calculate landmarks algorithm, part of the FingerExtraction class


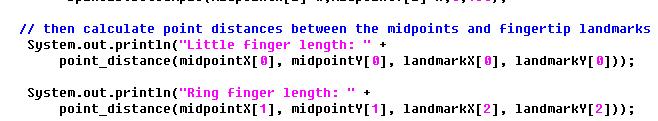
80 Figure E.2 The function to measure the finger lengths from all four fingers
81 Figure E.3 The function to measure the finger widths, part of the FingerExtraction class


82 Figure E.4 The function to extract the finger textures (image 1 of 6)
83 Figure E.4 (image 2 of 6)
.")
84 Figure E.4 (image 3 of 6)
.")
85 Figure E.4 (image 4 of 6)


86 Figure E.4 (image 5 of 6)


87 Figure E.4 (image 6 of 6)

88 E.2. Config. File Figure E.5 The configuration file. The settings in this file will alter system behaviour considerably


89 E.3. Screen Dumps Of The System Figure E.6 Assuming the configuration file is set for the scanner to be live, when the administrator clicks the login button their hand image is acquired from the scanner. If the scanner is switched off a stored image of the administrator is used to authenticate the login. This is only available as for the testing on the system and a real system would not have an offline option. Figure E.7 Once scanned, the hand image is compared to all of those stored in the database. If the match returned is that of Admin, then access is granted (Figure E.8)


90 Figure E.8 Admin logged in. To enrol a new user, first enter their username. If username blank, an error message is presented (Figure E.17) Figure E.9 If an image is stored in the photos\ directory the default photo is updated. Default is 3 scans for enrolment Figure E.10 If the scanner is live, the user is asked to ensure their hand is as flat as possible before scanning begins Figure E.11 The prototype can also work offline, and if scanner is off in config file the following message provides offline enrolment instructions Figure E.12 For each enrolment image, the captured image is displayed and the user is asked whether it looks suitable. If there is a problem extracting the features an error is presented (Figure E.18) and the current scan must be re-done in order to continue Figure E.13 Again, the user is asked to see if the image looks ok to enrol, but if feature extraction fails an error is presented (Figure E.18) and the user must re-scan this image to continue the enrolment process


91 Figure E.14 The final enrolment images (using the default settings). Again, the user must confirm the image looks ok to enrol, before feature extraction is attempted Figure E.15 Assuming the three images are close enough to each other (i.e. similar enough so to ensure consistency of the enrolment scans) then the user is enrolled on the system, otherwise the error in Figure E.16 is presented Figure E.16 The enrolment image attempted here is from a different user so the variation between it and the two images from Thomas is above the specified threshold. The user is asked whether they would like to start again Figure E.17 If nothing is entered in the username box when attempting to enrol a new user, the error message shown above is presented. Figure E.18 If there is a problem extracting the features the above message is presented, and the current scan must be re-captured Figure E.19 The following generic error is presented to catch any unexpected problems. For example where an image filename does not exist when attempting to enrol a user offline


92 Figure E.20 The IdentifyUser program is similar in appearance to the EnrolUser program. Only one option is provided though SCAN HAND Figure E.21 If the scanner is switched to OFF in the config file, the prototype can still work offline. If an image filename is entered in this prompt box the supplied image is identified against the enrolled users Figure E.22 If the filename entered does not exist the user is prompted and has the option to re-enter. Figure E.23 This is an example of entering an image that does exist, but the image is of a user who is not enrolled on the system Figure E.24 The system responds appropriately, providing a message alerting that the user is not found access denied. The message asks the user to re-try - re-positioning their hand in case of false rejection Figure E.25 The filename entered here is a probe image of an enrolled user. N.B. if the scanner was set to ON in the config file this box would not appear - the program would simply acquire an image from the scanner


93 Figure E.26 The program correctly identifies the image and therefore updates the default photo to that of the user ( Sarah ), and also lights up an image saying access granted Figure E.27 Again the filename entered corresponds to a probe image of an enrolled user. Figure E.28 The system again correctly identifies the user and updates the photo and access granted is presented. The image shown right is that of the command prompt which is open in the background. The scores of the probe image against the enrolled images stored in the database are printed to the command line during the matching stage. The scores are also printed to a text file in the same directory as the image, with filename <imagename_score.txt>. Notice that the score produced for Paul Blakey is the lowest by far from the others enrolled in the database. The lowest score returned ( 24 ) is used as the matching score, which is below the default acceptance threshold of

94 APPENDIX F F.1. Hand Images Used In Texture Extraction Tests The following seven images were used in Conclusion section 6.4. USER C USER B USER A
.")

95 APPENDIX G G.1. Project Schedule A schedule was drawn up near the beginning of the project, detailing a proposed plan for time management. This was included in the mid-project report, and a copy is provided in section G.3. below (modified only in format not content). During development of the project the schedule was not followed strictly. Certain stages took longer than expected, whereas others did not take as long. For this reason, a revised schedule is provided in section G.4. with corrections made where necessary. G.2. Progress Log As recommended by the supervisor, a progress log was set-up very near the beginning of the project (using personal web-space). A news script was configured, allowing updates (including aims for subsequent meetings) to be posted to a dedicated website from any computer with internet-access. The online log also made demonstrating developments at the supervisor meetings much easier and it allowed the supervisor to monitor progress if a meeting could not be arranged for a particular week. The website can be found at:
Introduction to Biometrics 1
 Introduction to Biometrics 1 Gerik Alexander v.graevenitz von Graevenitz Biometrics, Bonn, Germany May, 14th 2004 Introduction to Biometrics Biometrics refers to the automatic identification of a living
Feature Extraction Technique Based On Circular Strip for Palmprint Recognition
 Feature Extraction Technique Based On Circular Strip for Palmprint Recognition Dr.S.Valarmathy 1, R.Karthiprakash 2, C.Poonkuzhali 3 1, 2, 3 ECE Department, Bannari Amman Institute of Technology, Sathyamangalam
Experiments with An Improved Iris Segmentation Algorithm
 Experiments with An Improved Iris Segmentation Algorithm Xiaomei Liu, Kevin W. Bowyer, Patrick J. Flynn Department of Computer Science and Engineering University of Notre Dame Notre Dame, IN 46556, U.S.A.
Proposed Method for Off-line Signature Recognition and Verification using Neural Network
 e-issn: 2349-9745 p-issn: 2393-8161 Scientific Journal Impact Factor (SJIF): 1.711 International Journal of Modern Trends in Engineering and Research www.ijmter.com Proposed Method for Off-line Signature
Biometrics 2/23/17. the last category for authentication methods is. this is the realm of biometrics
 CSC362, Information Security the last category for authentication methods is Something I am or do, which means some physical or behavioral characteristic that uniquely identifies the user and can be used
Vein and Fingerprint Identification Multi Biometric System: A Novel Approach
 Vein and Fingerprint Identification Multi Biometric System: A Novel Approach Hatim A. Aboalsamh Abstract In this paper, a compact system that consists of a Biometrics technology CMOS fingerprint sensor
International Journal of Scientific & Engineering Research, Volume 7, Issue 12, December ISSN IJSER
 International Journal of Scientific & Engineering Research, Volume 7, Issue 12, December-2016 192 A Novel Approach For Face Liveness Detection To Avoid Face Spoofing Attacks Meenakshi Research Scholar,
ENHANCHED PALM PRINT IMAGES FOR PERSONAL ACCURATE IDENTIFICATION
 ENHANCHED PALM PRINT IMAGES FOR PERSONAL ACCURATE IDENTIFICATION Prof. Rahul Sathawane 1, Aishwarya Shende 2, Pooja Tete 3, Naina Chandravanshi 4, Nisha Surjuse 5 1 Prof. Rahul Sathawane, Information Technology,
INTERNATIONAL RESEARCH JOURNAL IN ADVANCED ENGINEERING AND TECHNOLOGY (IRJAET)
") INTERNATIONAL RESEARCH JOURNAL IN ADVANCED ENGINEERING AND TECHNOLOGY (IRJAET) www.irjaet.com ISSN (PRINT) : 2454-4744 ISSN (ONLINE): 2454-4752 Vol. 1, Issue 4, pp.240-245, November, 2015 IRIS RECOGNITION
INTERNATIONAL RESEARCH JOURNAL IN ADVANCED ENGINEERING AND TECHNOLOGY (IRJAET) www.irjaet.com ISSN (PRINT) : 2454-4744 ISSN (ONLINE): 2454-4752 Vol. 1, Issue 4, pp.240-245, November, 2015 IRIS RECOGNITION
Biometric Recognition: How Do I Know Who You Are?
 Biometric Recognition: How Do I Know Who You Are? Anil K. Jain Department of Computer Science and Engineering, 3115 Engineering Building, Michigan State University, East Lansing, MI 48824, USA jain@cse.msu.edu
Biometrics - A Tool in Fraud Prevention
 Biometrics - A Tool in Fraud Prevention Agenda Authentication Biometrics : Need, Available Technologies, Working, Comparison Fingerprint Technology About Enrollment, Matching and Verification Key Concepts
Chapter 6. [6]Preprocessing
![Chapter 6. [6]Preprocessing](/thumbs/88/115179409.jpg "Chapter 6. [6]Preprocessing") Chapter 6 [6]Preprocessing As mentioned in chapter 4, the first stage in the HCR pipeline is preprocessing of the image. We have seen in earlier chapters why this is very important and at the same time
Chapter 6 [6]Preprocessing As mentioned in chapter 4, the first stage in the HCR pipeline is preprocessing of the image. We have seen in earlier chapters why this is very important and at the same time
BIOMETRICS BY- VARTIKA PAUL 4IT55
 BIOMETRICS BY- VARTIKA PAUL 4IT55 BIOMETRICS Definition Biometrics is the identification or verification of human identity through the measurement of repeatable physiological and behavioral characteristics
Image Filtering. Median Filtering
 Image Filtering Image filtering is used to: Remove noise Sharpen contrast Highlight contours Detect edges Other uses? Image filters can be classified as linear or nonlinear. Linear filters are also know
License Plate Localisation based on Morphological Operations
 License Plate Localisation based on Morphological Operations Xiaojun Zhai, Faycal Benssali and Soodamani Ramalingam School of Engineering & Technology University of Hertfordshire, UH Hatfield, UK Abstract
Iris Segmentation & Recognition in Unconstrained Environment
 www.ijecs.in International Journal Of Engineering And Computer Science ISSN:2319-7242 Volume - 3 Issue -8 August, 2014 Page No. 7514-7518 Iris Segmentation & Recognition in Unconstrained Environment ABSTRACT
Impulse noise features for automatic selection of noise cleaning filter
 Impulse noise features for automatic selection of noise cleaning filter Odej Kao Department of Computer Science Technical University of Clausthal Julius-Albert-Strasse 37 Clausthal-Zellerfeld, Germany
Iris Recognition-based Security System with Canny Filter
 Canny Filter Dr. Computer Engineering Department, University of Technology, Baghdad-Iraq E-mail: hjhh2007@yahoo.com Received: 8/9/2014 Accepted: 21/1/2015 Abstract Image identification plays a great role
IRIS Biometric for Person Identification. By Lakshmi Supriya.D M.Tech 04IT6002 Dept. of Information Technology
 IRIS Biometric for Person Identification By Lakshmi Supriya.D M.Tech 04IT6002 Dept. of Information Technology What are Biometrics? Why are Biometrics used? How Biometrics is today? Iris Iris is the area
Biometrics and Fingerprint Authentication Technical White Paper
 Biometrics and Fingerprint Authentication Technical White Paper Fidelica Microsystems, Inc. 423 Dixon Landing Road Milpitas, CA 95035 1 INTRODUCTION Biometrics, the science of applying unique physical
Feature Extraction Techniques for Dorsal Hand Vein Pattern
 Feature Extraction Techniques for Dorsal Hand Vein Pattern Pooja Ramsoful, Maleika Heenaye-Mamode Khan Department of Computer Science and Engineering University of Mauritius Mauritius pooja.ramsoful@umail.uom.ac.mu,
EFFICIENT ATTENDANCE MANAGEMENT SYSTEM USING FACE DETECTION AND RECOGNITION
 EFFICIENT ATTENDANCE MANAGEMENT SYSTEM USING FACE DETECTION AND RECOGNITION 1 Arun.A.V, 2 Bhatath.S, 3 Chethan.N, 4 Manmohan.C.M, 5 Hamsaveni M 1,2,3,4,5 Department of Computer Science and Engineering,
Second Symposium & Workshop on ICAO-Standard MRTDs, Biometrics and Security
 Second Symposium & Workshop on ICAO-Standard MRTDs, Biometrics and Security Face Biometric Capture & Applications Terry Hartmann Director and Global Solution Lead Secure Identification & Biometrics UNISYS
CS534 Introduction to Computer Vision. Linear Filters. Ahmed Elgammal Dept. of Computer Science Rutgers University
 CS534 Introduction to Computer Vision Linear Filters Ahmed Elgammal Dept. of Computer Science Rutgers University Outlines What are Filters Linear Filters Convolution operation Properties of Linear Filters
Auto-tagging The Facebook
 Auto-tagging The Facebook Jonathan Michelson and Jorge Ortiz Stanford University 2006 E-mail: JonMich@Stanford.edu, jorge.ortiz@stanford.com Introduction For those not familiar, The Facebook is an extremely
A Novel Algorithm for Hand Vein Recognition Based on Wavelet Decomposition and Mean Absolute Deviation
 Sensors & Transducers, Vol. 6, Issue 2, December 203, pp. 53-58 Sensors & Transducers 203 by IFSA http://www.sensorsportal.com A Novel Algorithm for Hand Vein Recognition Based on Wavelet Decomposition
User Awareness of Biometrics
 Advances in Networks, Computing and Communications 4 User Awareness of Biometrics B.J.Edmonds and S.M.Furnell Network Research Group, University of Plymouth, Plymouth, United Kingdom e-mail: info@network-research-group.org
Real-Time Face Detection and Tracking for High Resolution Smart Camera System
 Digital Image Computing Techniques and Applications Real-Time Face Detection and Tracking for High Resolution Smart Camera System Y. M. Mustafah a,b, T. Shan a, A. W. Azman a,b, A. Bigdeli a, B. C. Lovell
Published by: PIONEER RESEARCH & DEVELOPMENT GROUP (www.prdg.org) 1
 1") IJREAT International Journal of Research in Engineering & Advanced Technology, Volume 2, Issue 2, Apr- Generating an Iris Code Using Iris Recognition for Biometric Application S.Banurekha 1, V.Manisha
IJREAT International Journal of Research in Engineering & Advanced Technology, Volume 2, Issue 2, Apr- Generating an Iris Code Using Iris Recognition for Biometric Application S.Banurekha 1, V.Manisha
A Kinect-based 3D hand-gesture interface for 3D databases
 A Kinect-based 3D hand-gesture interface for 3D databases Abstract. The use of natural interfaces improves significantly aspects related to human-computer interaction and consequently the productivity
IMPORTANT: PLEASE DO NOT USE THIS DOCUMENT WITHOUT READING THIS PAGE
 IMPORTANT: PLEASE DO NOT USE THIS DOCUMENT WITHOUT READING THIS PAGE This document is designed to be a template for a document you can provide to your employees who will be using TimeIPS in your business
COMPARATIVE PERFORMANCE ANALYSIS OF HAND GESTURE RECOGNITION TECHNIQUES
 International Journal of Advanced Research in Engineering and Technology (IJARET) Volume 9, Issue 3, May - June 2018, pp. 177 185, Article ID: IJARET_09_03_023 Available online at http://www.iaeme.com/ijaret/issues.asp?jtype=ijaret&vtype=9&itype=3
3D Face Recognition in Biometrics
 3D Face Recognition in Biometrics CHAO LI, ARMANDO BARRETO Electrical & Computer Engineering Department Florida International University 10555 West Flagler ST. EAS 3970 33174 USA {cli007, barretoa}@fiu.edu
A Proposal for Security Oversight at Automated Teller Machine System
 International Journal of Engineering Research and Development e-issn: 2278-067X, p-issn: 2278-800X, www.ijerd.com Volume 10, Issue 6 (June 2014), PP.18-25 A Proposal for Security Oversight at Automated
4/9/2015. Simple Graphics and Image Processing. Simple Graphics. Overview of Turtle Graphics (continued) Overview of Turtle Graphics
 Overview of Turtle Graphics") Simple Graphics and Image Processing The Plan For Today Website Updates Intro to Python Quiz Corrections Missing Assignments Graphics and Images Simple Graphics Turtle Graphics Image Processing Assignment
Simple Graphics and Image Processing The Plan For Today Website Updates Intro to Python Quiz Corrections Missing Assignments Graphics and Images Simple Graphics Turtle Graphics Image Processing Assignment
Design of Temporally Dithered Codes for Increased Depth of Field in Structured Light Systems
 Design of Temporally Dithered Codes for Increased Depth of Field in Structured Light Systems Ricardo R. Garcia University of California, Berkeley Berkeley, CA rrgarcia@eecs.berkeley.edu Abstract In recent
Haptic presentation of 3D objects in virtual reality for the visually disabled
 Haptic presentation of 3D objects in virtual reality for the visually disabled M Moranski, A Materka Institute of Electronics, Technical University of Lodz, Wolczanska 211/215, Lodz, POLAND marcin.moranski@p.lodz.pl,
Lane Detection in Automotive
 Lane Detection in Automotive Contents Introduction... 2 Image Processing... 2 Reading an image... 3 RGB to Gray... 3 Mean and Gaussian filtering... 5 Defining our Region of Interest... 6 BirdsEyeView Transformation...
About user acceptance in hand, face and signature biometric systems
 About user acceptance in hand, face and signature biometric systems Aythami Morales, Miguel A. Ferrer, Carlos M. Travieso, Jesús B. Alonso Instituto Universitario para el Desarrollo Tecnológico y la Innovación
On-Line, Low-Cost and Pc-Based Fingerprint Verification System Based on Solid- State Capacitance Sensor
 On-Line, Low-Cost and Pc-Based Fingerprint Verification System Based on Solid- State Capacitance Sensor Mohamed. K. Shahin *, Ahmed. M. Badawi **, and Mohamed. S. Kamel ** *B.Sc. Design Engineer at International
Automatic Licenses Plate Recognition System
 Automatic Licenses Plate Recognition System Garima R. Yadav Dept. of Electronics & Comm. Engineering Marathwada Institute of Technology, Aurangabad (Maharashtra), India yadavgarima08@gmail.com Prof. H.K.
Tools for Iris Recognition Engines. Martin George CEO Smart Sensors Limited (UK)
") Tools for Iris Recognition Engines Martin George CEO Smart Sensors Limited (UK) About Smart Sensors Limited Owns and develops Intellectual Property for image recognition, identification and analytics applications
Tools for Iris Recognition Engines Martin George CEO Smart Sensors Limited (UK) About Smart Sensors Limited Owns and develops Intellectual Property for image recognition, identification and analytics applications
8.2 IMAGE PROCESSING VERSUS IMAGE ANALYSIS Image processing: The collection of routines and
 8.1 INTRODUCTION In this chapter, we will study and discuss some fundamental techniques for image processing and image analysis, with a few examples of routines developed for certain purposes. 8.2 IMAGE
Automation of Fingerprint Recognition Using OCT Fingerprint Images
 Journal of Signal and Information Processing, 2012, 3, 117-121 http://dx.doi.org/10.4236/jsip.2012.31015 Published Online February 2012 (http://www.scirp.org/journal/jsip) 117 Automation of Fingerprint
An Efficient Color Image Segmentation using Edge Detection and Thresholding Methods
 19 An Efficient Color Image Segmentation using Edge Detection and Thresholding Methods T.Arunachalam* Post Graduate Student, P.G. Dept. of Computer Science, Govt Arts College, Melur - 625 106 Email-Arunac682@gmail.com
A New Fake Iris Detection Method
 A New Fake Iris Detection Method Xiaofu He 1, Yue Lu 1, and Pengfei Shi 2 1 Department of Computer Science and Technology, East China Normal University, Shanghai 200241, China {xfhe,ylu}@cs.ecnu.edu.cn
FACE VERIFICATION SYSTEM IN MOBILE DEVICES BY USING COGNITIVE SERVICES
 International Journal of Intelligent Systems and Applications in Engineering Advanced Technology and Science ISSN:2147-67992147-6799 www.atscience.org/ijisae Original Research Paper FACE VERIFICATION SYSTEM
Title Goes Here Algorithms for Biometric Authentication
 Title Goes Here Algorithms for Biometric Authentication February 2003 Vijayakumar Bhagavatula 1 Outline Motivation Challenges Technology: Correlation filters Example results Summary 2 Motivation Recognizing
Authenticated Automated Teller Machine Using Raspberry Pi
 Authenticated Automated Teller Machine Using Raspberry Pi 1 P. Jegadeeshwari, 2 K.M. Haripriya, 3 P. Kalpana, 4 K. Santhini Department of Electronics and Communication, C K college of Engineering and Technology.
Images and Graphics. 4. Images and Graphics - Copyright Denis Hamelin - Ryerson University
 Images and Graphics Images and Graphics Graphics and images are non-textual information that can be displayed and printed. Graphics (vector graphics) are an assemblage of lines, curves or circles with
An Efficient Approach for Iris Recognition by Improving Iris Segmentation and Iris Image Compression
 An Efficient Approach for Iris Recognition by Improving Iris Segmentation and Iris Image Compression K. N. Jariwala, SVNIT, Surat, India U. D. Dalal, SVNIT, Surat, India Abstract The biometric person authentication
Automatic Locking Door Using Face Recognition
 Automatic Locking Door Using Face Recognition Electronics Department, Mumbai University SomaiyaAyurvihar Complex, Eastern Express Highway, Near Everard Nagar, Sion East, Mumbai, Maharashtra,India. ABSTRACT
ZKTECO COLLEGE- FUNDAMENTAL OF FINGER VEIN RECOGNITION
 ZKTECO COLLEGE- FUNDAMENTAL OF FINGER VEIN RECOGNITION What are Finger Veins? Veins are blood vessels which present throughout the body as tubes that carry blood back to the heart. As its name implies,
Student Attendance Monitoring System Via Face Detection and Recognition System
 IJSTE - International Journal of Science Technology & Engineering Volume 2 Issue 11 May 2016 ISSN (online): 2349-784X Student Attendance Monitoring System Via Face Detection and Recognition System Pinal
ROBOT VISION. Dr.M.Madhavi, MED, MVSREC
 ROBOT VISION Dr.M.Madhavi, MED, MVSREC Robotic vision may be defined as the process of acquiring and extracting information from images of 3-D world. Robotic vision is primarily targeted at manipulation
IRIS Recognition Using Cumulative Sum Based Change Analysis
 IRIS Recognition Using Cumulative Sum Based Change Analysis L.Hari.Hara.Brahma Kuppam Engineering College, Chittoor. Dr. G.N.Kodanda Ramaiah Head of Department, Kuppam Engineering College, Chittoor. Dr.M.N.Giri
Exercise questions for Machine vision
 Exercise questions for Machine vision This is a collection of exercise questions. These questions are all examination alike which means that similar questions may appear at the written exam. I ve divided
Lane Detection in Automotive
 Lane Detection in Automotive Contents Introduction... 2 Image Processing... 2 Reading an image... 3 RGB to Gray... 3 Mean and Gaussian filtering... 6 Defining our Region of Interest... 10 BirdsEyeView
IMAGE ENHANCEMENT. Quality portraits for identification documents.
 IMAGE ENHANCEMENT Quality portraits for identification documents www.muehlbauer.de 1 MB Image Enhancement Library... 3 2 Solution Features... 4 3 Image Processing... 5 Requirements... 5 Automatic Processing...
Image Extraction using Image Mining Technique
 IOSR Journal of Engineering (IOSRJEN) e-issn: 2250-3021, p-issn: 2278-8719 Vol. 3, Issue 9 (September. 2013), V2 PP 36-42 Image Extraction using Image Mining Technique Prof. Samir Kumar Bandyopadhyay,
BIOMETRIC IDENTIFICATION USING 3D FACE SCANS
 BIOMETRIC IDENTIFICATION USING 3D FACE SCANS Chao Li Armando Barreto Craig Chin Jing Zhai Electrical and Computer Engineering Department Florida International University Miami, Florida, 33174, USA ABSTRACT
CHAPTER-4 FRUIT QUALITY GRADATION USING SHAPE, SIZE AND DEFECT ATTRIBUTES
 CHAPTER-4 FRUIT QUALITY GRADATION USING SHAPE, SIZE AND DEFECT ATTRIBUTES In addition to colour based estimation of apple quality, various models have been suggested to estimate external attribute based
TECHNICAL DOCUMENTATION
 TECHNICAL DOCUMENTATION NEED HELP? Call us on +44 (0) 121 231 3215 TABLE OF CONTENTS Document Control and Authority...3 Introduction...4 Camera Image Creation Pipeline...5 Photo Metadata...6 Sensor Identification
Evaluating Commercial Scanners for Astronomical Images. The underlying technology of the scanners: Pixel sizes:
 Evaluating Commercial Scanners for Astronomical Images Robert J. Simcoe Associate Harvard College Observatory rjsimcoe@cfa.harvard.edu Introduction: Many organizations have expressed interest in using
Iris Recognition using Histogram Analysis
 Iris Recognition using Histogram Analysis Robert W. Ives, Anthony J. Guidry and Delores M. Etter Electrical Engineering Department, U.S. Naval Academy Annapolis, MD 21402-5025 Abstract- Iris recognition
A Proficient Matching For Iris Segmentation and Recognition Using Filtering Technique
 A Proficient Matching For Iris Segmentation and Recognition Using Filtering Technique Ms. Priti V. Dable 1, Prof. P.R. Lakhe 2, Mr. S.S. Kemekar 3 Ms. Priti V. Dable 1 (PG Scholar) Comm (Electronics) S.D.C.E.
An Evaluation of Automatic License Plate Recognition Vikas Kotagyale, Prof.S.D.Joshi
 An Evaluation of Automatic License Plate Recognition Vikas Kotagyale, Prof.S.D.Joshi Department of E&TC Engineering,PVPIT,Bavdhan,Pune ABSTRACT: In the last decades vehicle license plate recognition systems
Palm Vein Recognition System using Directional Coding and Back-propagation Neural Network
 , October 21-23, 2015, San Francisco, USA Palm Vein Recognition System using Directional Coding and Back-propagation Neural Network Mark Erwin C. Villariña and Noel B. Linsangan, Member, IAENG Abstract
Image Capture TOTALLAB
 1 Introduction In order for image analysis to be performed on a gel or Western blot, it must first be converted into digital data. Good image capture is critical to guarantee optimal performance of automated
The total manufacturing cost is estimated to be around INR. 12
 Intelligent Integrated Home Security System Using Raspberry Pi Pallavi Mitra Department of Electronics and Communication Engineering,National Institute of Technology,Durgapur E-mail: pallavi08091992@gmail.com
FACE RECOGNITION BY PIXEL INTENSITY
 FACE RECOGNITION BY PIXEL INTENSITY Preksha jain & Rishi gupta Computer Science & Engg. Semester-7 th All Saints College Of Technology, Gandhinagar Bhopal. Email Id-Priky0889@yahoo.com Abstract Face Recognition
Fingerprint Image Quality Parameters
 Fingerprint Image Quality Parameters Muskan Sahi #1, Kapil Arora #2 12 Department of Electronics and Communication 12 RPIIT, Bastara Haryana, India Abstract The quality of fingerprint image determines
Recognition System for Pakistani Paper Currency
 World Applied Sciences Journal 28 (12): 2069-2075, 2013 ISSN 1818-4952 IDOSI Publications, 2013 DOI: 10.5829/idosi.wasj.2013.28.12.300 Recognition System for Pakistani Paper Currency 1 2 Ahmed Ali and
Biometrics for Public Sector Applications
 Technical Guideline TR-03121-3 Biometrics for Public Sector Applications Part 3: Application Profiles and Function Modules Volume 2: Enrolment Scenarios for Identity Documents Version 4.2 P.O. Box 20 03
Live Hand Gesture Recognition using an Android Device
 Live Hand Gesture Recognition using an Android Device Mr. Yogesh B. Dongare Department of Computer Engineering. G.H.Raisoni College of Engineering and Management, Ahmednagar. Email- yogesh.dongare05@gmail.com
APPLICATION OF COMPUTER VISION FOR DETERMINATION OF SYMMETRICAL OBJECT POSITION IN THREE DIMENSIONAL SPACE
 APPLICATION OF COMPUTER VISION FOR DETERMINATION OF SYMMETRICAL OBJECT POSITION IN THREE DIMENSIONAL SPACE Najirah Umar 1 1 Jurusan Teknik Informatika, STMIK Handayani Makassar Email : najirah_stmikh@yahoo.com
Impact of Resolution and Blur on Iris Identification
 100 101 102 103 104 105 106 107 108 109 110 111 112 113 114 115 116 117 118 119 120 121 122 123 124 125 126 127 128 129 130 131 132 133 134 135 136 137 138 139 140 141 142 143 144 145 146 147 148 149 Abstract
An Improved Bernsen Algorithm Approaches For License Plate Recognition
 IOSR Journal of Electronics and Communication Engineering (IOSR-JECE) ISSN: 78-834, ISBN: 78-8735. Volume 3, Issue 4 (Sep-Oct. 01), PP 01-05 An Improved Bernsen Algorithm Approaches For License Plate Recognition
3D Face Recognition System in Time Critical Security Applications
 Middle-East Journal of Scientific Research 25 (7): 1619-1623, 2017 ISSN 1990-9233 IDOSI Publications, 2017 DOI: 10.5829/idosi.mejsr.2017.1619.1623 3D Face Recognition System in Time Critical Security Applications
Applying mathematics to digital image processing using a spreadsheet
 Jeff Waldock Applying mathematics to digital image processing using a spreadsheet Jeff Waldock Department of Engineering and Mathematics Sheffield Hallam University j.waldock@shu.ac.uk Introduction When
Image Processing : Introduction
 Image Processing : Introduction What is an Image? An image is a picture stored in electronic form. An image map is a file containing information that associates different location on a specified image.
The Elegance of Line Scan Technology for AOI
 By Mike Riddle, AOI Product Manager ASC International More is better? There seems to be a trend in the AOI market: more is better. On the surface this trend seems logical, because how can just one single
On spatial resolution
 On spatial resolution Introduction How is spatial resolution defined? There are two main approaches in defining local spatial resolution. One method follows distinction criteria of pointlike objects (i.e.
Laboratory 1: Uncertainty Analysis
 University of Alabama Department of Physics and Astronomy PH101 / LeClair May 26, 2014 Laboratory 1: Uncertainty Analysis Hypothesis: A statistical analysis including both mean and standard deviation can
Biometric Recognition Techniques
 Biometric Recognition Techniques Anjana Doshi 1, Manisha Nirgude 2 ME Student, Computer Science and Engineering, Walchand Institute of Technology Solapur, India 1 Asst. Professor, Information Technology,
MINUTIAE MANIPULATION FOR BIOMETRIC ATTACKS Simulating the Effects of Scarring and Skin Grafting April 2014 novetta.com Copyright 2015, Novetta, LLC.
 MINUTIAE MANIPULATION FOR BIOMETRIC ATTACKS Simulating the Effects of Scarring and Skin Grafting April 2014 novetta.com Copyright 2015, Novetta, LLC. Minutiae Manipulation for Biometric Attacks 1 INTRODUCTION
Image Optimization for Print and Web
 There are two distinct types of computer graphics: vector images and raster images. Vector Images Vector images are graphics that are rendered through a series of mathematical equations. These graphics
Sri Shakthi Institute of Engg and Technology, Coimbatore, TN, India.
 Intelligent Forms Processing System Tharani B 1, Ramalakshmi. R 2, Pavithra. S 3, Reka. V. S 4, Sivaranjani. J 5 1 Assistant Professor, 2,3,4,5 UG Students, Dept. of ECE Sri Shakthi Institute of Engg and
Operating Procedures for MICROCT1 Nikon XTH 225 ST
 Operating Procedures for MICROCT1 Nikon XTH 225 ST Ensuring System is Ready (go through to ensure all windows and tasks below have been completed either by you or someone else prior to mounting and scanning
An Algorithm for Fingerprint Image Postprocessing
 An Algorithm for Fingerprint Image Postprocessing Marius Tico, Pauli Kuosmanen Tampere University of Technology Digital Media Institute EO.BOX 553, FIN-33101, Tampere, FINLAND tico@cs.tut.fi Abstract Most
A Study of Slanted-Edge MTF Stability and Repeatability
 A Study of Slanted-Edge MTF Stability and Repeatability Jackson K.M. Roland Imatest LLC, 2995 Wilderness Place Suite 103, Boulder, CO, USA ABSTRACT The slanted-edge method of measuring the spatial frequency
AGRICULTURE, LIVESTOCK and FISHERIES
 Research in ISSN : P-2409-0603, E-2409-9325 AGRICULTURE, LIVESTOCK and FISHERIES An Open Access Peer Reviewed Journal Open Access Research Article Res. Agric. Livest. Fish. Vol. 2, No. 2, August 2015:
CSI: Rombalds Moor Photogrammetry Photography
 Photogrammetry Photography Photogrammetry Training 26 th March 10:00 Welcome Presentation image capture Practice 12:30 13:15 Lunch More practice 16:00 (ish) Finish or earlier What is photogrammetry 'photo'
Colour Profiling Using Multiple Colour Spaces
 Colour Profiling Using Multiple Colour Spaces Nicola Duffy and Gerard Lacey Computer Vision and Robotics Group, Trinity College, Dublin.Ireland duffynn@cs.tcd.ie Abstract This paper presents an original
Malaysian Car Number Plate Detection System Based on Template Matching and Colour Information
 Malaysian Car Number Plate Detection System Based on Template Matching and Colour Information Mohd Firdaus Zakaria, Shahrel A. Suandi Intelligent Biometric Group, School of Electrical and Electronics Engineering,
Using the Advanced Sharpen Transformation
 Using the Advanced Sharpen Transformation Written by Jonathan Sachs Revised 10 Aug 2014 Copyright 2002-2014 Digital Light & Color Introduction Picture Window Pro s Advanced Sharpen transformation is a
Study and Analysis of various preprocessing approaches to enhance Offline Handwritten Gujarati Numerals for feature extraction
 International Journal of Scientific and Research Publications, Volume 4, Issue 7, July 2014 1 Study and Analysis of various preprocessing approaches to enhance Offline Handwritten Gujarati Numerals for
DESIGN & DEVELOPMENT OF COLOR MATCHING ALGORITHM FOR IMAGE RETRIEVAL USING HISTOGRAM AND SEGMENTATION TECHNIQUES
 International Journal of Information Technology and Knowledge Management July-December 2011, Volume 4, No. 2, pp. 585-589 DESIGN & DEVELOPMENT OF COLOR MATCHING ALGORITHM FOR IMAGE RETRIEVAL USING HISTOGRAM
Near Infrared Face Image Quality Assessment System of Video Sequences
 2011 Sixth International Conference on Image and Graphics Near Infrared Face Image Quality Assessment System of Video Sequences Jianfeng Long College of Electrical and Information Engineering Hunan University
White Paper High Dynamic Range Imaging
 WPE-2015XI30-00 for Machine Vision What is Dynamic Range? Dynamic Range is the term used to describe the difference between the brightest part of a scene and the darkest part of a scene at a given moment