Fretting tests on connector terminals
|
|
|
- Ann Ross
- 5 years ago
- Views:
Transcription

1 Fretting tests on connector terminals Marcus Magnusson Spring 2018 Master s Thesis in Mechanical Engineering Faculty of Engineering, LTH Department of Electrical and Information Technology Supervisors: Anders Karlsson, LTH. Mikael Lapinlampi & Thomas Termander, Volvo Cars Examiner: Mats Gustafsson
2 Fretting tests on connector terminals Copyright 2018 Published by Department of Electrical and Information Technology Faculty of Engineering LTH, Lund University P.O. Box 118 SE Lund, Sweden Supervisor: Anders Karlsson Examiner: Mats Gustafsson
3 Abstract Fretting is a complex set of mechanical and electrical mechanics that occurs at the contact surface between two vibrating objects. It is widely present in electrical connectors close to combustion engines due to the constant exposure to vibrations. Fretting is an extensive problem in the automotive industry but little research is done. In this thesis, a connector attached to a high pressure fuel pump that is present in several cars made by Volvo Car Corporation is analysed. The goal is to investigate the design properties of the connector and evaluate if laser vibrometry is a valid method for connector vibration measurement. Fretting has previously been observed to correlate with the relative displacement between the male and female connector terminals. Accelerometers are widely used to measure acceleration and displacement of various components of the engine, but to measure directly on the terminals inside the connector is impossible. To instead use lasers to measure the relative displacement could prove to be an effective way of predicting fretting damage. The connector is analysed in a vibration laboratory where it and the pump it is connected to is mounted to a fixture. This way the vibration schedule can be designed and controlled with accuracy. To have a frame of reference when designing and analysing the results of this test, a real engine vibration test is first analysed. In this test, the connector is attached to the engine in the same way as in production cars. The engine is then run from idle to full throttle and the vibrations in the connector is measured. It is found that the measurement of the terminal relative displacement is much more accurate when using lasers instead of accelerometers. The result of using the accelerometer showed a misleading result. The relative displacement was up to five times higher and three times lower than the true displacement, measured with the lasers. A method to predict fretting damage can be developed using laser vibrometry. The thesis also present suggestions on details in the connectors that are beneficial from a fretting point of view. Keywords: Fretting, Corrosion, Laser vibrometry, Connector, Vibration
4 Preface This is a master thesis work made at Volvo Car Corporation, division of Electrical Distribution Systems. The work started in January 2018 and continued for six months and covered 30 ECTS. It is my final academic work before receiving the degree of M.Sc. in Mechanical Engineering. Acknowledgements Several professionals have helped and guided me through this work. I would like to take the opportunity to express extra great gratitude towards Mikael Lapinlampi, Thomas Termander and Håkan Ringius for their expertise and continuous support in the area of fretting. I would also like to thank Rosalie Olsson for her mentorship during this thesis work at Volvo Car Corporation. At Faculty of Engineering, LTH, I would like to thank Anders Karlsson and Mats Gustafsson with their help in the examination process.
5 Table of contents 1. Introduction Background Problem Previous work Purpose Delimitations Disposition Theory Fretting wear Fretting corrosion Fuel pump and connectors HPFP Sumitomo Yazaki Laser vibrometry, PDV Natural frequencies Engine orders and waterfall diagrams Signal analysis Sine sweep Fast Fourier Transform (FFT) Methodology Engine vibration test Setup Results Analysis Discussion Connector vibration test Measuring with lasers Equipment Calibration of equipment Tests Z-direction, X-direction, Y-direction and engine vibration test comparison Female terminals and female outer casing Female terminals and female inner casing... 28
6 5.4.4 Female terminals and male terminals Male terminals and male casing Different stiffness Different weight Removing parts of the HPFP Test for constant frequency Discussion Summary Future work References... 48
7 Abbreviations HPFP High Pressure Fuel Pump PSR Partial Slip Regime MSR Mixed Slip Regime GSR Gross Slip Regime FFT Fast Fourier Transform VEP4 Volvo Engine Petrol, 4 cylinders RPM Revolutions Per Minute
8 1. Introduction Volvo Car Corporation, also known as Volvo Cars, is a Swedish car manufacturer with its headquarters in Torslanda, Gothenburg. The company employs around people and sells about half a million cars annually. Volvo Cars was founded as a part of Volvo Group in 1927 and remained in the group until 1999, when it was bought by Ford Motor Company. Today Volvo Cars is owned by the Chinese company, Zhejiang Geely Holding Group [1]. Volvo Cars brand strategy is Designed Around You. In other words, to be able to offer personal luxury together with safety and reliability. In order to reach their goals even the smallest of components needs to be taken into consideration. 1.1 Background As the automotive industry produces better and more complex cars with a wider utilization of electronic systems and sensors, more cables and connectors are required. The use ranges from windshield heating to fundamentally important control and safety systems. The competition in the automotive industry is tough, forcing subcontractors to cut costs where possible. Small and invisible components such as a connector often fall victim. The problem might not be obvious at first, but in the long term the effects can be very expensive for both the customer and the producer. J. Swingler and J. W. McBride [2] estimate that 30-60% of all electrical failures are attributed to connector problems. The terminals in connectors exposed to vibration suffer from a collection of phenomena generally referred to as fretting. Fretting is a complex problem involving material science, contact mechanics, fatigue mechanics, tribology and corrosion science [3]. These phenomena cause wear and corrosion between the two contact surfaces. Low amplitude vibrations cause the contact surfaces of the terminals to slide against one another. This wears the coating metal down, exposing the base metal to oxidation. As the base metal oxidizes, a layer of hard, nonconductive material builds up between the contact surfaces. While the amplitude of slip is low enough, there is a risk that the oxidized material is not scraped off and the result could become a failed connector. Fretting is further explained in section 2.1. For most connectors the base metal is copper [4]. The coating metal can differ depending on quality and application. For coating metal, noble metals such as silver and gold have a higher resistance to fretting compared to, e.g. tin and nickel [5][6]. The noble metals are more expensive often forcing subcontractors to choose the ignoble metals as these are cheaper and most often have acceptable performance. 1.2 Problem The occurrence of fretting damage is hard to predict. To achieve a reliable product, the company needs to be able to handle the problem in a better way than it is currently handled. There are solutions to the problem, such as using a connector with more durable terminals. The increase in cost for the connector often prevents this simple solution [7]. A method for evaluating the risk of fretting in their current connectors needs to be developed. 1
9 1.3 Previous work 2012, Song, et al. [8] describes the problem of fretting in connectors in their article. They compare different coating metals on a base of copper. They show that the noble metals, e.g. gold and silver, perform better than the ignoble metals, e.g. nickel and tin. 2016, Thunell [18] compiled and compared several fretting tests done at Volvo Cars. The tests were on two different connectors with test lengths from 4 to 1000 hours. These two connectors, made by Yazaki and Sumitomo, are the same connectors being analysed in this thesis. He concludes that the Yazaki connector is a lot more resilient to fretting than the Sumitomo connector. See appendix 2 for results. 2017, Xing & Xu [9] worked with fretting in their master s thesis at Volvo Cars, testing fretting damages on a connector attached to a high pressure fuel pump (HPFP). Their thesis aimed to conclude what type of analysis method is best suited to predict the risk of fretting damages in the connector. It also aimed to find relations between the engine RPM and fretting damages in the connector. Their work found that the eigenfrequencies of both the engine and connector have a large impact on fretting. They showed that relative displacement of the male and female terminals was highest at the eigenfrequencies of the HPFP. Also that terminal relative displacement is a main contributor to fretting damage. 2006, Park, et al. [10] review and summarize previous work on fretting corrosion in electrical contacts. They summarize and list the most important parameters for fretting corrosion. Different testing methods are analysed and finally suggestions to methods to avoid fretting corrosion is made. They found that there are two main methods to follow. The first is to increase contact resistance by changing coating metal or applying lubricants. The second is to reduce terminal relative displacement between the contact surfaces by changing the design or environment. 1.4 Purpose The main goal for Volvo Cars is to be able to reduce the fretting damage to an acceptable level in any connector with a standardized procedure. In this thesis suggestions to steps in such a procedure is presented and evaluated. The aim is to present a conclusion on what type of measurement technique is best suited to analyse the relative displacement of the male and female connector terminals. Here are some of the key questions that are discussed and answered in the thesis: 1. How can the relative displacement between the terminals be measured effectively? 2. What determines dangerous properties of a connector? 3. What can be done to change a dangerous frequency and the displacement amplitude of that frequency? 4. Is the weight of an accelerometer a considerable parameter when glued to a connector? 2
10 1.5 Delimitations The same type of engine, high pressure fuel pump (HPFP), connectors and test rig as Xing and Xu [9] is used. That is the Yazaki connector with its corresponding HPFP. It is a standard connector for Volvo Cars and it has tin coated copper terminals. Xing and Xu s results and conclusions are important for this thesis work and other research projects on fretting damage at Volvo Cars. Fretting in the connectors cause it to lose electrical connection, which is the cause of the problems Volvo Cars has. Because of this, running the tests with an electric current running through the connector to make the tests as realistic as possible would be preferable. But as Xing & Xu [9] showed, the electric current has very little effect on the terminal relative displacement and the extra parameter would make the tests unnecessarily complicated. For this reason the electric current is skipped altogether. 1.6 Disposition The introduction, section 1, intends to give the reader an overview of the thesis and to get the reader interested in the area of fretting. The underlying background and previous work is presented, along with the purpose and aim of the work. Research questions the thesis hopes to answer and delimitations are also discussed. The theory, section 2, aims to present the necessary theories that are required to understand the problems discussed in this thesis. This includes information about fretting wear, fretting corrosion, engine orders eigenmodes and vibration test. The methodology, section 3, explains what is done in the thesis, step by step. Section 4 with engine vibration test presents the results, analysis and discussions of the engine vibration test that was performed at Volvo Cars. The results provide the acquired data from the vibration tests in a pedagogical way, with diagrams and tables. The analysis interprets compares and explains the results from the test. In what way the results relate to the theory section and possible sources of error is discussed. The discussion intends to question the validity of the analysed results and to motivate and explain why and how the results are useful/not useful. The connector vibration test, section 5, presents the results, analysis and discussion of the nine different connector vibration tests that were performed at Volvo Cars. Each subtest is presented with its own results and analysis. The discussion is presented at the end of the section covers all of the tests. The conclusion, section 6, is the last section and it aims to summarize what has been discovered in the tests. The key questions are answered and suggestions to future works are brought up. 3
![2. Theory 2.1 Fretting wear The phenomena of fretting is a cyclic wear of small amplitudes between two surfaces. The amplitude can vary between about 0.1 µm and 70 µm [11][12].](/docs-images/96/128229388/images/11-0.jpg "Over time, material will be removed from one or both surfaces. The grinded material will often get stuck between the surfaces and if the amplitude is very small it might not get scraped off.")
11 2. Theory 2.1 Fretting wear The phenomena of fretting is a cyclic wear of small amplitudes between two surfaces. The amplitude can vary between about 0.1 µm and 70 µm [11][12]. Over time, material will be removed from one or both surfaces. The grinded material will often get stuck between the surfaces and if the amplitude is very small it might not get scraped off. There are two main fretting conditions, defined by S.Hannel, et al [11]: The partial slip regime (PSR) and gross slip regime (GSR), both illustrated in figure 1 below. PSR occurs at lower amplitudes than GSR and is recognized by a combination of slide and stick fretting loop between the surfaces. In the middle of the contact surface, where the contact force is highest, the surfaces will stick together. In the outer region, where the contact forces are lower the surface will slide against each other. PSR mainly causes cracking damage as the surfaces are stuck together. The shear force stresses the material in cycles, leading to crack propagation. GSR is recognized by a full sliding fretting loop between the surfaces, as the contact force is not high enough to stick the surfaces together. GSR mainly causes surface damages and less cracks. The shear forces in the material is released when the surfaces slide, leading to additional surface degradation, in reference to PSR, where the shear forces lead to crack propagation instead. Vingsbo and Söderberg [13] suggest a schematic diagram that shows how fretting fatigue life and surface wear rate, on the y-axis, can relate to displacement amplitude. See figure 2. Figure 1:PSR and GSR fretting conditions [14] Figure 2: Fretting fatigue life and surface wear rate as a function of the displacement amplitude [13] Worth mentioning is that there is also a third fretting condition, mixed slip regime (MSR). MSR is characterized by a change in contact condition from GSR to PSR. As the number of cycles increase, material is abraded during the GSR phase and thus the friction increases. With increased friction the surfaces partly stick and PSR is initiated. See figure 3, below, for an example of a map on how the conditions depend on the normal force between the surfaces and the displacement amplitude. 4
![Figure 3: Material response fretting map for PSR, MSR and GSR [14] M. H. Zhu and Z. R.](/docs-images/96/128229388/images/12-0.jpg "Zhou [15] describe four different modes of fretting: Tangential, radial, torsional and rotational, seen in figure 4.")

12 Figure 3: Material response fretting map for PSR, MSR and GSR [14] M. H. Zhu and Z. R. Zhou [15] describe four different modes of fretting: Tangential, radial, torsional and rotational, seen in figure 4. Although they focus on ball-on-flat contact, the same applies for cylinder-on-flat contact, which is the case between the terminals in Volvo Car s connectors. They show that the modes differ in degradation behaviour, but they all follow the rules of the different fretting conditions described above. All four modes occur in some extent in every vibration case. Figure 4: The four different fretting modes in PSR condition [15] Several parameters affect fretting and these can be categorized in three groups: Design properties, applied forces and environmental conditions. The design properties contain the material of the two surfaces, i.e. type of base metal and type of metal plating barrier. Geometry of the connector and surrounding parts, e.g. cables and what the connector is attached to. The applied forces contain acceleration, displacement and frequency of the vibrations. Additionally, the contact force, number of cycles and current and voltage through the contact surface also affect fretting. Higher current and voltage increases the lifespan of the connector as it is easier for the signal to break through the increasing electrical resistance caused by the fretting. The environmental conditions contain everything in the surrounding environment, e.g. temperature, humidity and salinity. Measures can be taken to reduce the extent of fretting. Of course, all of the above parameters can be adjusted to reduce fretting. But mainly the sliding can be reduced or eliminated by increasing the contact force or reducing the shear force i.e. friction between the surfaces. Though, if done poorly, an increased contact force can worsen the fretting damages if the amplitude remains relatively large [16]. 5


13 2.2 Fretting corrosion Fretting corrosion is a combination of fretting wear and oxidation, i.e. a combination of mechanical motion and chemical reaction. In addition to what was described about fretting wear in the previous section, the particles removed by wear will oxidize in the surrounding air. These particles are harder than the base metal and therefore act as a grinding paste, which accelerates the fretting. This sequence follows a pattern: The mechanical motion disrupts the protective oxide layer, exposing the metal to the atmosphere. This allows additional metal to oxidize during the half-cycle when it is exposed to air. During the next half-cycle when the surfaces connect again, the new oxide layer is abraded and grinded into particles. The cycle now repeats [16]. If an electrical current is required to pass through these surfaces, e.g. in a connector, the layer of oxidized metal can cause problems. The oxidized material lack electrical conductivity and as the layer thickens, the electrical resistance increases. If the current meant to pass through the surfaces is low, e.g. if it is only a signal, the increasing resistance will eventually completely block the signal [17]. In figure 5a, below, the phenomena of fretting corrosion are shown. The debris on the contact surface is clearly visible. This is an image from a fretting test at Volvo Cars. In figure 5b, the contact resistance became too high for the signal to pass through. The metal melted from spark propagation between the surfaces. This is an image from a faulty connector in one of Volvo s prototype cars. More images of fretting damage are shown in appendix 2. Figure 5 a, b: Fretting corrosion on male terminals in two different connectors [18] 6


14 2.3 Fuel pump and connectors Volvo Cars have several engines with different fuel pumps and connectors. In this thesis one specific HPFP with the corresponding connector is evaluated HPFP Volvo Cars is using the Denso HPFP, see figure 6a, in their 4-cylinder petrol engines (VEP4). The HPFP is connected directly to the camshaft and this is exposed to vibrations to a large extent. The HPFP itself is handling the vibrations well, but it has been a troublesome task for Volvo Cars to find a connector for the HPFP that meets quality demands regarding fretting damages. Three different female connectors have been tried out, all with similar but slightly different male connectors. Details on how the terminals are attached in the male terminal can be found in figure 6b. Both the male and female parts are relatively light and stiff in their structure. This entails eigenmodes with high frequencies. See appendix 1 for images of the HPFP and connector mounted on the engine. Figure 6 a, b: HPFP with the Yazaki connector & Male connector with terminals Sumitomo The Sumitomo connector was the first connector used with the HPFP. It did not pass the quality tests regarding fretting and was replaced by the Yazaki connector in the developing stages of the VEP4 engine. The structure of the connector is rigid and in one piece. There is one fastener, seen in figure 7a and b. Details on previous fretting test results in appendix 2. Figure 7 a, b: The Sumitomo female connector, back & front 7
![2.3.3 Yazaki The Yazaki connector could handle the large vibrations from the HPFP a lot better than the Sumitomo connector and is the connector used by Volvo Cars today [].](/docs-images/96/128229388/images/15-0.jpg "Although the extent of fretting is a lot less, there is still fretting occurring in this connector. The connector is divided into two parts, seen in figure 8a.")

15 2.3.3 Yazaki The Yazaki connector could handle the large vibrations from the HPFP a lot better than the Sumitomo connector and is the connector used by Volvo Cars today []. Although the extent of fretting is a lot less, there is still fretting occurring in this connector. The connector is divided into two parts, seen in figure 8a. The inner casing is suspended by two springs and is held in place by two fasteners. This makes the connector able to move freely from the outer plastic casing in all three directions, seen in figure 8b. Furthermore, the outer plastic casing has two fasteners for the male part of the connector, providing a more stable connection with the HPFP than the Sumitomo connector, which only have one. Details on previous fretting test results are collected in appendix 2. Figure 8 a, b: The Yazaki female connector, front and back. 8


16 2.4 Laser vibrometry, PDV-100 The PDV-100, seen in figure 9a, is the laser vibrometers that is tested and used in this thesis. It uses Doppler shift to measure velocity of a vibrating object. In the data sheet for the PDV- 100[21], all the needed information is found. The Doppler shift technique works as follows. If a light beam is reflected by a moving object, the frequency of the light is shifted proportional to its velocity. This is a phenomenon referred to as the Doppler shift. Through this process, the velocity information becomes coded in the frequency of the light and is used by the laser to measure the vibration. The laser transforms the frequency shift into a voltage signal that can be processed by standard data acquisition systems. An illustration on how this is done can be seen in figure 9b. The PDV-100 can accurately measure vibrations from 0.05 Hz to 22 khz. Figure 9 a, b: PDV-100 laser vibrometer & PDV-100 Doppler technique [21] 9
17 2.5 Natural frequencies The natural vibration frequencies, or eigenfrequencies, of a system are determined by its stiffness and mass. The first mode is called the fundamental frequency and can be calculated using equation 1, shown by G. Jönsson [19]. This is for an undamped system. A system exposed to this frequency will oscillate and move with larger amplitudes than other frequencies. Large vibrations can induce damage on a mechanical system, so avoiding exposing the system to eigenfrequencies can be important. By changing the design and thereby the stiffness and mass of the systems parts, the eigenfrequencies can be controlled. By increasing the stiffness and/or reducing the mass the eigenfrequency will become higher, as seen from equation (1). If the frequency spectra the system will be exposed to is known, it is possible to design the parts so that the eigenfrequencies are outside that spectra. In figure 10 below, four examples are presented on how you can avoid having an eigenmode at 1 Hz. The dotted curve is the original system and the solid line is the modified system. Figure 10 a, b, c, d: Changing an eigenfrequency by adjusting the mass and stiffness As most systems are damped, worth noting is that the amplitude at the eigenfrequency is rarely as extreme as the examples in figure 10 where no damping is present. Damping can be passive or active, described by J.W Sutherland [20]. In the case of the connector there is only passive damping. The damping of such a system is determined by its mass, stiffness, geometry and material. 10
18 2.6 Engine orders and waterfall diagrams When an engine rotates, it emits vibrations with different frequencies and amplitudes. This is because the engine has several rotating and striking parts, with different frequencies for each RPM. For example, an analysis can be made of the crankshaft and the cylinders of a 6- cylinder, 4-stroke engine. The crankshaft rotates with 3000 RPM, which makes it generate vibrations at 50 Hz. One cylinder fires once every two revolutions of the crankshaft. Because there are six cylinders, three ignitions will happen for each revolution of the crankshaft. This makes the cylinders generate vibrations with 150 Hz. If we define the vibrations from the crankshaft as the first order, the order of the vibrations from the cylinders will be the third; the frequency is three times that of the crankshaft. The relationship between frequency and RPM within an order is linear, but the amplitude can vary, see figure 11 for an illustration. In conclusion, an engine order is the relationship between RPM, frequency and amplitude, according to equation 2. Orders are essentially like harmonics, but orders can be uneven multiples of the first order [22]. A source to an order creates overtones, meaning that vibrations in one order will also generate vibrations in orders with whole-number multiples of the original order. In figure 12 below, we see how half-order vibrations also can generate vibrations in the 10 th order [23]. Figure 11: Illustration of order lines [22] Figure 12: Overtones of the 0.5 th order [18] 11
![Particularly important are orders from gas pressure torques and inertia forces, mentioned by K. Haug and B. Dondlinger [27]. For a 4-stroke, 4-cylinder engine the vibrations are of order 2, 4, 6 etc.](/docs-images/96/128229388/images/19-0.jpg "where the lower orders have higher amplitudes. When highly pressurized exhaust gases are pushed out of the cylinders, the resultant forces from the expansion of gas generates vibrations.")
19 Particularly important are orders from gas pressure torques and inertia forces, mentioned by K. Haug and B. Dondlinger [27]. For a 4-stroke, 4-cylinder engine the vibrations are of order 2, 4, 6 etc. where the lower orders have higher amplitudes. When highly pressurized exhaust gases are pushed out of the cylinders, the resultant forces from the expansion of gas generates vibrations. Inertia forces are vibrations generated by rotation of mass in the engine, e.g. pistons and piston rods. These vibrations can partly be counterbalanced with weights and by the rotation of other pistons, but they cannot be eliminated completely. Inertia forces increase with the frequency squared, so the effects of inertia forces are not noticeable at low frequencies. Gas pressure torques and inertia forces have opposite phases and thus partly cancel each other. The result is considerable vibrations at lower frequencies, where the inertia forces are small and do not cancel the gas pressure torques. One common way to illustrate vibration amplitudes is with a waterfall diagram, seen in figure 13. Dark, cold colours represent low amplitude and bright, warm colours represent high amplitude. The order tracks (lines) are clearly visible; they have higher amplitudes than surrounding areas. Another phenomenon that it present is the resonance in the engine, also called eigenmodes. They are parallel to the y-axis, meaning that they are stationary at the given frequency, the eigenfrequency. At these frequencies even small external forces can produce large vibrations. The largest amplitudes occur when an order line crosses the resonance area [24]. Figure 13: Waterfall diagram [22] 12
20 2.7 Signal analysis Sine sweep Sine sweep is a method for characterizing the response of a part during a vibration test. It is a special type of a chirp and is a quick and useful method to finding eigenfrequencies of the part. E. Sauther [25] explains the procedure very well and the following is a summary. One drawback is that the vibration table is limited to one axis, with a single degree of freedom. The part is exposed to vibrations with different frequencies that change continuously in the testing spectra, see figure 14. Several parameters can be set, e.g. number of sweeps, test duration, start and stop frequency, amplitude, acceleration and in what direction the response of the part should be measured. For example the acceleration can be kept constant, while the amplitude and frequency change. Note that the three are related by equation 3. The response signal of the part is measured and compared to the original signal. A good method of analysing the results is with a Fast Fourier Transform, explained in the next section. Figure 14: Sine sweep [25] Fast Fourier Transform (FFT) To divide a vibration, or any signal, into its components requires a method. One widely used method is an optimized algorithm called Fast Fourier Transform. In Figure 15 an example is presented on how a signal can be a combination of three different components with individual frequencies, amplitudes and phases. To determine the three components the signal is sampled using a measuring instrument. With a few input parameters such as sampling speed and number of samples, the algorithm calculates its components. FFT is mainly Figure 15: Fast Fourier Transform [21] suitable for periodic signals, which means that the measured vibration caused by an engine should be with a constant RPM [26]. If you are only interested in the maximum amplitude over a sweep from RPM another approach is to plot the maximum amplitude for each frequency, independent of the rotational speed. Note that the amplitude of the different sine components might be much lower than the maximum true displacement of the original signal. This is because in each sample, the amplitudes of several components are added to represent the true displacement. 13
21 3. Methodology Xing & Xu [9] conclude that the fretting is indeed worst when the terminal relative displacement between the terminals is highest. This is supported by the findings of Park, et al. [10]. The focus of the thesis is to examine the terminal relative displacement. Two different measuring tools are used and compared, laser vibrometers and piezoelectric accelerometers. One approximation made in the work by Xing & Xu was the relative displacement between male and female terminals in their vibration test. It was measured using accelerometers placed on the plastic casing of the connector. Several factors affect the displacement, e.g. geometry, location of measurement, eigenmodes and added mass. To get a more accurate measurement of the terminal relative displacement, the measurements are instead made with laser vibrometers. The benefits of this technique could be considerable. Holes were drilled through the plastic casing of the connector to measure directly on the terminals. Hypothetically this would give a more accurate result, without changing the geometry and mass by a significant amount. The Yazaki connector has several parts that are not attached very firmly to one another. This means that even if the casing moves, it does not necessarily have to mean that the terminals follow this movement. The suggested method for evaluating fretting in this thesis contains two main steps. First, an engine vibration test session is to be analysed, this test is referred to as the engine vibration test. Frequencies and displacements for the connector are then recorded with accelerometers. This information is used to set up the connector vibration test with an electrodynamic vibration test rig. Here the HPFP and connector are mounted on a fixture and vibrated with a sine sweep. This way, the vibrations on the connector from the engine can be simulated. Analysis can easier be made when the connector is exposed to a set vibration schedule. Additionally, measurements that could not be made when the connector was mounted on the engine can now easily be made. Additional comparison between the engine vibration test and connector vibration test are also made. When the frequencies of the worst terminal relative displacement are found, adjustments to the connector are to be made to potentially reduce the terminal relative displacement. One method is to try to use the parameters mass and stiffness to control the eigenfrequencies and displacement of the connector. For example, using straps to fasten the connector or adding mass could change the eigenfrequency and/or dampen the system. The test is repeated with new conditions and additional improvements can then be found. Additionally, design features that are useful for reducing vibrations were analyzed. 14


22 4. Engine vibration test A VEP4 engine was vibration tested in 2016 by Volvo Cars. Displacement data of the HPFP and the Yazaki and have been collected and will be analysed in this section. 4.1 Setup Several accelerometers were placed at various points of interest, see figure 16. At the green circle, two accelerometers are attached on the Yazaki connector presented in section 2.3. One accelerometer was placed on the male connector casing and one on its corresponding female connector casing. See figure 17. The engine ran from 1000 RPM to 6000 RPM with full load, back to 1000RPM with no load. The test time was four minutes, with am RPM increase/decrease of 40 RPM/s. This was done three times, so three sets of data were obtained. The data is acquired in three directions, X-, Y- and Z-components. The Y-direction is in the plug-in direction of the connector. The X-axis is in the horizontal direction and the Z-axis is in the vertical direction. See figure 17. Frequencies below 100 Hz are filtered out as these give large displacements, out of fretting range. The software used for the analysis was DEWESoftX2. Figure 16: Accelerometers attached to the VEP4. Accelerometers connected with the blue cables. Figure 17: The Yazaki connector 15
23 4.2 Results The data from the three runs were similar in behaviour, but the displacements somewhat differ. Run number two was selected for analysis. Only the data from the run-up phase of the test was analysed as the vibrations are a lot larger than the run-down and thus more fretting occurs. This is also determined by Xing and Xu [9]. See appendix 3 for how the runs differ and comparison between run-up and run-down. Appendix 4 shows a graph of the maximum displacement for the male and female casing. The displacement increases with engine RPM. An FFT diagram for the relative displacement between the male and female casing in each direction is plotted in figure 18. The directions are the same as seen in figure 17. Further, these results were used for an FFT diagram for the displacement in the total direction for both casings, see figure 19. The black curve is for the accelerometer on the female connector and the green curve is for the male connector. The displacement is calculated by double integration of the acceleration in all three directions and then adding the three components for the total displacement by equation 4. Figure 18: Female and male casing relative displacement FFT Figure 19: Displacement FFT for female and male connector in total direction 16

24 The relative displacement between the casings in the total direction is visualized in figure 20 and 21. Figure 21 visualizes a waterfall diagram, explained in section 2.6, where additional information about what engine orders the vibrations originate from. What order the lines corresponds to is written at the top of the figure. Note that the maximum relative displacement is not in the same direction for each frequency. Figure 20 Relative displacement between male and female casing. Figure 21: Waterfall diagram for relative displacement 17
25 An example of the displacement is presented with a scope of 2 milliseconds in figure 22, below. The female connector casing (black), male connector casing (green) and relative displacement between the two (blue) is displayed at 4000 RPM. See the analysis section for further explanation Figure 22: Displacement curves for the casings and their relative displacement. 4.3 Analysis In figure 19, the displacement for the both parts at the lower frequencies (0-250 Hz) is similar, and they display more independency when the frequency becomes higher. There are peaks at around 500 and 1600 Hz. This corresponds primarily to orders 6 and 18, seen in figure 21. Even though the casing relative displacement is highest at 500 Hz, there is a lot of casing relative displacement at 1600 Hz. The displacement at 1600 Hz has a lot higher frequency, which increases the acceleration. To visualize this, the displacement of the female casing is plotted alongside a curve with a constant acceleration of 180 m/s 2, seen in figure 23 below. Equation 3 is used to calculate the curve. As the displacement for the female connector follows this curve in some extent it is interpreted that the female connector experience resonance at around 1600 Hz. 18
26 Figure 23: FFT for female connector and theorietical constant acceleration Figure 22 shows that the casing relative displacement can in some instances be a higher than both the displacement of the female connector and the male connector. The conclusion is that the two are not always vibrating in phase. When the vibrations are out of phase the casing relative displacement becomes higher than the displacement of one individual component. This high casing relative displacement presumably increases the rate of fretting. It depends on whether or not the terminals vibrate according to the casings. This will be explored in the connector vibration test. 19
27 4.4 Discussion The accelerometer on the female connector was attached slightly out of position, as can be seen in figure 24. The angle of about 10 gives a small error to the X- and Y-components, but the total acceleration when combining the components remain the same. An interesting conclusion that can be drawn from the engine vibration tests is that the casing relative displacement peaks at higher values than they did for Xing and Xu. According to them, it peaked at 17.3 µm in their test and in the test in this thesis work it peaked at 85 µm. They used the same type of test, but with the Sumitomo connector. They made a presumption that measuring on the plastic casing of the connector would be a good enough estimation of the terminal displacement. According to their conclusion that since the fretting correlates to terminal relative displacement, the Yazaki connector should experience more fretting than the Sumitomo connector. The Sumitomo connector experiences a lot more fretting and fails before the Yazaki connector, which is why it was replaced. Perhaps the assumption that the plastic casing displacement is a good estimation of the terminal displacement does not apply to the Yazaki connector. The Sumitomo connector consists of only one part, so the presumption might be good enough in this case. But for the Yazaki connector, which contains several parts, including springs, the assumption is very bold. The error from measuring on the plastic casing on the Yazaki connector is tested in the next section. The resonance occurring at 1600 Hz is at a very high frequency. This was expected, as the mass is low and stiffness high, explained in section 2.5. A phenomenon that could be a major contributor to the increasing fretting problem is that newer cars strive for a more effective combustion. To get an effective combustion as possible, it is required that the fuel burns fast. With faster combustion, the pressure in the cylinders gets higher and more vibrations are generated. These vibrations are high in frequency and presumably closer to an eigenfrequency of the Yazaki connector. 20

28 5. Connector vibration test In this test, a shaker rig is used to vibrate the HPFP and connector in a controlled environment. From the engine vibration test, a constant acceleration of 100 m/s 2 was selected for the sine sweep in the connector vibration test. In figure 24, below, the HPFP has been mounted to the fixture in the Z-direction. The shaker rig only vibrates vertically. The steel part seen at the bottom of figure 24, below, is a counterweight to balance the fixture. Neither the female connector nor the accelerometers are yet attached. The displacement is also measured with two PDV-100 lasers vibrometers. Holes are drilled in the connector to be able to measure the terminal displacement. Figure 24, HPFP mounted to the fixture in Z-direction. 5.1 Measuring with lasers The PDV-100, presented in section 2.4, is mainly used to measure on three different objects: the male terminal, the female terminal and the female inner casing. To access these areas, holes has to be drilled through both the male and female connector. A 3 mm hole is drilled to the female terminal. This procedure was done by removing the female terminals from the female connector and attaching the female connector to the male connector. The hole could now be drilled through the female outer casing, the male casing, and the female inner casing at the same time. The female connector was then removed and new female terminals installed. Because there were no female terminals in the connector while the connector was attached, nothing came in touch with the male terminals, ensuring no damage. In figure 25-27, there are three images illustrating how the lasers are pointed at the holes, in detail. This includes the holes leading to the male terminal, female terminal and the female inner casing. These figures are representative illustrations and not true models. 21


29 Figure 25: Overview of holes Figure 26: Lasers pointed on terminals Figure 27: Laser pointed on female inner casing In figure 29, the two lasers are mounted on a tripod each and the female connector attached to the HPFP. The lasers are pointed at the holes in the female connector. The lasers are not pointed at the terminals perfectly perpendicular. This angle results in a small error during measurements. The lasers were ensured to have the same angle. In figure 28: Measuring of male terminal. Figure 29: Lasers pointing at holes 22

30 5.2 Equipment To run the vibration tests several softwares and devices are required. A shaker rig is used to generate the vibrations, controlled by a PC. Through a series of devices, the signal generated by the computer is amplified and delivered to the shaker. To measure the vibrations, two PDV-100 laser vibrometers are used together with three piezoelectric accelerometers. The shaker also has a built in accelerometer which is required in order to control it. These six signals are read by a data acquisition device and then sent to a PC running analytic software. See diagram 1, below, for more details. Type of equipment Model name/software Function 1 PC 1 Dactron CometUSB 5.61 Design signal 2 Controller LDS COM 200 Generate signal 3 Pre-Amplifier Bruel & Kjaer 2626 Prepare signal 4 Amplifier LDS SPA-K Generate power 5 Shaker LDS 726 Generate vibrations 6 Laser vibrometers (2) PDV-100 Measure terminals Accelerometers (3) PCB HT356B01 Measure casing 7 Data acquisition device DEWESoft Sirius ACC+ Collect data 8 PC 2 DEWESoft X2 Analyse data Diagram 1: Equipment used for connector vibration test A total of 5 female connectors and 10 HPFP with corresponding male terminals have been used in the different tests. It is important to replace the parts after a few runs to ensure no fatigue properties interfere with the results, this is discussed more at the end of this section. The female connectors had their terminals replaced frequently as well. To be able to follow each test easier, the signals from the lasers and accelerometers have their own colour. See figure 30, below. These colours are the same throughout all tests. 1: Laser on female terminal. 2: Laser on male terminal. 3: Accelerometer on screw. 4: Accelerometer on male casing. (hidden from view in this picture) 5: Accelerometer on female outer casing. (hidden from view in this picture) 6: Accelerometer on shaker table, required to control the rig. Figure 30: Measurement setup for the Z-direction (Default setup). Where nothing else is stated, the signal used in the tests is a linear sine sweep running from 100 to 2000 Hz and increasing with 5 Hz per second. The acceleration is set to a constant value of 100 m/s 2. The lasers have built in high- and low-pass filters. But as filters have to be added manually for the accelerometers, the same filters were added for the lasers and the built in filters turned off, to ensure comparable data. High pass filters are set to 100 Hz for both the accelerometers and laser vibrometers. The measurement range of the lasers was set to 500 mm/s. 23

31 5.3 Calibration of equipment As the accelerometers and lasers are of different brands and use different technologies they had to be calibrated towards one another. A test measurement was done when the lasers were pointed on an accelerometer, see figure 31. There was a time difference of 1.25ms. To compensate for this difference, a time delay was added for the accelerometers in DEWESoft. In figure 32 a scope of the signals from the accelerometers and lasers are presented. The lasers are in phase with the accelerometers, which makes them comparable. Figure 31: Calibration measurement on screw. Figure 32: Signals from lasers and accelerometers in phase after calibration. 24


32 5.4 Tests Each test has been made several times to validate the measurements Z-direction, X-direction, Y-direction and engine vibration test comparison These tests compare the displacement in Z-direction with displacement in X- and Y-direction. Additionally, the Z-direction is compared to the engine vibration test results. Goal The goal is to determine which direction has most displacement and decide which direction to focus the rest of the tests on. The desired direction is the Z-direction. That is because it is the only direction that the male terminals can be measured with lasers. The width of the terminal is too small for lasers to be able to focus in the X- and Y-directions. To be clear, the directions are the same as for the engine vibration test, see figure 24. The question to be answered is if the Z-direction is as good as or better than the X- and Y-direction. Setup The fixture can be rotated, making it possible to test in all three directions. Figure 33 and 34 shows the X- and Y-directions. Figure 30 shows the Z-direction. Figure 33: Measurement setup for X-direction Figure 34: Measurement setup for Y-direction 25
33 Results and analysis Only the accelerometer on the female outer casing is presented. This is because there is no way to measure the male or female terminals with lasers in the Y-direction. The lasers and terminals are parallel and thus too small contact surface to measure on. Figure 35: FFT female outer casing in Z-direction Figure 36: FFT female outer casing in X-direction Figure 37: FFT female outer casing in Y-direction Bear in mind that if the system experienced no resonance, the curve would look like the constant acceleration curve displayed in figure 23. This means that the high displacement at 100 Hz seen in the above graphs displays no resonance. When comparing the results with the engine vibration test results, see figure 18 and 19, the graphs displays similar behaviour. In the Z-direction considerable displacement is present at around Hz and Hz, while little to no displacement in between. The two peaks at 600 and 700 Hz in the Z-direction are relatively high and interesting for further analysis. When comparing with the X- and Y-directions these peaks are the largest. The X- and Y-directions also has interesting peaks but as the Z-direction is more convenient to measure with lasers, the X- and Y-directions are not further explored in this thesis work. 26
34 5.4.2 Female terminals and female outer casing These tests compare the displacement of the female terminals with displacement of the female outer casing. Goal The goal is to determine if displacement measurements on the outer casing are a good enough approximation of the displacement of the terminals. This is the approximation done by Xing & Xu in the previous thesis work. The hypothesis is that this is a bad approximation for the Yazaki connector and cannot be used. Setup The default setup was used; it is depicted in figure 30. Results and analysis Figure 38: FFT female outer casing and terminal The terminal (red) displays a lot of independence from the female outer casing (black). At 725Hz the displacement of female outer casing is 5 times higher than the displacement of the terminal, 154 µm and 32 µm respectively. At 1660 Hz it is instead the other way around. Now the displacement of the terminal is 3 times higher than the displacement of the female outer casing, 31 µm and 10 µm respectively. The hypothesis that the displacement of the outer plastic casing of the female connector cannot accurately approximate the displacement of the terminal is confirmed. 27
35 5.4.3 Female terminals and female inner casing These tests compare the displacement of the female terminals with displacement of the female inner casing. Goal The goal is to determine if displacement measurements on the inner casing are a good enough approximation of the displacement of the terminals. Setup The default setup was used; it is depicted in figure 30. The additional hole for the female inner casing seen in appendix 5 was also drilled. Results and analysis Figure 39: FFT female inner casing displacement (pink) and female terminal When comparing the inner casing displacement (pink) to the female terminal displacement (red) it is clear that they are pretty much equal everywhere except at around 700 to 900 Hz, see figure 39. At 700 to 900 Hz the inner casing displays up to twice the displacement of the terminal. The fact that the displacement of the inner casing is always equal or greater than the displacement of the terminal shows that measuring on the inner casing is a much better method than measuring on the outer casing. This ensures that one at least gets the worst case scenario when using this method. Whether or not it is a good enough approximation overall depends on how accurate the results have to be. 28
36 5.4.4 Female terminals and male terminals. These tests compare the displacement of the female terminals and displacement of the male terminals, i.e. terminal relative displacement. When analysing the results, only vibration amplitudes within a specific amplitude spectra are considered. Because GSR causes surface damages to a larger extent than PSR and the problem in the connectors regards surface damages, GSR will be the interesting fretting type for the connector. PSR primarily causes cracks in the material, which is not the problem in the connectors and thus it is not relevant to analyse small displacement vibrations further. These facts will cause larger displacement amplitudes to cause more damage to the connectors, up to the limit of 70 µm. Terminal relative displacements between 15 and 70 µm are considered gross and dangerous for the connector [13]. Goal The goal is to determine the terminal relative displacement between the male and female terminals. Setup The default setup was used; it is depicted in figure 30. Results and analysis Note that the scale of the graphs in figures 48 and 49 is different from the previous graphs. This is because the displacement amplitudes are relatively small and easier to read with a smaller scale. The terminal relative displacement is impossible to display in an FFT diagram, so it is displayed in a time domain instead. The graphs are still comparable. Figure 40:FFT male and female terminal Figure 41: Relative displacement The terminal relative displacement is high when the system experiences resonance, compare figure 40 and 41. The first peak at 700 Hz is mainly caused by the difference in amplitude between the terminals. The male displacement (blue) peaks at 48 µm, the female displacement (red) peaks at 33 µm. The maximum terminal relative displacement between the two is 27 µm. Why the maximum terminal relative displacement is not simply the difference of the peaks is because of the overtone that is generated in the female terminal. If no overtone was present, the maximum terminal relative displacement would simply be the difference in amplitude between the terminals, i.e. 15 µm. In figure 42, below, the third order overtone (2400 Hz) disturbs the sinus curve. This result in a lower displacement for the female terminal compared to if no overtone was present and thus a higher terminal relative displacement between the terminals. 29
37 Figure 42: Moment with the largest terminal relative displacement As for the peak at 1660 Hz, the maximum terminal relative displacement appears to only be due to the difference in amplitude. Overtones are present, but the displacements of them are not considerable. The male terminal peaks at 24 µm and the female terminal peaks at 37 µm. The maximum terminal relative displacement is 13 µm. When comparing the terminal relative displacement graph with the displacement of the female outer casing, see figure 35, it is not clear at which frequency the terminal relative displacement is highest. The three peaks between 1400 and 1900 Hz look very similar, yet it is only the middle peak that has considerable terminal relative displacement. This enforces the conclusion that the terminal relative displacement is not necessarily related to the female outer casing displacement. 30
38 5.4.5 Male terminals and male casing These tests compare the displacement of the male terminals with displacement of the male casing. Goal The goal is to determine if displacement measurements on the male casing are a good enough approximation of the displacement of the terminals. Setup The default setup was used; it is depicted in figure 30. Results and analysis Figure 43: FFT male casing and male terminal Although the two curves coincide almost entirely, the male terminal displacement (blue) is almost always larger than that of the male casing (green). This is the direct opposite of what was seen in section 5.4.2, where the female terminal displacement was smaller than both the female inner and outer casing. The error received when approximating the terminal displacement with male casing accelerometer displacement measuements would therefore be a more dangerous error than the error received when approximating the terminal movement with the female outer casing. With this in mind, if using a safety factor when approximating the terminal displacement with male casing displacement, the male casing measurements is more accurate to use than measurements from the female outer casing. Although, if it was possible to attach an accelerometer to the female inner casing, this would be the optimal option because the worst case scenario is measured. To be clear, this is not at all as good as using lasers to measure directly on the terminals and should only be used when a rough estimation of the terminal movement is required. 31


39 5.4.6 Different stiffness These tests compare setups with different stiffness. Changing stiffness is done by changing springs, adding glue, tighten cables and using stripes. Goal The goal is to determine what can be done to change the displacement and move the eigenfrequencies. Setup The default setup was used; it is depicted in figure 30. Glue and stripes are used according to figure 44-46, see below. In figure 44, the inner casing was glued to the outer casing around the blue seals. In figure 45, the fasteners have been glued to the male casing. This is in addition to the inner casing already being glued in place. Figure 44: Inner casing glued Figure 45: Inner casing and fastener glued Figure 46: Stripe outer casing 32
40 Results and analysis No change in frequency for the resonance areas was able to be created. More fundamental changes to the structure are probably needed to be able to achieve this. On the other hand, several changes to the displacement amplitudes of the parts were achieved. The resonance for the female outer casing at 600 Hz, seen in figure 35, is supressed when damping it with both glue and stripes. This suggests that this eigenfrequency is solely for the female outer casing and the elevated displacement at this frequency for the terminals is due to picking up vibrations from the female outer casing. When gluing the female outer casing to the female inner casing and male casing, the properties are completely changed and this resonance is eliminated completely. The increased stiffness of the female outer casing removes this behaviour. Gluing the parts together according to figures 47 and 48 worsens the terminals displacement by 2-3times at 700 Hz. The change in displacement of the terminals and casings in the different tests follow a magnitude order. When gluing the inner casing and fasteners the displacement is highest, followed by only gluing the inner casing, followed by the original setup. See figures 51 and 52. The outer casing has the largest vibrations, followed by the female terminals, male terminals and finally the male casing. Both terminals now experience roughly double displacement amplitudes at this frequency, compared to the original setup, see figure 40. The reason is that the energy that is picked up by the female outer casing is easier transferred to the female inner casing and the terminals via the glue. The male casing displacement stays the same. In short, the female outer casing acts as a vibration absorber for the female inner casing and the terminals. At 1600 Hz the vibrations in the terminals are suppressed compared to the original setup, see figure 35. Now it is the other way around compared to 700 Hz. The female outer casing picks up energy from the inner female casing and acts as a vibration absorber at this frequency. A very significant improvement for the female outer casing was observed when striping it to the vibration rig, according to figure 46. This reduced the female outer casing displacement at 700 Hz to 40% of the original displacement. The terminal displacement remained the same and how fretting is affected by this remains unanswered. Tests were also made when using different springs between the female inner casing and female outer casing. As hardly any difference was observed, this part is excluded from the report. In appendix 5 the results are presented. Additionally, when tests were made with different attachments of the cable, no change in behavior was identified. 33
41 Figure 47: Inner casing glued Figure 48: Inner casing and fastener glued Figure 49: Stripe outer casing 34


42 5.4.7 Different weight These tests compare setups with different additions of external weight to the female outer casing. Three tests were done: The first with an added weight of 1.51 gram, the second with an added weight of 8.6 gram and the third was done after removing the accelerometer. The female outer casing weighs 5 grams. Together with the added weight of 1 gram from the accelerometer, first and second test corresponds to 50% and 192% increase in mass respectively. The total mass of the female connector with the inner casing and terminals is 10 gram. Goal The goal is to determine what can be done to change the displacement and move the eigenfrequencies and to determine if the accelerometer has a relevant impact on the terminal displacement. Setup The default setup was used; it is depicted in figure 30. Additional weights was glued in place, see figure 50 and 51, below. Figure 50: 1.51 gram added Figure 51: 8.6 gram added 35
43 Results and analysis The peaks at 700 Hz are marginally higher for both the terminals, see figure 52 and 53 and compare with figure 40. The displacement increase is too small to be able to conclude that the weights affect the terminal displacement negatively. Figure 52: Terminal FFT, 1.51 gram added Figure 53: Terminal FFT, 8.6 gram added The terminal displacements are more unstable when adding 8.6 gram, especially at the lower frequencies around Hz. Although more unstable, the eigenfrequencies remain at the same frequencies. The test is aborted at around 1660 Hz. This is because the added weight made the female outer casing vibrate almost 50 out of phase with the shaker table. This disrupted the mean acceleration of the shaker, forcing an abort. The female outer casing displacement is highly affected by the attached weights. In figure 54 the female outer casing displacement for the 8.6 gram weight test is displayed. One conclusion that can be drawn is that the eigenfrequency of the female connector has been moved from 590 Hz to 480 Hz, see figure 54 and compare with figure 35. This confirms the theory that added mass moves an eigenfrequency to the left in the frequency spectra, discussed in section 2.5. Figure 54: Female outer casing FFT, 8.6 gram added Further, no change of terminal displacement was observed when removing the accelerometer from the female (and male) casings. The small mass of the accelerometer is simply insignificant. 36


44 5.4.8 Removing parts of the HPFP These tests compare setups with different parts removed from the HPFP to analyse how the vibrations change. Goal The goal is to determine how individual parts affect the eigenmodes and displacement. Setup The default setup was used; it is depicted in figure 30. Parts of the connector and HPFP are removed according to figure Additionally a test with no female connector attached, according to figure 24, was performed. Figure 55:Female outer casing removed Figure 56: Male casing removed Figure 57: Fuel connector removed Results and analysis The signal from the accelerometer and lasers that read screw acceleration has been used. Even when removing both the long fuel pipe and the male casing, seen in figure 57, the characteristics for the displacement do not change. The displacement for the screw in the original HPFP, figure 58, and the modified HPFP, figure 60, remain similar. The conclusion is that the eigenmodes originate from the parts and structure of the HPFP itself. Figure 58: Screw displacement FFT. Original setup Figure 59: Screw displacement FFT. Female connector removed 37
45 Figure 60: Screw displacement FFT. Male casing removed Figure 61: Screw displacement FFT. Fuel connector removed The displacement for the male terminal at 1600 Hz, when running the test without the female connector, is much lower compared to the original setup. This entails that the female terminals have a high displacement at this frequency and the male terminal follows the displacement of the female terminal to some degree. If the male terminals were stiffer and remained stationary while the female terminals still have a large displacement, the terminal relative displacement would be higher and fretting damages would be more severe. When running without the female outer casing, according to figure 55, the test was aborted at both 700 Hz and 1600 Hz. This is because the springs in the casing are not damping the system. After several attempts, the results are displayed in figure 62, below. Figure 62: Terminal displacement FFT. Female outer casing removed. When running the vibration test without the female outer casing, there are two major differences. Compare with figure 40. The first difference is that there is no resonance at 600 Hz. The conclusion is that the female outer casing induces this eigenfrequency and the rest of the structure receives excess vibrations as well. When removing the outer casing completely, these vibrations are removed as well. The second is that the terminal displacement amplitude at 725 Hz for both terminals is higher when running without the outer casing. The male terminal peaks at around 80 µm, compared to 50 µm when running with the outer casing. The female terminal peaks at around 60 µm, compared to 30 µm when running with the outer casing. The conclusion is that the outer casing acts as a vibration absorber for the terminals at this frequency. The kinetic energy from the male casing and the terminals are absorbed by the female outer casing and vibrates more itself. This is confirmed by the high displacement amplitude of the female outer casing at this frequency, seen in figure
46 5.4.9 Test for constant frequency Two hour tests at 700, 800 and 1600 Hz are performed to evaluate which frequency induces most fretting. The tests are performed with brand new HPFPs, connectors and terminals. The terminals were examined in microscope and compared. The fretting induced by terminal relative displacement is determined by a number of factors. There are three that are examined in this test; the difference in displacement amplitude between the terminals, the difference in phase between the terminals and the frequency, or energy, of the vibrations. The tests aim to compare the three and identify the largest contributor to fretting. The eigenfrequency at 700 Hz induces a large terminal displacement and terminal relative displacement. The eigenfrequency at 800 Hz induces a large phase difference between the terminals. The eigenfrequency at 1600 Hz induces high energy vibrations. See appendix 6 for proof. Goal The goal is to determine which eigenfrequency that induces most fretting. Setup The default setup was used; it is depicted in figure 30. No accelerometers or lasers were used. A constant acceleration sine sweep with an amplitude of 65 m/s 2 and increment of 5 Hz per second was used. Test duration times were 2 hours, or 1080 sweeps. The frequency spectra for each eigenfrequency used were: Hz Hz Hz 39


47 Results and analysis Both the samples exposed to 700 and 1600 Hz vibrations suffered severe fretting damage. The sample exposed to 800 Hz hardly had any damage. See figures To better understand the design of the terminals, see images in appendix 2 for clarification. Figure 63: Female terminal rails fretting damage 700 Hz Figure 64: Female terminal rails fretting damage 800 Hz 40

48 Figure 65: Female terminal rails fretting damage 1600 Hz In section it is shown that the relalative displacement of the terminals is about twice as large in the 700 Hz area compared to the 1600 Hz area. Dispite this, the fretting damage in the 1600 Hz sample is as bad as the 700 Hz sample. Both samples exposed roughly the same amount of copper to the atmosphere and had the same wear depht. This is arguably because both of the samples were exposed to GSR type fretting, see section 2.1. Above the GSR displacement amplitude threshhold, the connector will suffer considerable fretting damage. Because the number of vibration cycles were more than twice as many in the 1600 Hz sample, this sample experienced as severe fretting damage as the 700 Hz sample. The theory is that high energy, low displacement vibrations cause as much fretting as low energy, high displacement vibration as long as the terminal relative displacement is in the GSR zone. Because the 800 Hz sample suffered next to no fretting damage, the phase of the terminal displacement contributes to no additional fretting apart from increasing the terminal relative displacement. This was presented in section The male and female casings of the samples experienced friction wear, see figure Especially at the fasteners dust from the female casing is present. The sample at 700 Hz was worn down most, confirming that the female outer casing moves a lot at this frequency. The friction also caused problems with the heat generation. Having a consant acceleration at the eigenfrequencies made the connector hot from the friction between the parts. This softened the plastic, which made the displacements even higher. This problem was predicted and attempts to avoid it were made by lowering the acceleration from 100 m/s 2 to 65 m/s 2. This reduction in acceleration was not enough. The vibration rig frequently aborted and had to be restarted after the connector cooled down due to deviations from the mean acceleration because of this. The heat generation for the 1600 Hz sample was higher than the 700 Hz (~50 C and ~30 C at the female outer casing), proving higher energy vibrations are present here. 41


49 Figure 66: 700 Hz connector wear. Figure 67: 800 Hz connector wear. Figure 68: 1600 Hz connector wear. 42
50 5.5 Discussion It was concluded that the most dangerous frequencies are at 700 and 1600 Hz. When comparing these to the waterfall diagram in the engine vibration test, some interesting things can be said. First, the eigenfrequency at 700 Hz in the connector vibration test has its corresponding high amplitude frequency at 500 Hz in the engine vibration test. Meanwhile, the frequency of 1600 Hz stays the same for both tests. The fixture has in some way moved the first dangerous frequency from 500 to 700 Hz, probably either by increasing mass or decreasing stiffness. The eigenfrequency at 1600 Hz on the other hand is not affected at all. This is probably because it is an eigenfrequency of only the connector and/or HPFP. The weight and stiffness of the engine or fixture does not affect this eigenfrequency. The hypothesis that newer cars produce higher frequency vibrations than older cars and that it is an additional contribution to fretting, discussed in section 4.4, is partly confirmed. In the constant frequency test in section the high frequency, low displacement vibrations did indeed cause as much fretting damage to the connector as the low frequency, high displacement vibrations. Additional effort towards developing fretting resistant connectors is even more important as the development for more efficient combustion engines progresses. The Sumitomo connector only has one fastener and is asymmetrical. The result is that the connector has three degrees of freedom around the fastener, one for each rotational direction. This introduces rotational movement around the fastener. Rotational fretting and torsional fretting, discussed in section 2.1, will be present in a larger extent resulting in higher terminal relative displacement. The Yazaki connector has two fasteners, resulting in a better and firmer attachment to the male casing. As there still are very large vibrations for the female outer casing, the two fasteners could act as a hinge. One degree of freedom remains, that is the rotation in the X-direction. An even more stable connection would be preferable, which would require three or more fasteners to eliminate all degrees of freedom. Connectors with a round screw attachment also eliminate all degrees of freedom. When the input signal for the shaker rig was designed there was discussion on how to design it. The test had to be as close to reality as possible. Two different types of signals were designed. In addition to the constant acceleration sine sweep used in the test, a more complicated vibration schedule was tested. The theory was that it would follow the engine vibration test results in a more realistic way. The acceleration was designed as a variable that follows the results from engine vibration test, in a simplified way. See appendix 7. The aim was to see if the displacement of the connector in the connector vibration test would follow that of the engine vibration test in a larger extent. But as the fixture and engine differs so much in properties, the result was a worse representation than simply using a constant acceleration, which also has the benefit of easily being able to spot resonance. The test of the realistic vibration schedule was excluded from the results. It was decided that using the sine sweep with constant acceleration is a good enough approximation and gives a larger control of the parameters. This made it easier to analyse and draw conclusions from the results. When performing the tests, it was very soon discovered that the vibration results were dependent on how long the connector had been used for the tests. A fatigue parameter was present. A probable area where fatigue was considerable is the female outer casing to male casing friction wear areas, seen in figure 66, figure 67 and figure 68. To ensure the results from the different test were still comparable, the components were frequently replaced with new ones. This included the HPFP itself and the female connector. It was also validated that the new parts displayed the same results by running the exact same test on several new 43
51 components. To understand why there was fatigue and what caused it, tests were made to determine which components affected the fatigue behavior. On the female connector, components were replaced one by one. The outer casing, inner casing, springs and terminals were replaced. The conclusion is that the outer plastic casing gets worn out considerably, resulting in time depending vibrations. The other components displayed no fatigue behavior in these short tests. 44
52 6. Summary The process of validating the Yazaki connector in this thesis could be used for other connectors as well. To analyse the connector in a connector vibration test with laser vibrometry before using it in prototype cars could save weeks in trial and error engine vibration tests. The acceleration the connector is exposed to can be approximated with engine vibration tests and used to set up the connector vibration test. The key questions asked in the introduction can be answered after analysing the tests done in the connector vibration test. How can the relative displacement between the terminals be measured effectively? Laser vibrometers give more accurate results than accelerometers. It is only suited for measurement in laboratory environments. This is due to the accessibility of the connectors as well as the size of the lasers themselves. Where lasers can t be used, an accelerometer can be used for a rough estimation of the terminal movement. The terminal relative displacement can in some instances be higher than the individual terminal displacement, as seen in the engine vibration test in section 4. In the connector vibration test, see section 5.4.5, the male casing gave a good estimation of the male terminal displacement. The conclusion is that measuring with an accelerometer on the male casing together with a safety factor is best suited for terminal relative displacement approximation. What determines dangerous properties of a connector? In section it was discovered that the resonating vibrations originates from the HPFP. Even when removing the male part of the connector with a saw, the tendency for resonance remained at 700, 800 and 1600 Hz. In section it was beneficial to dampen the female outer casing with a stripe. It did not reduce the terminal relative displacement, but it did considerably reduce the female outer casing displacement. Having the female outer casing undamped and left with one degree of freedom, i.e. the original setup, displayed higher than necessary displacement amplitudes. This causes considerable fatigue wear for the female outer casing, shown in section Additional tests have to be made in order to conclude whether or not this impacts fretting. Using a connector with several independent parts, i.e. the Yazaki connector, displays good properties for the terminal displacement. When the parts were glued together in section 5.4.6, the terminal displacement increased 2-3 times. This is also enforced by the large fretting damages in the Sumitomo connector, which is in one solid part, shown in appendix 2. What can be done to change a dangerous frequency and the vibration amplitude of that frequency? It was very difficult to move an eigenfrequency in the frequency spectra by adjusting the mass and stiffness of the connector by the means that were available. However, the displacement amplitudes could be adjusted. Eliminating all degrees of freedom and limiting the displacement of the female outer casing as discussed in section 5.5. Implementing vibration absorbers in the connector that reduces the vibrations for the terminals. This phenomenon was observed when gluing the parts of the connector together, see section
53 Doing a structural analysis of the HPFP and improving the damping could prove efficient. Is the weight of accelerometers a considerable parameter? In section the tests of adding weights showed that the added weight did have an impact on the connector displacement. The weight of the accelerometers displayed influence on neither the eigenfrequencies nor displacement amplitudes in the connector vibration tests. The conclusion is that the accelerometers have impact, but it is negligible. 46
54 6.1 Future work A lot of interesting results have been observed and that has raised new questions. Several of these questions are not answered in this thesis due to lack of time. The following section lists interesting questions that could be answered in future work. When running the connector vibration test for constant frequencies, there were considerable heat development that changed the behaviour of the connector. Testing how fretting and terminal relative displacement is affected by temperature could provide some interesting results. As was explained in the discussion section, the female outer casing displayed considerable fatigue behavior. It would be interesting to determine if this has any effect on the actual fretting, or only on the plastic casing. When using the PDV-100 lasers, which uses a Doppler technique, only the perpendicular direction to the surface can be measured. To be able to analyze the results deeper, it would be preferable if the laser could measure the vibration in all directions. There are techniques that are able to do this, e.g. triangulating lasers. There are however challenges. The laser has to be very close to the measuring point and the holes drilled in the connector have to be wider. A validation of this technique is needed. During this thesis, a lot of effort was put into trying to perform a connector vibration test on the Sumitomo connector and its corresponding HPFP. It would have been preferable to directly compare the results from the Yazaki and Sumitomo vibration tests. Unfortunately, all of the Sumitomo HPFP at Volvo Cars was discarded when it was decided that it was being replaced by the Yazaki connector. In future works at Volvo Cars, additional tests to compare different types of connectors is recommended. In appendix 8 you can see that a lot of displacement was measured in the Z-direction when running the test in Y-direction. The frequency for which the vibrations spike in Z-directions is 725 Hz. That is, the same frequency as the eigenfrequency of the first eigenmode. This is an interesting phenomena and could be explored further. The eigenfrequency at 1600 Hz caused more fretting than the eigenfrequency at 700 Hz, even though the terminal relative displacement at 700 Hz was larger. The vibration rig available at Volvo Cars couldn t generate vibrations above 2 khz. Using a better rig and testing eigenfrequencies above 2 khz is another suggestion. 47
55 7. References [1] Volvo Car Corporation. This is Volvo Car Group Available at: (Accessed ) [2] J. Swingler and J. W. McBride. The synergistic relationship of stressesin the automotive connector. In Proc. 19th Int. Conf. Electric Contact Phenom., Nuremburg, Germany. pp , [3] Y. Mutoh et al. Fretting Fatigue: Advances in Basic Understanding and Applications West Conshohocken: ASTM International [4] Y. W. Park, G. N. K. Ramesh Bapu, and K. Y. Lee. The influence of current load on fretting of electrical contacts. In Tribol. Int., vol. 42, no. 5, , [5] S. Sawada, K. Shimizu, S. Shimada and Y. Hattori. Prediction of electrical contact resistance of tin-plated and silver-plated terminals, [6] M. Antler and M. H. Drozdowicz. Fretting corrosion of gold-plated connector contacts. In Wear. Vol , [7] C. Evans. Connector finishes. In IEEE Transactions on components, packaging and manufacturing technology. Vol 3, no , [8] J. Song et al. Corrosion Protection of Electrically Conductive Surfaces, Ostwestfalen- Lippe: University of Applied Sciences, [9] Y. Xing and W. Xu, Signal Analysis of Fretting Damages on Electrical Connector Systems, Blekinge: Blekinge Institute of Technology, [10] Y. W. Park, J. P. Jung and K. Y. Lee, Overview of Fretting Corrosion in Electrical Connectors. In Int. J. Automotive Technology. Vol 7, no [11] S. Hannel et al. The fretting sliding transition as a criterion for electrical contact performance. In Wear. Vol , [12] R. B. Waterhouse, Fretting corrosion, Oxford: Pergamon, [13] O. Vingsbo and S. Soderberg. On fretting maps. In Wear. Vol , 1988 Wear, 126 (1988), pp [14] S. Fouvry, V. Fridrici, C. Langlade, P. Kapsa and L. Vincent. Palliatives in Fretting: A Dynamical Approach. In Tribology International. vol [15] M. H. Zhu and Z. R. Zhou. On the mechanisms of various fretting wear modes. In Tribology international. Vol 44, no ,
56 [16] J. A. Williams, Engineering Tribology, New York: Oxford University Press, 1994 [17] Y. T. Kim, I. H. Sung, J. S. Kim and D. E. Kim. Effects of contact conditions on the connector electrical resistance of direct current circuits. In Int. J. Precision Engineering and Manufacturing. Vol 5, no [18] Volvo Car Corporation. Unpublished data [19] G. Jönsson, Våglära och optik, Stockholm, Teach support, 1995 [20] Cyberman, Vibration damping, 2002, Available at: (Accessed ) [21] Polytec, PDV-100 Portable Digital Vibrometer. 2018, Available at: [22] Siemens PLM. What s an order?, 2016, Available at: Order/ta-p/ (Accessed ) [23] E. Prestini, The Evolution of Applied Harmonic Analysis: Models of the Real World, Berlin, Birkhäuser, [24] R. A. Serway et al. Physics for Scientists and Engineers. Brooks/Cole [25] E. Sauther, Sine Sweep Vibration Testing for Modal Response Primer, University of Arizona, Tucson, 2013 [26] NTi Audio. FFT Fast Fourier Transform. Available at: (Accessed ) [27] K. Haug and B. Dondlinger, Vehicular Engine Design: Edition 2, New York: Springer,


57 Appendix 1. HPFP mounted on the engine See red circle for HPFP position.


58 2 Previous fretting test results Fretting test results from different test length for both the Sumitomo and Yazaki connectors. The female terminal with its three contact surfaces to the male connector: Yazaki 4h: Sumitomo 4h:


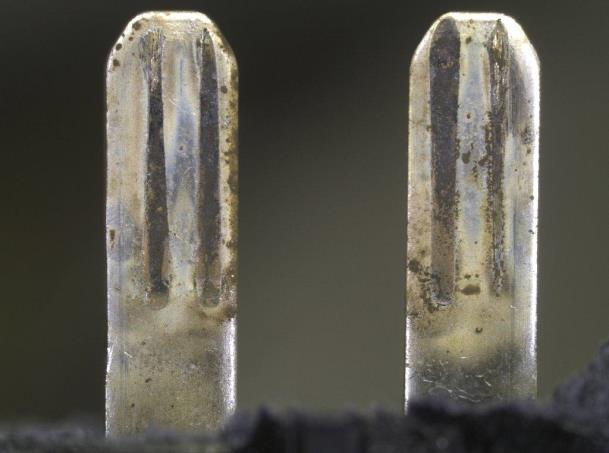
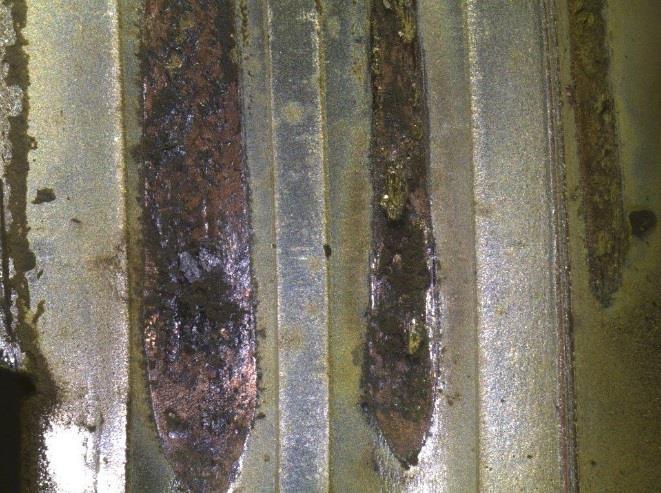
59 Yazaki 500h: Sumitomo 1000h:
60 3. Engine vibration test runs Three engine vibrations test runs of the same engine setup. Run two (red line) was chosen for analysis. One graph for each direction of the accelerometer. X-direction: Y-direction:
61 Z-direction:

62 4. Engine vibration test Displacement in the total direction for the engine run-up. Male (red) and female (green)

63 5. Different springs connector vibration test Three of the 5 different springs tested. These are the medium stiff, least stiff and solid, from left to right. The third is labeled solid as the large diameter made the inner and outer casing stick together. Below is a figure displaying the FFT curves of all the springs used. When using the solid springs, which were almost like gluing the inner and outer casing together, there were less terminal movement at 1600 Hz. The same result as was had when gluing them together. The sample with the medium stiff springs, that were slightly less stiff than the original springs have a rasonance peak at 1050 Hz.
Model Correlation of Dynamic Non-linear Bearing Behavior in a Generator
 Model Correlation of Dynamic Non-linear Bearing Behavior in a Generator Dean Ford, Greg Holbrook, Steve Shields and Kevin Whitacre Delphi Automotive Systems, Energy & Chassis Systems Abstract Efforts to
Vibration Fundamentals Training System
 Vibration Fundamentals Training System Hands-On Turnkey System for Teaching Vibration Fundamentals An Ideal Tool for Optimizing Your Vibration Class Curriculum The Vibration Fundamentals Training System
Response spectrum Time history Power Spectral Density, PSD
 A description is given of one way to implement an earthquake test where the test severities are specified by time histories. The test is done by using a biaxial computer aided servohydraulic test rig.
FRETTING CORROSION ANALYSIS FOR ELECTRICAL TERMINALS OF VEHICLE CONNECTORS
 FRETTING CORROSION ANALYSIS FOR ELECTRICAL TERMINALS OF VEHICLE CONNECTORS A. Bouzera 1, 3, R. El Abdi 2, *, E. Carvou 1, N. Benjemâa 1, L. Tristani 3 and E.M. Zindine 3 1 IPR, Université de Rennes 1,
AGN 008 Vibration DESCRIPTION. Cummins Generator Technologies manufacture ac generators (alternators) to ensure compliance with BS 5000, Part 3.
 to ensure compliance with BS 5000, Part 3.") Application Guidance Notes: Technical Information from Cummins Generator Technologies AGN 008 Vibration DESCRIPTION Cummins Generator Technologies manufacture ac generators (alternators) to ensure compliance
Application Guidance Notes: Technical Information from Cummins Generator Technologies AGN 008 Vibration DESCRIPTION Cummins Generator Technologies manufacture ac generators (alternators) to ensure compliance
Active Vibration Isolation of an Unbalanced Machine Tool Spindle
 Active Vibration Isolation of an Unbalanced Machine Tool Spindle David. J. Hopkins, Paul Geraghty Lawrence Livermore National Laboratory 7000 East Ave, MS/L-792, Livermore, CA. 94550 Abstract Proper configurations
Module 5: Experimental Modal Analysis for SHM Lecture 36: Laser doppler vibrometry. The Lecture Contains: Laser Doppler Vibrometry
 The Lecture Contains: Laser Doppler Vibrometry Basics of Laser Doppler Vibrometry Components of the LDV system Working with the LDV system file:///d /neha%20backup%20courses%2019-09-2011/structural_health/lecture36/36_1.html
Resonance Tube. 1 Purpose. 2 Theory. 2.1 Air As A Spring. 2.2 Traveling Sound Waves in Air
 Resonance Tube Equipment Capstone, complete resonance tube (tube, piston assembly, speaker stand, piston stand, mike with adapters, channel), voltage sensor, 1.5 m leads (2), (room) thermometer, flat rubber
(i) Sine sweep (ii) Sine beat (iii) Time history (iv) Continuous sine
 Sine sweep (ii) Sine beat (iii) Time history (iv) Continuous sine") A description is given of one way to implement an earthquake test where the test severities are specified by the sine-beat method. The test is done by using a biaxial computer aided servohydraulic test
A description is given of one way to implement an earthquake test where the test severities are specified by the sine-beat method. The test is done by using a biaxial computer aided servohydraulic test
CONCEPTUAL DESIGN OF A FRETTING FATIGUE TESTING DEVICE
 CONCEPTUAL DESIGN OF A FRETTING FATIGUE TESTING DEVICE N. Borms 1, D. De Schamphelaere 1, J. De Pauw 2, P. De Baets 2, W. De Waele 2 2 1 Ghent University, Belgium Ghent University, Laboratory Soete, Belgium
SHOCK AND VIBRATION RESPONSE SPECTRA COURSE Unit 4. Random Vibration Characteristics. By Tom Irvine
 SHOCK AND VIBRATION RESPONSE SPECTRA COURSE Unit 4. Random Vibration Characteristics By Tom Irvine Introduction Random Forcing Function and Response Consider a turbulent airflow passing over an aircraft
430. The Research System for Vibration Analysis in Domestic Installation Pipes
 430. The Research System for Vibration Analysis in Domestic Installation Pipes R. Ramanauskas, D. Gailius, V. Augutis Kaunas University of Technology, Studentu str. 50, LT-51424, Kaunas, Lithuania e-mail:
FLUCTUATION OF CONTACT VOLTAGE DURING FRETTING PHASES
 FLUCTUATION OF CONTACT VOLTAGE DURING FRETTING PHASES Rochdi El Abdi 1, Sofiane El Mossouess 2, Noureddine Benjemâa 3, ErwannCarvou 4, Laurent Doublet 5 1 Université de Rennes1- Institut de Physique de
2 Study of an embarked vibro-impact system: experimental analysis
 2 Study of an embarked vibro-impact system: experimental analysis This chapter presents and discusses the experimental part of the thesis. Two test rigs were built at the Dynamics and Vibrations laboratory
A Mathematical Model to Determine Sensitivity of Vibration Signals for Localized Defects and to Find Effective Number of Balls in Ball Bearing
 A Mathematical Model to Determine Sensitivity of Vibration Signals for Localized Defects and to Find Effective Number of Balls in Ball Bearing Vikram V. Nagale a and M. S. Kirkire b Department of Mechanical
PeakVue Analysis for Antifriction Bearing Fault Detection
 Machinery Health PeakVue Analysis for Antifriction Bearing Fault Detection Peak values (PeakVue) are observed over sequential discrete time intervals, captured, and analyzed. The analyses are the (a) peak
Preliminary study of the vibration displacement measurement by using strain gauge
 Songklanakarin J. Sci. Technol. 32 (5), 453-459, Sep. - Oct. 2010 Original Article Preliminary study of the vibration displacement measurement by using strain gauge Siripong Eamchaimongkol* Department
CHAPTER 5 FAULT DIAGNOSIS OF ROTATING SHAFT WITH SHAFT MISALIGNMENT
 66 CHAPTER 5 FAULT DIAGNOSIS OF ROTATING SHAFT WITH SHAFT MISALIGNMENT 5.1 INTRODUCTION The problem of misalignment encountered in rotating machinery is of great concern to designers and maintenance engineers.
A detailed experimental modal analysis of a clamped circular plate
 A detailed experimental modal analysis of a clamped circular plate David MATTHEWS 1 ; Hongmei SUN 2 ; Kyle SALTMARSH 2 ; Dan WILKES 3 ; Andrew MUNYARD 1 and Jie PAN 2 1 Defence Science and Technology Organisation,
EXPERIMENTAL INVESTIGTION OF THE FRETTING PHENOMENON-DEPENDENCE OF NUMBERS CYCLES
 EXPERIMENTAL INVESTIGTION OF THE FRETTING PHENOMENON-DEPENDENCE OF NUMBERS CYCLES ŞTEFAN GHIMIŞI, Constantin Brâncuşi University of Târgu Jiu, Romania,ghimisi@utgjiu.ro Abstract: Fretting damage is often
SAT pickup arms - discussions on some design aspects
 SAT pickup arms - discussions on some design aspects I have recently launched two new series of arms, each of them with a 9 inch and a 12 inch version. As there are an increasing number of discussions
Signal Analysis Techniques to Identify Axle Bearing Defects
 Signal Analysis Techniques to Identify Axle Bearing Defects 2011-01-1539 Published 05/17/2011 Giovanni Rinaldi Sound Answers Inc. Gino Catenacci Ford Motor Company Fund Todd Freeman and Paul Goodes Sound
Resonance Tube. 1 Purpose. 2 Theory. 2.1 Air As A Spring. 2.2 Traveling Sound Waves in Air
 Resonance Tube Equipment Capstone, complete resonance tube (tube, piston assembly, speaker stand, piston stand, mike with adaptors, channel), voltage sensor, 1.5 m leads (2), (room) thermometer, flat rubber
Resonance Tube Lab 9
 HB 03-30-01 Resonance Tube Lab 9 1 Resonance Tube Lab 9 Equipment SWS, complete resonance tube (tube, piston assembly, speaker stand, piston stand, mike with adaptors, channel), voltage sensor, 1.5 m leads
The Air Bearing Throughput Edge By Kevin McCarthy, Chief Technology Officer
 159 Swanson Rd. Boxborough, MA 01719 Phone +1.508.475.3400 dovermotion.com The Air Bearing Throughput Edge By Kevin McCarthy, Chief Technology Officer In addition to the numerous advantages described in
INTRODUCTION: The following paper is intended to inform on the subject at hand and is based on years of laboratory observations.
 INTRODUCTION: The following paper is intended to inform on the subject at hand and is based on years of laboratory observations. Fretting motion, fretting wear, fretting corrosion what does it all mean
Section 2 Lab Experiments
 Section 2 Lab Experiments Section Overview This set of labs is provided as a means of learning and applying mechanical engineering concepts as taught in the mechanical engineering orientation course at
FEM Approximation of Internal Combustion Chambers for Knock Investigations
 2002-01-0237 FEM Approximation of Internal Combustion Chambers for Knock Investigations Copyright 2002 Society of Automotive Engineers, Inc. Sönke Carstens-Behrens, Mark Urlaub, and Johann F. Böhme Ruhr
An Improved Analytical Model for Efficiency Estimation in Design Optimization Studies of a Refrigerator Compressor
 Purdue University Purdue e-pubs International Compressor Engineering Conference School of Mechanical Engineering 2014 An Improved Analytical Model for Efficiency Estimation in Design Optimization Studies
Modal Analysis and Vibration Test of NASA MSFC Shaker Table
 Washington University in St. Louis Washington University Open Scholarship Mechanical Engineering and Materials Science Independent Study Mechanical Engineering & Materials Science 11-11-2018 Modal Analysis
INDUSTRIAL VIBRATION SENSOR SELECTION MADE EASY
 SENSORS FOR RESEARCH & DEVELOPMENT WHITE PAPER #28 INDUSTRIAL VIBRATION SENSOR SELECTION MADE EASY NINE QUESTIONS TO SUCCESSFULLY IDENTIFY THE SOLUTION TO YOUR APPLICATION www.pcb.com info@pcb.com 800.828.8840
FIRST MEASUREMENTS FROM A NEW BROADBAND VIBROTHERMOGRAPHY MEASUREMENT SYSTEM
 FIRST MEASUREMENTS FROM A NEW BROADBAND VIBROTHERMOGRAPHY MEASUREMENT SYSTEM Stephen D. Holland 1 Center for NDE and Aerospace Eng Dept, Iowa State Univ, Ames, Iowa 50011 ABSTRACT. We report on the construction
Wire feeding systems for welding applications
 Wire feeding systems for welding applications The perfect drive package! u precise wire feeding u modern drive concept u fully digitalized process control u detailed monitoring u maximum production reliability
Lab 2b: Dynamic Response of a Rotor with Shaft Imbalance
 Lab 2b: Dynamic Response of a Rotor with Shaft Imbalance OBJECTIVE: To calibrate an induction position/displacement sensor using a micrometer To calculate and measure the natural frequency of a simply-supported
Shaft Vibration Monitoring System for Rotating Machinery
 2016 Sixth International Conference on Instrumentation & Measurement, Computer, Communication and Control Shaft Vibration Monitoring System for Rotating Machinery Zhang Guanglin School of Automation department,
Dynamic Vibration Absorber
 Part 1B Experimental Engineering Integrated Coursework Location: DPO Experiment A1 (Short) Dynamic Vibration Absorber Please bring your mechanics data book and your results from first year experiment 7
SENSOR AND MEASUREMENT EXPERIMENTS
 SENSOR AND MEASUREMENT EXPERIMENTS Page: 1 Contents 1. Capacitive sensors 2. Temperature measurements 3. Signal processing and data analysis using LabVIEW 4. Load measurements 5. Noise and noise reduction
Smart design piezoelectric energy harvester with self-tuning
 Smart design piezoelectric energy harvester with self-tuning L G H Staaf 1, E Köhler 1, P D Folkow 2, P Enoksson 1 1 Department of Microtechnology and Nanoscience, Chalmers University of Technology, Gothenburg,
Fretting Wear Failures In Bearing Steel EN31 Mated Against Structural Steel EN 24
 Fretting Wear Failures In Bearing Steel EN31 Mated Against Structural Steel EN 24 R Ramesh and R Gnanamoorthy Department of Mechanical Engineering Indian Institute of Technology Madras CHENNAI 600 036
Analysis on Drill String Vibration Signal of Stick Slip and Bit Bouncing
 Advances in Petroleum Exploration and Development Vol. 8, No., 014, pp. 1-5 DOI:10.3968/607 ISSN 195-54X [Print] ISSN 195-5438 [Online] www.cscanada.net www.cscanada.org Analysis on Drill String Vibration
Active Vibration Control in Ultrasonic Wire Bonding Improving Bondability on Demanding Surfaces
 Active Vibration Control in Ultrasonic Wire Bonding Improving Bondability on Demanding Surfaces By Dr.-Ing. Michael Brökelmann, Hesse GmbH Ultrasonic wire bonding is an established technology for connecting
ULTRASONIC GUIDED WAVES FOR AGING WIRE INSULATION ASSESSMENT
 ULTRASONIC GUIDED WAVES FOR AGING WIRE INSULATION ASSESSMENT Robert F. Anastasi 1 and Eric I. Madaras 2 1 U.S. Army Research Laboratory, Vehicle Technology Directorate, AMSRL-VT-S, Nondestructive Evaluation
Physics 4C Chabot College Scott Hildreth
 Physics 4C Chabot College Scott Hildreth The Inverse Square Law for Light Intensity vs. Distance Using Microwaves Experiment Goals: Experimentally test the inverse square law for light using Microwaves.
Void Reduction in Reflow Soldering Processes by Sweep Stimulation of PCB Substrate
 Void Reduction in Reflow Soldering Processes by Sweep Stimulation of PCB Substrate Viktoria Rawinski Ersa GmbH Wertheim, Germany Abstract Due to the ongoing trend towards miniaturization of power components,
Fastener Hole Crack Detection Using Adjustable Slide Probes
 Fastener Hole Crack Detection Using Adjustable Slide Probes General The guidelines for the adjustable sliding probes are similar to the fixed types, therefore much of the information that is given here
profile Using intelligent servo drives to filter mechanical resonance and improve machine accuracy in printing and converting machinery
 profile Drive & Control Using intelligent servo drives to filter mechanical resonance and improve machine accuracy in printing and converting machinery Challenge: Controlling machine resonance the white
Materials Removal Processes (Machining)
") Chapter Six Materials Removal Processes (Machining) 6.1 Theory of Material Removal Processes 6.1.1 Machining Definition Machining is a manufacturing process in which a cutting tool is used to remove excess
Chapter Six Materials Removal Processes (Machining) 6.1 Theory of Material Removal Processes 6.1.1 Machining Definition Machining is a manufacturing process in which a cutting tool is used to remove excess
Distortion in acoustic emission and acceleration signals caused by frequency converters
 Distortion in acoustic emission and acceleration signals caused by frequency converters Sulo Lahdelma, Konsta Karioja and Jouni Laurila Mechatronics and Machine Diagnostics Laboratory, Department of Mechanical
Bearing fault detection of wind turbine using vibration and SPM
 Bearing fault detection of wind turbine using vibration and SPM Ruifeng Yang 1, Jianshe Kang 2 Mechanical Engineering College, Shijiazhuang, China 1 Corresponding author E-mail: 1 rfyangphm@163.com, 2
Spall size estimation in bearing races based on vibration analysis
 Spall size estimation in bearing races based on vibration analysis G. Kogan 1, E. Madar 2, R. Klein 3 and J. Bortman 4 1,2,4 Pearlstone Center for Aeronautical Engineering Studies and Laboratory for Mechanical
Conventional geophone topologies and their intrinsic physical limitations, determined
 Magnetic innovation in velocity sensing Low -frequency with passive Conventional geophone topologies and their intrinsic physical limitations, determined by the mechanical construction, limit their velocity
JDT EFFECT OF GRINDING WHEEL LOADING ON FORCE AND VIBRATION
 JDT-012-2014 EFFECT OF GRINDING WHEEL LOADING ON FORCE AND VIBRATION R. Anbazhagan 1, Dr.J.Hameed Hussain 2, Dr.V.Srinivasan 3 1 Asso.Professor, Department of Automobile Engineering, Bharath University,
Quartz Lock Loop (QLL) For Robust GNSS Operation in High Vibration Environments
 For Robust GNSS Operation in High Vibration Environments") Quartz Lock Loop (QLL) For Robust GNSS Operation in High Vibration Environments A Topcon white paper written by Doug Langen Topcon Positioning Systems, Inc. 7400 National Drive Livermore, CA 94550 USA
Quartz Lock Loop (QLL) For Robust GNSS Operation in High Vibration Environments A Topcon white paper written by Doug Langen Topcon Positioning Systems, Inc. 7400 National Drive Livermore, CA 94550 USA
AN5E Application Note
 Metra utilizes for factory calibration a modern PC based calibration system. The calibration procedure is based on a transfer standard which is regularly sent to Physikalisch-Technische Bundesanstalt (PTB)
Module 4 TEST SYSTEM Part 2. SHAKING TABLE CONTROLLER ASSOCIATED SOFTWARES Dr. J.C. QUEVAL, CEA/Saclay
 Module 4 TEST SYSTEM Part 2 SHAKING TABLE CONTROLLER ASSOCIATED SOFTWARES Dr. J.C. QUEVAL, CEA/Saclay DEN/DM2S/SEMT/EMSI 11/03/2010 1 2 Electronic command Basic closed loop control The basic closed loop
VIBRATIONAL TESTING OF A FULL-SCALE PILE GROUP IN SOFT CLAY
 VIBRATIONAL TESTING OF A FULL-SCALE PILE GROUP IN SOFT CLAY Marvin W HALLING 1, Kevin C WOMACK 2, Ikhsan MUHAMMAD 3 And Kyle M ROLLINS 4 SUMMARY A 3 x 3 pile group and pile cap were constructed in a soft
FINITE ELEMENT SIMULATIONS OF THE EFFECT OF FRICTION COEFFICIENT IN FRETTING WEAR
 Proceedings of the 5 th International Conference on Fracture Fatigue and Wear, pp. 58-63, 216 FINITE ELEMENT SIMULATIONS OF THE EFFECT OF FRICTION COEFFICIENT IN FRETTING WEAR T. Yue and M. Abdel Wahab
Acoustic Resonance Analysis Using FEM and Laser Scanning For Defect Characterization in In-Process NDT
 ECNDT 2006 - We.4.8.1 Acoustic Resonance Analysis Using FEM and Laser Scanning For Defect Characterization in In-Process NDT Ingolf HERTLIN, RTE Akustik + Prüftechnik, Pfinztal, Germany Abstract. This
PHYS 3153 Methods of Experimental Physics II O2. Applications of Interferometry
 Purpose PHYS 3153 Methods of Experimental Physics II O2. Applications of Interferometry In this experiment, you will study the principles and applications of interferometry. Equipment and components PASCO
Methods to predict fatigue in CubeSat structures and mechanisms
 Methods to predict fatigue in CubeSat structures and mechanisms By Walter Holemans (PSC), Floyd Azure (PSC) and Ryan Hevner (PSC) 08-09 August 2015 12th Annual Summer CubeSat Developers' Workshop 08-09
Waves and Sound Practice Test 43 points total Free- response part: [27 points]
![Waves and Sound Practice Test 43 points total Free- response part: [27 points]](/thumbs/87/96934113.jpg "Waves and Sound Practice Test 43 points total Free- response part: [27 points]") Name Waves and Sound Practice Test 43 points total Free- response part: [27 points] 1. To demonstrate standing waves, one end of a string is attached to a tuning fork with frequency 120 Hz. The other end
Name Waves and Sound Practice Test 43 points total Free- response part: [27 points] 1. To demonstrate standing waves, one end of a string is attached to a tuning fork with frequency 120 Hz. The other end
eye in hell CD 3002 Sensor Manual
 Your eye in hell CD 3002 Sensor Manual Siemens Laser Analytics AB Oct 2001 CD 3002 Sensor manual Document number: CID 3002-1102 Rev. 2A LDS 3000 Sensor manual Content Content 1. CD 3002 1 1.1 General 1
System Inputs, Physical Modeling, and Time & Frequency Domains
 System Inputs, Physical Modeling, and Time & Frequency Domains There are three topics that require more discussion at this point of our study. They are: Classification of System Inputs, Physical Modeling,
D102. Damped Mechanical Oscillator
 D10. Damped Mechanical Oscillator Aim: design and writing an application for investigation of a damped mechanical oscillator Measurements of free oscillations of a damped oscillator Measurements of forced
Overall vibration, severity levels and crest factor plus
 Overall vibration, severity levels and crest factor plus By Dr. George Zusman, Director of Product Development, PCB Piezotronics and Glenn Gardner, Business Unit Manager, Fluke Corporation White Paper
NINTH INTERNATIONAL CONGRESS ON SOUND AND VIBRATION, ICSV9 ACTIVE VIBRATION ISOLATION OF DIESEL ENGINES IN SHIPS
 Page number: 1 NINTH INTERNATIONAL CONGRESS ON SOUND AND VIBRATION, ICSV9 ACTIVE VIBRATION ISOLATION OF DIESEL ENGINES IN SHIPS Xun Li, Ben S. Cazzolato and Colin H. Hansen Department of Mechanical Engineering,
Very High Frequency Calibration of Laser Vibrometer up to 350 khz
 Very High Frequency Calibration of Laser Vibrometer up to 350 khz Requirements, Solutions and Traceability Dr. Martin Brucke, Frank Schulz There is simply no substitute for knowing what you re doing Jeff
Angle Encoder Modules
 Angle Encoder Modules May 2015 Angle encoder modules Angle encoder modules from HEIDENHAIN are combinations of angle encoders and high-precision bearings that are optimally adjusted to each other. They
Optimizing the Movement of a Precision Piezoelectric Target Positioner. James Baase. Victor Senior High School Rochester, NY
 Optimizing the Movement of a Precision Piezoelectric Target Positioner James Baase Victor Senior High School Rochester, NY Advisors: Gregory Brent, David Lonobile Laboratory for Laser Energetics University
Acceptance test for the linear motion actuator for the scanning slit of the HIE ISOLDE short diagnostic boxes
 EUROPEAN ORGANIZATION FOR NUCLEAR RESEARCH CERN ACC NOTE 2014 0099 HIE ISOLDE PROJECT Note 0036 Acceptance test for the linear motion actuator for the scanning slit of the HIE ISOLDE short diagnostic boxes
ACOUSTIC NOISE AND VIBRATIONS OF ELECTRIC POWERTRAINS
 ACOUSTIC NOISE AND VIBRATIONS OF ELECTRIC POWERTRAINS Focus on electromagnetically-excited NVH for automotive applications and EV/HEV Part 4 NVH experimental characterization of electric chains LE BESNERAIS
EIGEN MODES IDENTIFICATION FOR HYBRID WIRE ROPE ISOLATORS
 The 4th International Conference Advanced Composite Materials Engineering COMAT 2012 18-20 October 2012, Brasov, Romania EIGEN MODES IDENTIFICATION FOR HYBRID WIRE ROPE ISOLATORS D. Buzea 1, L. Kopacz
Presented By: Michael Miller RE Mason
 Presented By: Michael Miller RE Mason Operational Challenges of Today Our target is zero unplanned downtime Maximize Equipment Availability & Reliability Plan ALL Maintenance HOW? We are trying to be competitive
TRI-ALLIANCE FABRICATING Mertztown, PA Job #1
 Report on Vibratory Stress Relief Prepared by Bruce B. Klauba Product Group Manager TRI-ALLIANCE FABRICATING Mertztown, PA Job #1 TRI-ALLIANCE FABRICATING subcontracted VSR TECHNOLOGY to stress relieve
FATIGUE CRACK CHARACTERIZATION IN CONDUCTING SHEETS BY NON
 FATIGUE CRACK CHARACTERIZATION IN CONDUCTING SHEETS BY NON CONTACT STIMULATION OF RESONANT MODES Buzz Wincheski, J.P. Fulton, and R. Todhunter Analytical Services and Materials 107 Research Drive Hampton,
The role of inclination angle, λ on the direction of chip flow is schematically shown in figure which visualizes that,
 EXPERIMENT NO. 1 Aim: To study of Orthogonal & Oblique Cutting on a Lathe. Experimental set up.: Lathe Machine Theoretical concept: It is appears from the diagram in the following figure that while turning
CONTROL IMPROVEMENT OF UNDER-DAMPED SYSTEMS AND STRUCTURES BY INPUT SHAPING
 CONTROL IMPROVEMENT OF UNDER-DAMPED SYSTEMS AND STRUCTURES BY INPUT SHAPING Igor Arolovich a, Grigory Agranovich b Ariel University of Samaria a igor.arolovich@outlook.com, b agr@ariel.ac.il Abstract -
Capacitive MEMS accelerometer for condition monitoring
 Capacitive MEMS accelerometer for condition monitoring Alessandra Di Pietro, Giuseppe Rotondo, Alessandro Faulisi. STMicroelectronics 1. Introduction Predictive maintenance (PdM) is a key component of
THE COEFFICIENT OF FRICȚION IN THE FRETTING PHENOMENON
 THE COEFFICIENT OF FRICȚION IN THE FRETTING PHENOMENON Prof.dr.eng. Stefan GHIMIŞI, Constantin Brâncuşi University of Târgu Jiu,Romania, ssghimisi@gmail.com Abstract: Fretting is now fully identified as
Key Vocabulary: Wave Interference Standing Wave Node Antinode Harmonic Destructive Interference Constructive Interference
 Key Vocabulary: Wave Interference Standing Wave Node Antinode Harmonic Destructive Interference Constructive Interference 1. Work with two partners. Two will operate the Slinky and one will record the
Intermediate and Advanced Labs PHY3802L/PHY4822L
 Intermediate and Advanced Labs PHY3802L/PHY4822L Torsional Oscillator and Torque Magnetometry Lab manual and related literature The torsional oscillator and torque magnetometry 1. Purpose Study the torsional
FORCED HARMONIC MOTION Ken Cheney
 FORCED HARMONIC MOTION Ken Cheney ABSTRACT The motion of an object under the influence of a driving force, a restoring force, and a friction force is investigated using a mass on a spring driven by a variable
New Long Stroke Vibration Shaker Design using Linear Motor Technology
 New Long Stroke Vibration Shaker Design using Linear Motor Technology The Modal Shop, Inc. A PCB Group Company Patrick Timmons Calibration Systems Engineer Mark Schiefer Senior Scientist Long Stroke Shaker
Wavelet Transform for Bearing Faults Diagnosis
 Wavelet Transform for Bearing Faults Diagnosis H. Bendjama and S. Bouhouche Welding and NDT research centre (CSC) Cheraga, Algeria hocine_bendjama@yahoo.fr A.k. Moussaoui Laboratory of electrical engineering
Beating Phenomenon of Multi-Harmonics Defect Frequencies in a Rolling Element Bearing: Case Study from Water Pumping Station
 Beating Phenomenon of Multi-Harmonics Defect Frequencies in a Rolling Element Bearing: Case Study from Water Pumping Station Fathi N. Mayoof Abstract Rolling element bearings are widely used in industry,
Advanced Motion Control Optimizes Laser Micro-Drilling
 Advanced Motion Control Optimizes Laser Micro-Drilling The following discussion will focus on how to implement advanced motion control technology to improve the performance of laser micro-drilling machines.
A training course delivered at a company s facility by Matrix Engineering, an approved provider of Bolt Science Training
 A training course delivered at a company s facility by Matrix Engineering, an approved provider of Bolt Science Training Following is an outline of the material covered in the training course. Each person
Clarification of the Effect of High-Speed Train Induced Vibrations on a Railway Steel Box Girder Bridge Using Laser Doppler Vibrometer
 Clarification of the Effect of High-Speed Train Induced Vibrations on a Railway Steel Box Girder Bridge Using Laser Doppler Vibrometer T. Miyashita, H. Ishii, Y. Fujino Dept of Civil Engineering, University
Modal analysis: a comparison between Finite Element Analysis (FEA) and practical Laser Doppler Vibrometer (LDV) testing.
 and practical Laser Doppler Vibrometer (LDV) testing.") 2017 UKSim-AMSS 19th International Conference on Modelling & Simulation Modal analysis: a comparison between Finite Element Analysis (FEA) and practical Laser Doppler Vibrometer (LDV) testing. Luca Pagano
2017 UKSim-AMSS 19th International Conference on Modelling & Simulation Modal analysis: a comparison between Finite Element Analysis (FEA) and practical Laser Doppler Vibrometer (LDV) testing. Luca Pagano
NON-SELLABLE PRODUCT DATA. Order Analysis Type 7702 for PULSE, the Multi-analyzer System. Uses and Features
 PRODUCT DATA Order Analysis Type 7702 for PULSE, the Multi-analyzer System Order Analysis Type 7702 provides PULSE with Tachometers, Autotrackers, Order Analyzers and related post-processing functions,
Study of Vee Plate Manufacturing Method for Indexing Table
 Study of Vee Plate Manufacturing Method for Indexing Table Yeon Taek OH Department of Robot System Engineering, Tongmyong University 428 Sinseon-ro, Nam-gu, Busan, Korea yeonoh@tu.ac.kr Abstract The indexing
Correction for Synchronization Errors in Dynamic Measurements
 Correction for Synchronization Errors in Dynamic Measurements Vasishta Ganguly and Tony L. Schmitz Department of Mechanical Engineering and Engineering Science University of North Carolina at Charlotte
Abrasive Flow Machining ( AFM ) Semih Sancar Selçuk Ünal Yunus Kocabozdoğan
 Semih Sancar Selçuk Ünal Yunus Kocabozdoğan") Abrasive Flow Machining ( AFM ) Semih Sancar 20622852 Selçuk Ünal 20622976 Yunus Kocabozdoğan 20519809 Goals Getting basic knowledge about AFM Clasification of AFM One-way AFM Two-way AFM Orbital AFM Application
Abrasive Flow Machining ( AFM ) Semih Sancar 20622852 Selçuk Ünal 20622976 Yunus Kocabozdoğan 20519809 Goals Getting basic knowledge about AFM Clasification of AFM One-way AFM Two-way AFM Orbital AFM Application
The ENDEVCO high-g shock triaxial accelerometer: A smaller, more cost-effective solution to making triaxial measurements. Endevco technical paper 334
 The ENDEVCO high-g shock triaxial accelerometer: A smaller, more cost-effective solution to making triaxial measurements Endevco technical paper 334 New VC accelerometer technology for flight test offers
Also, side banding at felt speed with high resolution data acquisition was verified.
 PEAKVUE SUMMARY PeakVue (also known as peak value) can be used to detect short duration higher frequency waves stress waves, which are created when metal is impacted or relieved of residual stress through
Fundamentals of Vibration Measurement and Analysis Explained
 Fundamentals of Vibration Measurement and Analysis Explained Thanks to Peter Brown for this article. 1. Introduction: The advent of the microprocessor has enormously advanced the process of vibration data
Texas Components - Data Sheet. The TX53G1 is an extremely rugged, low distortion, wide dynamic range sensor. suspending Fluid.
 Texas Components - Data Sheet AN004 REV A 08/30/99 DESCRIPTION and CHARACTERISTICS of the TX53G1 HIGH PERFORMANCE GEOPHONE The TX53G1 is an extremely rugged, low distortion, wide dynamic range sensor.
Range Sensing strategies
 Range Sensing strategies Active range sensors Ultrasound Laser range sensor Slides adopted from Siegwart and Nourbakhsh 4.1.6 Range Sensors (time of flight) (1) Large range distance measurement -> called
Natural Frequency Measurement
 Natural Frequency Measurement 'Frequently Asked Questions' F 1 What is the motivation for 'natural frequency testing'? There are different applications which make use of this kind of test: A: Checking
Application of optical measurement techniques for experimental modal analyses of lightweight structures
 Application of optical measurement techniques for experimental modal analyses of lightweight structures C. Schedlinski, J. Schell, E. Biegler, J. Sauer ICS Engineering GmbH Am Lachengraben, Dreieich, Germany