From Tables to Graphs*
|
|
|
- Imogen Dean
- 5 years ago
- Views:
Transcription
1 From Tables to Graphs* * The views expressed in this presentation are those of the author and does not necessarily reflect the policy of TurkStat TurkStat Expert serhat.atakul@tuik.gov.tr Training Course on Development of Dissemination Methods Kuwait December
2 Per cent girls given the first name Anne each year Year: Pct.: Year: Pct.: Year: Pct.: Year: Pct.: Year: Pct.: Year: Pct.: , , , , , , , , , , , , , , , , , , , , , , , , , , , , , , , , , , , , , , , , , , , , , , , , , , , , , , , , , , , , , , , , , , , , , , , , , , , , , , , , , , , , , , , , , , , , , , , , , , , , , , , , , , , , , , , , , , , , , , , , , , , , , , , , , , , ,36
3 Graphs speak directly to the eye!
4 Why graphs? Graphs encourage comparison of trends and analysis of differences and relationships In addition, graphs compress data; they have high data density Graphs are eye catchers
5 How to lie with graphs Increase of 600 %?! q q q q q q q q q q 99 No, only 35%!

6 How to lie with graphs

7 From: Capmas/Press release on "Annual Bulletin of Culture Statistics in 2010"
8
9
10 But When you compare groups its OK to break the value axis
11 Graphs: Issues and solutions Legend: Where to place it?

12 Graphs: Issues and solutions Should values be given in the graph?


13 Which type of graph to use Men Women Men Women Women Men 100% 90% 80% 70% 60% 50% 40% 30% 20% 10% 0% Men Women 100% 90% 80% 70% 60% 50% 40% 30% 20% 10% 0% Women Men Women 39% Men 61% Women 53% 2012 Men 47%
14 Bar charts (vertical) Millions Denmark Finland Norw ay Sw eden The simplest and most basic chart type Used to show absolute or relative frequencies, percentages, averages
15 Bar charts (vertical) Millions Denmark Finland Norw ay Sw eden With only one classification variable it is best to use only one colour/pattern
16 Bar charts (vertical) Millions Denmark Finland Norway Sweden If you want to focus on one class/group, this can be done by using a different colour/pattern When both positive and negative values are plotted, use different colours/ patterns


17 Grouped bar charts Two (or more) categories Example: Percent using a library last year. Males and females in various age groups With two categories, we have two ways of grouping, inviting to different comparison


18 40 35 Ariving foreigners Arriving citizens

19 3D bar charts Women and Men in the Republic of Belarus, 2010

20 Stacked bar charts Show total frequency and how the total is divided into different components

21 Stacked bar charts Kazakhstan
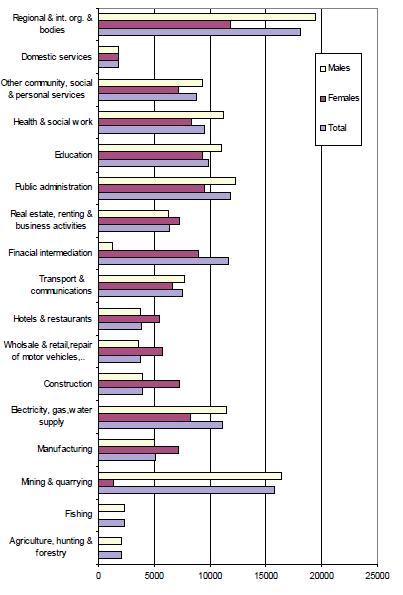
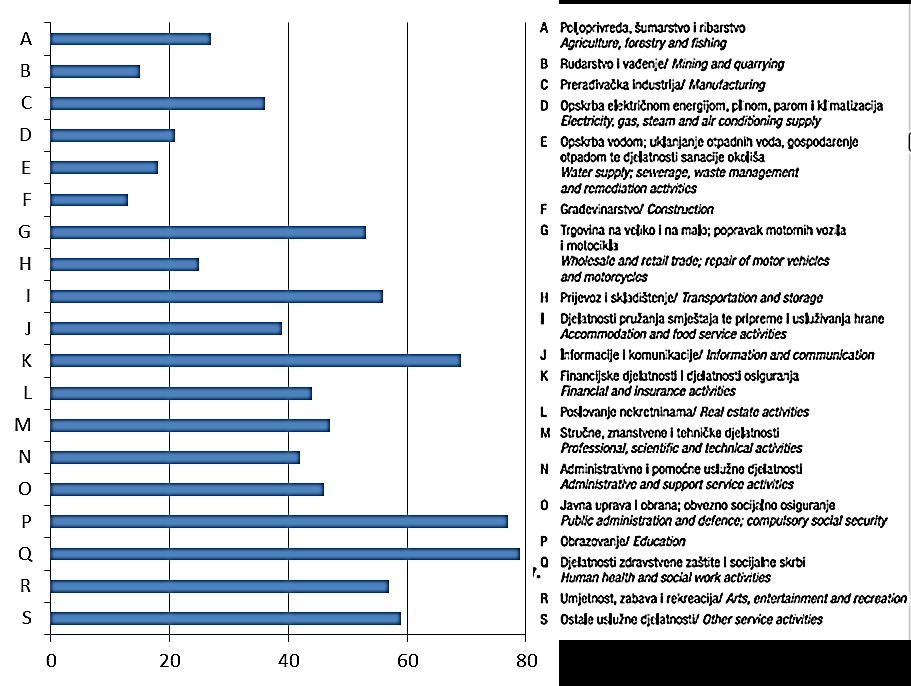
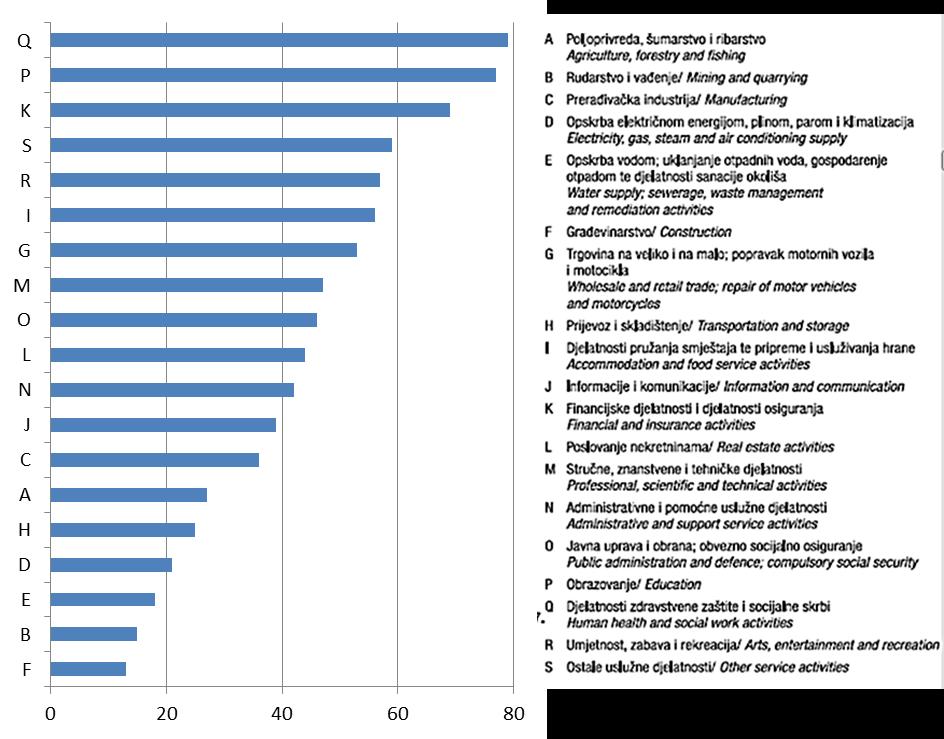
22 Horizontal bar charts Zambia Uganda South Africa Mozambique Malawi Madagascar Kenya Eritrea Angola South Africa Kenya Uganda Mozambique Madagascar Angola Malawi Zambia Eritrea Often used when labels (variable names) are long when there are many variables or classifications

23 From: QSA/LF Survey
24 24
25 25
26
27
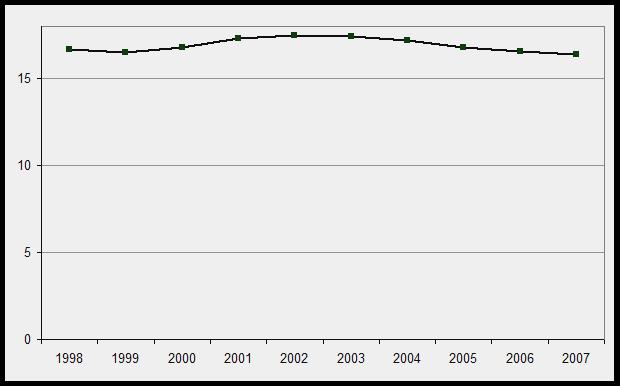
28 Line charts Most often used for time series = years, quarters, months, weeks, days, hours and minutes + age What is a time series? Minimum = 4 data points? Up to 4, use vertical bar chart The longer series, the better?!
29 Line charts: Symbols Indicators or symbols ( ) are often used to differentiate between series, but these symbols overload the chart
30 Line charts It is better to use different colours and/or line styles

31 From: Pakistan Labour Force Survey
32

33 Spagetti: Don t use too many lines!
34 Standard line charts A time series requires at least 4? data points (if not: use bar chart) Be careful when the data points are not evenly spaced; like 1990, 1995, 2000, 2005, 2010 and 2011
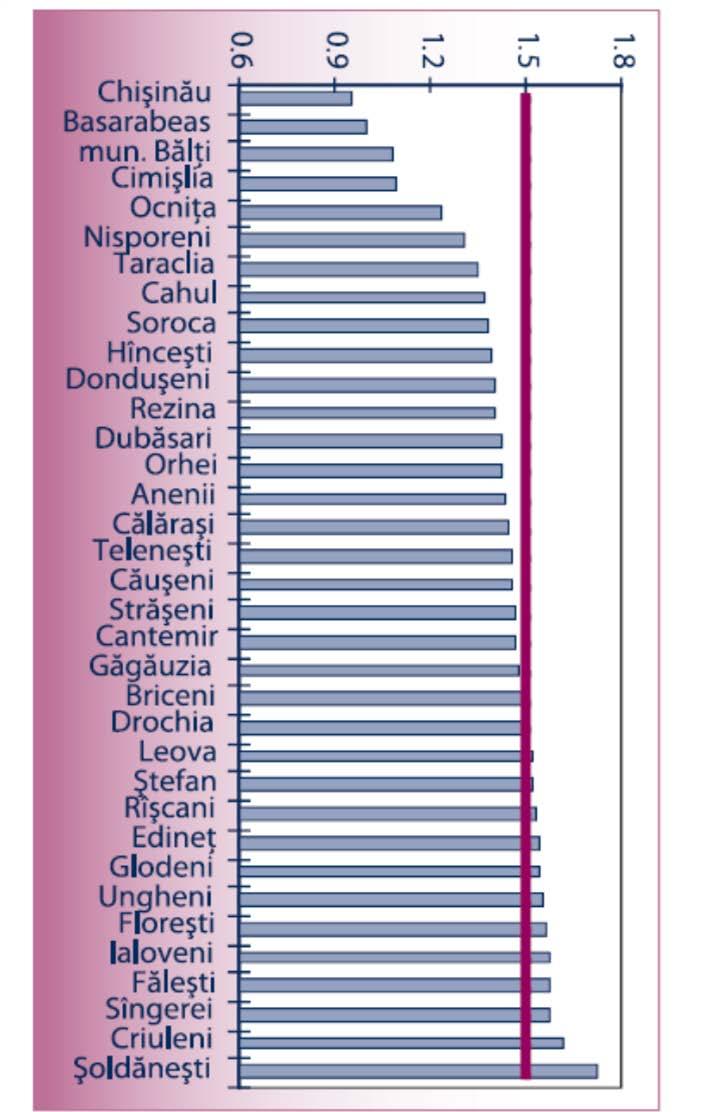
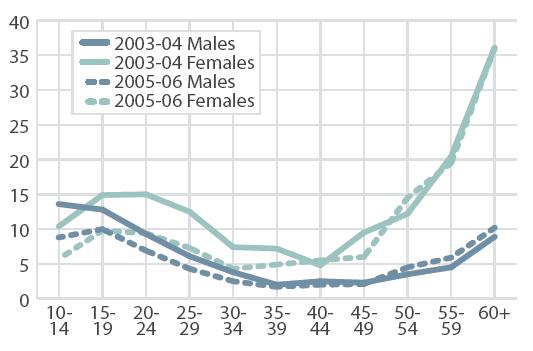
35 Line graphs should never be used to illustrate differences between group, for instance countries Sri Lanka Malaysia China Philippines Thailand Indonesia Pakistan Bhutan India Bangla Desh

36 Women and Men in Moldova

37 Index 2004 = Accidents + 141% + 96% Iinjured Killed %

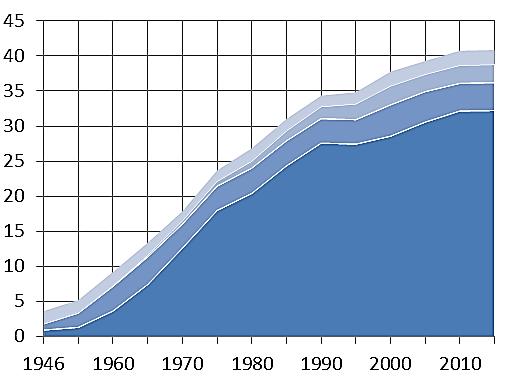
38 Area charts Area charts are accumulated line charts; like stacked bars. Show total and parts. Don t use with too many groups/values


39 Pie charts Shows distribution of (qualitative) variables No axis Total area = 100% Instead of legend......use labels. Since pie charts have no value axis, show percentage Maximum 5 values?
40
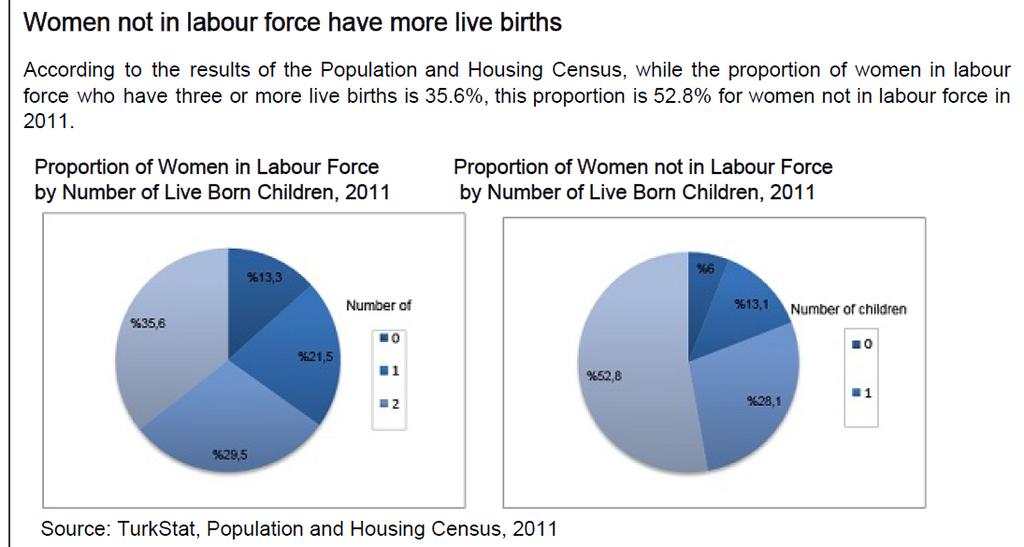
41 TITLE: Number of live born children by women in the labour force No children 13,3 % 3 children + 35,6 % 1 child 21,5 % 2 children 29,5 %

42 Pie charts Pie charts should never be used to illustrate time series

43 %

44 Don t add up apples and oranges Here: Births and deaths


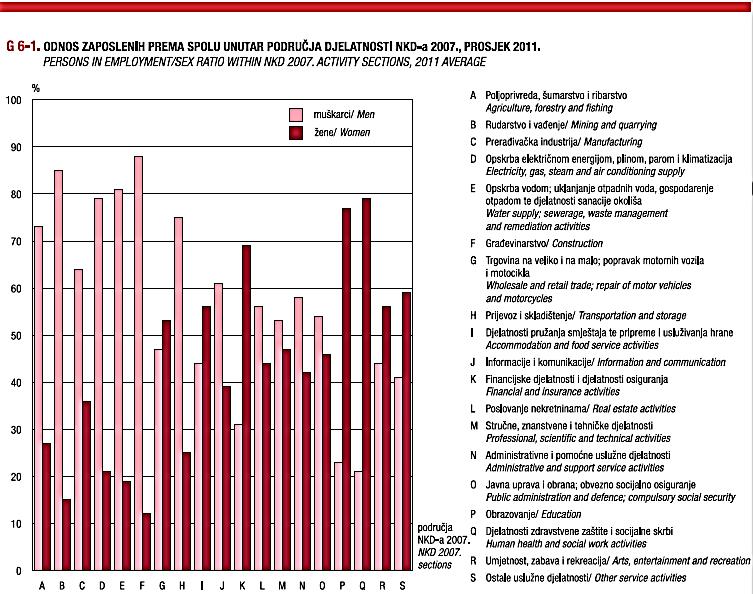
45 Keep it simple Percentage women and men employed in the private sector
46
47
48

49 Summary: Keep it simple: Use maximum 5 groups/categories:

50 For discussion: Is this graph user-friendly? How could it be improved?
51 Daily time use. Men and women 10 yrs+, 2012 Men 9,0 4,9 3,4 1,8 1,8 1,3 0,9 0,8 Women 9,2 3,8 2,2 4,1 1,8 1,2 0,8 0, Sleep Work Eating Hours Leisure Leisure? Houshold work Personal care Learning
52 Hours ,8 Learning 0,8 0,8 Personal care 0,9 1,2 Household work 1,3 1,8 Leisure? 1,8 1,8 Leisure 4,1 3,4 2,2 Eating 12 3,8 Work 4, ,2 Sleep 9,0 0 Women Men
53 Hours/minutes 24 0:48 0:48 1:15 Learning Personal care Household work 0:49 0:55 1: :51 Leisure? 1:51 4:06 Leisure 1:51 16 Eating 3:23 2: :47 Work 4: :11 Sleep 9:01 0 Women Men
54
WRITING ABOUT THE DATA
 WRITING ABOUT THE DATA 2nd TRAINING WORKSHOP Project to strengthen national capacity in producing and disseminating vital statistics from civil registration records in Asia and the Pacific Bangkok, Thailand,
Monthly Summary of Troop Contribution to UN Operations
 Monthly Summary of Troop Contribution to UN Operations Month of Report : 3-Dec-3 Country Description of Post M F Totals ) Albania Individual Police............ 0 Subtotal for Country ) Algeria Experts
Dutch Good Growth Fund
 Dutch Good Growth Fund Bridging the SME Financing Gap Topsectoren overleg 15 janauri 2015 Selwyn Moons Deputy Director Sustainable Economic Development Department Ministry of Foreign Affairs 1 Agenda Aid
Brochure More information from
 Brochure More information from http://www.researchandmarkets.com/reports/1342464/ The World Market for Stranded Wire, Cable, Ropes, and Plaited Bands of Iron, Steel, Copper, or Aluminum Excluding Electrically
Statistics. Graphing Statistics & Data. What is Data?. Data is organized information. It can be numbers, words, measurements,
 Statistics Graphing Statistics & Data What is Data?. Data is organized information. It can be numbers, words, measurements, observations or even just descriptions of things. Qualitative vs Quantitative.
Purpose. Charts and graphs. create a visual representation of the data. make the spreadsheet information easier to understand.
 Purpose Charts and graphs are used in business to communicate and clarify spreadsheet information. convert spreadsheet information into a format that can be quickly and easily analyzed. make the spreadsheet
A Visual Display. A graph is a visual display of information or data. This is a graph that shows a girl walking her dog. Communicating with Graphs
 A Visual Display A graph is a visual display of information or data. This is a graph that shows a girl walking her dog. A Visual Display The horizontal axis, or the x-axis, measures time. Time is the independent
Who Reads and Who Follows? What analytics tell us about the audience of academic blogging Chris Prosser Politics in
 Who Reads and Who Follows? What analytics tell us about the audience of academic blogging Chris Prosser Politics in Spires @caprosser 1 What do we want to know about the audience for academic blogging?
SS Understand charts and graphs used in business.
 SS2 2.02 Understand charts and graphs used in business. Purpose of Charts and Graphs 1. Charts and graphs are used in business to communicate and clarify spreadsheet information. 2. Charts and graphs emphasize
Graphing Guidelines. Controlled variables refers to all the things that remain the same during the entire experiment.
 Graphing Graphing Guidelines Graphs must be neatly drawn using a straight edge and pencil. Use the x-axis for the manipulated variable and the y-axis for the responding variable. Manipulated Variable AKA
STATUS OF CONTRIBUTIONS TO THE SIXTH REPLENISHMENT OF IFAD S RESOURCES
 Distribution: Restricted EB 2003/79/R.9/Add.1 10 September 2003 Original: English Agenda Item 8(b) English IFAD Executive Board Seventy-Ninth Session Rome, 10-11 September 2003 STATUS OF CONTRIBUTIONS
Chapter 1: Economic and Social Indicators Comparison of BRICS Countries Chapter 2: General Chapter 3: Population
 1: Economic and Social Indicators Comparison of BRICS Countries 2: General 3: Population 3: Population 4: Economically Active Population 5: National Accounts 6: Price Indices 7: Population living standard
NOTE BY THE TECHNICAL SECRETARIAT SCALE OF ASSESSMENTS FOR 2019
 OPCW Technical Secretariat 1 February 2019 Original: ENGLISH NOTE BY THE TECHNICAL SECRETARIAT SCALE OF ASSESSMENTS FOR 2019 1. At its Twenty-Third Session, the Conference of the States Parties (hereinafter
Annex A. Countries and country groupings
 Annex A. Countries and country groupings Table A 1. List of countries included in the FAO projections, grouped by World Bank region and showing the most recent income groupings. Latin America and Caribbean
Regulatory status for using RFID in the UHF spectrum 3 May 2006
 Regulatory status for using RFID in the UHF spectrum 3 May NOTE: The following countries were updated since the last publication of 3 March : Thailand, Romania. The table attached provides an overview
Microsoft Excel: Data Analysis & Graphing. College of Engineering Engineering Education Innovation Center
 Microsoft Excel: Data Analysis & Graphing College of Engineering Engineering Education Innovation Center Objectives Use relative, absolute, and mixed cell referencing Identify the types of graphs and their
Making the most of graph questions
 Get started Use skills and techniques to demonstrate geographical understanding (AO4) 4 Making the most of graph questions This unit will help you learn how to work with graphs, by plotting, labelling,
NCSS Statistical Software
 Chapter 147 Introduction A mosaic plot is a graphical display of the cell frequencies of a contingency table in which the area of boxes of the plot are proportional to the cell frequencies of the contingency
United Nations expert group meeting on strengthening the demographic evidence base for the post-2015 development agenda, 5-6 October 2015, New York
 United Nations expert group meeting on strengthening the demographic evidence base for the post-15 development agenda, 5-6 October 15, New York Demographic Evidence from Civil Registration Systems Adriana
EN ANNEX I allocations by specific objective in Euro
 EN ANNEX I allocations by specific objective in Euro Objective 1 Objective 2 Objective 3 Objective 4 Objective 5 Man-made crises Natural Small scale / Epidemics Complementary and thematic activities and
EN ANNEX I allocations by specific objective in Euro
 EN ANNEX I allocations by specific objective in Euro Objective 1 Objective 2 Objective 3 Objective 4 Objective 5 Man-made crises Natural s ALERT / Small scale / Epidemics Complementary and thematic activities
Population and Housing Censuses Towards Funding Stability
 United Nations Population Fund Population and Housing Censuses Towards Funding Stability Richard Leete Technical and Policy Division Paper to be Presented at Donors and Consortium Meeting of PARIS 21 Paris,
Patents. Highlights. Figure 1 Patent applications worldwide
 Patents Highlights More than 3 million patent applications were filed worldwide in 2016 a record number For the first time, more than 3 million patent applications were filed worldwide in a single year,
Why is CRVS so important?
 Well-functioning national CRVS systems are critical to monitor country progress towards the SDGs and a key strategy to ensuring no one is leftbehind. In addition, target 16.9 highlights the need for universal
Office 2016 Excel Basics 24 Video/Class Project #36 Excel Basics 24: Visualize Quantitative Data with Excel Charts. No Chart Junk!!!
 Office 2016 Excel Basics 24 Video/Class Project #36 Excel Basics 24: Visualize Quantitative Data with Excel Charts. No Chart Junk!!! Goal in video # 24: Learn about how to Visualize Quantitative Data with
Chapter 10. Definition: Categorical Variables. Graphs, Good and Bad. Distribution
 Chapter 10 Graphs, Good and Bad Chapter 10 3 Distribution Definition: Tells what values a variable takes and how often it takes these values Can be a table, graph, or function Categorical Variables Places
Section 1.5 Graphs and Describing Distributions
 Section 1.5 Graphs and Describing Distributions Data can be displayed using graphs. Some of the most common graphs used in statistics are: Bar graph Pie Chart Dot plot Histogram Stem and leaf plot Box
Chapter 3. Graphical Methods for Describing Data. Copyright 2005 Brooks/Cole, a division of Thomson Learning, Inc.
 Chapter 3 Graphical Methods for Describing Data 1 Frequency Distribution Example The data in the column labeled vision for the student data set introduced in the slides for chapter 1 is the answer to the
dii 4.0 Global Industry 4.0 Readiness Report 2016 Industry 4.0 Readiness Index
 dii. Global Industry. Readiness Report 1 Industry. Readiness Index January 17 dii. About DII. DII. is a Danish non-profit organisation founded with the purpose of promoting Industry. in Denmark and facilitating
Chapter 1. Picturing Distributions with Graphs
 Chapter 1. Picturing Distributions with Graphs 1 Chapter 1. Picturing Distributions with Graphs Definition. Individuals are the objects described by a set of data. Individuals may be people, but they may
Review. In an experiment, there is one variable that is of primary interest. There are several other factors, which may affect the measured result.
 Review Observational study vs experiment Experimental designs In an experiment, there is one variable that is of primary interest. There are several other factors, which may affect the measured result.
OVERVIEW THE INDONESIA TEXTILE INDUSTRY
 OVERVIEW THE INDONESIA TEXTILE INDUSTRY RAMON BANGUN Director of Textile and Multifarious Industry Directorate General for Manufacturing Industry Base Ministry of Industry October, 2014 1 Non Oil Industries
The new cable junction boxes. The evolution of the original. Level 3 - for intrinsic fire resistance.
 The new cable junction boxes The evolution of the original. Level 3 - for intrinsic fire resistance 2015 1931 www.enycase.eu The Hensel cable junction box: A success story! Since its founding, Gustav Hensel
Welcome to the IFR Press Conference 30 August 2012, Taipei
 Welcome to the IFR Press Conference 3 August 212, Taipei Continued success of the robotics industry Welcome by IFR President Dr. Shinsuke Sakakibara Presentation of the results of World Robotics 212 Industrial
Demographic Trends in OIC Is harmonisation of data needed?
 Demographic Trends in OIC Is harmonisation of data needed? Seminar on Population and Housing Census Practices of OIC Member Countries 6-8 March 2013 Ankara, Turkey STATISTICAL, ECONOMIC AND SOCIAL RESEARCH
International data collection and uses of international data by UIS: Overview of data for East Africa
 International data collection and uses of international data by UIS: Overview of data for East Africa SEMINAR WORKSHOP ON SCIENCE, TECHNOLOGY AND INNOVATION INDICATORS Mombasa, Kenya 30 March - 3 April
Important Considerations For Graphical Representations Of Data
 This document will help you identify important considerations when using graphs (also called charts) to represent your data. First, it is crucial to understand how to create good graphs. Then, an overview
Going back to the definition of Biostatistics. Organizing and Presenting Data. Learning Objectives. Nominal Data 10/10/2016. Tabulation and Graphs
 1/1/1 Organizing and Presenting Data Tabulation and Graphs Introduction to Biostatistics Haleema Masud Going back to the definition of Biostatistics The collection, organization, summarization, analysis,
Getting to Equal, 2016
 Getting to Equal, 2016 Listen. Learn, Lead, 2015 Career Capital, 2014 Defining Success. Your Way, 2013 The Path Forward, 2012 Reinvent Opportunity: Looking Through a New Lens, 2011 Resilience in the Face
19 and 20 November November 2018 Original: ENGLISH DECISION SCALE OF ASSESSMENTS FOR 2019
 OPCW Conference of the States Parties Twenty-Third Session C-23/DEC.14 19 and 20 November 2018 20 November 2018 Original: ENGLISH The Conference of the States Parties, DECISION SCALE OF ASSESSMENTS FOR
Biggar High School Mathematics Department. S1 Block 1. Revision Booklet GOLD
 Biggar High School Mathematics Department S1 Block 1 Revision Booklet GOLD Contents MNU 3-01a MNU 3-03a MNU 3-03b Page Whole Number Calculations & Decimals 3 MTH 3-05b MTH 3-06a MTH 4-06a Multiples, Factors,
EXECUTIVE SUMMARY. Robot sales to the fabricated metal products industry, the chemical industry and the food industry increased substantially.
 2006 World Robot Market EXECUTIVE SUMMARY Total world-wide sales: 112,200 units, down 11% on 2005 World total stock of operational industrial robots: 951,000 units,3% greater than 2005 The world market
Using Charts and Graphs to Display Data
 Page 1 of 7 Using Charts and Graphs to Display Data Introduction A Chart is defined as a sheet of information in the form of a table, graph, or diagram. A Graph is defined as a diagram that represents
The PCT in Latin America: its Role and Future. Recent developments of the PCT system in Latin America AIPPI Forum Buenos Aires, October 11, 2009
 The PCT in Latin America: its Role and Future Recent developments of the PCT system in Latin America AIPPI Forum Buenos Aires, October 11, 2009 Outline The PCT in Latin America The Role of the PCT The
NFC Forum: The Evolution of a Consortium
 NFC Forum: The Evolution of a Consortium Presented by Greg Kohn Sr. Operations Director, NFC Forum ANSI Open Forum: Building Bridges across the Standards Ecosystem October 9, 2012 Part of the World Standards
GII Discussion New York 15 October 2014
 GII Discussion New York 15 October 2014 Soumitra Dutta Anne and Elmer Lindseth Dean and Professor of Management Johnson School of Management Cornell Univesity Soumitra Dutta Founder and co-editor Cornell
PROGRAM AT-A-GLANCE: PRINT ENGINES SPECIALIZATION EUROPE, MIDDLE EAST AND AFRICA
 PROGRAM AT-A-GLANCE: PRINT ENGINES SPECIALIZATION EUROPE, MIDDLE EAST AND AFRICA SPECIALIZATIONS: REWARDING YOUR EXPERTISE Through the Zebra PartnerConnect program, Zebra supports, recognizes and rewards
Verifying Power Supply Sequencing with an 8-Channel Oscilloscope APPLICATION NOTE
 Verifying Power Supply Sequencing with an 8-Channel Oscilloscope Introduction In systems that rely on multiple power rails, power-on sequencing and power-off sequencing can be critical. If the power supplies
Line Graphs. Name: The independent variable is plotted on the x-axis. This axis will be labeled Time (days), and
, and") Name: Graphing Review Graphs and charts are great because they communicate information visually. For this reason graphs are often used in newspapers, magazines, and businesses around the world. Sometimes,
Name: Graphing Review Graphs and charts are great because they communicate information visually. For this reason graphs are often used in newspapers, magazines, and businesses around the world. Sometimes,
Chapter 2. Organizing Data. Slide 2-2. Copyright 2012, 2008, 2005 Pearson Education, Inc.
 Chapter 2 Organizing Data Slide 2-2 Section 2.1 Variables and Data Slide 2-3 Definition 2.1 Variables Variable: A characteristic that varies from one person or thing to another. Qualitative variable: A
Sri Lanka Science, Technology & Innovation Statistical Handbook 2015
 Sri Lanka Science, Technology & Innovation Statistical Handbook 2015 National Science Foundation 47/5, Maitland Place Colombo 07 Sri Lanka www.nsf.gov.lk National Science Foundation, Sri Lanka. ISBN 978-955-590-130-7
. Development of PAJ
 Table of Contents. Development of PAJ. Development of JPO s IPDL. Information on Foreign Industrial Property Systems 5. PAJ Issuance Schedule 7. Development of PAJ The first part of this issue of PAJ News
Performing Safe Operating Area Analysis on MOSFETs and Other Switching Devices with an Oscilloscope APPLICATION NOTE
 Performing Safe Operating Area Analysis on MOSFETs and Other Switching Devices with an Oscilloscope Line Gate Drain Neutral Ground Source Gate Drive FIGURE 1. Simplified switch mode power supply switching
Excel Manual X Axis Scale Start At Graph
 Excel Manual X Axis Scale Start At 0 2010 Graph But when I plot them by XY chart in Excel (2003), it looks like a rectangle, even if I havesame for both X, and Y axes, and I can see the X and Y data maximum
Gender Equality Commitment Workshop JUNE 2018
 Gender Equality Commitment Workshop JUNE 2018 Dr. Zsuzsanna Tungli Managing Partner Lorraine Fagan Director Developing Global Leaders/Cultural Training Asia Email ztungli@developinggloballeaders.com lorrainefagan@culturaltrainingasia.com
The population census as a tool to count forcibly displaced populations
 The population census as a tool to count forcibly displaced populations Presentation to Conference of Refugee Statistics, Antalya, Turkey 7-9 October 2015, Vebjørn Aalandslid, Statistics Norway The presentation
TOPIC 4 GRAPHICAL PRESENTATION
 TOPIC 4 GRAPHICAL PRESENTATION Public agencies are very keen on amassing statistics they collect them, raise them to the nth power, take the cube root, and prepare wonderful diagrams. But what you must
Chapter 2. The Excel functions, Excel Analysis ToolPak Add-ins or Excel PHStat2 Add-ins needed to create frequency distributions are:
 I. Organizing Data in Tables II. Describing Data by Graphs Chapter 2 I. Tables: 1. Frequency Distribution (Nominal or Ordinal) 2. Grouped Frequency Distribution (Interval or Ratio data) 3. Joint Frequency
AWM 11 UNIT 1 WORKING WITH GRAPHS
 AWM 11 UNIT 1 WORKING WITH GRAPHS Assignment Title Work to complete Complete 1 Introduction to Statistics Read the introduction no written assignment 2 Bar Graphs Bar Graphs 3 Double Bar Graphs Double
STATUS OF CONTRIBUTIONS TO THE FIFTH REPLENISHMENT OF IFAD S RESOURCES
 Distribution: Restricted EB 2003/78/R.4/Add.1 9 April 2003 Original: English Agenda Item 4(a) English IFAD Executive Board Seventy-Eighth Session Rome, 9-10 April 2003 STATUS OF CONTRIBUTIONS TO THE FIFTH
Special section. Patent office operations: application processing times, examination capacity and examination outcomes.
 Special section Patent office operations: application processing times, examination capacity and examination outcomes Introduction Patent offices examine applications and decide whether or not to grant
ESSENTIAL MATHEMATICS 1 WEEK 17 NOTES AND EXERCISES. Types of Graphs. Bar Graphs
 ESSENTIAL MATHEMATICS 1 WEEK 17 NOTES AND EXERCISES Types of Graphs Bar Graphs Bar graphs are used to present and compare data. There are two main types of bar graphs: horizontal and vertical. They are
Notes 5C: Statistical Tables and Graphs
 Notes 5C: Statistical Tables and Graphs Frequency Tables A frequency table is an easy way to display raw data. A frequency table typically has between two to four columns: The first column lists all the
Overview of available data and data sources on birth registration. Claudia Cappa Data & Analytics Section, UNICEF
 Overview of available data and data sources on birth registration Claudia Cappa Data & Analytics Section, UNICEF Outline Overview of available data and data sources on birth registration Presentation of
PROGRESS REPORT ON THE FIFTH REPLENISHMENT OF IFAD S RESOURCES
 Distribution: Limited GC 26/L.3 24 January 2002 Original: English Agenda Item 6 English IFAD Governing Council Twenty-Fifth Anniversary Session Rome, 19-20 February 2003 PROGRESS REPORT ON THE FIFTH REPLENISHMENT
Inclinometer Selection Guide
 POSITION AND MOTION SENSORS Inclinometer Selection Guide Page No. 1 GLOBAL PRESENCE FRABA Group Sales Partner America FRABA Inc. Hamilton, NJ, USA Asia FRABA Pte. Ltd. Singapore Europe POSITAL GmbH Cologne,
STK110. Chapter 2: Tabular and Graphical Methods Lecture 1 of 2. ritakeller.com. mathspig.wordpress.com
 STK110 Chapter 2: Tabular and Graphical Methods Lecture 1 of 2 ritakeller.com mathspig.wordpress.com Frequency distribution Example Data from a sample of 50 soft drink purchases Frequency Distribution
Chapter 1 Population, households and families
 The World s Women 2005: Progress in Statistics 7 Chapter 1 Population, households and families gender inequities have significant influences on, and are in turn influenced by, demographic parameters such
Workshop on Census Data Evaluation for English Speaking African countries
 Workshop on Census Data Evaluation for English Speaking African countries Organised by United Nations Statistics Division (UNSD), in collaboration with the Uganda Bureau of Statistics Kampala, Uganda,
2 Tobacco Outlook/TBS-262/April 24, 2007 Economic Research Service, USDA
 United States Department of Agriculture Electronic Outlook Report from the Economic Research Service www.ers.usda.gov TBS-262 April 24, 2007 Tobacco Outlook Tom Capehart Harvest Intentions for 2007-Crop
Capital Street Business News Institutional Investors. FIG Media Corporation Institutional Investors
 Capital Street Business News Institutional Investors FIG Media Corporation Institutional Investors European and United States Investment Banker Limited Partner Shareholder Contracts Hiram R. Davis Founding
Sensors and Scatterplots Activity Excel Worksheet
 Name: Date: Sensors and Scatterplots Activity Excel Worksheet Directions Using our class datasheets, we will analyze additional scatterplots, using Microsoft Excel to make those plots. To get started,
Table of Contents Executive Summary 29
 Contents Table of Contents Executive Summary 29 Section 1: Introduction 33 Section 2: World 37 2.1.1. Main consumers 37 2.1.2. Main producers 2015 and 2016 39 2.1.3. Main importers 2015 and 2016 40 2.1.4.
Footnotes to the Austrian Frequency Allocation Table (Column 2 and 3) and other relevant provisions of the Radio Regulations
 and other relevant provisions of the Radio Regulations") BGBl. II - Ausgegeben am 6. September 005 - Nr. 306 1 von 53 Footnotes to the Austrian Frequency Allocation Table (Column and 3) and other relevant provisions of the Radio Regulations Anlage I. Footnotes
BGBl. II - Ausgegeben am 6. September 005 - Nr. 306 1 von 53 Footnotes to the Austrian Frequency Allocation Table (Column and 3) and other relevant provisions of the Radio Regulations Anlage I. Footnotes
Elementary Statistics. Graphing Data
 Graphing Data What have we learned so far? 1 Randomly collect data. 2 Sort the data. 3 Compute the class width for specific number of classes. 4 Complete a frequency distribution table with the following
Economic Dynamics and Structural Change
 Econ of Innovation III Economic Dynamics and Structural Change Winter Term 2017/18 Uwe Cantner* / Simone Vannuccini* * Friedrich Schiller University Jena University of Southern Denmark, Odense uwe.cantner@uni-jena.de,
WIPO Capacity Building Activities and Programs: Activities for Innovation Promotion and Technology Transfer
 WIPO Capacity Building Activities and Programs: Activities for Innovation Promotion and Technology Transfer National Seminar on Intellectual Property (IP) Management and Commercialization of IP Assets
Indicator Framework. UNESCO Institute for Statistics
 STI Indicators in the Global SDG Indicator Framework Monitoring Science, Technology and Innovation for the Sustainable Development Goals WSIS Forum 2016 ICT Statistics in support of the 2030 Agenda Geneva,
Russian market of cotton fiber in 2005
 Irina Medvedeva, Ministry of Economic Development and Trade of the Russian Federation Russian market of cotton fiber in 2005 One of the priorities of real economic growth and national security of Russia
Simple Graphical Techniques
 Simple Graphical Techniques Graphs are the pictorial representation of facts and figures, or data. The eye can detect patterns and trends from graphs far more easily than from a lot of numbers. Linear
Collection and dissemination of national census data through the United Nations Demographic Yearbook *
 UNITED NATIONS SECRETARIAT ESA/STAT/AC.98/4 Department of Economic and Social Affairs 08 September 2004 Statistics Division English only United Nations Expert Group Meeting to Review Critical Issues Relevant
The Patent Cooperation Treaty (PCT) in 1994
 in 1994") WIPO Press Release PCT/89 Geneva, January 31, 1995 The Patent Cooperation Treaty (PCT) in 1994 The World Intellectual Property Organization (WIPO), Geneva, announces the main events which occurred in 1994
WIPO Press Release PCT/89 Geneva, January 31, 1995 The Patent Cooperation Treaty (PCT) in 1994 The World Intellectual Property Organization (WIPO), Geneva, announces the main events which occurred in 1994
International Market Research Reports (IMRR)
") Industry Canada > Economic and Market Research/Statistics > International Market Research International Market Research Reports (IMRR) Language Notice and Content Disclaimer: The information found below
Industry Canada > Economic and Market Research/Statistics > International Market Research International Market Research Reports (IMRR) Language Notice and Content Disclaimer: The information found below
An Assessment of the Age Reporting in the IPUMS-I Microdata
 An Assessment of the Age Reporting in the IPUMS-I Microdata Johanna Fajardo-González, Laura Attanasio 2, and Jasmine Trang Ha 3 Minnesota Population Center University of Minnesota Paper submitted for presentation
Spreadsheets 3: Charts and Graphs
 Spreadsheets 3: Charts and Graphs Name: Main: When you have finished this handout, you should have the following skills: Setting up data correctly Labeling axes, legend, scale, title Editing symbols, colors,
Standard Economy Country Name. Each Minute. Initial. Additional
 BELLSOUTH LONG DISTANCE, INC. 5th Revised Page 44 5.4 BellSouth Residential International Message Telecommunications Service (MTS) (continued) 5.4.2 Per Rate Tables (continued) Standard Economy Name Cuba
Business Statistics:
 Department of Quantitative Methods & Information Systems Business Statistics: Chapter 2 Graphs, Charts, and Tables Describing Your Data QMIS 120 Dr. Mohammad Zainal Chapter Goals After completing this
א*()'&א$#"! א& 0(1 /(א.-,+*()א&%$#"! ELECTION OF THE MEMBERS OF THE LEGAL COMMITTEE FOR THE 32nd SESSION OF THE GENERAL CONFERENCE
'&א$#! א& 0(1 /(א.-,+*()א&%$#! ELECTION OF THE MEMBERS OF THE LEGAL COMMITTEE FOR THE 32nd SESSION OF THE GENERAL CONFERENCE") Paris 2001 Conférence générale 31e Comité des candidatures General Conference 31st Nominations Committee Conferencia General 31 a reunión Comité de Candidaturas Генеральная конференция 31-я сессия Комитет
Paris 2001 Conférence générale 31e Comité des candidatures General Conference 31st Nominations Committee Conferencia General 31 a reunión Comité de Candidaturas Генеральная конференция 31-я сессия Комитет
The 6 metre band 50 to 52 MHz
 The 6 metre band 50 to 52 MHz Varna 2014 Frequency 50.000 50.100 50.100 50.200 50.200 50.300 50.300 50.400 50.400 50.500 50.500 52.000 Maximum Bandwidth 500 Hz 1 000 Hz Mode exclusive (except Beacon Project)
WORLD INTELLECTUAL PROPERTY ORGANIZATION. WIPO PATENT REPORT Statistics on Worldwide Patent Activities
 WORLD INTELLECTUAL PROPERTY ORGANIZATION WIPO PATENT REPORT Statistics on Worldwide Patent Activities 2007 WIPO PATENT REPORT Statistics on Worldwide Patent Activities 2007 Edition WORLD INTELLECTUAL
Section 3 Correlation and Regression - Worksheet
 The data are from the paper: Exploring Relationships in Body Dimensions Grete Heinz and Louis J. Peterson San José State University Roger W. Johnson and Carter J. Kerk South Dakota School of Mines and
Chapter Displaying Graphical Data. Frequency Distribution Example. Graphical Methods for Describing Data. Vision Correction Frequency Relative
 Chapter 3 Graphical Methods for Describing 3.1 Displaying Graphical Distribution Example The data in the column labeled vision for the student data set introduced in the slides for chapter 1 is the answer
Scientific Investigation Use and Interpret Graphs Promotion Benchmark 3 Lesson Review Student Copy
 Scientific Investigation Use and Interpret Graphs Promotion Benchmark 3 Lesson Review Student Copy Vocabulary Data Table A place to write down and keep track of data collected during an experiment. Line
The Global Flight Tracking (GFT) for Civil Aviation WRC-15 Report
 for Civil Aviation WRC-15 Report") The Global Flight Tracking (GFT) for Civil Aviation WRC-15 Report Dr. KY-Leng Deputy Director General General Department of Posts and Telecommunication Ministry of Posts and Telecommunication Email: leng-ky@mptc.gov.kh
The Global Flight Tracking (GFT) for Civil Aviation WRC-15 Report Dr. KY-Leng Deputy Director General General Department of Posts and Telecommunication Ministry of Posts and Telecommunication Email: leng-ky@mptc.gov.kh
Economic and Social Council
 UNITED NATIONS E Economic and Social Council Distr. GENERAL 5 May 2008 Original: ENGLISH ECONOMIC COMMISSION FOR EUROPE CONFERENCE OF EUROPEAN STATISTICIANS Joint UNECE/Eurostat Meeting on Population and
Lessons learned from recent experiences with the evaluation of the completeness of vital statistics from civil registration in different settings
 Bloomberg Data for Health Initiative Lessons learned from recent experiences with the evaluation of the completeness of vital statistics from civil registration in different settings Tim Adair Bloomberg
Date of information. 18,690, est.
 1 of 7 14/09/2011 22:21 From Wikipedia, the free encyclopedia In 2010, world energy consumption of refined products increased 3.8%; [1] this is the first increase since 2004, the last year with prices
American Community Survey 5-Year Estimates
 DP02 SELECTED SOCIAL CHARACTERISTICS IN THE UNITED STATES 2012-2016 American Community Survey 5-Year Estimates Supporting documentation on code lists, subject definitions, data accuracy, and statistical
American Community Survey 5-Year Estimates
 DP02 SELECTED SOCIAL CHARACTERISTICS IN THE UNITED STATES 2011-2015 American Community Survey 5-Year Estimates Supporting documentation on code lists, subject definitions, data accuracy, and statistical
Counting the People of Rwanda
 Republic of Rwanda National Institute of Statistics of Rwanda www.statistics.gov.rw Counting the People of Rwanda 2012 Population and Housing Census Be counted because you count Be counted because you