UKFields Help by Petroleum Solutions Ltd, all rights reserved
|
|
|
- Scarlett Gibbs
- 5 years ago
- Views:
Transcription

1 UKFields Help
2 UKFields UK Oil and Gas Field Production Analysis Software by Petroleum Solutions Ltd
3 UKFields Help All rights reserved. No parts of this work may be reproduced in any form or by any means - graphic, electronic, or mechanical, including photocopying, recording, taping, or information storage and retrieval systems - without the written permission of the publisher. Products that are referred to in this document may be either trademarks and/or registered trademarks of the respective owners. The publisher and the author make no claim to these trademarks. While every precaution has been taken in the preparation of this document, the publisher and the author assume no responsibility for errors or omissions, or for damages resulting from the use of information contained in this document or from the use of programs and source code that may accompany it. In no event shall the publisher and the author be liable for any loss of profit or any other commercial damage caused or alleged to have been caused directly or indirectly by this document. Printed: May 2010
4 4 UKFields Help Table of Contents Foreword Part I Welcome to UKFields Introduction... 6 Part II Application Options 10 1 Chart... Display Options 10 2 Treeview... Navigation 10 3 Units Part III Field Details 15 1 Overview... and Field History Data 15 2 Well History... Data 16 Part IV Time Analysis 18 1 Oil Production Gas Production Water... Production 31 4 Liquid... Production 31 5 Water... Injection 32 Part V Cumulative Analysis 35 1 Oil Rate Gas Rate Oilcut,... Watercut and Water Oil Ratio 39 4 Watercut... v's Np/N 42 Part VI Predictions Index 47 54
5 UKFields UK Oil and Gas Field Production Analysis Software Part I

6 6 UKFields Help 1 Welcome to UKFields 1.1 Introduction UKFields is a production analysis database containing all UK oil and gas producing fields monthly production and injection data to December The intent of this application is to periodically re-publish the database once the data becomes available. Through the use of this application, the user can quickly : Analyse the production and injection history of any field in the UK, based on a rate or ratio v's time basis or rate or ratio v's cumulative basis, for all available data to December Export the field production and injection histories of any field to any external package via copy and paste and the windows clipboard. Display presentation quality charts of field production and injection histories, and export any of the charts within the application via the clipboard or by saving as JPG / PNG / etc. Obtain well statistics [maximum rates, cumulative recoveries, etc] on a fieldby-field basis, for all available data to July Perform field level decline curve analysis on the oil or gas rate v's time basis, or any rates and ratios displayed on a cumulative basis.
7 Welcome to UKFields 7 Examine the key production profile statistics for any UK oil and gas field for analogue field comparison. Figures are calculated for peak offtake rate, cumulative offtake, decline curve parameters, associated hydrocarbon (gas or condensate) and non-hydrocarbon (water) development with time and versus cumulative hydrocarbon phase. Contrast the production and injection performance for similar fields to enable field acquisition analysis, and future potential production and reserves optimisation. License.dat File The "License.dat" file is located in the Application Startup folder (eg C:\Program Files\Petroleum Solutions\UKFields\) The contents of this ASCII license file needs to contain the following license information. [License Settings] LicensedTO = Company = ProductID = LicenseID = If any of the above License key information is incorrect or absent, or if the License.dat file is missing then the application will fail to startup..net Framework This application requires the presence or installation of Microsoft.Net Framework version 2..NET Framework version 2 is a component of the Microsoft Windows operating system used to build and run Windows-based applications. Should.NET Framework version 2 not be installed on the destination PC then a link is provided below to download this system software. The user should download and install.net Framework version 2 before attempting to install this application. The installation of.net Framework also requires a minimum software and hardware requirement. Details of which are shown below. Specifically, note that you cannot install the.net Framework on a computer running the Microsoft Windows 95 operating system. Minimum requirements To install.net Framework [Dotnetfx2.exe], you must have one of the following operating systems, with Microsoft Internet Explorer 5.01 or later installed on your computer: Microsoft Windows 98
8 8 UKFields Help Microsoft Windows 98 Second Edition Microsoft Windows Millennium Edition (Windows Me) Microsoft Windows NT 4 (Workstation or Server) with Service Pack 6a Microsoft Windows 2000 (Professional, Server, or Advanced Server) with the latest Windows service pack and critical updates available from the Microsoft Security Web site ( com/security). Microsoft Windows XP (Home or Professional) Recommended hardware CPU Recommended RAM Recommended Pentium 90 MHz or faster 96 MB or higher
9 UKFields UK Oil and Gas Field Production Analysis Software Part II


10 10 UKFields Help 2 Application Options 2.1 Chart Display Options Any part of the chart displays can be changed to suit specific user preferences. These options can be accessed by selecting the Application Options button on the bottom left corner of the application, as highlighted below. By scrolling up and down within this Application Options property grid and selecting the various options, the user can change any part of the Chart Appearance. 2.2 Treeview Navigation Selecting an oil or gas field for analysis could not be easier, and is done with the Fields Tree View panel. To select a field simply single right mouse click on the field name within the Field View panel, as shown below.


11 Application Options 11 The user can choose to sort the FieldView docking panel, either alphabetically or by UK Quad Location. The selection between these two options is also highlighted below.


12 12 UKFields Help The user can also choose to auto Hide the Panel by selecting the Arrows icon, as shown below. Once selected the Panel should collapse, as shown below. To recover the Fields Tree View Panel just select the Arrows icon again. 2.3 Units The database application units are stored in metric units, however within the application the user can choose to work in either Metric or, more commonly, Oilfield units. To switch between units, simply select the Oilfield Units or Metric Units menu item as shown below.

13 Application Options 13
14 UKFields UK Oil and Gas Field Production Analysis Software Part III


15 Field Details 3 Field Details 3.1 Overview and Field History Data 15 Once the application launches successfully, the following should be displayed. Copy and Paste Datatable Information to External Applications Any of the table data can be copied as pasted into external applications via two methods. 1. Either press the right mouse button once over any of the tables to activate the table context menu, as highlighted below, then select the various menu item to copy a specific table to the clipboard. 2. Or, simply select and drag an area with the mouse, then press the standard windows CTRL+C keys to copy the selected area to the clipboard.


16 UKFields Help Well History Data Summary well data has also been incorporated into the database. Based on UK published well data to July 1999, individual wells have been summarised in the database and presented by field in the formats presented below. From this data, the user can approximately determine the range of peak production rates and likely well cumulative production volumes for any field with data up to July Again, the user can copy and paste the data table information to any external package via the two methods discussed in the previous section.
17 UKFields UK Oil and Gas Field Production Analysis Software Part IV

18 18 UKFields Help 4 Time Analysis 4.1 Oil Production Within the Time Analysis section, the user can display numerous production and injection rates and ratios versus time. The user can also perform decline curve analysis on both the Oil and Gas production rate, for exponential, harmonic and hyperbolic decline curve equations. The user can choose between linear and logarithmic Y axis display by selecting the chart context menu with a single right mouse click. See screen capture provided below.

19 Time Analysis 19 Many other production ratios are provided as a secondary Y axis display, to help in the field production profile and decline curve selection. These can be changed again via the chart context menu as shown below.

20 20 UKFields Help The user can also choose to display the secondary Y axis as either linear or logarithmic. See screen capture provided below.
21 Time Analysis Regress Decline Exponents To select points for decline curve analysis, first select the Regress Decline Exponents then Select Points menu item, as shown below. 21

22 22 UKFields Help Once the user has selected 2 points a message box will pop up acknowledging the fact that 2 points were digitized. The user can them choose to fit a decline type, either Exponential, Harmonic or Hyperbolic.


23 Time Analysis Examples of each decline type are shown below. Where, a = Constant decline rate fraction, between 0 and 1 n = additional hyperbolic constant decline exponent, typically between 0 and 1 23
24 24 UKFields Help Special cases for the hyperbolic decline equation occur at n=0 [exponential decline] and n=1 [harmonic decline]. The following text is taken from "Petroleum Engineering Handbook" published by the Society of Petroleum Engineers, page "An analysis of a large number of actual production-decline curves assembled by Cutler indicates that most decline curves normally encountered are of the hyperbolic type, with values for the exponent n between 0 and 0.7, while the majority fall between 0 and 0.4." For both the exponential and harmonic decline curves, the exponent 'a' can be solved by re- arranging their decline curve equations to the following : Exponential Equation Harmonic Equation The solution of the hyperbolic parameters are based on the technique described in the following Society of Petroleum Engineers paper, where an additional parameter Cumulative production, Np, is required. "A Numerical Solution to Two-Parameter Representation of Production Decline Curve Analysis", SPE16505, B. Agbi and M Ng, 1987 The solution of the hyperbolic decline curve equation for values of 'a' and 'n' displays all roots of the equation, including values of 'a' at n=0 (exponential decline) and n=1 (harmonic decline). Typically, the value of 'n' at Root 2 is between 0 and 1. Once the user has selected the Decline Type and pressed the Fit Decline Rate button, they can then approximately calculate the likely Ultimate Recovery at abandonment and Abandonment date. Should the user want a more accurate prediction of the Ultimate Recovery at abandonment and Abandonment date, then they should use

25 Time Analysis 25 For completeness, the equations used to calculate these Ultimate Recoveries and abandonment dates are provided below, where qi is the first digitized point and the Initial Production Rate. Exponential Decline Ultimate Recovery Equation Abandonment Time Equation Harmonic Decline Ultimate Recovery Equation Abandonment Time Equation Hyperbolic Decline Ultimate Recovery Equation Abandonment Time Equation

26 26 UKFields Help Assuming a decline curve analysis has been performed on the Oil Production Rate, the user should press the Save Time Forecast button to ensure that the digitized points, decline and prediction parameters are saved. Offtake Rates, Formation Volume Factors and Chart Tooltips Once the user has determined the likely Ultimate field Recovery based either on the Rate v's Time analysis or any of the Rate or Ratio v's Cumulative analysis, then they can choose to input this figure into the Ultimate Recovery input box, as shown below. Also, should the user calculate a more accurate Cumulative Voidage Replacement, they can input values for produced Oil and Water formation volume factors as shown below. Once the user presses the Save Time Forecast button, as shown below, the calculation of Cumulative Voidage Replacement is updated and can be displayed in the Y2 axis by selecting Set Y2 Axis = Cumulative Voidage chart context menu item.

27 Time Analysis 27 Once the Ultimate Recovery figure has been input into the text box, the user should press the Save Time Forecast button, as shown above. This will then enable the calculation of monthly, annual and cumulative offtake rates, which are displayed in the form of chart tooltips. See below. Zooming and Unzooming within a Chart Area Zooming within the chart area also couldn't be easier. Just single left-mouse click and drag the area of interest for zooming, as shown below.

28 28 UKFields Help To unzoom simply single left mouse click one of the unzoom icons provided at the extremes of the axes scroll bars, as shown below.

29 Time Analysis Gas Production All of the same functionality that was presented in the Oil Production section is also available for Gas Production analysis, including decline curve analysis, chart tooltips, ultimate recovery and abandonment prediction. Two specific examples are provided below, although the equations and methods are identical to the Oil Production section.


30 30 UKFields Help Assuming a decline curve analysis has been performed on the Gas Production Rate, the user should press the Save Time Forecast button to ensure that the digitized points, decline and prediction parameters are saved.

31 Time Analysis Water Production Water Production rate versus time is displayed as the primary Y axis in this display. No decline curve analysis can be performed while within this display. All other chart functionality that was presented in the Oil Production Time Analysis section is available. 4.4 Liquid Production Liquid Production (Oil + Condensate + Water) rate versus time is displayed as the primary Y axis in this display. No decline curve analysis can be performed while within this display. All other chart functionality that was presented in the Oil Production Time Analysis section is available.

32 UKFields Help Water Injection Water Injection rate versus time is displayed as the primary Y axis in this display. No decline curve analysis can be performed while within this display. All other chart functionality that was presented in the Oil Production Time Analysis section is available.

33 Time Analysis 33
34 UKFields UK Oil and Gas Field Production Analysis Software Part V

35 Cumulative Analysis 5 Cumulative Analysis 5.1 Oil Rate 35 Within the Cumulative Analysis section, the user can display numerous production and injection rates and ratios versus Cumulative Production. The user can also perform linear or semi-logarithmic decline curve analysis for Oil Rate, Gas Rate, Oilcut, Watercut and Water Oil Ratio versus Cumulative Production. Regress Decline Exponents The method to regress decline exponents is identical to the Oil and Gas Rate versus Time Analysis, presented is earlier sections. First select the Regress Decline Exponents then Select Points chart context menu item, as shown below. Then digitize two points on the chart

36 36 UKFields Help Once the user has selected two points, a message box will popup notifying the user that 2 points have been selected. The application will automatically fit a straight line between these 2 digitized points, and report the gradient and intercept of this line, as shown below. The user can choose to fit a semi logarithmic straight line, by selecting the Regress Log Y Values check box, also shown below, assuming this is checked then the application will automatically update the fit, and report the revised gradient and intercept of this line.


37 Cumulative Analysis 37 The user can also calculate an approximate Ultimate Recovery, by selecting between using the decline trend or last production value and inputting a final abandonment production value. The user should then press the Predict button, as shown above, to extrapolate the line to the abandonment value. See calculated result below. 5.2 Gas Rate Again, all of the same functionality that was presented in the Oil Production v's Cumulative analysis section is also available for Gas Production analysis, including decline curve analysis, chart tooltips, and ultimate recovery at abandonment prediction.

38 38 UKFields Help Two specific examples are provided below, although the equations and methods are identical to the Oil Production section.

39 Cumulative Analysis Oilcut, Watercut and Water Oil Ratio Again, all of the same functionality that was presented in the Oil Production v's Cumulative analysis section is also available for either Oilcut, Watercut or Water Oil Ratio versus Cumulative Production analysis, including decline curve analysis, chart tooltips, and ultimate recovery at abandonment prediction. Specific examples are provided for completeness below, although the equations and methods are identical to the Oil Production section. Regress Decline Exponents The method to regress decline exponents is identical to the Oil and Gas Rate versus Cumulative Analysis, presented is earlier sections. First select the Regress Decline Exponents then Select Points chart context menu item, as shown below. Then digitize two points on the chart

40 40 UKFields Help Once the user has selected two points, a message box will popup notifying the user that 2 points have been selected. The application will automatically fit a straight line between these 2 digitized points, and report the gradient and intercept of this line, as shown below. The user can choose to fit a semi logarithmic straight line, by selecting the Regress Log Y Values check box, also shown below, assuming this is checked then the application will automatically update the fit, and report the revised gradient and intercept of this line.

41 Cumulative Analysis 41 The user can also calculate an approximate Ultimate Recovery, by selecting between using the decline trend or last production value and inputting a final abandonment production value. The user should then press the Predict button, as shown above, to extrapolate the line to the abandonment value. See calculated result below.

42 UKFields Help Watercut v's Np/N The Watercut versus Np/N chart can be seen as a measure of the waterdrive efficiency of a specific oil field, which is typically linked to the degree of vertical permeability heterogeneity and the oil / water viscosity contrast. The chart requires additional estimated values for original in-place volumes (STOIIP), a likely abandonment ultimate recovery factor and an abandonment watercut. See below. This chart can also be used as a data source for our other application Profile, which is a generic Production Profile Generation and Analysis application. See our homepage for more details www. PetroleumSolutions.co.uk.

43 Cumulative Analysis 43 Once these 3 additional values have been input the user can start to iterate values for early and late watercut curvature.

44 44 UKFields Help Negative values of early curvature generally translate to a delayed water production breakthough, potentially implying good piston-like waterdrive efficiency. Highly positive of early curvature translate in rapid water breakthrough, potentially implying an adverse or poor waterdrive application, with likely high permeability streaks and/or high oil / water viscosity contrast. This situation will likely create poor vertical and/or areal sweep efficiency and create a high potential for bypassed oil. Negative values of late curvature generally translate to a longer period of high water "tail" production, that asymptotes slowly towards the abandonment recovery factor and watercut levels. A positive value for late curvature, when combined with a negative value for early curvature is typically the best character for a waterdrive displacement process, and implies a delayed water breakthrough followed by a rapid watercut development to the likely high value of ultimate recovery factor. This is the ideal piston-like waterflood displacement process. Should the user wish to save this match of watercut v's Np/N, they should simply select the Save Forecast button, as shown below.

45 Cumulative Analysis 45
46 UKFields UK Oil and Gas Field Production Analysis Software Part VI

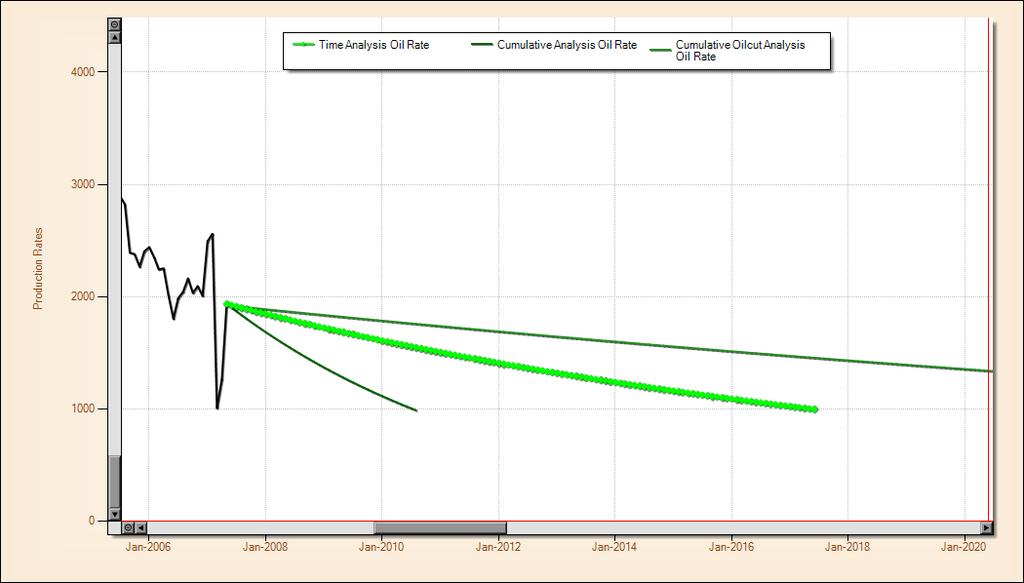
47 Predictions 6 47 Predictions For all the decline curves that were saved during the Time Analysis and Cumulative Analysis sections, the user now has the ability to forecast on a monthly basis the likely future oil, gas, water and liquid production profiles. For the Oil and Gas rate versus time, the prediction setup is simple and is highlighted at the top of the screen capture below. The uses the calculated and saved decline curve parameters and the user can change whether to forecast from the decline trend or use the last historical production rate; the user should also input the final abandonment prediction rate. Once the user presses the Calculate Predictions button, the application will simply progress monthly using the decline curve and prediction parameters until the abandonment production level is reached For Oil and Gas rate versus Cumulative Production, the application progresses from month to month using the gradient and intercept relationship together with Newton-Raphson iteration to ensure that the monthly extrapolated production rates follow the original decline parameters. The oilcut, watercut and water-oil ratio prediction methods use a similar extrapolation technique to the oil and gas rate versus cumulative production, however need to be linked to an oil production rate forecast or assume a constant liquid rate in order to convert these forecasts to time. As such the application provides three methods to generate this time forecast; namely 1. Link to Oil Rate v's Time Prediction 2. Link to Oil Rate v' Cumulative Prediction 3. Input Constant LIquid Rate Value Examples of these options are highlighted below.

48 48 UKFields Help Once the user has successfully input all the appropriate data for a time forecast to be calculated and pressed the Calculate Predictions button, as shown above, then the Prediction Charts tab should contain an active chart with the predictions displayed. The user can zoom in and scroll around the chart area to examine and compare the range of time forecasts calculated.


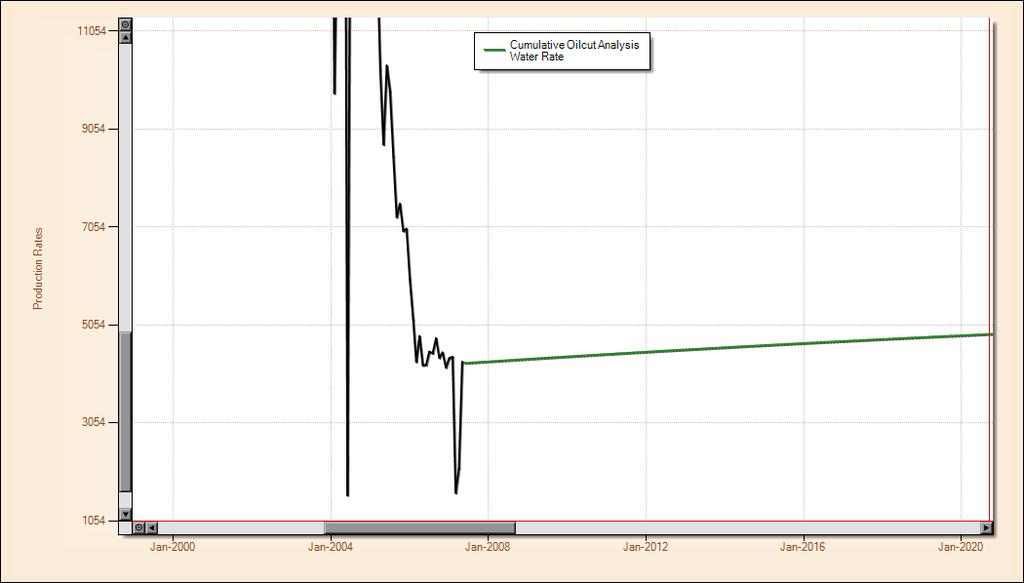
49 Predictions 49 Assuming an oilcut, watercut or water oil ratio forecast was successfully calculated then the user can switch to the water production rate prediction chart, as shown below, and again choose to zoom in the examine these forecasts.

50 50 UKFields Help All of the forecasts that were calculated are reported in the Prediction Tables tab. The user can copy and paste the data from this table to external applications, via the two methods discussed below. 1. Either press the right mouse button once over any of the tables to activate the table context menu, as highlighted below, then select the various menu item to copy a specific table to the clipboard. See screen capture example below. 2. Or, simply select and drag an area with the mouse, then press the standard windows CTRL+C keys to copy the selected area to the clipboard.

51 Predictions 51 Constant Liquid Rate Prediction As discussed above, the user can choose to forecast the oilcut, watercut or water oil ratio prediction with time assuming a constant liquid rate. This is illustrated with the example below. The user should select the Input Constant Liquid Rate Value from the Convert to Time Options dropdown list box, as shown below.


52 52 UKFields Help The user should then input a constant liquid rate value in the appropriate input box, as shown below. Then the user can press the Calculate Predictions button.
53 Predictions ] 53
54
How To Graphically Analyze Production History Data
 How To Graphically Analyze Production History Data March 25, 2004 MICA can plot production history on a semi-log graph, analyze any section of the production history with a least squares regression and
User Manual Veterinary
 Veterinary Acquisition and diagnostic software Doc No.: Rev 1.0.1 Aug 2013 Part No.: CR-FPM-04-022-EN-S 3DISC, FireCR, Quantor and the 3D Cube are trademarks of 3D Imaging & Simulations Corp, South Korea,
Picture Style Editor Ver Instruction Manual
 ENGLISH Picture Style File Creating Software Picture Style Editor Ver. 1.12 Instruction Manual Content of this Instruction Manual PSE is used for Picture Style Editor. In this manual, the windows used
Kodiak Corporate Administration Tool
 AT&T Business Mobility Kodiak Corporate Administration Tool User Guide Release 8.3 Table of Contents Introduction and Key Features 2 Getting Started 2 Navigate the Corporate Administration Tool 2 Manage
Copyright 2014 SOTA Imaging. All rights reserved. The CLIOSOFT software includes the following parts copyrighted by other parties:
 2.0 User Manual Copyright 2014 SOTA Imaging. All rights reserved. This manual and the software described herein are protected by copyright laws and international copyright treaties, as well as other intellectual
User Guide. Version 1.4. Copyright Favor Software. Revised:
 User Guide Version 1.4 Copyright 2009-2012 Favor Software Revised: 2012.02.06 Table of Contents Introduction... 4 Installation on Windows... 5 Installation on Macintosh... 6 Registering Intwined Pattern
SKF TKTI. Thermal Camera Software. Instructions for use
 SKF TKTI Thermal Camera Software Instructions for use Table of contents 1. Introduction...4 1.1 Installing and starting the Software... 5 2. Usage Notes...6 3. Image Properties...7 3.1 Loading images
RAZER CENTRAL ONLINE MASTER GUIDE
 RAZER CENTRAL ONLINE MASTER GUIDE CONTENTS 1. RAZER CENTRAL... 2 2. SIGNING IN... 3 3. RETRIEVING FORGOTTEN PASSWORDS... 4 4. CREATING A RAZER ID ACCOUNT... 7 5. USING RAZER CENTRAL... 11 6. SIGNING OUT...
FlashChart. Symbols and Chart Settings. Main menu navigation. Data compression and time period of the chart. Chart types.
 FlashChart Symbols and Chart Settings With FlashChart you can display several symbols (for example indices, securities or currency pairs) in an interactive chart. You can also add indicators and draw on
Plot cylinder pressure against crank angle
 Plot cylinder pressure against crank angle You can create a new diagram three ways: Select Diagram, New Diagram Press F5 Click the New Diagram icon on the toolbar This will open the Select Channels dialogue.
Contents. Nikon Scan for Windows. Scanner Control Software and TWAIN Source. Reference Manual. Overview Before You Begin.
 Contents Overview Before You Begin System Requirements Software Installation Basic Operations Scanner Control Software and TWAIN Source Nikon Scan for Windows Reference Manual The Scan Window Opening the
Generate Ethylene Vapor Pressure Curves with Aspen Plus V8.0
 Generate Ethylene Vapor Pressure Curves with Aspen Plus V8.0 1. Lesson Objectives Learn how to use the Methods Assistant to select physical property methods Generate vapor pressure curves for Ethylene
Selecting the Right Model Studio PC Version
 Name Recitation Selecting the Right Model Studio PC Version We have seen linear and quadratic models for various data sets. However, once one collects data it is not always clear what model to use; that
Effective Training Inc. Aug 2009
 User Manual 1 Trademark Acknowledgements The GD&T Trainer Professional Edition is a trademark of Effective Training Inc. This product is authored using Toolbook Instructor from SumTotal Systems and Flash
KODAK Dental Imaging Software. Quick Start Guide
 KODAK Dental Imaging Software Quick Start Guide Notice Congratulations on your purchase of The KODAK Dental Imaging Software. Thank you for your confidence in our products and we will do all in our power
Picture Style Editor Ver Instruction Manual
 ENGLISH Picture Style File Creating Software Picture Style Editor Ver. 1.18 Instruction Manual Content of this Instruction Manual PSE stands for Picture Style Editor. In this manual, the windows used in
DOCUMENT SCANNER INSTRUCTIONS. Space. Backup. Count Only. New File. Scanner. Feeding Option Manual Auto Semi-Auto
 E FILM F Scanner A Space Count Only New File Feeding Option Manual Auto Semi-Auto Backup DOCUMENT SCANNER INSTRUCTIONS NOTICE q Copyright 2001 by CANON ELECTRONICS INC. All rights reserved. No part of
Field Device Manager Express
 Honeywell Process Solutions Field Device Manager Express Software Installation User's Guide EP-FDM-02430X R430 June 2012 Release 430 Honeywell Notices and Trademarks Copyright 2010 by Honeywell International
User Guide. Version 1.2. Copyright Favor Software. Revised:
 User Guide Version 1.2 Copyright 2009-2010 Favor Software Revised: 2010.05.18 Table of Contents Introduction...4 Installation on Windows...5 Installation on Macintosh...6 Registering Intwined Pattern Studio...7
Page 21 GRAPHING OBJECTIVES:
 Page 21 GRAPHING OBJECTIVES: 1. To learn how to present data in graphical form manually (paper-and-pencil) and using computer software. 2. To learn how to interpret graphical data by, a. determining the
MN E. Waveform Viewer: Power Xpert Software 2.2
 MN02601003E Waveform Viewer: Power Xpert Software 2.2 Waveform Viewer User's Guide Waveform Viewer User's Guide Publication date 7/2011 Copyright 2010 by Eaton Corporation. All rights reserved. Specifications
UM DALI getting started guide. Document information
 Rev. 1 6 March 2012 User manual Document information Info Keywords Abstract Content LPC111x, LPC1343, ARM, Cortex M0/M3, DALI, USB, lighting control, USB to DALI interface. This user manual explains how
LD2342 USWM V1.6. LD2342 V1.4 Page 1 of 18
 LD2342 USWM V1.6 LD2342 V1.4 Page 1 of 18 GENERAL WARNINGS All Class A and Class B marine Automatic Identification System (AIS) units utilize a satellite based system such as the Global Positioning Satellite
Getting Started. Spectra Acquisition Tutorial
 Getting Started Spectra Acquisition Tutorial ABB Bomem Inc. All Rights Reserved. This Guide and the accompanying software are copyrighted and all rights are reserved by ABB. This product, including software
Laboratory Experiment #1 Introduction to Spectral Analysis
 J.B.Francis College of Engineering Mechanical Engineering Department 22-403 Laboratory Experiment #1 Introduction to Spectral Analysis Introduction The quantification of electrical energy can be accomplished
PASS Sample Size Software. These options specify the characteristics of the lines, labels, and tick marks along the X and Y axes.
 Chapter 940 Introduction This section describes the options that are available for the appearance of a scatter plot. A set of all these options can be stored as a template file which can be retrieved later.
TeleTrader FlashChart
 TeleTrader FlashChart Symbols and Chart Settings With TeleTrader FlashChart you can display several symbols (for example indices, securities or currency pairs) in an interactive chart. You can also add
Embroidery Gatherings
 Planning Machine Embroidery Digitizing and Designs Floriani FTCU Digitizing Fill stitches with a hole Or Add a hole to a Filled stitch object Create a digitizing plan It may be helpful to print a photocopy
DEVELOPING THE WORKFORCE
 DEVELOPING THE WORKFORCE Assessing the quality of death certification: Instructions for the online assessment tool Resources and Tools 3 November 2016 About this series Capacity-building resources and
WEB I/O. Wireless On/Off Control USER MANUAL
 Wireless On/Off Control Technical Support: Email: support@encomwireless.com Toll Free: 1 800 617 3487 Worldwide: (403) 230 1122 Fax: (403) 276 9575 Web: www.encomwireless.com Warnings and Precautions Warnings
Laboratory 1: Motion in One Dimension
 Phys 131L Spring 2018 Laboratory 1: Motion in One Dimension Classical physics describes the motion of objects with the fundamental goal of tracking the position of an object as time passes. The simplest
Getting Started. with Easy Blue Print
 Getting Started with Easy Blue Print User Interface Overview Easy Blue Print is a simple drawing program that will allow you to create professional-looking 2D floor plan drawings. This guide covers the
UM DALI getting started guide. Document information
 Rev. 2 6 March 2013 User manual Document information Info Content Keywords LPC111x, LPC1343, ARM, Cortex M0/M3, DALI, USB, lighting control, USB to DALI interface. Abstract This user manual explains how
Quick Start Guide for the PULSE PROFILING APPLICATION
 Quick Start Guide for the PULSE PROFILING APPLICATION MODEL LB480A Revision: Preliminary 02/05/09 1 1. Introduction This document provides information to install and quickly start using your PowerSensor+.
Solving tasks and move score... 18
 Solving tasks and move score... 18 Contents Contents... 1 Introduction... 3 Welcome to Peshk@!... 3 System requirements... 3 Software installation... 4 Technical support service... 4 User interface...
Super HUD- User Guide
 - User Guide From Poker Pro Labs Version - 2 1. Introduction to Super HUD... 1 2. Installing Super HUD... 2 3. Getting Started... 7 3.1 Don t have an Account?... 8 3.2 Super HUD Membership(s)... 9 4. Super
SysInfoTools PDF Image Extractor v2.0
 SysInfoTools PDF Image Extractor v2.0 Table Of Contents 1. SysInfoTools PDF Image Extractor v2.0... 2 2. Overview... 2 3. Getting Started... 4 3.1 Installation procedure... 4 4. Order and Activation...
ID Photo Processor. Batch photo processing. User Guide
 ID Photo Processor Batch photo processing User Guide 2015 Akond company 197342, Russia, St.-Petersburg, Serdobolskaya, 65a Phone/fax: +7(812)384-6430 Cell: +7(921)757-8319 e-mail: info@akond.net http://www.akond.net
House Design Tutorial
 House Design Tutorial This House Design Tutorial shows you how to get started on a design project. The tutorials that follow continue with the same plan. When you are finished, you will have created a
FUJITSU TWAIN 32 Scanner Driver. Scanner Utility for Microsoft Windows Version User's Guide
 P3PC- E417-02EN FUJITSU TWAIN 32 Scanner Driver Scanner Utility for Microsoft Windows Version 9.10 User's Guide For Use with Microsoft Windows 98, Windows Me, Windows 2000 and Windows XP Introduction
Oracle Real-Time Scheduler
 Oracle Real-Time Scheduler Map Editor Installation Guide Release 2.2.0 Service Pack 3 for Windows E60114-02 May 2015 Map Editor Installation Guide for Oracle Real-Time Scheduler Release 2.2.0 Service Pack
Thermo ImageQuest Version 1.0.1
 Thermo ImageQuest Version 1.0.1 User Guide XCALI-97200 Revision B May 2009 2009 Thermo Fisher Scientific Inc. All rights reserved. Xcalibur is a registered trademark of Thermo Fisher Scientific Inc. in
Scanner Utility for Microsoft Windows Version 9.6. User's Guide
 P3PC-E892-03EN Scanner Utility for Microsoft Windows Version 9.6 User's Guide For Use with Microsoft Windows 98, Windows Me, Windows 2000 and Windows XP Introduction Thank you for purchasing the "Scanner
inphoto ID Canon camera control software Automatic ID photography User Guide
 inphoto ID Canon camera control software Automatic ID photography User Guide 2008 Akond company 197342, Russia, St.-Petersburg, Serdobolskaya, 65A Phone/fax: +7(812)600-6918 Cell: +7(921)757-8319 e-mail:
Copyright Notice. Trademarks
 Copyright Notice All rights reserved. No part of this publication may be reproduced, stored in a retrieval system, or transmitted in any form or by any means, electronic, mechanical, photocopying, recording,
IB Nov User s Manual. KFM Series Application Software. FCTester. Ver. 1.1
 IB011511 Nov. 2006 User s Manual KFM Series Application Software FCTester Ver. 1.1 Use of This Manual Please read through and understand this User s Manual before operating the product. After reading,
Monaco ColorWorks User Guide
 Monaco ColorWorks User Guide Monaco ColorWorks User Guide Printed in the U.S.A. 2003 Monaco Systems, Inc. All rights reserved. This document contains proprietary information of Monaco Systems, Inc. No
RICOH Stereo Camera Software R-Stereo-GigE-Calibration
 RICOH Stereo Camera Software R-Stereo-GigE-Calibration User's Guide RICOH Industrial Solutions Inc. 1/18 Contents 1. FUNCTION OVERVIEW... 3 1.1 Operating Environment... 3 2. OPERATING PROCEDURES... 4 3.
Fuji IGBT Simulator for Automotive Ver. 6.1 or later Operation manual
 Fuji IGBT Simulator for Automotive Ver. 6. or later Operation manual 207.2 MT5F36567 Fuji Electric Co., Ltd. All rights reserved End-User Software License Agreement (Caution) Before downloading and using
Aimetis Outdoor Object Tracker. 2.0 User Guide
 Aimetis Outdoor Object Tracker 0 User Guide Contents Contents Introduction...3 Installation... 4 Requirements... 4 Install Outdoor Object Tracker...4 Open Outdoor Object Tracker... 4 Add a license... 5...
Digital Photo Guide. Version 8
 Digital Photo Guide Version 8 Simsol Photo Guide 1 Simsol s Digital Photo Guide Contents Simsol s Digital Photo Guide Contents 1 Setting Up Your Camera to Take a Good Photo 2 Importing Digital Photos into
Creo Revolve Tutorial
 Creo Revolve Tutorial Setup 1. Open Creo Parametric Note: Refer back to the Creo Extrude Tutorial for references and screen shots of the Creo layout 2. Set Working Directory a. From the Model Tree navigate
ThermaViz. Operating Manual. The Innovative Two-Wavelength Imaging Pyrometer
 ThermaViz The Innovative Two-Wavelength Imaging Pyrometer Operating Manual The integration of advanced optical diagnostics and intelligent materials processing for temperature measurement and process control.
Lab 4 Projectile Motion
 b Lab 4 Projectile Motion What You Need To Know: x x v v v o ox ox v v ox at 1 t at a x FIGURE 1 Linear Motion Equations The Physics So far in lab you ve dealt with an object moving horizontally or an
Experiment G: Introduction to Graphical Representation of Data & the Use of Excel
 Experiment G: Introduction to Graphical Representation of Data & the Use of Excel Scientists answer posed questions by performing experiments which provide information about a given problem. After collecting
Introduction to: Microsoft Photo Story 3. for Windows. Brevard County, Florida
 Introduction to: Microsoft Photo Story 3 for Windows Brevard County, Florida 1 Table of Contents Introduction... 3 Downloading Photo Story 3... 4 Adding Pictures to Your PC... 7 Launching Photo Story 3...
Tribometrics. Version 2.11
 Tribometrics Version 2.11 Table of Contents Tribometrics... 1 Version 2.11... 1 1. About This Document... 4 1.1. Conventions... 4 2. Introduction... 5 2.1. Software Features... 5 2.2. Tribometrics Overview...
InsideIR. Users Manual. Thermal Image Analysis Software
 InsideIR Thermal Image Analysis Software Users Manual January 2006 2006 Fluke Corporation, All rights reserved. Printed in USA. All product names are trademarks of their respective companies. Table of
Windows INSTRUCTION MANUAL
 Windows E INSTRUCTION MANUAL Contents About This Manual... 3 Main Features and Structure... 4 Operation Flow... 5 System Requirements... 8 Supported Image Formats... 8 1 Installing the Software... 1-1
House Design Tutorial
 House Design Tutorial This House Design Tutorial shows you how to get started on a design project. The tutorials that follow continue with the same plan. When you are finished, you will have created a
uiulearn TUTORIAL INTEGRATIONS> HOW TO USE PANOPTO (STUDENT)
") uiulearn TUTORIAL INTEGRATIONS> HOW TO USE PANOPTO (STUDENT) This tutorial covers how to record a Panopto video for your course. IN ORDER TO DO THIS, YOUR INSTRUCTOR MUST COMPLETE SEVERAL STEPS TO ALLOW
uiulearn TUTORIAL INTEGRATIONS> HOW TO USE PANOPTO (STUDENT) This tutorial covers how to record a Panopto video for your course. IN ORDER TO DO THIS, YOUR INSTRUCTOR MUST COMPLETE SEVERAL STEPS TO ALLOW
Click here to give us your feedback. New FamilySearch Reference Manual
 Click here to give us your feedback. New FamilySearch Reference Manual January 25, 2011 2009 by Intellectual Reserve, Inc. All rights reserved Printed in the United States of America English approval:
RAZER GOLIATHUS CHROMA
 RAZER GOLIATHUS CHROMA MASTER GUIDE The Razer Goliathus Chroma soft gaming mouse mat is now Powered by Razer Chroma. Featuring multi-color lighting with inter-device color synchronization, the bestselling
First English edition for Ulead COOL 360 version 1.0, February 1999.
 First English edition for Ulead COOL 360 version 1.0, February 1999. 1992-1999 Ulead Systems, Inc. All rights reserved. No part of this publication may be reproduced or transmitted in any form or by any
Ansible Tower Quick Setup Guide
 Ansible Tower Quick Setup Guide Release Ansible Tower 3.1.3 Red Hat, Inc. Feb 27, 2018 CONTENTS 1 Quick Start 2 2 Login as a Superuser 3 3 Import a License 5 4 Examine the Tower Dashboard 7 5 The Settings
1. What is SENSE Batch
 1. What is SENSE Batch 1.1. Introduction SENSE Batch is processing software for thermal images and sequences. It is a modern software which automates repetitive tasks with thermal images. The most important
SensorTrace BASIC 3.0 user manual
 SensorTrace BASIC 3.0 user manual 3 Se n s o rtr a c e BASIC 3.0 Us e r Ma n u a l Copyright 2010 Unisense A/S Version October 2010 SensorTrace basic 3.0 User manual Unisense A/S TABLE OF CONTENTS Congratulations
inphoto ID PS Automatic ID photography With Canon PowerShot camera User Guide
 inphoto ID PS Automatic ID photography With Canon PowerShot camera User Guide 2018 Akond company Phone/fax: +7(812)384-6430 Cell: +7(921)757-8319 e-mail: info@akond.net akondsales@gmail.com http://www.akond.net
pcon.planner PRO Plugin VR-Viewer
 pcon.planner PRO Plugin VR-Viewer Manual Dokument Version 1.2 Author DRT Date 04/2018 2018 EasternGraphics GmbH 1/10 pcon.planner PRO Plugin VR-Viewer Manual Content 1 Things to Know... 3 2 Technical Tips...
UN-SCAN-IT gel TM Version 6.3. User's Manual for. Macintosh (OS X)
") UN-SCAN-IT gel TM Version 6.3 User's Manual for Macintosh (OS X) Silk Scientific Inc. software and manuals are copyrighted, which means that your right to copy any part of them is limited by copyright
UN-SCAN-IT gel TM Version 6.3 User's Manual for Macintosh (OS X) Silk Scientific Inc. software and manuals are copyrighted, which means that your right to copy any part of them is limited by copyright
Submittals Quick Reference Guide
 This topic provides a reference for the Project Center Submittals activity center. Purpose The Submittals activity center in Newforma Contract Management enables you to effectively log submittals and track
Picture Style Editor Ver Instruction Manual
 ENGLISH Picture Style File Creating Software Picture Style Editor Ver. 1.15 Instruction Manual Content of this Instruction Manual PSE stands for Picture Style Editor. indicates the selection procedure
Reference guide. Version ZOOM CORPORATION. Copying or reprinting this manual in part or in whole without permission is prohibited.
 Version 4.0 Reference guide This document cannot be displayed properly on black-and-white displays. 2019 ZOOM CORPORATION Copying or reprinting this manual in part or in whole without permission is prohibited.
Ortelia Set Designer User Manual
 Ortelia Set Designer User Manual http://ortelia.com 1 Table of Contents Introducing Ortelia Set Designer...3 System Requirements...4 1. Operating system:... 4 2. Hardware:... 4 Minimum Graphics card specification...4
Introducing Photo Story 3
 Introducing Photo Story 3 SAVE YOUR WORK OFTEN!!! Page: 2 of 22 Table of Contents 0. Prefix...4 I. Starting Photo Story 3...5 II. Welcome Screen...5 III. Import and Arrange...6 IV. Editing...8 V. Add a
ASN Filter Designer Professional/Lite Getting Started Guide
 ASN Filter Designer Professional/Lite Getting Started Guide December, 2011 ASN11-DOC007, Rev. 2 For public release Legal notices All material presented in this document is protected by copyright under
Starting Family Tree: Navigating, adding, standardizing, printing
 Starting Family Tree: Navigating, adding, standardizing, printing The FamilySearch logo on the upper left is a functioning icon. Clicking on this takes you back to the home page for the website. The website
Accessing e-books with your e-reader
 e-reader 1 Accessing e-books with your e-reader What you need to know about library e-books is that each one is protected by Digital Rights Management (DRM). This means that access to e-books is restricted
Welcome to the Word Puzzles Help File.
 HELP FILE Welcome to the Word Puzzles Help File. Word Puzzles is relaxing fun and endlessly challenging. Solving these puzzles can provide a sense of accomplishment and well-being. Exercise your brain!
LincView OPC USER GUIDE. Enhanced Diagnostics Utility INDUSTRIAL DATA COMMUNICATIONS
 USER GUIDE INDUSTRIAL DATA COMMUNICATIONS LincView OPC Enhanced Diagnostics Utility It is essential that all instructions contained in the User Guide are followed precisely to ensure proper operation of
An Introductory Guide to Circuit Simulation using NI Multisim 12
 School of Engineering and Technology An Introductory Guide to Circuit Simulation using NI Multisim 12 This booklet belongs to: This document provides a brief overview and introductory tutorial for circuit
Organizing and Customizing Content
 Organizing and Customizing Content JUMPSTART Session 2: Organizing and Customizing Content Welcome to this Jumpstart session on Organizing and Customizing Content. We hope you have had a chance to explore
AreaSketch Pro Overview for ClickForms Users
 AreaSketch Pro Overview for ClickForms Users Designed for Real Property Specialist Designed specifically for field professionals required to draw an accurate sketch and calculate the area and perimeter
How To Handbook For Learners
 How To Handbook For Learners 2017 Contents 3 How do I log in? 4-5 How do I watch a video? 6-9 How do I take an assessment? 10-11 How do I review an assessment I have just written? 12-13 How do I review
Setup and Walk Through Guide Orion for Clubs Orion at Home
 Setup and Walk Through Guide Orion for Clubs Orion at Home Shooter s Technology LLC Copyright by Shooter s Technology LLC, All Rights Reserved Version 2.5 September 14, 2018 Welcome to the Orion Scoring
Chanalyzer Lab. Chanalyzer Lab by MetaGeek USER GUIDE page 1
 Chanalyzer Lab Chanalyzer Lab by MetaGeek USER GUIDE page 1 Chanalyzer Lab spectrum analysis software Table of Contents Control Your Wi-Spy What is a Wi-Spy? What is Chanalyzer Lab? Installation 1) Download
Managing images with NewZapp
 Managing images with NewZapp This guide is for anyone using the NewZapp Fixed editor as opposed to the Drag and Drop editor. The Image Manager is where images are uploaded and stored in your NewZapp account
RLC-circuits with Cobra4 Xpert-Link
 Student's Sheet RLC-circuits with Cobra4 Xpert-Link (Item No.: P2440664) Curricular Relevance Area of Expertise: Physics Subtopic: Inductance, Electromagnetic Oscillations, AC Circuits Topic: Electricity
Importing and processing gel images
 BioNumerics Tutorial: Importing and processing gel images 1 Aim Comprehensive tools for the processing of electrophoresis fingerprints, both from slab gels and capillary sequencers are incorporated into
ScanGear CS-U 5.6. for CanoScan FB1210U Color Scanner. User s Guide
 ScanGear CS-U 5.6 for CanoScan FB1210U Color Scanner User s Guide Copyright Notice Copyright 2000 Canon Inc. This manual is copyrighted with all rights reserved. Under the copyright laws, this manual may
iq-led Software V2.1
 iq-led Software V2.1 User Manual 31. January 2018 Image Engineering GmbH & Co. KG Im Gleisdreieck 5 50169 Kerpen-Horrem Germany T +49 2273 99991-0 F +49 2273 99991-10 www.image-engineering.com CONTENT
Hyperion System 9 Financial Data Quality Management. Quick Reference Guide
 Hyperion System 9 Financial Data Quality Management Quick Reference Guide Hyperion FDM Release 9.2.0. 2000 2006 - Hyperion Solutions Corporation. All rights reserved. Hyperion, the Hyperion logo and Hyperion
Getting Started Guide
 SOLIDWORKS Getting Started Guide SOLIDWORKS Electrical FIRST Robotics Edition Alexander Ouellet 1/2/2015 Table of Contents INTRODUCTION... 1 What is SOLIDWORKS Electrical?... Error! Bookmark not defined.
Advanced Tools for Graphical Authoring of Dynamic Virtual Environments at the NADS
 Advanced Tools for Graphical Authoring of Dynamic Virtual Environments at the NADS Matt Schikore Yiannis E. Papelis Ginger Watson National Advanced Driving Simulator & Simulation Center The University
DakStats Web-Sync. Operation Manual. DD Rev 4 12 December 2012
 DakStats Web-Sync Operation Manual DD1670479 Rev 4 12 December 2012 201 Daktronics Drive PO Box 5128 Brookings, SD 57006-5128 Tel: 1-800-DAKTRONICS (1-800-325-8766) Fax: 605-697-4746 www.daktronics.com
ExtrAXION. Extracting Drawing data. Benefits.
 ExtrAXION Extracting Drawing data ExtrAXION is the simplest and most complete quantity takeoff software tool for construction plans. It has the ability to measure on vector files CAD (dwg, dxf, dgn, emf,
User Manual for PROGRES GRYPHAX software
 User Manual for PROGRES GRYPHAX software PROGRES GRYPHAX software JENOPTIK l Healthcare & Industry JENOPTIK Optical Systems GmbH Göschwitzer Straße 25 07745 Jena, Germany Dear user, Please read the instructions
Create A Mug. Skills Learned. Settings Sketching 3-D Features. Revolve Offset Plane Sweep Fillet Decal* Offset Arc
 Create A Mug Skills Learned Settings Sketching 3-D Features Slice Line Tool Offset Arc Revolve Offset Plane Sweep Fillet Decal* Tutorial: Creating A Custom Mug There are somethings in this world that have
House Design Tutorial
 Chapter 2: House Design Tutorial This House Design Tutorial shows you how to get started on a design project. The tutorials that follow continue with the same plan. When you are finished, you will have
Version 9.1 SmartPTT Monitoring
 Version 9.1 SmartPTT Monitoring December 2016 Table of Contents Table of Contents 1.1 Introduction 2 1.2 Installation of the SmartPTT software 2 1.3 General SmartPTT Radioserver Configuration 6 1.4 SmartPTT