The Henry Fund Henry B. Tippie School of Management Luv Bhagria
|
|
|
- Eugene Wilson
- 6 years ago
- Views:
Transcription
 October 16, 2017 Information Technology- Video-game Software and Services Stock Rating BUY Investment Thesis Target Price $70-72 Henry Fund DCF $71.")
1 The Henry Fund Henry B. Tippie School of Management Luv Bhagria Activision Blizzard (ATVI) October 16, 2017 Information Technology- Video-game Software and Services Stock Rating BUY Investment Thesis Target Price $70-72 Henry Fund DCF $71.57 Henry Fund DDM $40.19 Relative P/S Multiple $60.06 Price Data Current Price $ wk Range $ Consensus 1yr Target $69.84 Key Statistics Market Cap (B) $46.60 Shares Outstanding (M) Institutional Ownership 88.92% Five Year Beta 1.16 Dividend Yield 0.42% Est. 5yr Growth 15.28% Price/Earnings (TTM) 42.5 Price/Earnings (FY1) Price/Sales (TTM) 6.72 Price/Book (mrq) 4.80 We recommend a BUY rating for Activision Blizzard, as the company is poised to enter into a lucrative esports market with its new franchise (Overwatch). Moreover, domination in the First-Person shooter (FPS) genre with Call of Duty titles, digitalization of the gaming industry and increasing demand for mobile games will be the key driving forces. The company managed to form a strong senior management team this year to lead them in new businesses. Our model suggests an upside of 16% for Activision, with a target price range of $ Drivers of Thesis Continued dominance in FPS genre: Activision s Call of Duty titles are the top selling FPS titles every year on consoles and PC. Although the last few titles have underperformed, the World War story lines will drive the console sales at 3.52% CAGR through 2025 Entry to huge esports market: Activision, with its Overwatch title, announced to form its own esports championship league, starting later in 2017, adding roughly $100 million to revenue in the first year King Digital to strengthen Mobile games segment: Acquisition of King Digital back in 2016 not only strengthened mobile games segment for Activision but also provided them with expertise to produce more breakthrough games (CAGR growth estimated at 5.44% through 2025) Strong Management: Adding former CFO of Walt Disney and bringing back Coddy Johnson as COO strengthened the company s talent pool Risks to Thesis Lack of innovative new franchises: The company cannot completely rely on Call of Duty titles. The gamers need new story line or new franchise games every couple of years Overwatch might not gain enough popularity in esports: traditionally gamers in esports have liked role-playing, strategy or Online Battle Arena games Earnings Estimates Year E 2018E 2019E EPS $1.14 $1.21 $1.30 $1.27 $1.87 $2.57 growth 18.4% 6.1% 7.4% -2.0% 46.9% 37.0% 38% 28% 18% 8% -2% -12% -22% Important disclosures appear on the last page of this report. Profitability Operating Margin(mrq) 14.44% Profit Margin (mrq) 9.42% Return on Assets (TTM) 5.83% Return on Equity (TTM) 12.27% 12 Month Performance Company Description ATVI S&P 500 S O N D J F M A M J J A ATVI Industry Sector Data Source: Factset and Yahoo P/E ROE EV/EBITDA Activision Blizzard is a leading video-game publishing company in the US, with FPS (First-Person Shooter) titles like Call of Duty, Destiny, World of Warcraft, Overwatch and Skylanders. The company recently acquired King Digital, the makers of Candy Crush franchise, to strengthen the mobile games segment. The firm plans on entering the lucrative esports market with its own league based around Overwatch.

2 EXECUTIVE SUMMARY We recommend a BUY rating for Activision Blizzard as the company is poised to grow in the next console cycle, expected to release in late The company dominates in the FPS genre games with 3 huge franchises. Moreover, it acquired the world leader in mobile games, King Digital, which will bring strong innovation to the segment. Moreover, the company s new PC games has witnessed increased popularity over the last 2 years. Another huge factor that will drive the business is the entry into new esports segment. Activision, with its Overwatch title, has created its own championship league in esports expected to start later this year. esports is a huge market currently untapped in the US markets. This will help the esports segment to grow at a CAGR of 20% of the next couple of years. Customers: The firm s customers are: Direct end consumers: through Battle.net platform Platform providers: Sony, Microsoft (MSFT), Apple (AAPL) Retailers: Walmart (WMT), GameStop (GME) For the fiscal year (FY) 2016, Sony and Apple accounted for 13% of the net revenues, whereas for FY 2015, Sony and Microsoft accounted for 12% and 10% of the net revenues respectively. 1 To handle all these new businesses, the company introduced talented senior officials into the team with new CFO Spencer Neumann, former CFO at Walt Disney Co. s (DIS) park divisions. Moreover, Coddy Johnson has returned to Activision and will serve as the new COO of the company. As per our calculations, the intrinsic value of the company is $71.57, nearly 16% above the current market price of $61.66, putting the company s rating as a buy. COMPANY DESCRIPTION & ANALYSIS Founded in 1979, the Santa Monica, California based company, Activision Blizzard, is a leading developer and publisher of interactive entertainment (Video-games) software and services. The company distributes the content and services on all major gaming platforms: videogame consoles, personal computers (PCs), mobile devices and other handheld devices. 1 The merger of Activision Inc. and Vivendi Games in 2008 resulted in the formation of the parent company, Activision Blizzard. 2 On February 23, 2016, the company acquired King Digital Entertainment, a leading interactive mobile gaming company, at an aggregate price of $5.8 billion. 3 As of January 2017, Activision is one of the largest thirdparty video-game publishers globally, as well as the top publishers for 2016 in the US. 4 (Appendix:1) Data Source: ATVI, SEC filings, 10-K 2017 Products: The games developed by Activision cover a wide range of genres: first-person shooter (FPS), action/adventure, role-playing games (RPG), strategy and match-three games (tile-matching: Candy Crush) The services offered by the company include: Full games: access to main game content (console or PC) Downloadable content (DLC): additional in-game content to purchase following purchase of full game Microtransactions: small parts of additional ingame content of enhancements for gameplay (at low price) Subscriptions: continual access to game content online Page 2
. These consoles first appeared in 1972, and are currently in their eighth generation.")
3 REVENUE DECOMPOSITION: Consoles Activision Blizzard reports and breaks down its revenue in 4 different ways: This segment deals with the video-game sales for the gaming home console platforms (mostly the television consoles). These consoles first appeared in 1972, and are currently in their eighth generation. (Appendix:2) Business segments (Activision, Blizzard, King and Others) Platforms (Consoles, Mobile, PC, Online and others) Distribution Channels (Digital online, retail and other) Geographic segments (Americas, EMEA and Asia Pacific) Although our report and thesis involve research on all the different methods, we try to focus our revenue growth forecasts purely on platforms segmentation. We believe that each platform has its own drivers and growth factors, and thus is a more efficient tool for forecasting. Platform Segments: Activision s revenues are divided into four segments on the basis of platforms: Consoles: (PS4, Xbox One, WiiU) PC and Online Mobile and Ancillary Others: (esports, Studios, Distribution) Until fiscal year 2015, the Consoles, as well as PC and Online segments accounted for more than 80% of the net revenues. However, after the acquisition of King Digital in 2016, the company s Mobile and Ancillary business gained incremental revenues, accounting for roughly 25% of net revenues in FY The top 3 eighth generation consoles are: Sony s PlayStation 4 (64.9 million units) Microsoft s (MSFT) Xbox One (31.2 million units) Nintendo WiiU (13.96 million) Activision publishes and markets games for these consoles. Nintendo s WiiU was released worldwide in November 2012, whereas PlayStation 4 and Xbox One were both released in November However, the company still earns revenues from sales of games on previous generation (7th generation) consoles, namely PlayStation 3, Xbox 360 and Nintendo Wii. Recent financial performance: In FY 2015, Activision s console segment accounted for 51.3% of the net revenues ($2.39 billion). The 8th generation consoles accounted for nearly 63% ($1.49 billion) of console revenues and the 7th generation consoles accounted for the rest.1 In FY 2016, this segment s revenue contribution dropped to 37.1%, after the acquisition of King Digital. The company did not provide the revenue breakdown for sub-segments in consoles. However, the trend indicates that the 7th generation consoles generated less than 5% of the total console revenues in FY Market Growth: According to a Newzoo global games report, console gaming segment performed better than expected in 2016, primarily driven by new digital business Page 3

4 models adopted by console manufacturers. Moreover, they estimate the console gaming to generate $33.5 billion in revenues globally in 2017, with digital revenues accounting for two-thirds of these revenues. 7 (Appendix: 3) Forecast: Since Call of Duty, a major contributor to Activision s console sales, is expected to post lower unit sales in 2017 compared to that in 2016, we believe the console sales will be pressured in FY 2017, partially offset by increased sales of new FPS games (Overwatch). However, the market is expecting the lowered sales due to cyclicity of hardware consoles. The first 6-month Console sales is down 16.4% year-over-year (y-o-y). As per the company guidance for Q3 of FY 2017, and our projections for Q4, we believe the console sales will decline 2% y-o-y in 2017, as gamers are saving their money to spend on new consoles upgrades expected to release on November Console Segment E 2018E 2019E Revenue ($ Mil) 2,150 2,391 2,453 2,404 2,536 2,650 Growth -9.6% 11.2% 2.6% -2.0% 5.5% 4.5% Data Source: Henry Fund Projections; ATVI SEC filings, 10-K After the upgraded console and new generation console releases in the next 18 months, we can see a jump in console game sales, especially the Digital revenues. The industry expects the console market to decline over the next years, with the shift to online, mobile and casual gaming. However, the top game developers might still continue to grow in consoles with dominance in specific genres. It is the smaller market players that will face the decline, as gamers are still expected to play leading top games in every genre. We estimate the console revenues to grow at CAGR of 3.52% through 2025, driven by FPS games (Call of Duty, Destiny and Overwatch). We might see cyclicity in the revenue growth of consoles over the next 5 years. PC and Online This segment accounts for revenues generated by Activision through game sales for PC platforms, as well as online revenues. Almost all the Activision s big franchise games: Call of Duty, Destiny, Skylanders, World of Warcraft, StarCraft, Diablo, Hearthstone, Heroes of the Storm, Overwatch and even Candy Crush, are available on PC platforms. Blizzard uses its online gaming service, Battle.net, to distribute most of its content directly to PC. 1 Furthermore, keeping up with the digitalization of games, all the major game developers have started releasing console and PC games as a basic pack. To add more features, users can buy extension packs or Downloadable contents (DLCs). This counts towards online sales for Activision. Moreover, the mobile games have online purchases and receipts as well. Apart from these additional buy-ons, Activision has World of Warcraft (WoW) franchise whose revenues contribute towards this segment. Recent financial performance: This segment has witnessed fluctuating growth over the past 3 years, primarily driven by increase in PC game revenues and digital receipts, partially offset by decreasing revenues from WoW, as it witnesses decreasing subscriber base. Over the past three years, this segment accounted for 32% of the net revenues. We expect the revenue contribution from this segment to remain stable around 32% for the next 3-4 years. Page 4

5 PC revenues have grown 3 folds over the past three years boosted by increased sales from top FPS games, StarCraft and Hearthstone. Users are shifting towards PC gaming for role-playing and strategy games. The online revenues from DLCs and extension packs are adding to the growth. Market Growth: According to Newzoo s report, revenues for PC gaming segment is estimated to drop slightly in the coming year. They expect the segment to generate $24.5 billion in 2017, down from previous estimate of $29 billion. 7 To play premium PC games, a gamer must make a significant investment in hardware to build their own gaming PC. The cloud gaming technology, which requires next to nothing in hardware costs, is estimated to steal some market share. However, Activision, with its specialized role-playing games and PC card games, might not struggle that much. The firm still managed to post growth last year when the PC gaming segment struggled worldwide. Games such as Overwatch earned $586 million for the company, most of which was accounted as PC revenues. The Premium PC games are expected to take a hit in 2017 but are expected to bounce back in On the other hand, a report by Technavio suggests that the global online gaming market is estimated to grow at a CAGR of 11% over the next 4 years. 8 The introduction of advanced Audio-Visual products and increasing augmented demand for online gaming have compelled the companies to focus on providing a better online experience. Forecast: With new better story lines in Call of Duty franchises and new features in MMORPG game World of Warcraft and Hearthstone, coupled with increasing demand for digital expansion packs, we believe the segment is poised to grow at a CAGR of 5.15% through PC and Online Segment E 2018E 2019E Revenue ($ Mil) 1,418 1,499 2,124 2,166 2,296 2,480 Growth 13.3% 5.7% 41.7% 2.0% 6.0% 8.0% Data Source: Henry Fund Projections; ATVI SEC filings, 10-K However, the segment is estimated to grow 2% in revenues in FY 2017, due to lack of new titles in the last 6 months. With new titles planned to release next year in the FPS, role-playing and strategy genres, we believe the growth will jump back. Mobile and Ancillary This segment deals with the sales of games for the handheld consoles, mobile and tablet devices, as well as sales of ancillary products, such as toys and other physical accessories for the Skylanders franchise. Before 2015, Activision had a very small market in mobile games, which was dominated by other small players, such as Supercell, Gameloft SA (France), Glu mobile Inc. (GLUU), GungHo Online Entertainment (Japan), Disney Interactive, King Digital (KING) and Zynga (ZNGA). After the Activision s acquisition of King Digital Entertainment in February 2016 (See: King Digital Acquisition), the company strengthened its mobile games portfolio by a margin. King Digital not only added 494 million Monthly Active Users (MAUs) and 141 million Daily Active Users (DAUs), but also added $2 billion to the revenue stream. 9 On a worldwide basis, King s Candy Crush Saga and Candy Crush Soda Saga were among the top 10 grossing games for the full year 2015 on both Apple App store and Google Play store. Other games added to the arsenal were Farm Heroes, Pet Rescue and Bubble Witch Saga. According to Think Gaming, Candy Crush Saga still generates nearly $2.15 million sales daily with more than 60,000 daily downloads. 10 On the other hand, Candy Crush Soda generates $1.24 million daily and 26,000 daily downloads. 10 Page 5

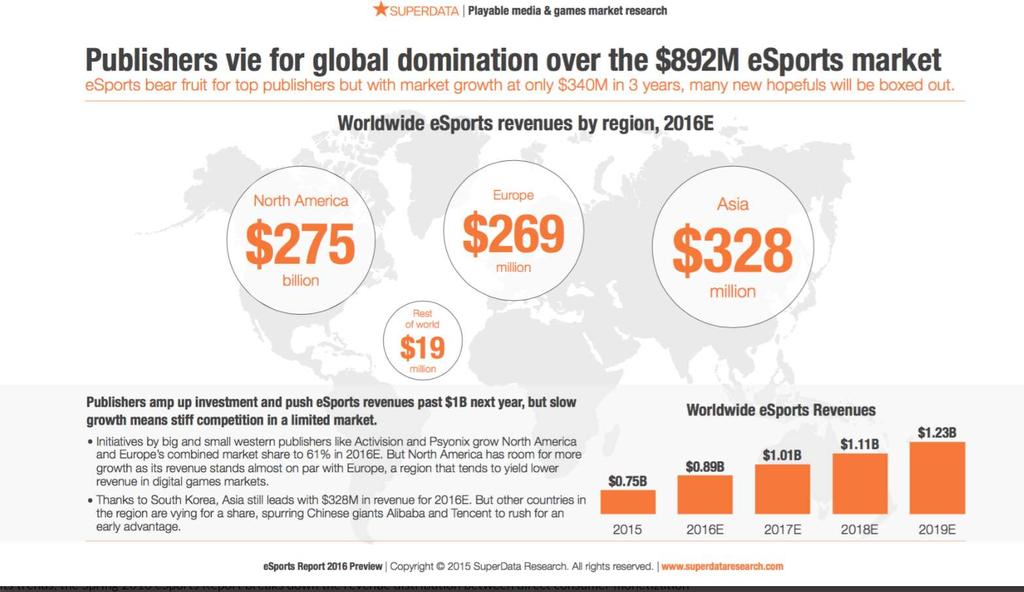
6 Recent financial performance: Due to lack of groundbreaking mobile game titles in the market, Activision s Mobile and Ancillary segment s revenues dropped from $703 million in FY 2012 to $418 million in FY King s incremental revenues drove the segment s revenue up 42% y-o-y. On the other hand, the ancillary revenues from Skylanders toys and accessories added to the growth. The segment s revenue contribution jumped from 10% in FY 2014 to 25.3% in FY Market Growth: Acquiring one of the strongest player in the mobile and casual gaming segment is a strategically robust move. According to Newzoo report, mobile gaming is the most lucrative segment, with smartphone and tablet gaming estimated to grow 19% y-o-y in Furthermore, the report suggests that the mobile gaming will account for 50% of the total global gaming market by Forecast: We estimate the mobile and ancillary segment for Activision to grow at a CAGR of 5.44% through 2025, driven primarily by increasing mobile gaming users for Candy Crush series and Call of Duty series. The increasing number of smartphones and tablet circulations worldwide, as well as strong expertise of King Digital will be the key driving factors for this segment. Mobile and Ancillary Segment E 2018E 2019E Revenue ($ Mil) ,674 1,774 1,863 1,994 Growth -31.2% -3.5% 300.5% 6.0% 5.0% 7.0% Data Source: Henry Fund Projections; ATVI SEC filings, 10-K Other We believe this segment will the company s next growth driver, with 19% CAGR growth over the next 5 years, primarily driven by entry to huge esports market. The segment deals with three sub-segments: Major League Gaming (MLG) or esports business, Studio business and Distribution business. esports (Market Growth): Also known as Electronic sports, it is competitive professional gaming competitions between professional players on a multiplayer platform. The common genre of games competitively played in esports are real-time strategy, fighting, FPS and Multiplayer online battle arena (MOBA). The major tournaments for this sport are The International, the League of Legends Worlds Championship, the Evolution Championship Series and the Intel Extreme Masters (IEM). 11 These sports provide huge cash prize money to winners and the competition are broadcasted live on various platforms. These organized competitions have been there for a long time but were played among the amateurs until late 2000s. Gradually gaining popularity over the past decade, global esports posted revenues of roughly $900 million in 2016, with Asia leading the market with more than one-third of the market share. (Appendix: 4) These revenues are estimated to grow up to $3.5 billion by 2021, driven majorly by ad-spend. 12 Page 6 esports enthusiasts spend nearly $231 million on tickets, merchandize and prize pool, implying increase in direct consumer revenue by 36% y-o-y. 12 The people watching these sports are predominantly male (86%), with 46% of them falling in the age range of years. 13 The final

7 stages of the 3 big esports tournaments witnessed over 90 million unique viewers. The 3 big factors that will drive the industry s growth: 14 Strike: Global Offensive. Off lately, titles such as StarCraft II, Call of Duty, Hearthstone and Overwatch, all of them owned by Activision, have started gaining popularity. Increasing attendance and digital viewership: the IEM World Championship 2017 in Poland, witnessed 173K viewers to stadium, up 53% y-o-y. It was the most watched event in the history with 46 million unique viewers. Studios: This unit deals with creating original movie and television content based on the company s IPs. In October 2016, it released the 1st season of animated TV series, Skylanders Academy on Netflix (NFLX). Although not huge, this unit has a slight growth potential to contribute additional revenue as the company creates more original content for Netflix. Distribution: This unit deals with distribution operations in Europe, consisting of sales distribution to third-party publishers. Strong ad-revenues: The IEM World Championship had 55 million fans on social media networks, up 83% y-o-y, generating 255 million impressions. This generated strong ad-revenues for Intel (INTC), the tournaments title sponsors. This will encourage other companies to enter this market and aid to its growth. Broadcasting revenues: ESL (Electronic Sports League), an esports company that organizes these events with partnerships, gained a lot from IEM championship in The event was broadcasted by 70 linear and digital outlets globally, making it ESL s far-reaching event to date. Newzoo s report mentions that more than 100 million viewers spent more than 800 million hours over the period from August 2015 to May 2016, watching esports games on Twitch, a leading video platform for gamers. 15 Undoubtedly, looking at the huge growth potential of this market, Activision Blizzard launched a new esports division back in October Steve Bornstein, former CEO of ESPN and the NFL network is serving as the chairman of this unit. Recently, the company announced to build a professional esports league on its FPS title Overwatch. 17 The most common game titles played in these competitions are Dota 2, League of Legends and Counter- Recent financial performance and forecast: The segment only contributed 5.4% of the net revenues in FY However, with the introduction of esports division and a new esports league around Overwatch, we believe the segment will jump from $300 mil in 2016 to over $1 billion by Other (esports, Studio and Distribution) Segment E 2018E 2019E Revenue ($ Mil) Growth 26.0% -12.5% 0.3% 30.0% 28.0% 25.0% Data Source: Henry Fund Projections; ATVI SEC filings, 10-K Top Franchises: The company keeps on releasing new editions (intellectual properties) for different game franchises every year. Some of the top franchises for the last 3 years are: 1 Page 7
8 FY 2016: Call of Duty, Candy Crush, World of Warcraft (WoW) and Overwatch- collectively accounting for 69% of net revenues ($4.56 billion) FY 2015: Call of Duty, World of Warcraft (WoW), Destiny and Hearthstone collectively accounting for 75% of net revenues ($3.5 billion) FY 2014: Call of Duty, World of Warcraft (WoW), Skylanders and Diablo collectively accounting for 75% of net revenues ($3.3 billion) Call of Duty (COD) Call of Duty is a first-person shooter (FPS) video game franchise, which first started off as a PC game but is now highly popular on the consoles, primarily because of their online community base and multiplayer game popularity. titles: COD MW1 (2007), COD MW2 (2009) and COD MW3 (2011), released on all major gaming platforms. The Modern Warfare titles have generated net million units in sales as of now. 5 The PlayStation and Xbox consoles accounted for 41.3% and 51% of the total MW unit sales, with PC accounting for merely 5% of volume sales. On the other hand, Black Ops series is one of the most successful story line of this franchise. The 4 Black Ops titles: World at War, Black Ops 1, 2 and 3, in total accounted for million units in sales as of now. 5 The PlayStation and Xbox consoles accounted for 41% and 50.6% of these sales respectively. The World War II editions of the game have sold a total of million units worldwide, with Sony s PS2 and PS3 accounting for more than 50% of these sales, and Microsoft s Xbox consoles accounting for 32% of sales. 5 The other individual story lines are: Call of Duty: Ghosts (2013) Mil units Call of Duty: Advanced Warfare (2014) Mil units Call of Duty: Infinite Warfare (2016) Mil units Call of Duty has been the top FPS game worldwide for the last 7 years, except The only top-tier console game that competes with the same game sales worldwide is Electronic Arts FIFA franchise. Due to the unmotivating story line and no special features in Call of Duty: Infinite Warfare (2016), the sales took a hit. As a result, the gamers shifted to other FPS games, such as Sony s Uncharted 4, Activision s Overwatch and Electronic Arts Battlefield 1. The franchise later changed its story in 2007 and started releasing a new story lines called Modern Warfare and Black Ops. There were 3 original Modern Warfare (MW) Page 8

9 players into 2 teams of six, and each player chooses one of the 25 rosters available. Since its release, it has been recognized more as an esports game. As a result, Activision created a professional gaming league based on this game, yet to start later this year. Skylanders Since, the company is bringing back the World War II story this year with Call of Duty: World War II yet to release on November 3, We believe the Call of Duty sales, although lower than their previous counterparts, will still remain strong for Activision in 2017 and 2018 driving the console sales by 5.5% in The gamers historically tend to opt for a game with better story line. Moreover, according to the trend in console cycle (See: Seasonality), we generally see a boost in sales before the release of new consoles, which we believe will be out in later 2018 or early According to our estimates, Call of Duty will be low in 2017 as well, but will be back in 25 million range by Destiny It is an online-only multiplayer role-playing FPS game, first released in September It was developed by the makers of the famous Halo franchise. It is set in a postapocalyptic world and works on shared-world environment. It was released on all major platforms (PlayStation and Xbox). Further expansion packs to the game in 2015 and 2016 has kept the volume sale of this franchise in top 100 games of the year for the past 2 years. Activision released the full game sequel to the franchise, Destiny 2, on PS4 and Xbox One on September 6, The PC version of the game will be released in late October Although it is a vast improvement to its predecessor, the first month sales of this game were down 50% y-o-y compared to its first version. Overwatch It is a toys-to-life action game, where game is played by placing character figurines on a portal, that reads the figures tag through NFC (Near Field Communication) technique. Its first edition was released back in Since then the company has released a new version every year, with the latest version released in 2016 called Skylanders: Imaginators. This edition is also planned to release on Nintendo Switch, the upgraded console from Nintendo. This game not only earns revenue from game sales, but also from the sales of toys and accessories required to play the game. It is the most successful game in Kids gaming genre. SEASONALITY The video-game publishing and developing industry is a cyclical business in two ways: Hardware Console Cycle: Hardware here refers to the video-game consoles, namely Sony s PlayStation, Microsoft s Xbox and Nintendo s Wii. Historically, these consoles are released every 4-5 years. The latest version (eighth generation) of Nintendo s console: the Nintendo WiiU was released in November 2012, whereas the PlayStation 4 and Xbox One were both released in November Historically, just before the release of new generation consoles, the software game sales trend up. In this period, gamers generally avoid buying the old consoles and wait a year or two for the new consoles. They rather spend that money on new game titles, boosting up the software sales. On the other hand, at the start of new console cycle (just after the new consoles are released), gamers tend to upgrade and spend more money on hardware. As a result, software sales take a hit. It is a team-based multiplayer online FPS game released in May 2016 for all major platforms. This game assigns Page 9
 FIFA and Madden NFL, are released near the end of 3 rd quarter or in the 4 th quarter.")


10 This is clearly visible in Activision s revenue growth chart below: Software Cycle: Although each video-game publisher and developer release video-games throughout the year, most of the big franchise games, such as Activision s Call of Duty, Destiny, Overwatch and Skylanders, as well as Electronic Arts (EA) FIFA and Madden NFL, are released near the end of 3 rd quarter or in the 4 th quarter. The strategy behind this is to release the game as close to the holiday season (December end) as possible, as users generally tend to spend more during this period. However, the pre-orders of the game are generally released a month before the actual release to generate hype. Revenue FORECASTING Every year, an E3 (Electronic Entertainment Expo) conference takes place in the US, where all the big game developers (both hardware and software) showcase the new releases planned for the year. Geographic Segments: The company has three major operating regions geographically: Americas, EMEA and Asia-Pacific. We estimate the Americas region to grow at a CAGR of 6% through 2025, because of the introduction of esports in North America. Moreover, the console sales in FPS genre will dominate in the North America region. The growth rate is estimated to be 5.9% in Europe and 5.78% in Asia through This is because esports is already big in Asia, and most of the growth will come from North America. Revenue forecasts for the company has been done based on platform revenue growth prospects. We estimate the company s revenue to grow 3.0% y-o-y in FY 17 to post revenue of $6.8 billion. Although the company gave the revenue guidance in the range of $6.4 billion in its Q2 earnings transcript, the market is estimating the revenues in the range of $6.6 to $7 billion for FY Thereafter, we estimate the company s revenues to grow at a CAGR of 6.3% through 2025, primarily driven by increasing market share in mobile games, dominance in FPS genre console games and potential strong growth in esports market. Page 10

11 Margins COST OF GOODS SOLD The cost of goods sold (including Depreciation and Amortization costs) as a percentage of sales decreased from 54% in 2009 to 36% in 2016, primarily due to shift towards digitalization and shift towards online games. Moreover, the cost required to develop a new franchise is higher than just revamping the old edition and coming up with a new story. Furthermore, the shift towards mobile and casual games would further reduce the cost. As a result, we estimate the cost of goods sold to drop to 33% in FY 2017, giving a boost to the gross profits (67% in FY 2017). Thereafter we expect the cost to further decrease to 22% by SALES & MARKETING, GENERAL AND ADMINISTRATIVE EXPENSES Historically, sales and marketing expenses increased from 12.7% ($544 mil) of the sales in 2009 to 15.7% ($734 mil) of sales in Furthermore, the acquisition of King Digital drove up this expense to 18.3% of the sales in As the company is trying to get into new markets (esports), we believe the figure will rise to 20% of the sales in the next two years before coming back to 17% of the sales by the end of our forecasting period (2025). Similarly, the G&A as percentage of sales is estimated to jump from 9.6% ($634 mil) in 2016 to 12.87% ($876 mil) in 2017, and thereafter normalizing back to 11.25% ($1.2 bil) by the end of PRODUCT DEVELOPMENT EXPENSES Product development cost as percentage of sales declined from 14.6% in 2009 to 12.44% in 2012, as the company kept on revamping the Call of Duty titles and had no new franchise. Moreover, due to no innovation, World of Warcraft subscriber base started declining. After the release of new consoles (8 th generation), the company started coming up with new story lines in Call of Duty series, and new IPs, such as Destiny, Overwatch and Hearthstone. As a result, product development cost as percentage of sales increased to 14.5% in 2016, slightly boosted by acquisition of King Digital. To maintain the research & development, the company needs to maintain this cost level. Thus, we estimate the product development cost to remain around the same level through Source: ATVI 10-K SEC filings, Henry Fund Model Projection PROFIT MARGINS Operating margins of the company increased from 10.5% in FY 09 to 28.3% in FY 15, but dropped to 21.4% in FY 16 primarily due to additional operational costs incurred after the King Digital acquisition. We forecast the operating margins to fall further to 19.3% in FY 17, as the company faces more operational costs after the merger. However, the shift towards higher margin businesses and increased revenues from consoles will boost the margins to around 35% by This increase will eventually trickle down to net profit margins, and thus we estimate the profit margins to rise from 14.62% in FY 17 to 28% in FY 25. Lower costs as part of optimizing synergies and higher revenues from premium priced products will drive these margins. Page 11
12 The firm updated its FY 2017 revenue from $6.1 billion to $6.4 billion, whereas it expects its Q3 revenues to drop 12% y-o-y at $1.385 billion. We estimate the FY 2017 revenues to grow 3% y-o-y and overperform than the company guidance. The company is expected to release its Q3 FY 17 report on November 3, Change in Leadership Source: ATVI 10-K SEC filings, Henry Fund Model Projection RECENT DEVELOPMENTS Beats Q2 FY 2017 Earnings Estimate Activision Blizzard reported its Q2 financial result for FY 2017 on August 3, 2017, posting 4% y-o-y increase in the GAAP net revenues to $1.63 billion, with 15% y-o-y increase in digital channel sales. Activision Blizzard ($ Mil) Q Q Change Consoles $ 568 $ % PC and Online $ 508 $ % Mobile and Ancillary $ 493 $ 454 9% Other $ 62 $ 55 13% Total $ 1,631 $ 1,570 4% Source: ATVI 10-Q SEC filing, Q EDGAR Based on platforms, only consoles faced decline 13% in sales y-o-y, due to lower revenue generation from Call of Duty titles. This is primarily because last Q2 had tremendous sales from Black Ops III and Advanced Warfare. Otherwise, the console sales are above the Q2 average. The company beat revenue estimates by $190 million and EPS estimates by 16 cents. 18 The company posted 407 Monthly Active Users (MAUs) in Q2. Blizzard witnessed biggest quarterly online community with 46 million MAUs (up 38% y-o-y), driven by Overwatch community and Hearthstone s new expansion pack. Activision unit posted 47 million MAUs, driven by launch of Zombie Chronicles in COD Black Ops III series. King had 314 MAUs, down y-o-y but had better bookings per paying user. Coddy Johnson, who held several positions at Activision from 2008 to 2016, including CFO and head of operations of Activision Publishing positions, left the company to help lead a private-school company. The company recently announced that he returned to the company to serve as President and COO, effective June Previous Chief Operating Officer, Thomas Tippl is now made the Vice Chairman. Moreover, the company strengthened its senior management by appointing Spencer Neumann, former CFO at Walt Disney Co. s (DIS) park divisions, as its new Chief Financial officer. 21 These changes seems to be done on the account of expanding its businesses into new horizons. The company hired former ESPN CEO Steven Bornstein as chairman of its esports business back in In February, Tim Kiplin, former Mattel Inc. (MAT) president was appointed to handle the consumer products business. 21 Important Acquisitions King Digital Entertainment: On February 23, 2016, Activision completed the acquisition of King Digital Entertainment for a total equity value of $5.9 billion, implying $18 in cash per share acquisition. 22 King continues to be led by its CEO Riccardo Zacconi. This acquisition not only added two of the top-5 grossing mobile games (Candy Crush Saga and Candy Crush Soda Saga) to Activision s arsenal, but also will aid the company to utilize the expertise to make more blockbuster games. Shift to esports INDUSTRY TRENDS As discussed in earlier section, esports have been gradually gaining popularity over the past decade with net industry revenues of roughly $900 million in Asia has been the market leader with nearly 33% of the market Page 12
13 share. (Appendix: 4) These revenues are estimated to grow up to $3.5 billion by 2021, driven majorly by ad-spend. 12 Companies such as Twitch, a leading video platform for gamers, have benefitted hugely by this industry. A Newzoo report mentions that more than 100 million viewers spent more than 800 million hours over the period from August 2015 to May 2016, watching esports games on Twitch. 15 Looking at the strong untapped market, Activision Blizzard (ATVI) and Electronic Arts (EA) did not waste time in setting up their huge own esports divisions and starting a league around one of their IPs. In July 2017, Activision announced that the formation of an Overwatch league, set to launch later this year, with teams from major cities around the world. 29 Following the same path, the owners of sports game franchises, Electronic Arts teamed up with NFL (National Football League) to start a new Madden NFL Club Championship. Other companies such as Tencent s Riot Games are also following the same route. 30 Adoption of Virtual Reality in gaming Big video-game hardware developers spent millions on R&D and have started releasing their own Virtual reality (VR) devices out in the market. The interest of gamers in VR gaming has been increasing. VR hardware sales are expected to grow from $1.4 billion in 2016 to $2.4 billion in Facebook (FB) with its Oculus VR, Google (GOOGL) with its Google Cardboard headset, Microsoft with HoloLens and HTC with its Vive headset, among others, are already making a breakthrough success in the markets. Microsoft plans to reveal a VR component to its upgraded Xbox One X console later this year. As a result, the software companies, such as Activision, Electronic Arts, Ubisoft and Take-Two Interactive are stepping up in their game and working on towards making VR titles. With games like Pokemon Go, augmented Reality has already gained momentum in the gaming industry. MARKETS AND COMPETITION Video-game software and services industry is a highly competitive and cyclical industry, characterized by continued innovation in video-games. Some of the products can be occasionally expensive and can face downward pricing pressures in low-income regions internationally. Threat of new entrants is medium to low, primarily due to high initial capital requirements for research and development. To develop a new innovative game title with compelling story line and attractive graphics, it involves huge capital requirements. Thus, a new company can enter the industry through a new innovative product. Most of the firms in the industry invest heavily on their R&D, and still faces declining returns on those investments, as the markets for several products saturate quickly. As a result, requirement for large economies of scale to sustain margins, as well as fast rate of technological changes pose huge challenge for new competitors. Power of Suppliers in the industry is low, due to large number of players in that space with high intense competition among themselves. Most of the requirements from supplier side is human talent and IT software. Power of Buyers is medium. In terms of demand, this industry has cyclical demand curve. Software sales tend to rise near the holiday season (December). Since most of the games are played on Consoles, the companies have started partnering up with console manufacturers to release their games as bundles to boost initial sales. If a particular game is expensive, user might not buy it and opt for similar games in same genre from other publishers. However, big players in the market have more of the bargaining power since they release annual editions of popular franchises, which are in high demand every year. Threat of substitutes is high. Users can shift to other modes of entertainment, such as movies or Netflix or online flash player games. Due to continuous innovation and improvements in technology, there is significant threat of substitutes. Thus, the firms not only need to stay on top of their competitors within the industry but stay aware of advancements within the whole gaming ecosystem. However, an improved substitute generally comes at higher cost. Peer Comparisons Activision s primary competitors are Electronic Arts (EA), Take-Two Interactive (TTWO), Ubisoft, Microsoft (MSFT) and Sony. Currency Market Cap Revenue (Bil) (FY'17E) P/E (ttm) ROE EV/EBITDA Activision Blizzard ATVI $ % 20.9 Electronic Arts EA $ % 20.8 Take-Two Interactive TTWO $ % 45.9 Ubisoft UBI % 30.0 Nintendo 7974 (TYO) % 75.5 Page 13
14 Electronic Arts (EA) Electronic Arts is another giant player in the video-game industry, that specializes and dominates in the sports game genre. The key products for EA are its FIFA and Madden NFL franchise. Recently, the company has stepped up in the FPS genre with its Titanfall and Battlefield franchises. FIFA and Madden NFL are the company s biggest cash generating franchises, with FIFA generating most of its cash from Europe and Asia, whereas Madden NFL makes almost all revenues from North America. EA is trading at a multiple of 29.9, much lower than that of Activision. Although EA has also stepped up its game in the esports segment with the introduction of the Madden NFL Club Championship, we believe Activision has an upper hand with dominance in FPS games and mobile gaming. Historically, gamers opt to stay away from sports genre games in esports leagues and prefer role-playing and shooter games more. Moreover, Activision has an upper hand in the mobile gaming segment and PC segment as well. Thus, Activision is appropriately trading at a premium over EA. EA s margins are close to 23%, way more than Activision, primarily because they have had favorable years with digital revenues. As a result, EA s ROE is close to 28%, as compared to 13.4% for Activision. In terms of unit sales, Call of Duty has historically beaten FIFA sales worldwide over the past 5-6 years. As a result, EA has been working on getting into FPS genre as well. EV/EBITDA multiple for both the firms are comparable at companies (TTWO and ATVI) to grow in double-digits over the next couple of years. Activision has an advantage of a diverse and rich game portfolio as compared to Take-Two Interactive. Increasing global GDP ECONOMIC OUTLOOK According to IMF, economic activity is estimated to gain momentum in 2017, after a sluggish growth in Advanced economies are expected to grow by 1.90% in 2017 and 2.00% in The key driving factor will be the economic growth in emerging markets and developing economies (EMDE), which is estimated to be roughly 4.5% in GDP growth will translate to increased disposable incomes and better consumer markets. Much of the economic outlook depends on the new US administration and its policies with foreign nations. U.S. GDP grew at an annual rate of 3.1% in the second quarter of 2017 compared to 1.2% annualized growth rate in the first quarter of The rise in GDP in 2 nd quarter indicates an upturn in the private inventory investment and federal government spending, as well as deceleration in imports. Real Gross Domestic Income (GDI) rose 2.9% in the 2 nd quarter, compared to 2.7% increase in the 1 st quarter of Real GDI (Gross Domestic Income), on the other hand, increased 2.9% in second quarter compared to 2.7% in first quarter. Take-Two Interactive (TTWO) Take-Two Interactive is another American video-game publisher that owns Rockstar Games and 2K Games. The company s notable game franchise is Grand Theft Auto, its sports titles, such as NBA 2K, WWE 2K and Bioshock series. The firm has smaller revenues as compared to its other two big peers in America. TTWO does not have a larger portfolio of games, but its Grand Theft Auto series has been a blockbuster success. The franchise still remains among the top 10 games sold in terms of units. TTWO is trading at a higher multiple of 69, compared to Activision s The market is leveraging its upcoming next year s release Red Redemption 2 as a huge success. We believe despite the continuing success of GTA series, the company is overvalued. The street estimate both the Page 14 Unemployment Data According to Bureau of Labor Statistics, the unemployment rate in US has declined steadily over the last 5 years and currently sit at 4.2%, as of September 2017, compared to 4.4% by end of August

15 By 2024, ios is estimated to account for $585 billion in sales, growing at a CAGR of 9.1% and market share of nearly 50%. 25 This is followed by Android segment with CAGR of 6.7% and market share of 47%. INVESTMENT POSITIVES Activision s Call of Duty, Destiny II and Overwatch will be the drivers for the console segment. Call of Duty has been the top selling FPS game for the past 8 out of 10 years, and will remain s strong cash cow for the company The number of unemployed people declined by 331,000 and stayed at 6.8 million. Employment in September increased in transportation and warehousing, healthcare and financial activities. Statista research estimates the unemployment rate to remain close to 4.4% in 2017, indicating a steady rise in labor costs. However, the estimate forecasts the rate to increase gradually to 5% by the end of CATALYSTS FOR GROWTH Increasing working age population World population is expected to increase to 8.5 billion by 2030 from the current figures of 7.3 billion, reflecting a CAGR of 1.02%. 23 According to United Nations data, there were 1.2 billion young people in 2015 aged years. This is the demographic that is the biggest consumer of gaming industry. As per the report, this demographic is estimated to increase by 7% to 1.3 billion by As more of these users start earning, they spend more money on leisure interactive entertainment worldwide, especially in the developing economies. Increasing smartphone market According to a report by Persistence Market Research, the global smartphone market is estimated to grow at a strong CAGR of 7.9% in terms of value and 5.8% in volume over the next 7 years. 25 Changing lifestyle and increasing disposable income, has led to increased spending on media and entertainment. However, the urban population is more favorable to buy these devices than rural population, and thus there is more demand for smartphones in developed markets. Big players include Apple (AAPL), Samsung Electronics, Huawei Technologies, Lenovo Group and LG Electronics. With Overwatch gaining a lot of popularity, the PC revenues will gain momentum, coupled by some extra boost from Hearthstone and StarCraft, both of which received great acceptance from gamers King s Candy Crush franchise continues to dominate in the mobile gaming segment. Further innovative games from this unit will drive the mobile segment growth esports segment for Activision will bring in revenues from ads and ticket sales. Starting an own league in this lucrative market is a strong positive for the company Increase in smartphone and tablet sales will only add to mobile gaming revenues Strong and talented senior management officials to strategically manage the new businesses Studios segment continue to create original movie and television content, and a partnership with Netflix will be a boost to revenues INVESTMENT NEGATIVES Nearly 50% of Activision s revenues come from International markets. Foreign exchange rate fluctuations will negatively affect the margins High debt to create potential cash flow risks Slowdown in sales of Call of Duty game titles in the next two years might help the competitors in stealing the market share in FPS genre King Digital might not be able to come up with any other cash cow franchises soon, potentially losing the growth opportunity Page 15
16 esports market might not accept Activision s FPS games as much as role-playing strategy games, such as Dota 2 and League of Legends VALUATION Revenue projections for FY 2017 are based on individual segmental revenue forecast and company s guidance. (See Company Description, Page: 2-10) Due to improved COD and Destiny titles in the coming 2-3 years for consoles and PC, increasing demand for mobile and handheld casual gaming, tremendous growth potential in esports market and growing contribution of digital revenues, we estimate the revenues to grow at a CAGR of 6.3% through FY Capital expenditure forecast is based on company s longterm guidance to spend more on new innovative games and on esports leagues. We estimate the capital expenditure to fluctuate between the range 1.1% to 1.3% of the total revenues over the next few years. Our calculations are based on three varying valuation methods Discounted Cash Flow, dividend discount, and relative multiple (P/E). Differences in these methods revealed a model range of $ However, the dividend discount model is insignificant as the company has a low payout ratio, and it may not correctly translate to intrinsic value. The relative multiple models are difficult to use for this company as the direct competitors in the US market are merely two (EA and TTWO). Moreover, TTWO is trading at an unusually high forward multiple because of one-time low earnings. Other competitors such as Microsoft (MSFT) and Walt Disney (DIS) have a different product mix, of which gaming segment is a very small part. As a result, there are not enough samples to use. If we take International competitors, we get even more skewed price, because of the different interest risk and market risk scenario in those markets. Thus, the more accurate DCF model gives a price estimate of $70.57 implying an upside of roughly 16% from the current market price. WACC Calculations RISK FREE RATE To determine the risk-free rate, we used the 30-year Treasury bond yield, which stood at 2.82%, as of October 17, Cost of Debt To find cost of debt, we looked at Moody s credit rating for Activision s new note offerings, which was Baa2, implying a default premium of 1.60%. We then added that default premium to a risk-free rate (30-year treasury rate. This gave us the pre-tax cost of debt of around 4.42%. BETA A raw Bloomberg Beta of 1.16 was used for our calculations. COST OF EQUITY To determine cost of equity, we used a CAPM model. Our model incorporates a market risk premium of 4.8%, which reflects our expectations of forward-looking market conditions. This resulted in 8.40% cost of equity. WACC Our weighted average cost of capital, through a CAPM model was 7.98%. DCF/EP Models Our model assumes a 4% terminal growth rate for NOPLAT. Our DCF price of $71.57 implies an upside of 16% from the current stock price. This is justified by incremental income resulting from growth mobile and esports division. Moreover, the company looks strong in capturing majority of the growth in console and PC markets after the release of the next generation consoles. Sensitivity Analysis Sensitivity analysis of our DCF model suggests that the price estimate is highly sensitive to 3 key metrics: beta, CV NOPLAT growth, and Sales & Marketing as percentage of sales. We used a beta of 1.16 for our model. With 0.96 as our beta, we estimate the company s stock price to reach $ We used a 4.19% CV growth for NOPLAT. However, decreasing it to 3.29% drives our price estimate down to $ According to our estimates, Sales & Marketing as percentage of sales should remain close to 20% for the next couple of years. However, increasing the expense to 24% of the sales, will result to 14% drop in our price estimate to $ On the other hand, it is moderately Page 16
17 sensitive to cost of debt, risk-free rate, marginal tax rate and depreciation rate forecast. REFERENCES 1. Activision Blizzard, SEC filing 10-K, December 31, Investor relations, Activision Blizzard, Dec 2, Activision Blizzard completes King acquisition, Investor relations, Activision Blizzard, Feb 23, Top 25 companies by game revenues, June Call of Duty, August Call of Duty: WW2 Release date, June 10, Global Games Market, Newzoo, April 20, Global Online gaming market, Technavio, May King Digital Entertainment, SEC Filings, 6-K, Feb 11, Think Gaming, Candy Crush data 11. esports, Wikipedia 12. esports revenues to reach $3.5 billion by 2021, Juniper research, Mar 14, SuperData, esports Market Report 14. The esports audience is escalating quickly, Business insider, Mar 20, Twitch s 100 million viewers watched 800 million hours of esports in the last 10 months, June 10, Why Activision-Blizzard just launched a new esports division, Oct 22, Activision Blizzard, Investor Relations, Jul 12, Activision Blizzard, 8-K SEC filing, Aug 3, Activision Blizzard to release Q3 earnings, Investor relations, Oct 5, Activision s Hires Greeted With $40 Million Welcome Package, Bloomberg Technology, May 11, Activision hires new CFO from Disney, Bloomberg Technology, May 10, Activision Blizzard completes King Acquisition, Investor Relations, Feb 23, UN Department of Economic and Social Affairs- World Population forecasts 24. Population facts, United Nations, May Global Market Study on Smartphones, Persistence Market Research, Sep IMF- World Economic Outlook January US Real GDP estimates, Bureau of Economic Analysis, September 28, Unemployment Rate, Bureau of Labor Statistics, September 18, Activision Blizzard's 'Overwatch' esports League Lands Owners From NBA, NFL, MLB; July 12, The NFL and EA Sports Are Launching a 'Madden NFL' E-Sports Tournament; August 21, Virtual Reality Companies: Top 20 VR Companies to Watch, July 12, 2017 IMPORTANT DISCLAIMER Henry Fund reports are created by student enrolled in the Applied Securities Management (Henry Fund) program at the University of Iowa s Tippie School of Management. These reports are intended to provide potential employers and other interested parties an example of the analytical skills, investment knowledge, and communication abilities of Henry Fund students. Henry Fund analysts are not registered investment advisors, brokers or officially licensed financial professionals. The investment opinion contained in this report does not represent an offer or solicitation to buy or sell any of the aforementioned securities. Unless otherwise noted, facts and figures included in this report are from publicly available sources. This report is not a complete compilation of data, and its accuracy is not guaranteed. From time to time, the University of Iowa, its faculty, staff, students, or the Henry Fund may hold a financial interest in the companies mentioned in this report. Page 17
18 APPENDIX:1 Source: Page 18


19 APPENDIX: 2 Page 19

20 APPENDIX: 3 APPENDIX: 4 Page 20
Electronic Arts Inc. January 18th, Michael Gude Portfolio Manager. Chase Westenfelder Quantitative Model Developer
 Electronic Arts Inc. EA January 18th, 2018 Michael Gude Portfolio Manager Chase Westenfelder Quantitative Model Developer Taylor Crawford Private Equity Analyst Table of Contents Investment Thesis Competitor
Nishant l33t Verma 33 Rachel pwn Nabatian Weiye noob Zhang
 Nishant l33t Verma 33 Rachel pwn Nabatian Weiye noob Zhang Company Overview Thesis Blizzard Synergies Solid Pipeline e 09 10 0 Competitive Advantage Risks DCF World s largest third party game publisher
Safe Harbor Disclosure
 Safe Harbor Disclosure Please review our SEC filings on Form 10-K and Form 10-Q The statements contained in this presentation that are not historical facts are forward-looking statements. The company generally
UConn Student Managed Fund 2017 Analyst Report. Taishi Kato and Tommy Stodolski
 UConn Student Managed Fund 2017 Analyst Report Taishi Kato and Tommy Stodolski 1 TABLE OF CONTENTS Report Highlights... 2 Business Description... 2 Business Overview: Developing into an Interactive Entertainment
The Reed Report. Company Spotlight Take Two Interactive 11/29/2016
 The Reed Report Company Spotlight Take Two Interactive 11/29/2016 Business Overview Take Two Interactive Software (Ticker: TTWO) ( Take Two ) is a leading developer, publisher and marketer of interactive
Second Quarter CY 2012 Results. August 2, 2012
 Second Quarter CY 2012 Results August 2, 2012 1 Safe Harbor Disclosure Please review our SEC filings on Form 10-K and Form 10-Q The statements contained in this presentation that are not historical facts
First Quarter 2013 Results May 8, 2013
 First Quarter 2013 Results May 8, 2013 Safe Harbor Disclosure Please review our SEC filings on Form 10-K and Form 10-Q The statements contained in this presentation that are not historical facts are forward-looking
Third Quarter CY 2012 Results
 Third Quarter CY 2012 Results November 7, 2012 2012 Activision Blizzard 1 Safe Harbor Disclosure Please review our SEC filings on Form 10-K and Form 10-Q The statements contained in this presentation that
Third Quarter CY 2010 Results. November 04, 2010
 Third Quarter CY 2010 Results November 04, 2010 Safe Harbor Disclosure The statements contained in this presentation that are not historical facts are forward-looking statements. The company generally
First Quarter CY 2012 Results. May 9, 2012
 First Quarter CY 2012 Results May 9, 2012 2012 Activision Blizzard 1 Safe Harbor Disclosure Please review our SEC filings on Form 10-K and Form 10-Q The statements contained in this presentation that are
Fourth Quarter 2013 Results. February 6, 2014
 Fourth Quarter 2013 Results February 6, 2014 Safe Harbor Disclosure Please review our SEC filings on Form 10-K and Form 10-Q The statements contained in this presentation that are not historical facts
Third Quarter 2014 Results
 Third Quarter 204 Results November 4, 204 Safe Harbor Disclosure Please review our SEC filings on Form 0-K and Form 0-Q The statements contained in this presentation that are not historical facts are forward-looking
H1 FY16 Earnings presentation November 4th, 2015
 H1 FY16 Earnings presentation November 4th, 2015 Yves Guillemot, President and Chief Executive Officer Alain Martinez, Chief Financial Officer Jean-Benoît Roquette, SVP Investor Relations D I S C L A I
ACTIVISION BLIZZARD ANNOUNCES BETTER-THAN-EXPECTED SECOND QUARTER 2011 FINANCIAL RESULTS
 Contacts: Kristin Southey SVP, Investor Relations (310) 255-2635 ksouthey@activision.com Maryanne Lataif SVP, Corporate Communications (310) 255-2704 mlataif@activision.com FOR IMMEDIATE RELEASE ACTIVISION
Activision Blizzard Announces Record First Quarter Financial Results
 Activision Blizzard Announces Record First Quarter Financial Results - Q1 and EPS Ahead of Prior Year and Prior - - Q1 GAAP EPS Increased 40% and Non-GAAP EPS Up 44% Over Prior Year - - Q1 from Digital
Second Quarter 2015 Results
 Second Quarter 205 Results August 4, 205 Safe Harbor Disclosure Please review our SEC filings on Form 0-K and Form 0-Q The statements contained in this presentation that are not historical facts are forward-looking
First Quarter 2014 Results
 First Quarter 04 Results May 6, 04 Safe Harbor Disclosure Please review our SEC filings on Form 0-K and Form 0-Q The statements contained in this presentation that are not historical facts are forward-looking
Second Quarter 2013 Results August 1, 2013
 Second Quarter 203 Results August, 203 2 Safe Harbor Disclosure Please review our SEC filings on Form 0-K and Form 0-Q The statements contained in this presentation that are not historical facts are forward-looking
LONG TERM VALUE CREATION BLAKE JORGENSEN, CFO
 LONG TERM VALUE CREATION BLAKE JORGENSEN, CFO SAFE HARBOR STATEMENT This presentation contains forward-looking statements that are subject to change. Statements including words such as anticipate, "believe,
Second Quarter 2014 Results
 Second Quarter 2014 Results August 5, 2014 Safe Harbor Disclosure Please review our SEC filings on Form 10-K and Form 10-Q The statements contained in this presentation that are not historical facts are
Second Quarter CY 2010 Results. August 05, 2010
 Second Quarter CY 2010 Results August 05, 2010 Safe Harbor Disclosure The statements contained in this presentation that are not historical facts are forward-looking statements. The company generally uses
Activision Blizzard Announces Better-Than-Expected Second Quarter 2012 Financial Results
 Activision Blizzard Announces Better-Than-Expected Second Quarter 2012 Financial Results Company Had The Top Three Best-Selling Games in North America and Europe For First Six Months of 20121 SANTA MONICA,
Activision Blizzard Announces Better-than-expected First Quarter 2012 Financial Results
 Activision Blizzard Announces Better-than-expected First Quarter 2012 Financial Results - Skylanders Spyro's Adventure was #1 Kids Video Game for First Quarter 2012 with 30+ Million Toys Sold Life to Date
Rovio Entertainment Corporation Annual General Meeting April 9, 2019 CEO REVIEW Kati Levoranta
 Rovio Entertainment Corporation Annual General Meeting April 9, 2019 CEO REVIEW Kati Levoranta TRANSLATED FROM THE FINNISH ORIGINAL Translated from the Finnish original. Finnish version prevails. Contents
Strategic Assessment of Worldwide esports Market Forecast Till 2021
 Report Information More information from: https://www.wiseguyreports.com/reports/402152-strategic-assessment-of-worldwide-esports-marketforecast-till-2021 Strategic Assessment of Worldwide esports Market
ACTIVISION BLIZZARD ANNOUNCES THIRD-QUARTER 2018 FINANCIAL RESULTS. Better-Than-Expected Q3 Results
 ACTIVISION BLIZZARD ANNOUNCES THIRD-QUARTER 2018 FINANCIAL RESULTS Better-Than-Expected Q3 Results Santa Monica, CA November 8, 2018 Activision Blizzard, Inc. (Nasdaq: ATVI) today announced third-quarter
Capcom Co., Ltd. (Tokyo Stock Exchange, First Section, 9697) Overview of Strategies and Plans Fiscal Year ending March 31, 2019
 Overview of Strategies and Plans Fiscal Year ending March 31, 2019") Capcom Co., Ltd. (Tokyo Stock Exchange, First Section, 9697) Overview of Strategies and Plans Fiscal Year ending March 31, 2019 0 0 Forward-looking Statements Strategies, plans, outlooks and other statements
Capcom Co., Ltd. (Tokyo Stock Exchange, First Section, 9697) Overview of Strategies and Plans Fiscal Year ending March 31, 2019 0 0 Forward-looking Statements Strategies, plans, outlooks and other statements
Please see analyst certification and other important disclosures starting on page 165.
 Page 84 Exhibit 120 Third-Party Gross Margin Sensitivity Relative to Hardware Royalties and Manufacturing Costs (US$) Manufacturing Cost Royalty Cost $3.00 $4.00 $5.00 $6.00 $7.00 $8.00 $9.00 $1.00 90%
Kristin Southey Senior Vice President Investor Relations and Treasury
 Kristin Southey Senior Vice President Investor Relations and Treasury Safe Harbor Disclosure The statements contained in this presentation that are not historical facts are forward-looking statements.
Fourth Quarter 2015 Results. February 11, 2016
 Fourth Quarter 05 Results February, 06 Safe Harbor Disclosure Please review our SEC filings on Form 0-K and Form 0-Q The statements contained in this presentation that are not historical facts are forward-looking
The Business of Video Games Report. About DFC Intelligence s The Business of Video Games Report
 About DFC Intelligence s The Business of Video Games report consists of two pdf documents 1) a 140-slide presentation created in Microsoft PowerPoint and 2) a 180-page report created in Microsoft Word.
Peter Moore, President
 EA SPORTS Peter Moore, President November 13, 2008 1 Safe Harbor Statement During the course of this meeting EA may make forward-looking statements regarding future events and the future financial performance
First Quarter 2017 Results. May 4, 2017
 First Quarter 207 Results May 4, 207 Safe Harbor Disclosure Please review our SEC filings on Form 0-K and Form 0-Q The statements contained herein that are not historical facts are forward-looking statements,
Third Quarter 2017 Results. November 2, 2017
 Third Quarter 207 Results November 2, 207 Safe Harbor Disclosure Please review our SEC filings on Form 0-K and Form 0-Q The statements contained herein that are not historical facts are forward-looking
GameStop Corp. NASDAQ:GME. HOLD Price Target: $28.74 Key Statistics as of 10/13/2016. Catalysts: Company Description:
 GameStop Corp. NASDAQ:GME Analyst: Sector: Christian Henderson Services HOLD Price Target: $28.74 Key Statistics as of 10/13/2016 Catalysts: Short Term ( less than a year) any change in the distribution
Take-Two Interactive Software, Inc.
 Take-Two Interactive Software, Inc. (NASDAQ: TTWO) Wedbush Technology, Media & Telecommunications Conference March 7, 2012 Forward-Looking Statements The statements contained herein which are not historical
Prepared Remarks FISCAL 2018 Q2
 Prepared Remarks FISCAL 2018 Q2 October 31, 2017 CHRIS: Thank you. Welcome to EA s second quarter fiscal 2018 earnings call. With me on the call today are Andrew Wilson, our CEO, and Blake Jorgensen, our
Activision Blizzard Reports December Quarter and Calendar Year 2009 Financial Results
 Activision Blizzard Reports December Quarter and Calendar Year 2009 Financial Results - Company Announces $1 Billion Share Repurchase Program - - Annual Cash Dividend of $0.15 per Common Share - - For
Activision Blizzard, Inc. ATVI NASDAQ Neutral-2
 COMPANY UPDATE / ESTIMATE CHANGE / RATING CHANGE Key Metrics ATVI - NASDAQ (as of 11/7/17) $60.96 Price Target N/A 52-Week Range $35.12 - $67.03 Shares Outstanding (mil) (basic) 755 Market Cap. ($mil)
TREND INSIGHTS MEDIA & TECH TRENDS FOR 2017
 TREND INSIGHTS MEDIA & TECH TRENDS FOR 2017 MEDIA & TECH TRENDS FOR 2017 There were several noticeable tech and video trends in 2016 that impacted consumers and marketers; they may become even more prominent
Activision Blizzard, Inc. ATVI NASDAQ Neutral-2
 COMPANY UPDATE / ESTIMATE CHANGE Key Metrics ATVI - NASDAQ (as of 2/12/18) $68.32 Price Target N/A 52-Week Range $44.47 - $74.94 Shares Outstanding (mil) (basic) 757 Market Cap. ($mil) $51,718 3-Mo. Average
ACTIVISION BLIZZARD ANNOUNCES AGREEMENT TO ACQUIRE KING DIGITAL ENTERTAINMENT AND BETTER-THAN-EXPECTED THIRD QUARTER 2015 FINANCIAL RESULTS
 ACTIVISION BLIZZARD ANNOUNCES AGREEMENT TO ACQUIRE KING DIGITAL ENTERTAINMENT AND BETTER-THAN-EXPECTED THIRD QUARTER 05 FINANCIAL RESULTS Company Increases CY 05 Revenues and EPS Outlook Company Delivered
Capcom Co., Ltd. (Tokyo Stock Exchange, First Section, 9697) Overview of Strategies and Plans Fiscal Year ending March 31, 2017
 Overview of Strategies and Plans Fiscal Year ending March 31, 2017") Capcom Co., Ltd. (Tokyo Stock Exchange, First Section, 9697) Overview of Strategies and Plans Fiscal Year ending March 31, 2017 0 0 Forward-looking Statements Strategies, plans, outlooks and other statements
Capcom Co., Ltd. (Tokyo Stock Exchange, First Section, 9697) Overview of Strategies and Plans Fiscal Year ending March 31, 2017 0 0 Forward-looking Statements Strategies, plans, outlooks and other statements
2016 GLOBAL GAMES MARKET REPORT
 FREE 2016 GLOBAL GAMES MARKET REPORT AN OVERVIEW OF TRENDS & INSIGHTS JUNE 2016 TABLE OF CONTENTS 1. Introduction 3 2. Key Global Trends 5 3. The Global Games Market Per 9 Region, Segment & Screen 4. Regional
Annual results 2005/06
 Annual results 2005/06 June 28, 2006 Yves Guillemot, Chief Executive Officer Alain Martinez, Chief Finance Officer Agenda Introduction Arrival of next-generation platforms: Evolutions and potential Ubisoft's
ACTIVISION BLIZZARD ANNOUNCES BETTER-THAN-EXPECTED SECOND QUARTER 2015 FINANCIAL RESULTS
 FOR IMMEDIATE RELEASE ACTIVISION BLIZZARD ANNOUNCES BETTER-THAN-EXPECTED SECOND QUARTER 05 FINANCIAL RESULTS Company Increases CY 05 Revenues and EPS Outlook Once Again Company Delivered Record Q Non-GAAP
Hasbro First Quarter 2016 Financial Results Conference Call Management Remarks April 18, 2016
 Hasbro First Quarter 2016 Financial Results Conference Call Management Remarks April 18, 2016 Debbie Hancock, Hasbro, Vice President, Investor Relations: Thank you and good morning everyone. Joining me
Equity Research ACTIVISION, INC. (ATVI-NASDAQ)
") Equity Research May 28, 2008 Abdul Saleh www.zacks.com 111 North Canal Street, Chicago, IL 60606 ACTIVISION, INC. (ATVI-NASDAQ) ATVI: Zacks Company Report - HOLD Current Recommendation Hold Prior Recommendation
Equity Research May 28, 2008 Abdul Saleh www.zacks.com 111 North Canal Street, Chicago, IL 60606 ACTIVISION, INC. (ATVI-NASDAQ) ATVI: Zacks Company Report - HOLD Current Recommendation Hold Prior Recommendation
Sony IR Day Game & Network Services Segment. November 25, Andrew House
 Sony IR Day 2014 November 25, 2014 Andrew House President and Group CEO Sony Computer Entertainment Inc. Group Executive in Charge of Network Entertainment Business Sony Corporation Agenda 1. Business
Capcom Co., Ltd. (Tokyo Stock Exchange, First Section, 9697) Financial Highlights for the Fiscal Year ended March 31, 2018
 Financial Highlights for the Fiscal Year ended March 31, 2018") Capcom Co., Ltd. (Tokyo Stock Exchange, First Section, 9697) Financial Highlights for the Fiscal Year ended March 31, 2018 0 0 Forward-looking Statements Strategies, plans, outlooks and other statements
Capcom Co., Ltd. (Tokyo Stock Exchange, First Section, 9697) Financial Highlights for the Fiscal Year ended March 31, 2018 0 0 Forward-looking Statements Strategies, plans, outlooks and other statements
Capcom Co., Ltd. (Tokyo Stock Exchange, First Section, 9697) 3rd Quarter Report Fiscal year ending March 31, 2018
 3rd Quarter Report Fiscal year ending March 31, 2018") Capcom Co., Ltd. (Tokyo Stock Exchange, First Section, 9697) 3rd Quarter Report Fiscal year ending March 31, 2018 0 Forward-looking Statements Strategies, plans, outlooks and other statements that are
Capcom Co., Ltd. (Tokyo Stock Exchange, First Section, 9697) 3rd Quarter Report Fiscal year ending March 31, 2018 0 Forward-looking Statements Strategies, plans, outlooks and other statements that are
Activision Blizzard, Inc.
 Price USF SMIF Investment Report November 15, 2012 NASDAQ: ATVI Activision Blizzard, Inc. 2014 Target: $16.13-2016 Target: $21.46 - Intrinsic Value: $22.39 Key Statistics Price (11/13/12) $10.72 EPS (TTM)
ESPORTS GLOBAL ESPORTS MARKET REPORT
 ESPORTS 2016 2016 GLOBAL ESPORTS MARKET REPORT TRENDS, REVENUES & AUDIENCE TOWARD 2019 ESPORTS 2016 CONTENTS 1. Introduction, Scope & Definitions 3 2. Global Esports Trends 11 3. Esports Events 23 4. Global
ACTIVISION BLIZZARD ANNOUNCES BETTER THAN EXPECTED FIRST QUARTER 2015 FINANCIAL RESULTS. Company Increases CY 2015 Revenues and EPS Outlook
 FOR IMMEDIATE RELEASE ACTIVISION BLIZZARD ANNOUNCES BETTER THAN EXPECTED FIRST QUARTER 2015 FINANCIAL RESULTS Company Increases CY 2015 Revenues and EPS Outlook Company Delivered Record Q1 Non GAAP Digital
FREE VERSION 2017 GLOBAL ESPORTS TRENDS, REVENUES, AND AUDIENCE TOWARD 2020 MARKET REPORT
 FREE VERSION TRENDS, REVENUES, AND AUDIENCE TOWARD 2020 2017 GLOBAL ESPORTS MARKET REPORT ESPORTS 2017 AUDIENCE TABLE OF CONTENTS 1 INTRODUCTION 4 2 A SNAPSHOT OF 8 KEY TRENDS 3 THE GLOBAL 12 ESPORTS MARKET
Prepared Remarks FISCAL 2018 Q3
 Prepared Remarks FISCAL 2018 Q3 January 30, 2018 CHRIS: Thank you. Welcome to EA s third quarter fiscal 2018 earnings call. With me on the call today are Andrew Wilson, our CEO, and Blake Jorgensen, our
Capcom Co., Ltd. (Tokyo Exchanges, First Section, 9697) 3rd Quarter Report Fiscal year ending March 31, 2016
 3rd Quarter Report Fiscal year ending March 31, 2016") Capcom Co., Ltd. (Tokyo Exchanges, First Section, 9697) 3rd Quarter Report Fiscal year ending March 31, 2016 0 Forward-looking Statements Strategies, plans, outlooks and other statements that are not historical
Capcom Co., Ltd. (Tokyo Exchanges, First Section, 9697) 3rd Quarter Report Fiscal year ending March 31, 2016 0 Forward-looking Statements Strategies, plans, outlooks and other statements that are not historical
INVESTOR DAY. February 18 th 2016
 INVESTOR DAY February 18 th 2016 DISCLAIMER This statement may contain estimated financial data, information on future projects and transactions and future business results/ performance. Such forward-looking
TABLE OF CONTENTS TABLE OF CONTENTS
 Page 1 Page 1 of 13 TABLE OF CONTENTS TABLE OF CONTENTS 1. Introduction 5 1.1. esports Market Overview 5 1.2. Current esports events 7 1.3. DPLAY Tournaments Market Potential 8 2. esports Tournaments 9
EXPLORE OPPORTUNITIES IN JAPAN S GAME MARKET
 EXPLORE OPPORTUNITIES IN JAPAN S GAME MARKET INTRODUCTION TO THE JAPANESE GAME INDUSTRY BUSINESS SWEDEN, JANUARY 2019 INTRODUCTION TO THE JAPANESE GAME INDUSTRY BUSINESS SWEDEN 1 Billion USD THE JAPANESE
KEY GLOBAL TRENDS 2018 GLOBAL ESPORTS MARKET REPORT Newzoo GLOBAL ESPORTS MARKET REPORT 2018
 2018 GLOBAL ESPORTS MARKET REPORT 2018 Newzoo 1 KEY TAKEAWAYS KEY TAKEAWAYS 1. KEY TAKEAWAYS GLOBAL ESPORTS REVENUES UP MORE THAN 38% YEAR ON YEAR Global esports revenues will reach $906 million in 2018,
esports BETTING UNLOCKING THE POTENTIAL
 esports BETTING UNLOCKING THE POTENTIAL 1 esports BETTING: UNDERSTANDING THE POTENTIAL esports has arrived. While still a rapidly expanding market, esports is already a huge industry with prize pools worth
The Business of Video Games. Table of Contents
 The Business of Video Games Comprehensive Market Overview April 2016 Contents Table of Contents CONDITIONS OF PURCHASE... 2 ABOUT THIS REPORT... 3 TABLE OF CONTENTS... 4 INDEX OF TABLES... 7 I. OVERVIEW...
Strategic analysis by fredi fernandez This report is a basic study on Activision Blizzard s strategy, with focus on Blizzard Entertainment.
 Strategic analysis by fredi fernandez This report is a basic study on Activision Blizzard s strategy, with focus on Blizzard Entertainment. By fredi fernandez fredi@alphaorigins.com 1 Blizzard s mission
Activision Blizzard Announces Better-Than-Expected Second Quarter CY 2009 Financial Results
 Activision Blizzard Announces Better-Than-Expected Second Quarter CY 2009 Financial Results -Company Increases CY 2009 GAAP EPS Outlook and Reaffirms CY 2009 Non-GAAP EPS Outlook- -Board of Directors Increases
Capcom Co., Ltd. (Tokyo Stock Exchange, First Section, 9697) Financial Highlights for the Fiscal Year ended March 31, 2016
 Financial Highlights for the Fiscal Year ended March 31, 2016") Capcom Co., Ltd. (Tokyo Stock Exchange, First Section, 9697) Financial Highlights for the Fiscal Year ended March 31, 2016 0 0 Forward-looking Statements Strategies, plans, outlooks and other statements
Capcom Co., Ltd. (Tokyo Stock Exchange, First Section, 9697) Financial Highlights for the Fiscal Year ended March 31, 2016 0 0 Forward-looking Statements Strategies, plans, outlooks and other statements
INTRODUCTION MARKET OVERVIEW
 CHINESE ONLINE GAMING 216 Essex Street, Salem, MA 01970 (978) 745-9233 (800) 888-MGMT www.ecabot.com info@ecabot.com Nearly 100 million people in China are playing online games. These users spent about
Activision Announces Second Quarter 2006 Results
 Activision Announces Second Quarter 2006 Results - Company's Q2 Results Exceed Outlook - - Company Increases FY 2006 Revenue Outlook - SANTA MONICA, Calif., Nov 02, 2005 /PRNewswire-FirstCall via COMTEX
To Our Shareholders 2 SQUARE ENIX CO., LTD.
 To Our Shareholders I am proud to present the annual report of SQUARE ENIX for fiscal 2004, ended March 31, 2005. Fiscal 2004 was the Company s second year of business since we were formed through the
Capcom Co., Ltd. (Tokyo Stock Exchange, First Section, 9697) 3rd Quarter Report Fiscal year ending March 31, 2019
 3rd Quarter Report Fiscal year ending March 31, 2019") Capcom Co., Ltd. (Tokyo Stock Exchange, First Section, 9697) 3rd Quarter Report Fiscal year ending March 31, 2019 0 Contents page 1. Forecasts for FY3/19 2 2. Financial Highlights 3 3. Business Segment
Capcom Co., Ltd. (Tokyo Stock Exchange, First Section, 9697) 3rd Quarter Report Fiscal year ending March 31, 2019 0 Contents page 1. Forecasts for FY3/19 2 2. Financial Highlights 3 3. Business Segment
ELECTRONIC ARTS Q2 FY14 PREPARED COMMENTS October 29, ROB: Thank you.
 ELECTRONIC ARTS Q2 FY14 PREPARED COMMENTS October 29, 2013 ROB: Thank you. Welcome to EA s fiscal 2014 second quarter earnings call. With me on the call today are Andrew Wilson, our CEO, and Blake Jorgensen,
INDUSTRY OVERVIEW REDACTED REDACTED Sources of Information REDACTED REDACTED The Newzoo report
 Certain information, including statistics and estimates, set forth in this section and elsewhere in this document have been derived from two industry reports, namely the Newzoo Report and the Frost & Sullivan
GAMES AND GAMING MAY 2014
 GAMES AND GAMING MAY 214 8 of students have a console in their home 2.6 Million students 44 More likely to have a console Xbox36 Nintendo Wii Any Nintendo DS Nintendo DS Sony Playstation 3 Sony Playstation
Hasbro Second Quarter 2017 Financial Results Conference Call Management Remarks July 24, 2017
 Hasbro Second Quarter 2017 Financial Results Conference Call Management Remarks July 24, 2017 Debbie Hancock, Hasbro, Vice President, Investor Relations: Thank you and good morning everyone. Joining me
The mobile gaming market. Rise of the smart phone. Dual market The year of gaming. Revenues. smartphone sales. top apps
 Tech Guide 1 Contents 02 03 04 05 06 08 09 10 12 The mobile gaming market Rise of the smart phone Dual market 2015 The year of gaming Revenues Re-entrants and new entrants smartphone sales the top 20 publishers
Activision Blizzard Announces Better-Than-Expected First Quarter CY 2009 Financial Results
 Activision Blizzard Announces Better-Than-Expected First Quarter CY 2009 Financial Results First Quarter Net Revenues and EPS Significantly Ahead of Prior Outlook Company Increases CY 2009 Net Revenues
Global Esports Market: Size, Trends & Forecasts ( Edition) May 2018
 May 2018") Global Esports Market: Size, Trends & Forecasts (2018-2022 Edition) May 2018 Global Esports Market: Coverage Executive Summary and Scope Introduction/Market Overview Market Analysis Regional Analysis Competitive
Global Esports Market: Size, Trends & Forecasts (2018-2022 Edition) May 2018 Global Esports Market: Coverage Executive Summary and Scope Introduction/Market Overview Market Analysis Regional Analysis Competitive
GAMR CASE. Investment INTRO GAMR INVESTMENT CASE
 GAMR TM Investment CASE INTRO The video game industry has come a long way from the advent of Pong in the 1970s. Consistently adapting to changing consumer preferences and product cycles, gaming companies
11 Video. Games. More than just a game. Summary
 11 Video Games More than just a game Summary The video games market in the Netherlands rose by 23.2 percent in 2007, an improvement from the 21.6 percent rise in 2006. Except for 2005 when growth moderated
Welcome to EA s third quarter fiscal 2019 earnings call. With me on the call today are Andrew
 February 5, 2019 CHRIS: Thank you. Welcome to EA s third quarter fiscal 2019 earnings call. With me on the call today are Andrew Wilson, our CEO, and Blake Jorgensen, our COO and CFO. Please note that
Gfinity plc ( GFIN or the Company ) Unaudited Half Year results for the period ended 31 December 2016
 Unaudited Half Year results for the period ended 31 December 2016") 28 March 2017 Dissemination of a Regulatory Announcement that contains inside information according to REGULATION (EU) No 596/2014 (MAR) Gfinity plc ( GFIN or the Company ) Half Year results for the period
28 March 2017 Dissemination of a Regulatory Announcement that contains inside information according to REGULATION (EU) No 596/2014 (MAR) Gfinity plc ( GFIN or the Company ) Half Year results for the period
ESPORTS & ESL AUSTRALIA. The region s largest esports provider. 2017
 ESPORTS & ESL AUSTRALIA The region s largest esports provider. 2017 ... Gaming is what every traditional sport league is desperate to become: young, global, digital and increasingly diverse. WHAT ARE ESPORTS?
ELECTRONIC ARTS E3 INVESTOR BREAKFAST. Westin Bonaventure Hotel Los Angeles, CA June 12, 2013
 ELECTRONIC ARTS E3 INVESTOR BREAKFAST Westin Bonaventure Hotel Los Angeles, CA June 12, 2013 Safe Harbor Statement Please review our risk factors on Form 10-K filed with the SEC. Some statements set forth
ACTIVISION BLIZZARD, INC.
 ACTIVISION BLIZZARD, INC. FORM 8-K (Current report filing) Filed 05/06/5 for the Period Ending 05/06/5 Address 00 OCEAN PARK BLVD SANTA MONICA, CA 90405 Telephone 055000 CIK 000078877 Symbol ATVI SIC Code
E-Sports: An Olympic Sized Opportunity
 E-Sports: An Olympic Sized Opportunity Early Days in a Fast Growing Phenomenon In mid-january 2018, Activision Blizzard s Overwatch League made its debut, with 12 franchises representing major cities around
Capcom Co., Ltd. (Tokyo Exchanges, First Section, 9697) 3rd Quarter Report Fiscal year ending March 31, 2014
 3rd Quarter Report Fiscal year ending March 31, 2014") Capcom Co., Ltd. (Tokyo Exchanges, First Section, 9697) 3rd Quarter Report Fiscal year ending March 31, 2014 0 Forward-looking Statements Strategies, plans, outlooks and other statements that are not historical
Capcom Co., Ltd. (Tokyo Exchanges, First Section, 9697) 3rd Quarter Report Fiscal year ending March 31, 2014 0 Forward-looking Statements Strategies, plans, outlooks and other statements that are not historical
Activision Blizzard Announces Better-Than-Expected Third Quarter CY 2009 Financial Results
 Activision Blizzard Announces Better-Than-Expected Third Quarter CY 2009 Financial Results - Company Calendar Year Financial Outlook Remains Unchanged - SANTA MONICA, Calif., Nov 05, 2009 /PRNewswire-FirstCall
ESPORTS THE BIG NUMBERS
 ESPORTS THE BIG NUMBERS Esports revenues projected to pass $1bn in 2019 $276m in prize money across 19,771 tournaments in 2016 $20,770,640 largest individual tournament prize pool (the International) 256m
Nonetheless, sponsorship makes up 70 to 85 per cent of esports team revenues, according to Maurer.
 Sponsorship plays a particularly important role in esports, as generating revenue from media rights in the sport remains in its infancy. With player wages rising and with ambitions to expand, the introduction
Global Technology VIDEO GAMES COULD PROVE TO BE DISRUPTOR IN DIGITAL AGE
 PRICE POINT July 2017 Timely intelligence and analysis for our clients. Global Technology VIDEO GAMES COULD PROVE TO BE DISRUPTOR IN DIGITAL AGE KEY POINTS Josh Spencer Portfolio Manger, Global Technology
Market Snapshot: Consumer Strategies and Use Cases for Virtual and Augmented Reality
 Market Snapshot: Consumer Strategies and Use Cases for Virtual and Augmented A Parks Associates Snapshot Virtual Snapshot Companies in connected CE and the entertainment IoT space are watching the emergence
G5 Entertainment. Investor Presentation
 G5 Entertainment Investor Presentation G5 Entertainment in Brief Developer and publisher of casual free-to-play (F2P) games for tablets and smartphones Global company operating in the global market of
ELECTRONIC ARTS Q3 FY16 PREPARED COMMENTS January 28, 2016 CHRIS: Thank you.
 ELECTRONIC ARTS Q3 FY16 PREPARED COMMENTS January 28, 2016 CHRIS: Thank you. Welcome to EA s fiscal 2016 third quarter earnings call. With me on the call today are Andrew Wilson, our CEO, and Blake Jorgensen,
Global MMORPG Gaming Market: Size, Trends & Forecasts ( ) November 2017
 November 2017") Global MMORPG Gaming Market: Size, Trends & Forecasts (2017-2021) November 2017 Global MMORPG Gaming Market: Coverage Executive Summary and Scope Introduction/Market Overview Global Market Analysis Dynamics
Global MMORPG Gaming Market: Size, Trends & Forecasts (2017-2021) November 2017 Global MMORPG Gaming Market: Coverage Executive Summary and Scope Introduction/Market Overview Global Market Analysis Dynamics
Hasbro Second Quarter 2016 Financial Results Conference Call Management Remarks July 18, 2016
 Hasbro Second Quarter 2016 Financial Results Conference Call Management Remarks July 18, 2016 Debbie Hancock, Hasbro, Vice President, Investor Relations: Thank you and good morning everyone. Joining me
G5 Entertainment. Investor Presentation
 G5 Entertainment Investor Presentation G5 Entertainment in Brief Developer and publisher of casual free-to-play (F2P) games for tablets and smartphones Global company operating in the global market of
STARBREEZE investor Presentation
 STARBREEZE investor Presentation GP Bullhound Nordic Tech Tour, 7 December 2017 Slide / 1 Introduction to starbreeze outline Starbreeze games and publishing Virtual reality Slide / 2 Financial overview
G5 ENTERTAINMENT AB. Investor Presentation
 G5 ENTERTAINMENT AB Investor Presentation G5 Entertainment in Brief Developer and publisher of casual free-to-play (F2P) games for tablets and smartphones Global company operating in the global market
UBISOFT REPORTS FIRST-QUARTER SALES
 UBISOFT REPORTS FIRST-QUARTER 2018-19 SALES A solid performance, led by sharp back-catalog growth and continued strong momentum for digital Sales : 400.0 M Net bookings up 88.8% to 381.5 million, outstripping
Capcom Co., Ltd. (Tokyo Exchanges, First Section, 9697) Results of Operations and Strategies First half of fiscal year ending March 31, 2014
 Results of Operations and Strategies First half of fiscal year ending March 31, 2014") Capcom Co., Ltd. (Tokyo Exchanges, First Section, 9697) Results of Operations and Strategies First half of fiscal year ending March 31, 2014 0 Forward-looking Statements Strategies, plans, outlooks and
Capcom Co., Ltd. (Tokyo Exchanges, First Section, 9697) Results of Operations and Strategies First half of fiscal year ending March 31, 2014 0 Forward-looking Statements Strategies, plans, outlooks and