Kristin Southey Senior Vice President Investor Relations and Treasury
|
|
|
- Gloria Preston
- 5 years ago
- Views:
Transcription

1
2 Kristin Southey Senior Vice President Investor Relations and Treasury
3 Safe Harbor Disclosure The statements contained in this presentation that are not historical facts are forward-looking statements. The company generally uses words such outlook, will, could, should, would, might, remains, to be, plans, believes, may, expects, intends, "anticipates," "estimate," future," "plan," "positioned," "potential," "project," "scheduled," "set to," "subject to," upcoming and similar expressions to identify forward-looking statements. These forward-looking statements are based on current expectations and assumptions that are subject to risks and uncertainties. The Company cautions that a number of important factors could cause Activision Blizzard's actual future results and other future circumstances to differ materially from those expressed in any such forward looking statements. Such factors include, but are not limited to, sales levels of Activision Blizzard s titles, increasing concentration of titles, shifts in consumer spending trends, the impact of the current macroeconomic environment and market conditions within the video game industry, Activision Blizzard s ability to predict consumer preferences, including interest in specific genres such as first-person action and massively multiplayer online games and preferences among competing hardware platforms, the seasonal and cyclical nature of the interactive game market, changing business models including digital delivery of content, competition, including from used games and other forms of entertainment, possible declines in software pricing, product returns and price protection, product delays, adoption rate and availability of new hardware (including peripherals) and related software, rapid changes in technology and industry standards, litigation risks and associated costs, the effectiveness of Activision Blizzard s restructuring efforts, protection of proprietary rights, maintenance of relationships with key personnel, customers, licensees, licensors, vendors, and third-party developers, including the ability to attract, retain and develop key personnel and developers that can create high quality "hit" titles, counterparty risks relating to customers, licensees, licensors and manufacturers, domestic and international economic, financial and political conditions and policies, foreign exchange rates and tax rates, and the identification of suitable future acquisition opportunities and potential challenges associated with geographic expansion. These important factors and other factors that potentially could affect the Company s financial results are described in the Company s most recent annual report on Form 10-K and other filings with the SEC. The Company may change its intention, belief or expectation, at any time and without notice, based upon any changes in such factors, in the Company s assumptions or otherwise. The Company undertakes no obligation to release publicly any revisions to any forwardlooking statements to reflect events or circumstances after the original date of this presentation, September 1, 2011, or to reflect the occurrence of unanticipated events. For a full reconciliation of GAAP to non-gaap numbers and for more detailed information concerning the Company s financial results for the quarter ended June 30, 2011, please refer to the tables attached to Company s earnings release dated August 3, 2011, which is available on our website,
4 Robert Kotick Chief Executive Officer
5 Our Mission Become the world s most profitable entertainment company driving superior shareholder returns with stellar execution against large and sustainable interactive franchises with an unyielding commitment to our audiences
6 What You Will Hear Today We have sizeable market opportunities We are the leader in large and growing global markets Our fastest growing segments are the most profitable We are best positioned in online entertainment Strongest online enabled pipeline Expanding capabilities and reach as leading service provider New innovative intellectual property in development Most capable to deliver on emerging platforms and models Most loyal audiences Most focused on satisfying our audiences Most talented workforce Audience Commitment & Industry Leading Talent Drives Shareholder Returns
7 An Outstanding Track Record Revenues & Operating Income Every 4-5 years Double revenues Operating margin increases by 50% $4.8 Billion 29% 24% Activision Activision Blizzard $1.4 Billion Operating Margin* $600 Million 6% 13% We Have Delivered Pick a Metric *Fiscal year ended 3/31 except for CY08, CY09 and CY10 which ended 12/31. CY08 represents non-gaap comparable basis for the period ended 12/31/08. All financials are presented on a non-gaap basis.

8 An Outstanding Track Record Share Price Appreciation CAGR 14% 16% 3% 1% 1% 5% 6/01 to 6/11 6/06 to 6/112 ATVI S&P 500 NASDAQ Focused on Shareholder Value Creation Source: Yahoo Finance, not including dividends.


9 Activision Blizzard Growth Drivers Leverage emerging platforms & models Release innovative new Intellectual Property New MMO Launch Biggest pipeline of online enabled properties & services COD China

10 An Outstanding Track Record Strong Digital Growth Driving Margin Digital Revenue Growth* $1.4B $1.2B $1.7B TTM June-09 TTM June-10 TTM June-11 Focused Strategy + Rigorous Execution = Outstanding Results *Non-GAAP, trailing twelve months ending 6/30/09, 6/30/10 and 6/30/11
11 Tremendous Market Opportunity: Digital is Accretive to Our Margins Digital Micro Transactions and Value-Added Services Operating Margin* 80%+ DLC (Downloadable Extra Content) 60%+ Full Game Digital Download 60%+ Subscription Services 55%+ Retail PC Software 45%+ Console Software 20%+ *Source: Activision Blizzard Estimates (based on owned IP and internally developed) New Models are More Profitable
12 Tremendous Market Opportunity: Digital Revenues Growing Rapidly Estimated Worldwide Digital Sales Excluding Japan, $Billions CAGR Emerging Digital (Wireless and Advertising) Core Digital (Online) $32B $24B $11B $9B $40B $13B 10% 15% 13% $15B $20B $26B Note: Excludes Japan Source: PWC Media and Entertainment Outlook, 12th Edition. Emerging Digital Segments Growing Fastest

13 Tremendous Market Opportunity: More People, Playing More Games (e) Increase x 5x 16x x 117 Broadband Households Note: Millions, worldwide Source: PWC, IDC, AB Analysis Mobile Internet Subscriptions Social Network Users Playing More and Paying More for the Most Engaging Games Connected HD- Consoles
14 Tremendous Market Opportunity: Dollars are Still Far Smaller than Film & TV Estimated Worldwide Video Game Sales Excluding Japan, $Billions Retail CAGR Digital $73B $52B $28B $62B $30B $33B 4% 13% 9% $24B $32B $40B Digital Growth is Driving a Large and Expanding Market Opportunity Note: Excludes Japan Source: PWC Media and Entertainment Outlook, 12th Edition.


15 Activision Blizzard Leadership: Growing Digital Service Platforms Million Paying Online Users 20 Million+ MAU 15 Million+ MAU Source: AB Large, Vibrant Online Communities
16 Activision Blizzard Leadership Paying Entertainment Service Users Paying Users, Millions Non-GAAP Operating Margin 29% 16% 13% 13% 15% AB DirecTV Netflix SiriusXM Dish Network More Paying Users; More Profitable Source: Factset, Company Reports
17 Our Mission Become the world s most profitable entertainment company driving superior shareholder returns with stellar execution against large and sustainable interactive franchises with an unyielding commitment to our audiences
18 Eric Hirshberg Chief Executive Officer
19 Activision Publishing Operating Margin Operating Margin* 21% 23% 12% TTM June-09 TTM June-10 TTM June-11 *Trailing twelve months ending 6/30/09, 6/30/10 and 6/30/11
20 Activision Growth Drivers Launch biggest pipeline of proven properties Multiple digital revenue streams Expand reach as a service provider Build large, vibrant communities Develop innovative new intellectual properties With digital revenues streams Leverage emerging models and platforms Micro-transactions, free to play, smartphones, tablets Building Direct Relationships with Our Consumers


21 Franchise Strength Retail $1.2B Source: NPD, Gfk/CharttTrack, Company Data
22 Grow the Core HD Units Sold 9 Months HD Install Base (Dec) M(e) M+ 74M M 55M M 38M Note: Millions Source: NPD, CharttTrack, GfK, company estimates
 -- 18M+ $15 74M $76 (e)")

23 Grow Online Map Packs Price/Pack HD Base Average Spend Per User M (e) -- 18M+ $15 74M $76 (e) 11M $15 55M $74 (e) 9M $10 38M $68 (e) Note: Millions, except ARPU Source: NPD, Charttrak, GfK, company estimates


24 Record Engagement Higher Engagement Than Top Facebook Games Over 30 Million Unique Players Over 2.3 Billion Hours Played in Multiplayer Alone


25


26 Opportunity to Own Direct Relationship with 30 Million Call of Duty Online Consumers PLAY TOGETHER BETTER

27 Dave Stohl EVP Worldwide Studios
28


29
30 another way of looking at it
31 (less than 7 million/day)
")
32 (less than 7 million/day) (more)
33 (less than 54 minutes per day)
34 (less than 54 minutes per day) (more)


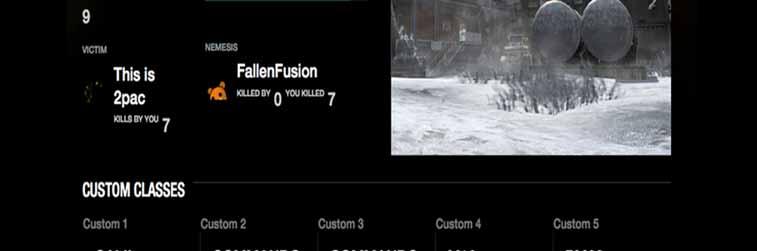
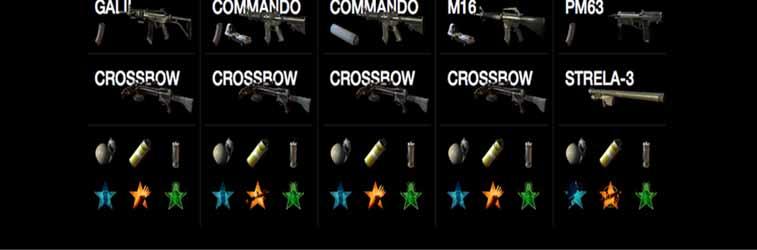
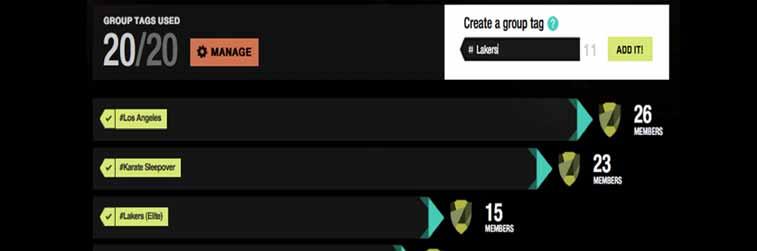
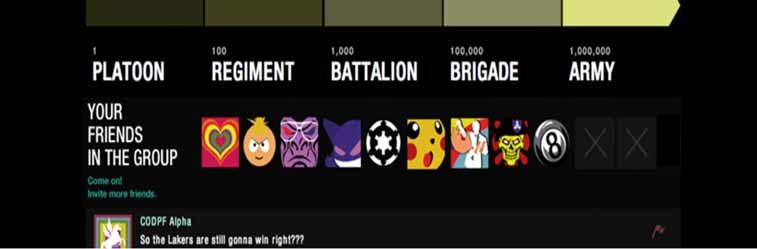
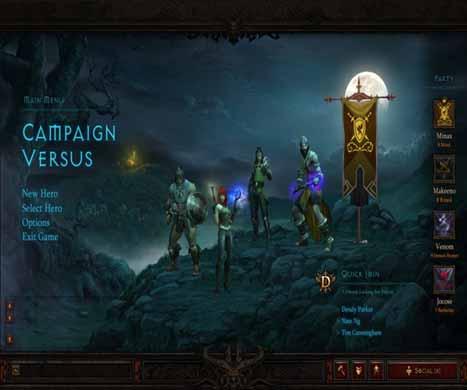
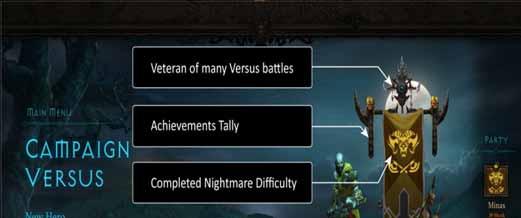
35 ELITE is a service the social platform for Call of Duty a blending of social, mobile, and console the best free service on the market a break through premium service


36 Connect. Compete. Improve.
37
38

39


40

41

42

43
44
45
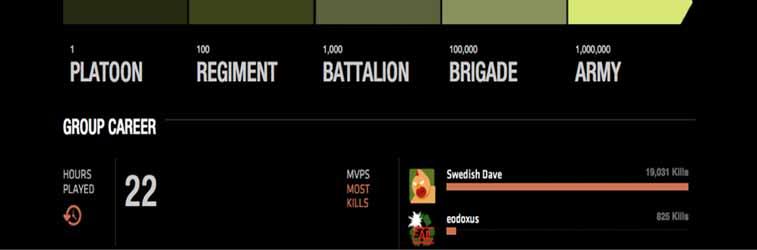
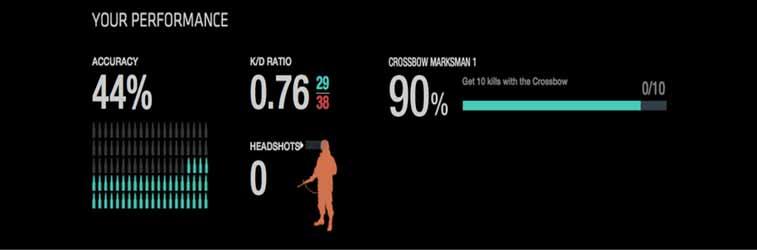
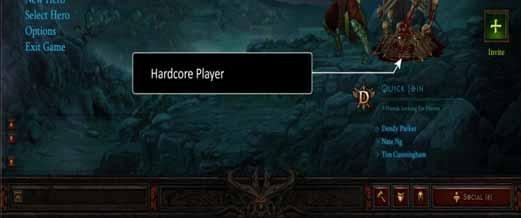
46 his KDR is 2.26 (mine is 0.87)
47 584 more hours played (that s 24 DAYS!)
48 dude.
49 seriously?
50 he has 124,542 kills (I have 3,978)
51 he has 10,468 headshots (that s 6000 more headshots than I have kills)
52 on the other hand


53 he s died 55,165 times (I ve died 4,568 times)


54


55
56
57


58


59


60

61


62

63
64


65

66


67


68


69


70


71
72


73


74


75


76 Elite: Digital Expansion Opportunity Call of Duty Active Multi-Player Participants: 30M+ Unique Users Non-DLC Purchasers Single DLC Purchasers Multiple DLC Purchasers Major opportunity: Over 25% indicate Strong Interest in Elite* A chance for active members to upgrade to Elite Our most engaged consumers with millions of hours of dedicated play * ATVI market research Expected to Deliver Greater Value Via a Subscription Based Model

77 Asia: Digital Expansion Opportunity Microtransaction/FTP Market Asia market is large and growing rapidly Significant China growth opportunity for FPS Crossfire game very successful MTX for core gamers in Asia is proven model Activision s Platform for Success Ability to tap Blizzard presence/experience in region Call of Duty has a very high level of awareness in Asia Large team working on the game for over a year Benefit from Blizzard MMO experience High margin opportunity Potential to bring skills to core social gamers in West
78


79 A Whole New Way to Play Imaginative & Physical Action Figures Immersive Connected Video Game Play Eruptor


80 Stay Connected Across Platforms Web World Never Before Seen Innovation in Gaming


81 Skylander Starter Pack Coming this holiday with 20,000 kiosks and 12 miles of U.S. footprint


82 What is the Skylanders Web World? A social game based on your collection Over 37 million online and gaming households with children aged 6 12* Continuously optimized Web World A persistent companion A bridge to our ecosystem and a monetization opportunity Sources: 2011 Gamer Census Data


83


84 New Intellectual Property An Open World Action game targeting core gamers Strategy: Established fan base HD-console and PC April 12 launch window First time DLC for franchise


85 Bungie Universe: A Big Thing 37M+ Halo units sold on one platform Top Three Titles on Xbox Live* 1 Call of Duty Black Ops 2 Call of Duty Modern Warfare 2 3 Bungie s Halo Strengthens Activision s Online Leadership *as of 8/1/11 Source majornelson.com units are NPD/CharttTrack, GFK


86 Pipeline Mix of Proven and New Properties and Services UNIVERSE CHINA Plus Upside From Mobile and Social
87


88
89 13 4,500 10
90 800

91 90
 20.")
")
92 20.5 MM+ 16 MM+ (excludes World of Warcraft) 20.5 MM+ 57 MM+ Total Franchise Sales (not including World of Warcraft) World of Warcraft Subscribers 11.1 MM+


93


94


95
96
97

98

99 surpasses your expectations and delivers fun in ways you never even knew you wanted. -- The New York Times Ambitious and well-realized -- MTV GameTrailers

100

101
102
103

104
105

106
107


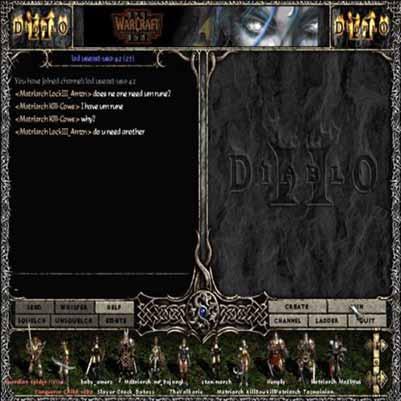
108 SB5 Diablo II: Lord of Destruction Expansion Diablo III Announced Diablo II
109 Slide 108 SB5 D2 logo needed. Are there other milestones we want to include here? Samantha Bong, 8/26/2011
110

111
112


113
114


115
116
117
118
119
120
121
122

123
124

125
126
127

128

129


130


131 Thomas Tippl Chief Operating Officer and CFO
132 Year To Date Highlights 1H 2011 Increasing Revenue, Operating Margin, EPS Revenues up over prior year Record operating margin of more than 26%* Record EPS and up 50% over prior year Driven by growth in high margin digital business Raised 2011 Outlook for Second Time $1.2 Billion in TTM Operating Cash Flow *Source company financials released on 8/3/2011 Non GAAP, 44% GAAP operating margin Digital Growth Drives Expected 2011 Record Operating Margin
133 Exceptional Cash Generation Cumulative Operating Cash Flow $2.9B Activision Blizzard Zynga Electronic Arts Ubisoft Take-Two Interactive Source : NASDAQ Factset Note : ATVI FYE Dec., UBI and ERTS FYE Mar., Take-Two FYE Mar 10, Oct. FYE 08 and 09 In 2009 We Added a Free Cash Flow Metric to Executive Performance Incentive Plan
134 Exceptional Cash Generation Cumulative Operating Cash Flow $2.9B TTM June 2011 Operating Cash Flow Market Capitalization Cash Generated on Shareholders Inv. $1.2B $13.3B 9% Activision Blizzard Zynga Electronic Arts Ubisoft Take-Two Interactive Source : NASDAQ Factset Note : ATVI FYE Dec., UBI and ERTS FYE Mar., Take-Two FYE Mar 10, Oct. FYE 08 and 09, Market Cap as of 6/30/11

135 Three Year Capital Allocation * Internal Growth External Growth Return Value to Shareholders Online enabled franchises and services Franchise and studio acquisitions Dividends and Buybacks $2+ Billion <$100 Million $3 Billion Generated Record Earnings and Operating Cash Flows *7/08-6/11


136 Over $2B Internal Investments Internal Growth People Major Investments Other 70% Developing Online-Enabled Properties & Services Generating Record Earnings and Operating Profits

137 Three Year Capital Allocation $3+ Billion in Value Returned to Shareholders Return Cash to Shareholders Buybacks $2.7B Dividends $380M *7/08-6/11 Discipline Generating and Allocating Capital
138 An Outstanding Track Record Pre-Merger, June 2007 Post-Merger, September 2008 Calendar 2011 FY % Near-Term 15-18% CY % Near-Term 27-28% Non-GAAP Operating Margin Objective: Long-Term 20%+ Long-Term 30%+ 31%(e) * As of August 3, 2011 History of Setting, Hitting and Exceeding Targets
139 Financial Objectives: Revenue Growth CAGR Mid Single Digit+ Revenue Growth EPS Growth CAGR Double Digit+ EPS Growth Continued Operating Margin Expansion Driven by Digital
140 5% Revenue Growth Scenario Incremental Non-GAAP Revenue Total Outlook 5% 5% Growth $4050 $4250 $4460 5% Growth $200 $200 $200 $600 $210 $210 $420 $230 $230 $1250M Note: $, millions
141 Basic Building Blocks for Growth Our Core Pipeline Alone Could Achieve Revenue Target Diablo 3 & Expansion StarCraft II Expansion 1 StarCraft II Expansion 2 WoW Expansion 1 WoW Expansion 2 COD Digital Bungie/Halo/Xbox Assumes no incremental from COD retail and WOW subs. To Achieve 5% Revenue Growth Per Year We Need to Generate Incremental $1250M
142 Basic Building Blocks for Growth Our Core Pipeline Has Higher Operating Margins Diablo 3 & Expansion StarCraft II Expansion 1 StarCraft II Expansion 2 WoW Expansion 1 WoW Expansion 2 COD Digital Bungie/Halo/Xbox
143 Financial Objectives: Revenue Growth CAGR Mid Single Digit+ Revenue Growth EPS Growth CAGR Double Digit+ EPS Growth Continued Operating Margin Expansion Driven by Digital
144 Potential For Upside Our Core Pipeline Has New Models/Platforms/Geographies Title/Service Diablo 3 + Ex. StarCraft II Ex. (1) StarCraft II Ex. (2) Wow Ex. (1) Wow Ex. (2) COD Digital COD Asia Bungie/Halo/Xbox Total $1250M New Models Platforms/ Geographies Auction House Map Marketplace Map Marketplace VAS/Geographic VAS/Geographic Subscription Microtransaction Multi-Platform
145 Potential For Upside Our New Intellectual Property with New Business Models Title/Service New Models Platforms/ Geographies Diablo 3 + Ex. StarCraft II Ex. (1) StarCraft II Ex. (2) Wow Ex. (1) Wow Ex. (2) COD Elite COD Asia Bungie/Halo/Xbox Auction House Map Marketplace Map Marketplace VAS/Geographic VAS/Geographic Subscription Microtransaction Multi-Platform Skylanders Blizzard MMO WebWorld TBA
146 Potential For Upside Our Properties Take Share on Mobile/Social Title/Service New Models Platforms/ Geographies Diablo 3 + Ex. StarCraft II Ex. (1) StarCraft II Ex. (2) Auction House Map Marketplace Map Marketplace Wow Ex. (1) Wow Ex. (2) COD Digital COD Asia Bungie/Halo/Xbox VAS/Geographic VAS/Geographic Subscription Microtransaction Multi-Platform Mobile & Social Skylanders Blizzard MMO WebWorld TBA
147 What You Heard Today Tremendous market opportunity Large and growing global online markets Fastest growing online segments are most profitable Best positioned to leverage opportunity Biggest, best online enabled pipeline ever Expanding capabilities and reach as a service provider New innovative intellectual property in development Leverage emerging platforms and models Targeting growth over the next three years History of setting, achieving and exceeding targets Relentless Focus on Shareholder Value Creation
Safe Harbor Disclosure
 Safe Harbor Disclosure Please review our SEC filings on Form 10-K and Form 10-Q The statements contained in this presentation that are not historical facts are forward-looking statements. The company generally
Third Quarter CY 2010 Results. November 04, 2010
 Third Quarter CY 2010 Results November 04, 2010 Safe Harbor Disclosure The statements contained in this presentation that are not historical facts are forward-looking statements. The company generally
Second Quarter CY 2012 Results. August 2, 2012
 Second Quarter CY 2012 Results August 2, 2012 1 Safe Harbor Disclosure Please review our SEC filings on Form 10-K and Form 10-Q The statements contained in this presentation that are not historical facts
Third Quarter CY 2012 Results
 Third Quarter CY 2012 Results November 7, 2012 2012 Activision Blizzard 1 Safe Harbor Disclosure Please review our SEC filings on Form 10-K and Form 10-Q The statements contained in this presentation that
First Quarter CY 2012 Results. May 9, 2012
 First Quarter CY 2012 Results May 9, 2012 2012 Activision Blizzard 1 Safe Harbor Disclosure Please review our SEC filings on Form 10-K and Form 10-Q The statements contained in this presentation that are
First Quarter 2013 Results May 8, 2013
 First Quarter 2013 Results May 8, 2013 Safe Harbor Disclosure Please review our SEC filings on Form 10-K and Form 10-Q The statements contained in this presentation that are not historical facts are forward-looking
ACTIVISION BLIZZARD ANNOUNCES BETTER-THAN-EXPECTED SECOND QUARTER 2011 FINANCIAL RESULTS
 Contacts: Kristin Southey SVP, Investor Relations (310) 255-2635 ksouthey@activision.com Maryanne Lataif SVP, Corporate Communications (310) 255-2704 mlataif@activision.com FOR IMMEDIATE RELEASE ACTIVISION
Second Quarter CY 2010 Results. August 05, 2010
 Second Quarter CY 2010 Results August 05, 2010 Safe Harbor Disclosure The statements contained in this presentation that are not historical facts are forward-looking statements. The company generally uses
Second Quarter 2013 Results August 1, 2013
 Second Quarter 203 Results August, 203 2 Safe Harbor Disclosure Please review our SEC filings on Form 0-K and Form 0-Q The statements contained in this presentation that are not historical facts are forward-looking
First Quarter 2014 Results
 First Quarter 04 Results May 6, 04 Safe Harbor Disclosure Please review our SEC filings on Form 0-K and Form 0-Q The statements contained in this presentation that are not historical facts are forward-looking
Third Quarter 2014 Results
 Third Quarter 204 Results November 4, 204 Safe Harbor Disclosure Please review our SEC filings on Form 0-K and Form 0-Q The statements contained in this presentation that are not historical facts are forward-looking
Fourth Quarter 2013 Results. February 6, 2014
 Fourth Quarter 2013 Results February 6, 2014 Safe Harbor Disclosure Please review our SEC filings on Form 10-K and Form 10-Q The statements contained in this presentation that are not historical facts
Second Quarter 2014 Results
 Second Quarter 2014 Results August 5, 2014 Safe Harbor Disclosure Please review our SEC filings on Form 10-K and Form 10-Q The statements contained in this presentation that are not historical facts are
Activision Blizzard Announces Record First Quarter Financial Results
 Activision Blizzard Announces Record First Quarter Financial Results - Q1 and EPS Ahead of Prior Year and Prior - - Q1 GAAP EPS Increased 40% and Non-GAAP EPS Up 44% Over Prior Year - - Q1 from Digital
Second Quarter 2015 Results
 Second Quarter 205 Results August 4, 205 Safe Harbor Disclosure Please review our SEC filings on Form 0-K and Form 0-Q The statements contained in this presentation that are not historical facts are forward-looking
Activision Blizzard Announces Better-Than-Expected Second Quarter 2012 Financial Results
 Activision Blizzard Announces Better-Than-Expected Second Quarter 2012 Financial Results Company Had The Top Three Best-Selling Games in North America and Europe For First Six Months of 20121 SANTA MONICA,
Activision Blizzard Announces Better-than-expected First Quarter 2012 Financial Results
 Activision Blizzard Announces Better-than-expected First Quarter 2012 Financial Results - Skylanders Spyro's Adventure was #1 Kids Video Game for First Quarter 2012 with 30+ Million Toys Sold Life to Date
Fourth Quarter 2015 Results. February 11, 2016
 Fourth Quarter 05 Results February, 06 Safe Harbor Disclosure Please review our SEC filings on Form 0-K and Form 0-Q The statements contained in this presentation that are not historical facts are forward-looking
ACTIVISION BLIZZARD ANNOUNCES THIRD-QUARTER 2018 FINANCIAL RESULTS. Better-Than-Expected Q3 Results
 ACTIVISION BLIZZARD ANNOUNCES THIRD-QUARTER 2018 FINANCIAL RESULTS Better-Than-Expected Q3 Results Santa Monica, CA November 8, 2018 Activision Blizzard, Inc. (Nasdaq: ATVI) today announced third-quarter
Activision Blizzard Reports December Quarter and Calendar Year 2009 Financial Results
 Activision Blizzard Reports December Quarter and Calendar Year 2009 Financial Results - Company Announces $1 Billion Share Repurchase Program - - Annual Cash Dividend of $0.15 per Common Share - - For
LONG TERM VALUE CREATION BLAKE JORGENSEN, CFO
 LONG TERM VALUE CREATION BLAKE JORGENSEN, CFO SAFE HARBOR STATEMENT This presentation contains forward-looking statements that are subject to change. Statements including words such as anticipate, "believe,
Third Quarter 2017 Results. November 2, 2017
 Third Quarter 207 Results November 2, 207 Safe Harbor Disclosure Please review our SEC filings on Form 0-K and Form 0-Q The statements contained herein that are not historical facts are forward-looking
Activision Blizzard Announces Better-Than-Expected First Quarter CY 2009 Financial Results
 Activision Blizzard Announces Better-Than-Expected First Quarter CY 2009 Financial Results First Quarter Net Revenues and EPS Significantly Ahead of Prior Outlook Company Increases CY 2009 Net Revenues
Activision Blizzard Announces Better-Than-Expected Third Quarter CY 2009 Financial Results
 Activision Blizzard Announces Better-Than-Expected Third Quarter CY 2009 Financial Results - Company Calendar Year Financial Outlook Remains Unchanged - SANTA MONICA, Calif., Nov 05, 2009 /PRNewswire-FirstCall
Activision Blizzard Announces Better-Than-Expected Second Quarter CY 2009 Financial Results
 Activision Blizzard Announces Better-Than-Expected Second Quarter CY 2009 Financial Results -Company Increases CY 2009 GAAP EPS Outlook and Reaffirms CY 2009 Non-GAAP EPS Outlook- -Board of Directors Increases
Activision Announces Second Quarter 2006 Results
 Activision Announces Second Quarter 2006 Results - Company's Q2 Results Exceed Outlook - - Company Increases FY 2006 Revenue Outlook - SANTA MONICA, Calif., Nov 02, 2005 /PRNewswire-FirstCall via COMTEX
First Quarter 2017 Results. May 4, 2017
 First Quarter 207 Results May 4, 207 Safe Harbor Disclosure Please review our SEC filings on Form 0-K and Form 0-Q The statements contained herein that are not historical facts are forward-looking statements,
ACTIVISION BLIZZARD ANNOUNCES BETTER THAN EXPECTED FIRST QUARTER 2015 FINANCIAL RESULTS. Company Increases CY 2015 Revenues and EPS Outlook
 FOR IMMEDIATE RELEASE ACTIVISION BLIZZARD ANNOUNCES BETTER THAN EXPECTED FIRST QUARTER 2015 FINANCIAL RESULTS Company Increases CY 2015 Revenues and EPS Outlook Company Delivered Record Q1 Non GAAP Digital
ACTIVISION BLIZZARD ANNOUNCES BETTER-THAN-EXPECTED SECOND QUARTER 2015 FINANCIAL RESULTS
 FOR IMMEDIATE RELEASE ACTIVISION BLIZZARD ANNOUNCES BETTER-THAN-EXPECTED SECOND QUARTER 05 FINANCIAL RESULTS Company Increases CY 05 Revenues and EPS Outlook Once Again Company Delivered Record Q Non-GAAP
Peter Moore, President
 EA SPORTS Peter Moore, President November 13, 2008 1 Safe Harbor Statement During the course of this meeting EA may make forward-looking statements regarding future events and the future financial performance
Take-Two Interactive Software, Inc.
 Take-Two Interactive Software, Inc. (NASDAQ: TTWO) Wedbush Technology, Media & Telecommunications Conference March 7, 2012 Forward-Looking Statements The statements contained herein which are not historical
Activision Blizzard Announces Better-Than-Expected Third Quarter CY 2009 Financial Results
 Activision Blizzard Announces Better-Than-Expected Third Quarter CY 2009 Financial Results - Company Calendar Year Financial Outlook Remains Unchanged - SANTA MONICA, Calif., Nov 05, 2009 /PRNewswire-FirstCall
ACTIVISION BLIZZARD ANNOUNCES AGREEMENT TO ACQUIRE KING DIGITAL ENTERTAINMENT AND BETTER-THAN-EXPECTED THIRD QUARTER 2015 FINANCIAL RESULTS
 ACTIVISION BLIZZARD ANNOUNCES AGREEMENT TO ACQUIRE KING DIGITAL ENTERTAINMENT AND BETTER-THAN-EXPECTED THIRD QUARTER 05 FINANCIAL RESULTS Company Increases CY 05 Revenues and EPS Outlook Company Delivered
ACTIVISION BLIZZARD, INC.
 ACTIVISION BLIZZARD, INC. FORM 8-K (Current report filing) Filed 05/06/5 for the Period Ending 05/06/5 Address 00 OCEAN PARK BLVD SANTA MONICA, CA 90405 Telephone 055000 CIK 000078877 Symbol ATVI SIC Code
UConn Student Managed Fund 2017 Analyst Report. Taishi Kato and Tommy Stodolski
 UConn Student Managed Fund 2017 Analyst Report Taishi Kato and Tommy Stodolski 1 TABLE OF CONTENTS Report Highlights... 2 Business Description... 2 Business Overview: Developing into an Interactive Entertainment
H1 FY16 Earnings presentation November 4th, 2015
 H1 FY16 Earnings presentation November 4th, 2015 Yves Guillemot, President and Chief Executive Officer Alain Martinez, Chief Financial Officer Jean-Benoît Roquette, SVP Investor Relations D I S C L A I
Investor Presentation
 Investor Presentation February 2011 Forward-Looking Statements Certain statements made during this presentation may be deemed to constitute forward-looking statements. Such statements include but are not
Sony IR Day Game & Network Services Segment. November 25, Andrew House
 Sony IR Day 2014 November 25, 2014 Andrew House President and Group CEO Sony Computer Entertainment Inc. Group Executive in Charge of Network Entertainment Business Sony Corporation Agenda 1. Business
ELECTRONIC ARTS E3 INVESTOR BREAKFAST. Westin Bonaventure Hotel Los Angeles, CA June 12, 2013
 ELECTRONIC ARTS E3 INVESTOR BREAKFAST Westin Bonaventure Hotel Los Angeles, CA June 12, 2013 Safe Harbor Statement Please review our risk factors on Form 10-K filed with the SEC. Some statements set forth
ELECTRONIC ARTS Q2 FY14 PREPARED COMMENTS October 29, ROB: Thank you.
 ELECTRONIC ARTS Q2 FY14 PREPARED COMMENTS October 29, 2013 ROB: Thank you. Welcome to EA s fiscal 2014 second quarter earnings call. With me on the call today are Andrew Wilson, our CEO, and Blake Jorgensen,
THE STARS GROUP 2017 ANNUAL AND SPECIAL MEETING MANAGEMENT PRESENTATION MAY 10, 2018, TORONTO, 11:30 (ET)
") Please Note: THE STARS GROUP 2017 ANNUAL AND SPECIAL MEETING MANAGEMENT PRESENTATION MAY 10, 2018, TORONTO, 11:30 (ET) Some of our comments today will contain forward-looking information and statements
Please Note: THE STARS GROUP 2017 ANNUAL AND SPECIAL MEETING MANAGEMENT PRESENTATION MAY 10, 2018, TORONTO, 11:30 (ET) Some of our comments today will contain forward-looking information and statements
G5 Entertainment. Investor Presentation
 G5 Entertainment Investor Presentation G5 Entertainment in Brief Developer and publisher of casual free-to-play (F2P) games for tablets and smartphones Global company operating in the global market of
Nishant l33t Verma 33 Rachel pwn Nabatian Weiye noob Zhang
 Nishant l33t Verma 33 Rachel pwn Nabatian Weiye noob Zhang Company Overview Thesis Blizzard Synergies Solid Pipeline e 09 10 0 Competitive Advantage Risks DCF World s largest third party game publisher
Capcom Co., Ltd. (Tokyo Stock Exchange, First Section, 9697) Overview of Strategies and Plans Fiscal Year ending March 31, 2019
 Overview of Strategies and Plans Fiscal Year ending March 31, 2019") Capcom Co., Ltd. (Tokyo Stock Exchange, First Section, 9697) Overview of Strategies and Plans Fiscal Year ending March 31, 2019 0 0 Forward-looking Statements Strategies, plans, outlooks and other statements
Capcom Co., Ltd. (Tokyo Stock Exchange, First Section, 9697) Overview of Strategies and Plans Fiscal Year ending March 31, 2019 0 0 Forward-looking Statements Strategies, plans, outlooks and other statements
ACTIVISION BLIZZARD, INC.
 ACTIVISION BLIZZARD, INC. FORM 8-K (Current report filing) Filed 11/05/08 for the Period Ending 11/05/08 Address 3100 OCEAN PARK BLVD SANTA MONICA, CA 90405 Telephone 3102552000 CIK 0000718877 Symbol ATVI
Results Presentation 2017 Second Quarter and Interim Results. 30 Aug, 2017
 Results Presentation 2017 Second Quarter and Interim Results 30 Aug, 2017 Disclaimer This presentation is prepared by NetDragon Websoft Holdings Limited (the Company ) solely for information purposes and
Global MMORPG Gaming Market: Size, Trends & Forecasts ( ) November 2017
 November 2017") Global MMORPG Gaming Market: Size, Trends & Forecasts (2017-2021) November 2017 Global MMORPG Gaming Market: Coverage Executive Summary and Scope Introduction/Market Overview Global Market Analysis Dynamics
Global MMORPG Gaming Market: Size, Trends & Forecasts (2017-2021) November 2017 Global MMORPG Gaming Market: Coverage Executive Summary and Scope Introduction/Market Overview Global Market Analysis Dynamics
STARBREEZE investor Presentation
 STARBREEZE investor Presentation GP Bullhound Nordic Tech Tour, 7 December 2017 Slide / 1 Introduction to starbreeze outline Starbreeze games and publishing Virtual reality Slide / 2 Financial overview
Analyst Day Real change starts here. Doug Pferdehirt, Chief Executive Officer
 2017 Real change starts here Doug Pferdehirt, Chief Executive Officer Disclaimer Forward-looking statements We would like to caution you with respect to any forward-looking statements made in this commentary
G5 Entertainment. Investor Presentation
 G5 Entertainment Investor Presentation G5 Entertainment in Brief Developer and publisher of casual free-to-play (F2P) games for tablets and smartphones Global company operating in the global market of
Electronic Arts Inc. January 18th, Michael Gude Portfolio Manager. Chase Westenfelder Quantitative Model Developer
 Electronic Arts Inc. EA January 18th, 2018 Michael Gude Portfolio Manager Chase Westenfelder Quantitative Model Developer Taylor Crawford Private Equity Analyst Table of Contents Investment Thesis Competitor
Prepared Remarks FISCAL 2018 Q3
 Prepared Remarks FISCAL 2018 Q3 January 30, 2018 CHRIS: Thank you. Welcome to EA s third quarter fiscal 2018 earnings call. With me on the call today are Andrew Wilson, our CEO, and Blake Jorgensen, our
Activision Blizzard Announces Record June Quarter Stand-Alone Results for Activision
 Activision Blizzard Announces Record June Quarter Stand-Alone Results for Activision - Activision's June Quarter Net Revenues Increase 32%; - EPS Hits Record June Quarter High - - Activision Blizzard's
The Reed Report. Company Spotlight Take Two Interactive 11/29/2016
 The Reed Report Company Spotlight Take Two Interactive 11/29/2016 Business Overview Take Two Interactive Software (Ticker: TTWO) ( Take Two ) is a leading developer, publisher and marketer of interactive
Rovio Entertainment Corporation Annual General Meeting April 9, 2019 CEO REVIEW Kati Levoranta
 Rovio Entertainment Corporation Annual General Meeting April 9, 2019 CEO REVIEW Kati Levoranta TRANSLATED FROM THE FINNISH ORIGINAL Translated from the Finnish original. Finnish version prevails. Contents
Hasbro First Quarter 2016 Financial Results Conference Call Management Remarks April 18, 2016
 Hasbro First Quarter 2016 Financial Results Conference Call Management Remarks April 18, 2016 Debbie Hancock, Hasbro, Vice President, Investor Relations: Thank you and good morning everyone. Joining me
Activision Blizzard, Inc.
 Price USF SMIF Investment Report November 15, 2012 NASDAQ: ATVI Activision Blizzard, Inc. 2014 Target: $16.13-2016 Target: $21.46 - Intrinsic Value: $22.39 Key Statistics Price (11/13/12) $10.72 EPS (TTM)
Activision Blizzard Announces September Quarter Results
 Activision Blizzard Announces September Quarter Results - September Quarter Net Revenues and EPS Exceed Prior Outlook - - Company Reaffirms Full Year 2008 Outlook - - Company's Board of Directors Authorizes
ZYNGA Q QUARTERLY EARNINGS LETTER. August 4, Dear Shareholders,
 ZYNGA Q2 2016 QUARTERLY EARNINGS LETTER August 4, 2016 Dear Shareholders, We look forward to discussing our Q2 results during today s earnings call at 2:00 p.m. PT. Below, you ll find our quarterly letter
Textron Reports Third Quarter 2014 Income from Continuing Operations of $0.57 per Share, up 62.9%; Revenues up 18.1%
 Textron Reports Third Quarter Income from Continuing Operations of $0.57 per Share, up 62.9%; Revenues up 18.1% 10/17/ PROVIDENCE, R.I.--(BUSINESS WIRE)-- Textron Inc. (NYSE: TXT) today reported third
Activision Blizzard, Inc. ATVI NASDAQ Neutral-2
 COMPANY UPDATE / ESTIMATE CHANGE Key Metrics ATVI - NASDAQ (as of 2/12/18) $68.32 Price Target N/A 52-Week Range $44.47 - $74.94 Shares Outstanding (mil) (basic) 757 Market Cap. ($mil) $51,718 3-Mo. Average
Textron Reports Third Quarter 2018 Results; Narrows Full-Year EPS and Cash Guidance
 Corporate Communications Department NEWS Release Textron Reports Third Quarter 2018 Results; Narrows Full-Year EPS and Cash Guidance $468 million returned to shareholders through share repurchases Completed
Capcom Co., Ltd. (Tokyo Stock Exchange, First Section, 9697) Financial Highlights for the Fiscal Year ended March 31, 2016
 Financial Highlights for the Fiscal Year ended March 31, 2016") Capcom Co., Ltd. (Tokyo Stock Exchange, First Section, 9697) Financial Highlights for the Fiscal Year ended March 31, 2016 0 0 Forward-looking Statements Strategies, plans, outlooks and other statements
Capcom Co., Ltd. (Tokyo Stock Exchange, First Section, 9697) Financial Highlights for the Fiscal Year ended March 31, 2016 0 0 Forward-looking Statements Strategies, plans, outlooks and other statements
2 nd Quarter Earnings Conference Call
 2 nd Quarter Earnings Conference Call KKR & Co. Inc. Investor Update July 26, 2018 Recent Milestones K-1 $ Converted to a Corporation on July 1, 2018 Investor Day held on July 9, 2018 2 Key Metrics Assets
Capcom Co., Ltd. (Tokyo Stock Exchange, First Section, 9697) Overview of Strategies and Plans Fiscal Year ending March 31, 2017
 Overview of Strategies and Plans Fiscal Year ending March 31, 2017") Capcom Co., Ltd. (Tokyo Stock Exchange, First Section, 9697) Overview of Strategies and Plans Fiscal Year ending March 31, 2017 0 0 Forward-looking Statements Strategies, plans, outlooks and other statements
Capcom Co., Ltd. (Tokyo Stock Exchange, First Section, 9697) Overview of Strategies and Plans Fiscal Year ending March 31, 2017 0 0 Forward-looking Statements Strategies, plans, outlooks and other statements
4 th Quarter Earnings Conference Call
 4 th Quarter Earnings Conference Call KKR & Co. Inc. Investor Update February 1, 2019 Key Metrics Assets Under Management Management Fees ($ in billions) ($ in millions) $195 $1,069 $168 $905 $100 $107
KKR & Co. Inc. Goldman Sachs U.S. Financial Services Conference December 4, 2018
 KKR & Co. Inc. Goldman Sachs U.S. Financial Services Conference December 4, 2018 KKR Today Private Markets Public Markets Capital Markets Principal Activities $104bn AUM $91bn AUM Global Franchise $19bn
Textron Reports Second Quarter 2014 Income from Continuing Operations of $0.51 per Share, up 27.5%; Revenues up 23.5%
 Textron Reports Second Quarter 2014 Income from Continuing Operations of $0.51 per Share, up 27.5%; Revenues up 23.5% 07/16/2014 PROVIDENCE, R.I.--(BUSINESS WIRE)-- Textron Inc. (NYSE: TXT) today reported
Prepared Remarks FISCAL 2018 Q2
 Prepared Remarks FISCAL 2018 Q2 October 31, 2017 CHRIS: Thank you. Welcome to EA s second quarter fiscal 2018 earnings call. With me on the call today are Andrew Wilson, our CEO, and Blake Jorgensen, our
4Q February 2011
 4Q 2010 28 February 2011 2 Disclaimer forward looking statements This presentation contains forward-looking statements that involve risks and uncertainties. All statements other than statements of historical
Activision Blizzard, Inc. ATVI NASDAQ Neutral-2
 COMPANY UPDATE / ESTIMATE CHANGE / RATING CHANGE Key Metrics ATVI - NASDAQ (as of 11/7/17) $60.96 Price Target N/A 52-Week Range $35.12 - $67.03 Shares Outstanding (mil) (basic) 755 Market Cap. ($mil)
Capcom Co., Ltd. (Tokyo Stock Exchange, First Section, 9697) 3rd Quarter Report Fiscal year ending March 31, 2018
 3rd Quarter Report Fiscal year ending March 31, 2018") Capcom Co., Ltd. (Tokyo Stock Exchange, First Section, 9697) 3rd Quarter Report Fiscal year ending March 31, 2018 0 Forward-looking Statements Strategies, plans, outlooks and other statements that are
Capcom Co., Ltd. (Tokyo Stock Exchange, First Section, 9697) 3rd Quarter Report Fiscal year ending March 31, 2018 0 Forward-looking Statements Strategies, plans, outlooks and other statements that are
INVESTOR DAY. February 18 th 2016
 INVESTOR DAY February 18 th 2016 DISCLAIMER This statement may contain estimated financial data, information on future projects and transactions and future business results/ performance. Such forward-looking
Hasbro Second Quarter 2017 Financial Results Conference Call Management Remarks July 24, 2017
 Hasbro Second Quarter 2017 Financial Results Conference Call Management Remarks July 24, 2017 Debbie Hancock, Hasbro, Vice President, Investor Relations: Thank you and good morning everyone. Joining me
Confirms 2013 Financial Guidance
 Confirms 2013 Financial Guidance PROVIDENCE, R.I.--(BUSINESS WIRE)--Jul. 17, 2013-- Textron Inc. (NYSE: TXT) today reported second quarter 2013 income from continuing operations of $0.40 per share, compared
Hasbro Second Quarter 2012 Financial Results Conference Call Management Remarks July 23, 2012
 Hasbro Second Quarter 2012 Financial Results Conference Call Management Remarks July 23, 2012 Debbie Hancock, Hasbro, Vice President, Investor Relations: Thank you and good morning everyone. Our second
UBISOFT REPORTS FIRST-QUARTER SALES
 UBISOFT REPORTS FIRST-QUARTER 2018-19 SALES A solid performance, led by sharp back-catalog growth and continued strong momentum for digital Sales : 400.0 M Net bookings up 88.8% to 381.5 million, outstripping
Overview Business Review Financials Q&A
 1 Cautionary note This presentation may contain forward-looking statements relating to the forecasts, targets, outlook, estimates of financial performance, opportunities, challenges, business developments,
Annual General Meeting Wednesday, January 13, 2010
 Annual General Meeting Wednesday, January 13, 2010 Safe Harbour Disclosure To the extent any statements made in this presentation contain information that is not historical; these statements are forward-looking
Goldman Sachs Global Energy Conference. January 2014
 Goldman Sachs Global Energy Conference January 2014 1 Forward-Looking Statements Statements made today that are not historical facts are forward-looking statements within the meaning of Section 27A of
Pareto Securities 20 th Annual Oil & Offshore Conference. Dan Rabun, Chairman & CEO. 4 September 2013
 Pareto Securities 20 th Annual Oil & Offshore Conference Dan Rabun, Chairman & CEO 4 September 2013 1 Forward-Looking Statements Statements made today that are not historical facts are forward-looking
4 th Quarter Earnings Conference Call
 4 th Quarter Earnings Conference Call KKR & Co. L.P. Investor Update February 8, 2018 4Q17 Reflections Fundamentals Are Strong (Dollars in millions, except per unit amounts and unless otherwise stated)
In the quarter, Textron returned $344 million to shareholders through share repurchases, compared to $186 million in the first quarter of 2017.
 Corporate Communications Department NEWS Release Textron Reports First Quarter 2018 Income from Continuing Operations of $0.72 per Share; Signs Agreement to Sell Tools & Test Business for $810 Million
Capcom Co., Ltd. (Tokyo and Osaka Exchanges, First Section, 9697) Results of Operations and Strategies First half of fiscal year ending March 31, 2013
 Results of Operations and Strategies First half of fiscal year ending March 31, 2013") Capcom Co., Ltd. (Tokyo and Osaka Exchanges, First Section, 9697) Results of Operations and Strategies First half of fiscal year ending March 31, 2013 0 Forward-looking Statements Strategies, plans, outlooks
Capcom Co., Ltd. (Tokyo and Osaka Exchanges, First Section, 9697) Results of Operations and Strategies First half of fiscal year ending March 31, 2013 0 Forward-looking Statements Strategies, plans, outlooks
RAZER INC. CORPORATE PRESENTATION
 RAZER INC. CORPORATE PRESENTATION LEGAL DISCLAIMER Potential investors and shareholders (the Potential Investors and Shareholders ) of Razer Inc. (the Company ) are reminded that information contained
2Q FY2018/3 Financial Results Briefing by SQUARE ENIX HOLDINGS held on Nov. 8, 2017
 We would now like to begin the Financial Results Briefing Session of SQUARE ENIX HOLDINGS (the Company ) for the first half of the fiscal year ending March 31, 2018 ( 1H FY2018/3 ). Today s presenters
Capcom Co., Ltd. (Tokyo Stock Exchange, First Section, 9697) Financial Highlights for the Fiscal Year ended March 31, 2018
 Financial Highlights for the Fiscal Year ended March 31, 2018") Capcom Co., Ltd. (Tokyo Stock Exchange, First Section, 9697) Financial Highlights for the Fiscal Year ended March 31, 2018 0 0 Forward-looking Statements Strategies, plans, outlooks and other statements
Capcom Co., Ltd. (Tokyo Stock Exchange, First Section, 9697) Financial Highlights for the Fiscal Year ended March 31, 2018 0 0 Forward-looking Statements Strategies, plans, outlooks and other statements
Annual results 2005/06
 Annual results 2005/06 June 28, 2006 Yves Guillemot, Chief Executive Officer Alain Martinez, Chief Finance Officer Agenda Introduction Arrival of next-generation platforms: Evolutions and potential Ubisoft's
G5 ENTERTAINMENT AB. Investor Presentation
 G5 ENTERTAINMENT AB Investor Presentation G5 Entertainment in Brief Developer and publisher of casual free-to-play (F2P) games for tablets and smartphones Global company operating in the global market
Nexon Investor Presentation Q NEXON Co., Ltd.
 Nexon Investor Presentation Q3 2012 NEXON Co., Ltd. Q3 2012 Results 2 Highlights Quarterly revenue of 24.2 bn and operating income of 10.0 bn Revenues flat YoY, up 3% on constant currency basis, slightly
Capcom Co., Ltd. (Tokyo Exchanges, First Section, 9697) Results of Operations and Strategies First half of fiscal year ending March 31, 2014
 Results of Operations and Strategies First half of fiscal year ending March 31, 2014") Capcom Co., Ltd. (Tokyo Exchanges, First Section, 9697) Results of Operations and Strategies First half of fiscal year ending March 31, 2014 0 Forward-looking Statements Strategies, plans, outlooks and
Capcom Co., Ltd. (Tokyo Exchanges, First Section, 9697) Results of Operations and Strategies First half of fiscal year ending March 31, 2014 0 Forward-looking Statements Strategies, plans, outlooks and
Capital One Securities, Inc.
 Capital One Securities, Inc. 10 th Annual Energy Conference December 9, 2015 New Orleans, LA Alan R. Curtis SVP and Chief Financial Officer Oceaneering International, Inc. Safe Harbor Statement Statements
Acquisition of GEODynamics. December 13, 2017
 Acquisition of GEODynamics December 13, 2017 Forward-looking Statements We include the following cautionary statement to take advantage of the "safe harbor" provisions of the Private Securities Litigation
Capcom Co., Ltd. (Tokyo Stock Exchange, First Section, 9697) 3rd Quarter Report Fiscal year ending March 31, 2019
 3rd Quarter Report Fiscal year ending March 31, 2019") Capcom Co., Ltd. (Tokyo Stock Exchange, First Section, 9697) 3rd Quarter Report Fiscal year ending March 31, 2019 0 Contents page 1. Forecasts for FY3/19 2 2. Financial Highlights 3 3. Business Segment
Capcom Co., Ltd. (Tokyo Stock Exchange, First Section, 9697) 3rd Quarter Report Fiscal year ending March 31, 2019 0 Contents page 1. Forecasts for FY3/19 2 2. Financial Highlights 3 3. Business Segment
Halliburton and Baker Hughes Creating the leading oilfield services company
 Halliburton and Baker Hughes Creating the leading oilfield services company Halliburton Investor Relations Contacts: Kelly Youngblood, Vice President Scott Danby, Manager 281.871.2688 or investors@halliburton.com
Good afternoon. I m Kazuharu Watanabe. I will be presenting an overview of the Company s financial results for 1Q FY2019/3.
 We would now like to begin the Financial Results Briefing Session of SQUARE ENIX HOLDINGS (the Company ) for the first quarter of the fiscal year ending March 31, 2019 ( 1Q FY2019/3 ). Today s presenters
Sanford Bernstein Strategic Decisions Conference. May 2014
 Sanford Bernstein Strategic Decisions Conference May 2014 1 Forward-Looking Statements Statements made today that are not historical facts are forward-looking statements within the meaning of Section 27A
Capcom Co., Ltd. (Tokyo Exchanges, First Section, 9697) 3rd Quarter Report Fiscal year ending March 31, 2014
 3rd Quarter Report Fiscal year ending March 31, 2014") Capcom Co., Ltd. (Tokyo Exchanges, First Section, 9697) 3rd Quarter Report Fiscal year ending March 31, 2014 0 Forward-looking Statements Strategies, plans, outlooks and other statements that are not historical
Capcom Co., Ltd. (Tokyo Exchanges, First Section, 9697) 3rd Quarter Report Fiscal year ending March 31, 2014 0 Forward-looking Statements Strategies, plans, outlooks and other statements that are not historical
Investor Presentation. November 2018
 Investor Presentation November 2018 KKR Today Private Markets Public Markets Capital Markets Principal Activities $104bn AUM $91bn AUM Global Franchise $19bn of Assets $81bn Private Equity, Growth Equity
Capcom Co., Ltd. (Tokyo Exchanges, First Section, 9697) 3rd Quarter Report Fiscal year ending March 31, 2016
 3rd Quarter Report Fiscal year ending March 31, 2016") Capcom Co., Ltd. (Tokyo Exchanges, First Section, 9697) 3rd Quarter Report Fiscal year ending March 31, 2016 0 Forward-looking Statements Strategies, plans, outlooks and other statements that are not historical
Capcom Co., Ltd. (Tokyo Exchanges, First Section, 9697) 3rd Quarter Report Fiscal year ending March 31, 2016 0 Forward-looking Statements Strategies, plans, outlooks and other statements that are not historical