Chapter 6: Descriptive Statistics
|
|
|
- May Emmeline Pearson
- 5 years ago
- Views:
Transcription
1 Chapter 6: Descriptive Statistics Problem (01): Make a frequency distribution table for the following data using 5 classes Problem (02): Annual Salaries Sample (in thousands of dollars) for municipal employees in Los Angeles and Long Beach are listed. Los Angeles Long Beach Find the number of classes and the class range, variance, and standard deviation of each data set. Engr. Yasser M. Almadhoun Page 1
2 9 = 3 n = = (X 2 Variance (S 2 X ) ) = n 1 = = (X X ) 2 Standard deviation (S) = n 1 = = = = 3 n = = (X 2 Variance (S 2 X ) ) = n 1 = = Standard deviation (S) = (X X ) 2 n 1 Engr. Yasser M. Almadhoun Page 2
3 = = = 3.82 Problem (03): The weights (in pounds) of the defensive players on a high school football team are given. (a) Make a boxplot of the data. (b) Find the mode n = = Engr. Yasser M. Almadhoun Page 3
4 Lower Least quartile Median Upper quartile Greatest Interquartile range Mean Problem (04): The data set is the number of minutes a sample of 25 people exercise each week (a) Make a frequency distribution of the data set using five classes. Include class limits, midpoints, frequencies, boundaries, relative frequencies, and cumulative frequencies. (b) Display the data using a frequency histogram and a frequency polygon on the same axes. (c) Display the data using a relative frequency histogram. (d) Display the data using a boxplot. (e) Display the data using an ogive Engr. Yasser M. Almadhoun Page 4


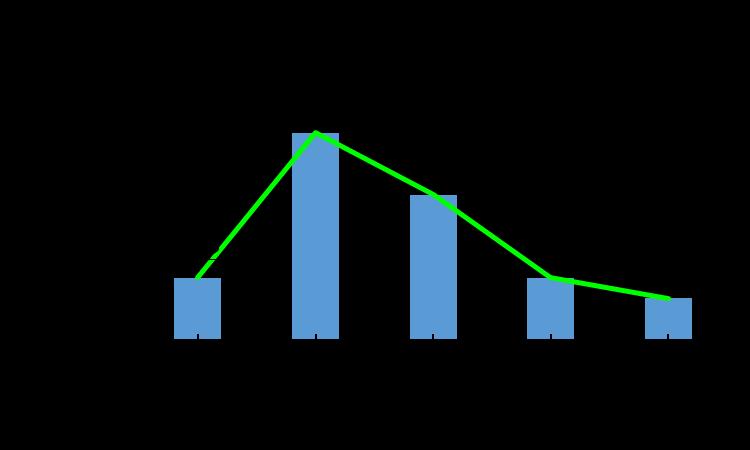
5 Engr. Yasser M. Almadhoun Page 5
6 n = = Lower Least quartile Median Upper quartile Greatest Interquartile range Mean Engr. Yasser M. Almadhoun Page 6


")


 Find the mode.")
7 Problem (05): The number of wins for each Major-League Baseball team in 2003 are listed (a) Find the quartiles of the data set. (b) Find the interquartile range. (c) Draw a boxplot. (d) Find the mode. Engr. Yasser M. Almadhoun Page 7
8 n = = Lower Least quartile 43.0 Median Upper quartile Greatest Interquartile range Mean Problem (06): For the following set of data, using five classes, find: (a) The frequency distribution table. (b) The relative frequency distribution table. (c) The Frequency Histogram. (d) Present the data as stem-and-leaf plot. Engr. Yasser M. Almadhoun Page 8


9 n = 36 = 6 Engr. Yasser M. Almadhoun Page 9
10 Problem (07): The grades of 20 students in statistics midterm exam are as follow: (a) Calculate the sample mean and the trimmed mean. (b) Calculate the sample standard deviation. (c) Find the quartiles. (d) Draw a boxplot of the above data set. (Question 6: in Final Exam 2005) n = = Engr. Yasser M. Almadhoun Page 10
11 Trimmed mean (X ) T10% = X n = = X (X X ) (X X ) 2 (X 2 Variance (S 2 X ) ) = n 1 = = Standard deviation (S) = (X X ) 2 n 1 Engr. Yasser M. Almadhoun Page 11
12 = = = 6.24 n = = Engr. Yasser M. Almadhoun Page 12


 One half of the")

13 Lower Smaller quartile 10.0 Median Upper quartile Greatest Interquartile range Mean Problem (08): Use the boxplot below to determine which statement is accurate (choose the best alternative): (a) About 25% of the adults have cholesterol levels of at most 211. (b) About 75% of the adults have cholesterol levels less than 180. (c) One half of the cholesterol levels are between 180 and (d) One half of the cholesterol levels are between 180 and 211. Engr. Yasser M. Almadhoun Page 13
AP Statistics Composition Book Review Chapters 1 2
 AP Statistics Composition Book Review Chapters 1 2 Terms/vocabulary: Explain each term with in the STATISTICAL context. Bar Graph Bimodal Categorical Variable Density Curve Deviation Distribution Dotplot
Chapter 1: Stats Starts Here Chapter 2: Data
 Chapter 1: Stats Starts Here Chapter 2: Data Statistics data, datum variation individual respondent subject participant experimental unit observation variable categorical quantitative Calculator Skills:
Elementary Statistics. Graphing Data
 Graphing Data What have we learned so far? 1 Randomly collect data. 2 Sort the data. 3 Compute the class width for specific number of classes. 4 Complete a frequency distribution table with the following
Numerical: Data with quantity Discrete: whole number answers Example: How many siblings do you have?
 Types of data Numerical: Data with quantity Discrete: whole number answers Example: How many siblings do you have? Continuous: Answers can fall anywhere in between two whole numbers. Usually any type of
Section 1.5 Graphs and Describing Distributions
 Section 1.5 Graphs and Describing Distributions Data can be displayed using graphs. Some of the most common graphs used in statistics are: Bar graph Pie Chart Dot plot Histogram Stem and leaf plot Box
Sidcot intranet - Firefly. Useful links: Instant classroom. MyMaths. Objectives
 Useful links: Sidcot intranet - Firefly Instant classroom MyMaths Objectives Objectives To revise scatter graphs To use them to make estimations Scatter Graphs Revision powerpoint Now make some revision
Sections Descriptive Statistics for Numerical Variables
 Math 243 Sections 2.1.2-2.2.5 Descriptive Statistics for Numerical Variables A framework to describe quantitative data: Describe the Shape, Center and Spread, and Unusual Features Shape How is the data
SAMPLE. This chapter deals with the construction and interpretation of box plots. At the end of this chapter you should be able to:
 find the upper and lower extremes, the median, and the upper and lower quartiles for sets of numerical data calculate the range and interquartile range compare the relative merits of range and interquartile
Chapter 2 Frequency Distributions and Graphs
 Chapter 2 Frequency Distributions and Graphs Outline 2-1 Organizing Data 2-2 Histograms, Frequency Polygons, and Ogives 2-3 Other Types of Graphs Objectives Organize data using a frequency distribution.
Review. In an experiment, there is one variable that is of primary interest. There are several other factors, which may affect the measured result.
 Review Observational study vs experiment Experimental designs In an experiment, there is one variable that is of primary interest. There are several other factors, which may affect the measured result.
Statistics for Managers using Microsoft Excel 3 rd Edition
 Statistics for Managers using Microsoft Excel 3 rd Edition Chapter 2 Presenting Data in Tables and Charts 22 Prentice-Hall, Inc. Chap 2-1 Chapter Topics Organizing numerical data The ordered array and
THOMAS WHITHAM SIXTH FORM
 THOMAS WHITHAM SIXTH FORM Handling Data Levels 6 8 S. J. Cooper Probability Tree diagrams & Sample spaces Statistical Graphs Scatter diagrams Mean, Mode & Median Year 9 B U R N L E Y C A M P U S, B U R
A B C. 142 D. 96
 Data Displays and Analysis 1. stem leaf 900 3 3 4 5 7 9 901 1 1 1 2 4 5 6 7 8 8 8 9 9 902 1 3 3 3 4 6 8 9 9 903 1 2 2 3 3 3 4 7 8 9 904 1 1 2 4 5 6 8 8 What is the range of the data shown in the stem-and-leaf
MAT Midterm Review
 MAT 120 - Midterm Review Name Identify the population and the sample. 1) When 1094 American households were surveyed, it was found that 67% of them owned two cars. Identify whether the statement describes
Find the following for the Weight of Football Players. Sample standard deviation n=
 Find the following for the Weight of Football Players x Sample standard deviation n= Fun Coming Up! 3-3 Measures of Position Z-score Percentile Quartile Outlier Bluman, Chapter 3 3 Measures of Position:
Chapter 2. Describing Distributions with Numbers. BPS - 5th Ed. Chapter 2 1
 Chapter 2 Describing Distributions with Numbers BPS - 5th Ed. Chapter 2 1 Numerical Summaries Center of the data mean median Variation range quartiles (interquartile range) variance standard deviation
Contemporary Mathematics Math 1030 Sample Exam I Chapters Time Limit: 90 Minutes No Scratch Paper Calculator Allowed: Scientific
 Contemporary Mathematics Math 1030 Sample Exam I Chapters 13-15 Time Limit: 90 Minutes No Scratch Paper Calculator Allowed: Scientific Name: The point value of each problem is in the left-hand margin.
Lecture 16 Sections Tue, Sep 23, 2008
 s Lecture 16 Sections 5.3.1-5.3.3 Hampden-Sydney College Tue, Sep 23, 2008 in Outline s in 1 2 3 s 4 5 6 in 7 s Exercise 5.7, p. 312. (a) average (or mean) age for 10 adults in a room is 35 years. A 32-year-old
Lecture 2: Chapter 2
 Lecture 2: Chapter 2 C C Moxley UAB Mathematics 3 June 15 2.2 Frequency Distributions Definition (Frequency Distribution) Frequency distributions shows how data are distributed among categories (classes)
The numbers are...,..., ...,...,...,...,...,
 Stem and leaf diagrams 1. 2. 3. Stem Leaf Stem Leaf Stem Leaf 2 3 4 5 1 3 6 9 0 4 4 5 5 6 3 The numbers are 21, 23, 0 1 2 3 2 6 8 3 4 5 8 1 2 4 0 5 The numbers are...,..., 88 89 90 91 7 0 8 9 1 3 5 6 9
Incoming Advanced Grade 7
 Name Date Incoming Advanced Grade 7 Tell whether the two fractions form a proportion. 1. 3 16, 4 20 2. 5 30, 7 42 3. 4 6, 18 27 4. Use the ratio table to find the unit rate in dollars per ounce. Order
Year 9 Unit G Revision. Exercise A
 Year 9 Unit G Revision Exercise A 1.) Find the mode, median, mean, range and interquartile range of each of the following lists. a.) 11, 13, 13, 16, 16, 17, 19, 20, 24, 24, 24, 25, 30 b.) 21, 36, 78, 45,
Describing Data. Presenting Categorical Data Graphically. Describing Data 143
 Describing Data 143 Describing Data Once we have collected data from surveys or experiments, we need to summarize and present the data in a way that will be meaningful to the reader. We will begin with
Table 1. List of NFL divisions that have won the Superbowl over the past 52 years.
 MA 2113 Homework #1 Table 1. List of NFL divisions that have won the Superbowl over the past 52 years. NFC North AFC West NFC East NFC North AFC South NFC North NFC East NFC East AFC West NFC East AFC
Univariate Descriptive Statistics
 Univariate Descriptive Statistics Displays: pie charts, bar graphs, box plots, histograms, density estimates, dot plots, stemleaf plots, tables, lists. Example: sea urchin sizes Boxplot Histogram Urchin
Lecture 16 Sections Tue, Feb 10, 2009
 s Lecture 16 Sections 5.3.1-5.3.3 Hampden-Sydney College Tue, Feb 10, 2009 Outline s 1 2 3 s 4 5 6 7 s Exercise 5.6, p. 311. salaries of superstar professional athletes receive much attention in the media.
Notes 5C: Statistical Tables and Graphs
 Notes 5C: Statistical Tables and Graphs Frequency Tables A frequency table is an easy way to display raw data. A frequency table typically has between two to four columns: The first column lists all the
You must have: Pen, HB pencil, eraser, calculator, ruler, protractor.
 Write your name here Surname Other names Pearson Edexcel Award Statistical Methods Level 2 Calculator allowed Centre Number Candidate Number Wednesday 14 May 2014 Morning Time: 1 hour 30 minutes You must
Symmetric (Mean and Standard Deviation)
") Summary: Unit 2 & 3 Distributions for Quantitative Data Topics covered in Module 2: How to calculate the Mean, Median, IQR Shapes of Histograms, Dotplots, Boxplots Know the difference between categorical
Summary: Unit 2 & 3 Distributions for Quantitative Data Topics covered in Module 2: How to calculate the Mean, Median, IQR Shapes of Histograms, Dotplots, Boxplots Know the difference between categorical
Chpt 2. Frequency Distributions and Graphs. 2-3 Histograms, Frequency Polygons, Ogives / 35
 Chpt 2 Frequency Distributions and Graphs 2-3 Histograms, Frequency Polygons, Ogives 1 Chpt 2 Homework 2-3 Read pages 48-57 p57 Applying the Concepts p58 2-4, 10, 14 2 Chpt 2 Objective Represent Data Graphically
(3 pts) 1. Which statements are usually true of a left-skewed distribution? (circle all that are correct)
 1. Which statements are usually true of a left-skewed distribution? (circle all that are correct)") STAT 451 - Practice Exam I Name (print): Section: This is a practice exam - it s a representative sample of problems that may appear on the exam and also substantially longer than the in-class exam. It
STAT 451 - Practice Exam I Name (print): Section: This is a practice exam - it s a representative sample of problems that may appear on the exam and also substantially longer than the in-class exam. It
Chapter 2. Organizing Data. Slide 2-2. Copyright 2012, 2008, 2005 Pearson Education, Inc.
 Chapter 2 Organizing Data Slide 2-2 Section 2.1 Variables and Data Slide 2-3 Definition 2.1 Variables Variable: A characteristic that varies from one person or thing to another. Qualitative variable: A
LESSON 2: FREQUENCY DISTRIBUTION
 LESSON : FREQUENCY DISTRIBUTION Outline Frequency distribution, histogram, frequency polygon Relative frequency histogram Cumulative relative frequency graph Stem-and-leaf plots Scatter diagram Pie charts,
She concludes that the dice is biased because she expected to get only one 6. Do you agree with June's conclusion? Briefly justify your answer.
 PROBABILITY & STATISTICS TEST Name: 1. June suspects that a dice may be biased. To test her suspicions, she rolls the dice 6 times and rolls 6, 6, 4, 2, 6, 6. She concludes that the dice is biased because
Chapter 4. Displaying and Summarizing Quantitative Data. Copyright 2012, 2008, 2005 Pearson Education, Inc.
 Chapter 4 Displaying and Summarizing Quantitative Data Copyright 2012, 2008, 2005 Pearson Education, Inc. Dealing With a Lot of Numbers Summarizing the data will help us when we look at large sets of quantitative
Business Statistics:
 Department of Quantitative Methods & Information Systems Business Statistics: Chapter 2 Graphs, Charts, and Tables Describing Your Data QMIS 120 Dr. Mohammad Zainal Chapter Goals After completing this
Collecting, Displaying, and Analyzing Data
 Collecting, Displaying, and Analyzing Data Solutions Key Are You Ready? 1. 3 1 5 1 4 1 7 4 5 19 4 5 4 3 4 5 4.75 3.. 1 1.7 1 1.8 5 5.7 3 3 5 1.9 5. 87, 10, 103, 104, 105, 118 6. 19, 4, 33, 56, 65, 76,
Unit 8, Activity 1, Vocabulary Self-Awareness Chart
 Unit 8, Activity 1, Vocabulary Self-Awareness Chart Vocabulary Self-Awareness Chart WORD +? EXAMPLE DEFINITION Central Tendency Mean Median Mode Range Quartile Interquartile Range Standard deviation Stem
Chapter 10. Definition: Categorical Variables. Graphs, Good and Bad. Distribution
 Chapter 10 Graphs, Good and Bad Chapter 10 3 Distribution Definition: Tells what values a variable takes and how often it takes these values Can be a table, graph, or function Categorical Variables Places
Exam #1. Good luck! Page 1 of 7
 Exam # Total: 00 points Date: July, 008 Time: :00 :0 You have hour and 0 minutes to finish the exam. Please read the question carefully and assign your time smartly. Please PRINIT your name on each page
Descriptive Statistics II. Graphical summary of the distribution of a numerical variable. Boxplot
 MAT 2379 (Spring 2012) Descriptive Statistics II Graphical summary of the distribution of a numerical variable We will present two types of graphs that can be used to describe the distribution of a numerical
GCSE MATHEMATICS 43601H. Higher Tier Unit 1 Statistics and Number. Morning. (JUN H01) WMP/Jun16/E4
 WMP/Jun16/E4") Please write clearly in block capitals. Centre number Candidate number Surname Forename(s) Candidate signature GCSE H MATHEMATICS Higher Tier Unit 1 Statistics and Number Thursday 26 May 2016 Materials
Please write clearly in block capitals. Centre number Candidate number Surname Forename(s) Candidate signature GCSE H MATHEMATICS Higher Tier Unit 1 Statistics and Number Thursday 26 May 2016 Materials
2. The value of the middle term in a ranked data set is called: A) the mean B) the standard deviation C) the mode D) the median
 the mean B) the standard deviation C) the mode D) the median") 1. An outlier is a value that is: A) very small or very large relative to the majority of the values in a data set B) either 100 units smaller or 100 units larger relative to the majority of the values
1. An outlier is a value that is: A) very small or very large relative to the majority of the values in a data set B) either 100 units smaller or 100 units larger relative to the majority of the values
MATH 166 Exam II Sample Questions Use the histogram below to answer Questions 1-2: (NOTE: All heights are multiples of.05) 1. What is P (X 1)?
 1. What is P (X 1)?") MATH 166 Exam II Sample Questions Use the histogram below to answer Questions 1-2: (NOTE: All heights are multiples of.05) 1. What is P (X 1)? (a) 0.00525 (b) 0.0525 (c) 0.4 (d) 0.5 (e) 0.6 2. What is
MATH 166 Exam II Sample Questions Use the histogram below to answer Questions 1-2: (NOTE: All heights are multiples of.05) 1. What is P (X 1)? (a) 0.00525 (b) 0.0525 (c) 0.4 (d) 0.5 (e) 0.6 2. What is
STK110. Chapter 2: Tabular and Graphical Methods Lecture 1 of 2. ritakeller.com. mathspig.wordpress.com
 STK110 Chapter 2: Tabular and Graphical Methods Lecture 1 of 2 ritakeller.com mathspig.wordpress.com Frequency distribution Example Data from a sample of 50 soft drink purchases Frequency Distribution
MA 180/418 Midterm Test 1, Version B Fall 2011
 MA 80/48 Midterm Test, Version B Fall 20 Student Name (PRINT):............................................. Student Signature:................................................... The test consists of 0
Going back to the definition of Biostatistics. Organizing and Presenting Data. Learning Objectives. Nominal Data 10/10/2016. Tabulation and Graphs
 1/1/1 Organizing and Presenting Data Tabulation and Graphs Introduction to Biostatistics Haleema Masud Going back to the definition of Biostatistics The collection, organization, summarization, analysis,
Algebra II- Chapter 12- Test Review
 Sections: Counting Principle Permutations Combinations Probability Name Choose the letter of the term that best matches each statement or phrase. 1. An illustration used to show the total number of A.
(Notice that the mean doesn t have to be a whole number and isn t normally part of the original set of data.)
") One-Variable Statistics Descriptive statistics that analyze one characteristic of one sample Where s the middle? How spread out is it? Where do different pieces of data compare? To find 1-variable statistics
One-Variable Statistics Descriptive statistics that analyze one characteristic of one sample Where s the middle? How spread out is it? Where do different pieces of data compare? To find 1-variable statistics
University of Connecticut Department of Mathematics
 University of Connecticut Department of Mathematics Math 1070 Sample Exam 2 Fall 2014 Name: Instructor Name: Section: Exam 2 will cover Sections 4.6-4.7, 5.3-5.4, 6.1-6.4, and F.1-F.3. This sample exam
10/13/2016 QUESTIONS ON THE HOMEWORK, JUST ASK AND YOU WILL BE REWARDED THE ANSWER
 QUESTIONS ON THE HOMEWORK, JUST ASK AND YOU WILL BE REWARDED THE ANSWER 1 2 3 CONTINUING WITH DESCRIPTIVE STATS 6E,6F,6G,6H,6I MEASURING THE SPREAD OF DATA: 6F othink about this example: Suppose you are
Revision Pack. Edexcel GCSE Maths (1 9) Statistics. Edited by: K V Kumaran
 Statistics. Edited by: K V Kumaran") Edexcel GCSE Maths (1 9) Revision Pack Statistics Edited by: K V Kumaran kvkumaran@gmail.com 07961319548 www.kumarmaths.weebly.com kumarmaths.weebly.com 1 Q1. The cumulative frequency graphs give information
Edexcel GCSE Maths (1 9) Revision Pack Statistics Edited by: K V Kumaran kvkumaran@gmail.com 07961319548 www.kumarmaths.weebly.com kumarmaths.weebly.com 1 Q1. The cumulative frequency graphs give information
Mathematics (Project Maths)
") 2010. M128 S Coimisiún na Scrúduithe Stáit State Examinations Commission Leaving Certificate Examination Sample Paper Mathematics (Project Maths) Paper 2 Ordinary Level Time: 2 hours, 30 minutes 300 marks
2010. M128 S Coimisiún na Scrúduithe Stáit State Examinations Commission Leaving Certificate Examination Sample Paper Mathematics (Project Maths) Paper 2 Ordinary Level Time: 2 hours, 30 minutes 300 marks
Data About Us Practice Answers
 Investigation Additional Practice. a. The mode is. While the data set is a collection of numbers, there is no welldefined notion of the center for this distribution. So the use of mode as a typical number
0, 0, 0, 0, 0, 0, 0, 1, 1, 1, 1, 2, 2, 2, 2, 2, 2, 2, 3, 3, 3, 3, 4, 5, 8
 Name Date One Variable Statistics Dot Plots Independent Practice 1. The number of boots that 25 students had in their homes in Florida were recorded below: 0, 0, 0, 0, 0, 0, 0, 1, 1, 1, 1, 2, 2, 2, 2,
15,504 15, ! 5!
 Math 33 eview (answers). Suppose that you reach into a bag and randomly select a piece of candy from chocolates, 0 caramels, and peppermints. Find the probability of: a) selecting a chocolate b) selecting
HOMEWORK 3 Due: next class 2/3
 HOMEWORK 3 Due: next class 2/3 1. Suppose the scores on an achievement test follow an approximately symmetric mound-shaped distribution with mean 500, min = 350, and max = 650. Which of the following is
Chapter Test Form A. mean median mode. 187 Holt Algebra 1. Name Date Class. Select the best answer.
 Select the best answer. 1. Use this bar graph to identify how many more candies are blue than red. A 3 B 6 C 9 D 15 Form A 2. Which type of graph would be best for displaying this data? Board Members Opinions
Statistics is the study of the collection, organization, analysis, interpretation and presentation of data.
 Statistics is the study of the collection, organization, analysis, interpretation and presentation of data. What is Data? Data is a collection of facts, such as values or measurements. It can be numbers,
CHAPTER 13A. Normal Distributions
 CHAPTER 13A Normal Distributions SO FAR We always want to plot our data. We make a graph, usually a histogram or a stemplot. We want to look for an overall pattern (shape, center, spread) and for any striking
Mathematics (Project Maths Phase 2)
") 2013. M228 Coimisiún na Scrúduithe Stáit State Examinations Commission Leaving Certificate Examination 2013 Mathematics (Project Maths Phase 2) Paper 2 Ordinary Level Monday 10 June Morning 9:30 12:00
2013. M228 Coimisiún na Scrúduithe Stáit State Examinations Commission Leaving Certificate Examination 2013 Mathematics (Project Maths Phase 2) Paper 2 Ordinary Level Monday 10 June Morning 9:30 12:00
Objectives. Organizing Data. Example 1. Making a Frequency Distribution. Solution
 Lesson 7.2 Objectives Organize data into a frequency distribution. Find the mean using a frequency distribution. Create a histogram from a frequency distribution. Frequency Distributions In Lesson 7.1,
Unit Nine Precalculus Practice Test Probability & Statistics. Name: Period: Date: NON-CALCULATOR SECTION
 Name: Period: Date: NON-CALCULATOR SECTION Vocabulary: Define each word and give an example. 1. discrete mathematics 2. dependent outcomes 3. series Short Answer: 4. Describe when to use a combination.
HPS Scope Sequence Last Revised June SUBJECT: Math GRADE: 7. Michigan Standard (GLCE) Code & Language. What this Standard means:
 Code & Language. What this Standard means:") Number and Numeration MA.7.NS.1 (Apply and extend previous understandings of addition and subtraction to add and subtract rational numbers; represent addition and subtraction on a horizontal or vertical
Number and Numeration MA.7.NS.1 (Apply and extend previous understandings of addition and subtraction to add and subtract rational numbers; represent addition and subtraction on a horizontal or vertical
Mean for population data: x = the sum of all values. N = the population size n = the sample size, µ = the population mean. x = the sample mean
 MEASURE OF CENTRAL TENDENCY MEASURS OF CENTRAL TENDENCY Ungrouped Data Measurement Mean Mean for population data: Mean for sample data: x N x x n where: x = the sum of all values N = the population size
Principles of Graphical Excellence Best Paper: ALAIR April 5 6, 2001 AIR: June 2-5, 2002, Toronto Focus-IR, February 21, 2003
 Anna T. Waggener, Ph.D. Institutional Assessment United States Army War College Principles of Graphical Excellence Best Paper: ALAIR April 5 6, 2001 AIR: June 2-5, 2002, Toronto Focus-IR, February 21,
Displaying Distributions with Graphs
 Displaying Distributions with Graphs Recall that the distribution of a variable indicates two things: (1) What value(s) a variable can take, and (2) how often it takes those values. Example 1: Weights
Mathematics. Pre-Leaving Certificate Examination, Paper 2 Ordinary Level Time: 2 hours, 30 minutes. 300 marks L.19 NAME SCHOOL TEACHER
 L.19 NAME SCHOOL TEACHER Pre-Leaving Certificate Examination, 2016 Name/vers Printed: Checked: To: Updated: Name/vers Complete ( Paper 2 Ordinary Level Time: 2 hours, 30 minutes 300 marks School stamp
Q Scheme Marks AOs. 1a All points correctly plotted. B2 1.1b 2nd Draw and interpret scatter diagrams for bivariate data.
 1a All points correctly plotted. B2 2nd Draw and interpret scatter diagrams for bivariate data. 1b The points lie reasonably close to a straight line (o.e.). 2.4 2nd Draw and interpret scatter diagrams
fpu 1 Vc ?rl C{(Th Exam # 1 June points. Write all work. Name:
 Exam # 1 June 14 48 points. Write all work. Name: fpu 1. (4 points) Identify the data set s level of measurement (nominal, ordi nal. interval, ratio): (A) The number of ice-cubes in a 20 oz. cup. (B) Flavors
Intro to Algebra Guided Notes (Unit 11)
") Intro to Algebra Guided Notes (Unit 11) PA 12-1, 12-2, 12-3, 12-7 Alg 12-2, 12-3, 12-4 NAME 12-1 Stem-and-Leaf Plots Stem-and-Leaf Plot: numerical data are listed in ascending or descending order. The
Intro to Algebra Guided Notes (Unit 11) PA 12-1, 12-2, 12-3, 12-7 Alg 12-2, 12-3, 12-4 NAME 12-1 Stem-and-Leaf Plots Stem-and-Leaf Plot: numerical data are listed in ascending or descending order. The
Chapter 0: Preparing for Advanced Algebra
 Lesson 0-1: Representing Functions Date: Example 1: Locate Coordinates Name the quadrant in which the point is located. Example 2: Identify Domain and Range State the domain and range of each relation.
Business Statistics. Lecture 2: Descriptive Statistical Graphs and Plots
 Business Statistics Lecture 2: Descriptive Statistical Graphs and Plots 1 Goals for this Lecture Graphical descriptive statistics Histograms (and bar charts) Boxplots Scatterplots Time series plots Mosaic
Data Analysis. (1) Page #16 34 Column, Column (Skip part B), and #57 (A S/S)
 Page #16 34 Column, Column (Skip part B), and #57 (A S/S)") H Algebra 2/Trig Unit 9 Notes Packet Name: Period: # Data Analysis (1) Page 663 664 #16 34 Column, 45 54 Column (Skip part B), and #57 (A S/S) (2) Page 663 664 #17 32 Column, 46 56 Column (Skip part B),
H Algebra 2/Trig Unit 9 Notes Packet Name: Period: # Data Analysis (1) Page 663 664 #16 34 Column, 45 54 Column (Skip part B), and #57 (A S/S) (2) Page 663 664 #17 32 Column, 46 56 Column (Skip part B),
Sheffield United FC Gender Pay Gap 2017
 Sheffield United FC Gender Pay Gap 2017 SHEFFIELD UNITED Sheffield United Football Club is wholly committed to providing equal opportunities and encouragement for all within our industry. The Club adheres
Coordinate Algebra 1 Common Core Diagnostic Test 1. about 1 hour and 30 minutes for Justin to arrive at work. His car travels about 30 miles per
 1. When Justin goes to work, he drives at an average speed of 55 miles per hour. It takes about 1 hour and 30 minutes for Justin to arrive at work. His car travels about 30 miles per gallon of gas. If
TJP TOP TIPS FOR IGCSE STATS & PROBABILITY
 TJP TOP TIPS FOR IGCSE STATS & PROBABILITY Dr T J Price, 2011 First, some important words; know what they mean (get someone to test you): Mean the sum of the data values divided by the number of items.
Probability WS 1 Counting , , , a)625 b)1050c) a)20358,520 b) 1716 c) 55,770
625 b)1050c) a)20358,520 b) 1716 c) 55,770") Probability WS 1 Counting 1.28 2.13,800 3.5832 4.30 5.. 15 7.72 8.33, 5 11. 15,504 12. a)25 b)1050c)2275 13. a)20358,520 b) 171 c) 55,770 d) 12,271,512e) 1128 f) 17 14. 438 15. 2,000 1. 11,700 17. 220,
Probability WS 1 Counting 1.28 2.13,800 3.5832 4.30 5.. 15 7.72 8.33, 5 11. 15,504 12. a)25 b)1050c)2275 13. a)20358,520 b) 171 c) 55,770 d) 12,271,512e) 1128 f) 17 14. 438 15. 2,000 1. 11,700 17. 220,
Describing Data Visually. Describing Data Visually. Describing Data Visually 9/28/12. Applied Statistics in Business & Economics, 4 th edition
 A PowerPoint Presentation Package to Accompany Applied Statistics in Business & Economics, 4 th edition David P. Doane and Lori E. Seward Prepared by Lloyd R. Jaisingh Describing Data Visually Chapter
5. Suppose the points of a scatterplot lie close to the line 3x + 2y = 6. The slope of this line is: A) 3. B) 2/3. C) 3/2. D) 3/2.
 3. B) 2/3. C) 3/2. D) 3/2.") DISCRETE MIDTERM REVIEW 1. An outlier is an individual value that: A) extends the pattern. B) deviates from the pattern. C) determines the strength of the relationship. D) outlines the general form of
DISCRETE MIDTERM REVIEW 1. An outlier is an individual value that: A) extends the pattern. B) deviates from the pattern. C) determines the strength of the relationship. D) outlines the general form of
Lesson 12-1 Stem-and-Leaf Plots Lesson 12-2 Measures of Variation Lesson 12-3 Box-and-Whisker Plots Lesson 12-4 Histograms Lesson 12-5 Selecting an
 Lesson 12-1 Stem-and-Leaf Plots Lesson 12-2 Measures of Variation Lesson 12-3 Box-and-Whisker Plots Lesson 12-4 Histograms Lesson 12-5 Selecting an Appropriate Display Lesson 12-6 Misleading Graphs Lesson
THE ALGEBRA III MIDTERM EXAM REVIEW Name. This review MUST be turned in when you take the midterm exam
 THE ALGEBRA III MIDTERM EXAM REVIEW Name This review MUST be turned in when you take the midterm exam ALG III Midterm Review Solve and graph on a number line. 1. x 6 14. 3x 1 5x 14 3. 4(x 1) (4x 3) Find
DESCRIBING DATA. Frequency Tables, Frequency Distributions, and Graphic Presentation
 DESCRIBING DATA Frequency Tables, Frequency Distributions, and Graphic Presentation Raw Data A raw data is the data obtained before it is being processed or arranged. 2 Example: Raw Score A raw score is
Name: Date: Period: Histogram Worksheet
 Name: Date: Period: Histogram Worksheet 1 5. For the following five histograms, list at least 3 characteristics that describe each histogram (consider symmetric, skewed to left, skewed to right, unimodal,
, x {1, 2, k}, where k > 0. (a) Write down P(X = 2). (1) (b) Show that k = 3. (4) Find E(X). (2) (Total 7 marks)
 Write down P(X = 2). (1) (b) Show that k = 3. (4) Find E(X). (2) (Total 7 marks)") 1. The probability distribution of a discrete random variable X is given by 2 x P(X = x) = 14, x {1, 2, k}, where k > 0. Write down P(X = 2). (1) Show that k = 3. Find E(X). (Total 7 marks) 2. In a game
1. The probability distribution of a discrete random variable X is given by 2 x P(X = x) = 14, x {1, 2, k}, where k > 0. Write down P(X = 2). (1) Show that k = 3. Find E(X). (Total 7 marks) 2. In a game
1. The masses, x grams, of the contents of 25 tins of Brand A anchovies are summarized by x =
 P6.C1_C2.E1.Representation of Data and Probability 1. The masses, x grams, of the contents of 25 tins of Brand A anchovies are summarized by x = 1268.2 and x 2 = 64585.16. Find the mean and variance of
BE540 - Introduction to Biostatistics Computer Illustration. Topic 1 Summarizing Data Software: STATA. A Visit to Yellowstone National Park, USA
 BE540 - Introduction to Biostatistics Computer Illustration Topic 1 Summarizing Data Software: STATA A Visit to Yellowstone National Park, USA Source: Chatterjee, S; Handcock MS and Simonoff JS A Casebook
THE ALGEBRA III MIDTERM EXAM REVIEW Name
 THE ALGEBRA III MIDTERM EXAM REVIEW Name This review MUST be turned in when you take the midterm exam OR you will not be allowed to take the midterm and will receive a ZERO for the exam. ALG III Midterm
Individual 5 th Grade
 5 th Grade Instructions: Problems 1 10 are multiple choice and count towards your team score. Bubble in the letter on your answer sheet. Be sure to erase all mistakes completely. 1. Which of the following
Frequency Distribution and Graphs
 Chapter 2 Frequency Distribution and Graphs 2.1 Organizing Qualitative Data Denition 2.1.1 A categorical frequency distribution lists the number of occurrences for each category of data. Example 2.1.1
Math Mammoth End-of-the-Year Test, Grade 6 South African Version, Answer Key
 Math Mammoth End-of-the-Year Test, Grade 6 South African Version, Answer Key Instructions In order to continue with the Math Mammoth Grade 7 South African Version Complete Worktext, I recommend that the
Question 1. The following set of data gives exam scores in a class of 12 students. a) Sketch a box and whisker plot of the data.
 Sketch a box and whisker plot of the data.") Question 1 The following set of data gives exam scores in a class of 12 students 25, 67, 86, 72, 97, 80, 86, 55, 68, 70, 81, 12 a) Sketch a box and whisker plot of the data. b) Determine the Interquartile
Question 1 The following set of data gives exam scores in a class of 12 students 25, 67, 86, 72, 97, 80, 86, 55, 68, 70, 81, 12 a) Sketch a box and whisker plot of the data. b) Determine the Interquartile
Name: Practice Exam 3B. April 16, 2015
 Department of Mathematics University of Notre Dame Math 10120 Finite Math Spring 2015 Name: Instructors: Garbett & Migliore Practice Exam 3B April 16, 2015 This exam is in two parts on 12 pages and contains
Math 1070 Sample Exam 2
 University of Connecticut Department of Mathematics Math 1070 Sample Exam 2 Exam 2 will cover sections 4.6, 4.7, 5.2, 5.3, 5.4, 6.1, 6.2, 6.3, 6.4, F.1, F.2, F.3 and F.4. This sample exam is intended to
Algebra 2- Statistics and Probability Chapter Review
 Name Block Date Algebra 2- Statistics and Probability Chapter Review Statistics- Calculator Allowed with Applicable Work For exercises 1-4, tell whether the data that can be gathered about each variable
Ace of diamonds. Graphing worksheet
 Ace of diamonds Produce a screen displaying a the Ace of diamonds. 2006 Open University A silver-level, graphing challenge. Reference number SG1 Graphing worksheet Choose one of the following topics and
Frequency Tables, Stem-and-Leaf Plots, and Line Plots
 Practice A Tables, Stem-and-Leaf Plots, and Line Plots The table shows normal monthly temperatures for Tampa, Florida, for each month of the year. Month Normal Monthly Temperatures in Tampa Month January
Core Connections, Course 2 Checkpoint Materials
 Core Connections, Course Checkpoint Materials Notes to Students (and their Teachers) Students master different skills at different speeds. No two students learn exactly the same way at the same time. At
3. A box contains three blue cards and four white cards. Two cards are drawn one at a time.
 MATH 310 FINAL EXAM PRACTICE QUESTIONS solutions 09/2009 A. PROBABILITY The solutions given are not the only method of solving each question. 1. A fair coin was flipped 5 times and landed heads five times.
12.1 The Fundamental Counting Principle and Permutations
 12.1 The Fundamental Counting Principle and Permutations The Fundamental Counting Principle Two Events: If one event can occur in ways and another event can occur in ways then the number of ways both events