Physics. AC Circuits ID: 9525
|
|
|
- Barry Dawson
- 5 years ago
- Views:
Transcription
1 AC Circuits ID: 9525 Time required 45 minutes Activity Overview In this activity, students explore a model of alternating electric current. They observe the effects of varying voltage, angular velocity, frequency, and phase shift on the shape of the waveform. They also calculate the relative phase shift between two waveforms. Finally, they create a model of a three-phase alternating current. Concepts Alternating electric current Mathematical models of alternating electric current Materials To complete this activity, each student will require the following: TI-Nspire technology pen or pencil blank sheet of paper TI-Nspire Applications Graphs & Geometry, Notes Teacher Preparation This activity will give students an introduction to the use of sine curves to model alternating current. Go over how parameters used in a sine function relate to wave properties such as amplitude, frequency, period, and phase. If time allows, you may wish to have students experiment with oscilloscopes and relate their observations to the simulations provided in this activity. The screenshots on pages 2 8 demonstrate expected student results. Refer to the screenshots on pages 9 and 10 for a preview of the student TI-Nspire document (.tns file). To download the.tns file, go to education.ti.com/exchange and enter 9525 in the search box. Classroom Management This activity is designed to be teacher-led with students following along on their handhelds. You may use the following pages to present the material to the class and encourage discussion. Note that the majority of the ideas and concepts are presented only in this document, so you should make sure to cover all the material necessary for students to comprehend the concepts. Students may answer the questions posed in the.tns file using the Notes application or on blank paper. In some cases, these instructions are specific to those students using TI-Nspire handheld devices, but the activity can easily be done using TI-Nspire computer software Texas Instruments Incorporated Page 1


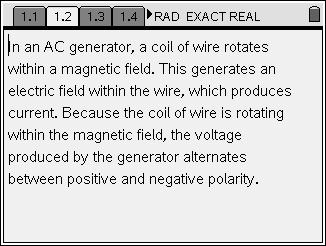
2 The following questions will guide student exploration in this activity: What waveform best models alternating current (AC) electricity? How do peak voltage, angular velocity and frequency of the generator, and phase shift affect the shape of the curve? What equations model these relationships? In the first part of the activity, students explore the equation for a waveform describing the voltage of AC electricity over time. In the second part of the activity, students derive an equation for the phase shift of one waveform relative to another. In the final part of the activity, students use their acquired knowledge to solve a problem involving AC electricity generated by an electrical generator. Problem 1 Manipulation of a basic sine curve Step 1: Students should open the file PhyAct26_ACcircuits_EN.tns and read the first five pages. Page 1.6 contains a sine curve representing the voltage in an alternating current with time. Students should vary the values of Vp, w, and θ and observe the effects on the waveform. Then, they should answer questions 1 3. Q1. What characteristic of the curve does the variable Vp control? A. the amplitude (height) of the curve Q2. What characteristic does the variable w control? A. the distance between successive peaks Q3. What characteristic does the variable θ control? A. the phase shift of the curve (the locations of the maxima and minima along the x-axis) Step 2: Next, students should read the information on pages 1.8 and 1.9. Page 1.10 shows two sine curves. The dotted curve is identical to the curve students manipulated on page 1.6. Students should vary the value of f and observe the effects on the waveform. Then, they should answer questions 4 7. Q4. What characteristic of the curve does the variable f control? A. the frequency of the curve (the distance between successive peaks) 2008 Texas Instruments Incorporated Page 2
3 Q5. Predict the approximate value of f required to produce a sine curve equivalent to the one produced by a generator with an angular velocity of 375. A. Students should use the relationship w = 2πf to determine the required value of f (approximately 59.7 Hz). Q6. Predict the value of w required to produce a sine curve equivalent to one with a frequency of 45 Hz. A. Students should again use the relationship w = 2πf to determine the required value of w (approximately 283). Q7. Use the graphs on pages 1.6 and 1.10 to test your predictions in questions 5 and 6. Were you correct? If not, explain any errors in your reasoning. A. Students should enter their predicted values of w and f into the appropriate simulations and observe how closely the two curves on page 1.10 match. Encourage students to discuss their results. Problem 2 Phase shifts Step 1: Students should read the information on page 2.1 and then move on to page 2.2, which shows waveforms for two different alternating currents. Each of the waveforms is phase shifted relative to the origin. The variable θ represents the phase shift of the solid curve, and the variable θ2 represents the phase shift of the dotted curve. Students should vary the phase shifts of the two curves and observe the results. Then, they should answer questions Q8. Describe the relative positions of the two waves when the phase factors (θ and θ2) differ by 180º. A. When the phase factors are 180º apart, the crest of one curve is exactly aligned with the trough of the other curve Texas Instruments Incorporated Page 3


4 Q9. What positive phase shift is equivalent to a phase shift of 45? A. 315º Q10. What difference between θ and θ2 is required to produce two curves that would sum to zero? A. 180º; if students struggle with this concept, remind them of the rules for adding waves, and encourage them to experiment with various combinations of θ and θ2. Step 2: Next, students should read pages 2.5 and 2.6. Then, they should move to page 2.7, which shows two waveforms that are phase shifted relative to each other. Students will use this simulation to calculate the phase shift of the two curves relative to each other. Step 3: To calculate the relative phase shift, students should first label the coordinates of the three points on page 2.7. They will drag these points along the curves and record their coordinates to calculate the phase shift. To label the coordinates of a point, students should select the Coordinates and Equations tool (Menu > Actions > Coordinates and Equations) and then click once on the point they wish to label. They can then drag the label to wherever they would like on the screen. Encourage them to keep the labels in logical places so that they know which label goes with which point. After they have labeled the coordinates of all three points, students should press d to exit the Coordinates and Equations tool Texas Instruments Incorporated Page 4
5 Step 4: After labeling the three points, students should drag one of the points on the thick curve to a peak of that curve. They should then drag the other point on the thick curve to an adjacent peak on the curve. Finally, they should move the point on the thin curve to the peak closest to the second labeled peak on the thick curve, as shown to the right. Step 5: Next, students should calculate and record the horizontal (x) distance between the two points on the thick curve. They can calculate the distance by subtracting the x-values of the two points. This distance is the period of the waves. (Students should use the absolute value of the difference between the x-values.) Students should use the Text tool (Menu > Actions > Text) to create a text box somewhere on the screen, type the value of the period in the text box, and press. After exiting the Text tool, they should click once on the value they just entered and press h. They should choose Store Var, type the variable name per, and press. Step 6: Next, students should calculate and record the horizontal (x) distance between a peak on the thick curve and the nearest peak on the thin curve. They can calculate this distance by subtracting the x-value of the point on the thin curve from the x-value of the rightmost point on the thick curve. Students should again use the Text tool and the Store Var command to record this value in the variable pdist Texas Instruments Incorporated Page 5
 to determine the value of the equation. To use the Calculate tool, students should click once on the equation they entered.")

6 Step 7: Next, students should use the equation below to calculate the phase shift between the two curves: pdist θrel = i 360 per They should type this equation into a text box somewhere on the screen. They should then use the Calculate tool (Menu > Actions > Calculate) to determine the value of the equation. To use the Calculate tool, students should click once on the equation they entered. They will be prompted to select the values for pdist and per. They should click on each variable to select it. The value of θrel will then be displayed. Then, students should answer questions 11 and 12. Q11. Write the equation describing the relative phase shift of two sine curves. A. The general equation is shown below: distance between peaks relative phase shift = i360 period of one wave Q12. What is the relative phase shift of the two curves on page 2.7? A. approximately 45º; if you wish, you may have students use the simulation on page 2.2 to confirm their results. Problem 3 Construction of a three-phase waveform Step 1: In this problem, students use what they have learned about AC waveforms to construct phase-shifted waveforms with specific characteristics. Students should answer questions Encourage student discussion and interaction Texas Instruments Incorporated Page 6

7 Q13. A three-phase AC generator produces three signals that are phase shifted by 120 relative to one another. The frequency of the generator is 60 Hz, and the peak voltage is 110 V. Graph the signals from this generator on the next page. A. Students should enter three equations in the function line on the Graphs & Geometry application on page 3.2. Each equation should represent one of the AC signals. They should use the equation relating peak voltage, frequency, and phase shift that they derived in problem 2. If necessary, remind students that the phase shift in this equation is the phase shift of the individual waveform relative to the origin. The first equation they enter should have a phase shift of 0º, the second should have a phase shift of 120º, and the third should have a phase shift of 240º. Remind students that they must convert these angles to radians when they enter them into the equation for v(t). Students will also need to adjust the window settings of the graph in order to see the waveforms clearly. An x-range of 0.02 to 0.02 and a y-range of 170 to 170 will produce a reasonably scaled graph Texas Instruments Incorporated Page 7


8 Q14. Use the equation you derived in question 11 to verify that the three curves you graphed are phase shifted by 120 relative to one another. Show your work. A. Students should use the equation shown below for each pair of waveforms to verify the phase shift: distance between peaks relative phase shift = i360 period of one wave Students should place two points on each waveform using the Point On tool and then measure the x-distance between successive peaks, as they did in problem 2, steps 4 and 5. When students place the points on the curves, the coordinates of the points will automatically be displayed. Students may find it easier to hide or delete these coordinates and use the Coordinates and Equations tool to label only the coordinates of the points they are working with at each moment. They should obtain values close to 120º for the relative phase shift between each pair of waveforms. Q15. For a three-phase AC generator, what is the relationship between the separations between peak maxima and the period of the generator? A. The separations between the peak maxima are equally spaced and are equal to one-third the period of the generator Texas Instruments Incorporated Page 8


9 AC Circuits ID: 9525 (Student)TI-Nspire File: PhyAct26_ACcircuits_EN.tns 2008 Texas Instruments Incorporated Page 9


10 2008 Texas Instruments Incorporated Page 10
Getting Started with Algebra 2. Perimeter and Area Models ID: 9837
 Perimeter and Area Models ID: 9837 By Holly Thompson Time required 30 minutes Activity Overview Students will look at data for the perimeter and area changes of a rectangle and triangle as their dimensions
Trigonometric Transformations TEACHER NOTES MATH NSPIRED
 Math Objectives Students will determine the type of function modeled by the height of a capsule on the London Eye observation wheel. Students will translate observational information to use as the parameters
TImath.com. Geometry. Angle Relationships
 Angle Relationships ID: 8670 Time required 45 minutes Activity Overview In this activity, students explore the angle relationships that exist when two lines intersect. They begin by exploring vertical
Algebra/Geometry. Slope/Triangle Area Exploration
 Slope/Triangle Area Exploration ID: Time required 60 minutes Topics: Linear Functions, Triangle Area, Rational Functions Graph lines in slope-intercept form Find the coordinate of the x- and y-intercepts
Algebra/Geometry. Slope/Triangle Area Exploration
 Slope/Triangle Area Exploration ID: 9863 Time required 60 90 minutes Topics: Linear Functions, Triangle Area, Rational Functions Graph lines in slope-intercept form Find the coordinate of the x- and y-intercepts
Exploring the Pythagorean Theorem
 Exploring the Pythagorean Theorem Lesson 11 Mathematics Objectives Students will analyze relationships to develop the Pythagorean Theorem. Students will find missing sides in right triangles using the
Visualizing Equations TEACHER NOTES MATH NSPIRED
 Math Objectives Students will describe what it means to solve a linear equation. Students will recognize how to maintain the equality between two expressions when adding or taking away tiles Vocabulary
Products of Linear Functions
 Math Objectives Students will understand relationships between the horizontal intercepts of two linear functions and the horizontal intercepts of the quadratic function resulting from their product. Students
Investigating the Sine Function
 Grade level: 9-12 Investigating the Sine Function by Marco A. Gonzalez Activity overview In this activity, students will use their Nspire handhelds to discover the different attributes of the graph of
Building 3-D Initials with a Vanishing Point
 Grade level: 9-12 Building 3-D Initials with a Vanishing Point Tallahassee Activity overview Students will use a vanishing point for a one point perspective drawing of the initial of their choice. Concepts
Visualizing Integers TEACHER NOTES MATH NSPIRED. Math Objectives. Vocabulary. About the Lesson. TI-Nspire Navigator System
 Math Objectives Students will identify expressions that balance an equation. Students will find values that satisfy integer equalities. Students will recognize and use the additive inverse property. Students
Math Labs. Activity 1: Rectangles and Rectangular Prisms Using Coordinates. Procedure
 Math Labs Activity 1: Rectangles and Rectangular Prisms Using Coordinates Problem Statement Use the Cartesian coordinate system to draw rectangle ABCD. Use an x-y-z coordinate system to draw a rectangular
TImath.com. Geometry. Scale Factor
 Scale Factor ID: 8299 Time required 45 minutes Activity Overview Students will dilate polygons and find the perimeter and area of both the pre-image and image. Then they find the ratios of the perimeters
TImath.com Calculus. ln(a + h) ln(a) 1. = and verify the Logarithmic Rule for
 ln(a) 1. = and verify the Logarithmic Rule for") The Derivative of Logs ID: 9093 Time required 45 minutes Activity Overview Students will use the graph of the natural logarithm function to estimate the graph of the derivative of this function. They will
The Derivative of Logs ID: 9093 Time required 45 minutes Activity Overview Students will use the graph of the natural logarithm function to estimate the graph of the derivative of this function. They will
Solids Washers /G. TEACHER NOTES MATH NSPIRED. Math Objectives. Vocabulary. About the Lesson. TI-Nspire Navigator System
 Math Objectives Students will be able to visualize the solid generated by revolving the region bounded between two function graphs and the vertical lines x = a and x = b about the x-axis. Students will
Exploring Triangles. Exploring Triangles. Overview. Concepts Understanding area of triangles Relationships of lengths of midsegments
 Exploring Triangles Concepts Understanding area of triangles Relationships of lengths of midsegments of triangles Justifying parallel lines Materials TI-Nspire TI N-spire document Exploring Triangles Overview
Sound Waves and Beats
 Sound Waves and Beats Computer 32 Sound waves consist of a series of air pressure variations. A Microphone diaphragm records these variations by moving in response to the pressure changes. The diaphragm
The Ladder Revisited. by Dr. Irina Lyublinskaya, College of Staten Island, CUNY, NY
 Grade level: 9-1 The Ladder Revisited. by Dr. Irina Lyublinskaya, College of Staten Island, CUNY, NY Activity overview In this activity students explore the locus of mid-point of the hypotenuse of a fixed
Building Concepts: Fractions and Unit Squares
 Lesson Overview This TI-Nspire lesson, essentially a dynamic geoboard, is intended to extend the concept of fraction to unit squares, where the unit fraction b is a portion of the area of a unit square.
AC Circuit Analysis. The Sine Wave CHAPTER 3. This chapter discusses basic concepts in the analysis of AC circuits.
 CHAPTER 3 AC Circuit Analysis This chapter discusses basic concepts in the analysis of AC circuits. The Sine Wave AC circuit analysis usually begins with the mathematical expression for a sine wave: v(t)
Forensics with TI-NspireTM Technology
 Forensics with TI-NspireTM Technology 2013 Texas Instruments Incorporated 1 education.ti.com Case 3 That Tune Science Objectives Identify the musical notes that make up the combination to a safe. Detect
Polar Conics TEACHER NOTES MATH NSPIRED. Math Objectives. Vocabulary. About the Lesson. TI-Nspire Navigator System
 Math Objectives Students will understand that the equations for conics can be expressed in polar form. Students will be able to describe the relationship between eccentricity and the type of conic section.
Building Concepts: Connecting Ratios and Scaling
 Lesson Overview In this TI-Nspire lesson, students investigate ratios and scale factors. Scale factors are ratios that can be used to make a figure smaller or larger, depending on whether the scale factor
Building Concepts: Ratios Within and Between Scaled Shapes
 Lesson Overview In this TI-Nspire lesson, students learn that ratios are connected to geometry in multiple ways. When one figure is an enlarged or reduced copy of another by some scale factor, the ratios
TIalgebra.com Algebra 1
 Perpendicular Slopes ID: 8973 Time required 45 minutes Topic: Linear Functions Graph lines whose slopes are negative reciprocals and measure the angles to verify they are perpendicular. Activity Overview
Topic: Right Triangles & Trigonometric Ratios Calculate the trigonometric ratios for , and triangles.
 Investigating Special Triangles ID: 7896 Time required 45 minutes Activity Overview In this activity, students will investigate the properties of an isosceles triangle. Then students will construct a 30-60
Stay Tuned: Sound Waveform Models
 Stay Tuned: Sound Waveform Models Activity 26 If you throw a rock into a calm pond, the water around the point of entry begins to move up and down, causing ripples to travel outward. If these ripples come
Section 5.2 Graphs of the Sine and Cosine Functions
 A Periodic Function and Its Period Section 5.2 Graphs of the Sine and Cosine Functions A nonconstant function f is said to be periodic if there is a number p > 0 such that f(x + p) = f(x) for all x in
Activity Overview This activity takes the concept of derivative and applies it to various maximum and minimum problems.
 TI-Nspire Activity: Derivatives: Applied Maxima and Minima By: Tony Duncan Activity Overview This activity takes the concept of derivative and applies it to various maximum and minimum problems. Concepts
Graph simple non-linear relations with and without the use of digital technologies and solve simple related equations.
 ACMNA296 7 8 9 10 11 12 TI-Nspire Investigation Student 50 min Objective Graph simple non-linear relations with and without the use of digital technologies and solve simple related equations. Introduction
Forensics with TI-NspireTM Technology
 Forensics with TI-NspireTM Technology 2013 Texas Instruments Incorporated 1 education.ti.com About the Lesson In this activity, students analyze sound waves to calculate the frequency, or pitch, of musical
Bakiss Hiyana binti Abu Bakar JKE, POLISAS BHAB
 1 Bakiss Hiyana binti Abu Bakar JKE, POLISAS 1. Explain AC circuit concept and their analysis using AC circuit law. 2. Apply the knowledge of AC circuit in solving problem related to AC electrical circuit.
Points, Lines, & Slopes (Oh My!)
") About the Lesson In this activity students will explore the relationship among coordinates of points and locations on the coordinate plane, the relationships of lines with their equations, slopes and y-intercepts,
About the Lesson In this activity students will explore the relationship among coordinates of points and locations on the coordinate plane, the relationships of lines with their equations, slopes and y-intercepts,
Stay Tuned: Sound Waveform Models
 Stay Tuned: Sound Waveform Models Activity 24 If you throw a rock into a calm pond, the water around the point of entry begins to move up and down, causing ripples to travel outward. If these ripples come
THE SINUSOIDAL WAVEFORM
 Chapter 11 THE SINUSOIDAL WAVEFORM The sinusoidal waveform or sine wave is the fundamental type of alternating current (ac) and alternating voltage. It is also referred to as a sinusoidal wave or, simply,
EXPLORING POLAR COORDINATES WITH THE GEOMETER S SKETCHPAD
 EXPLORING POLAR COORDINATES WITH THE GEOMETER S SKETCHPAD Barbara K. D Ambrosia Carl R. Spitznagel John Carroll University Department of Mathematics and Computer Science Cleveland, OH 44118 bdambrosia@jcu.edu
5.1 Graphing Sine and Cosine Functions.notebook. Chapter 5: Trigonometric Functions and Graphs
 Chapter 5: Trigonometric Functions and Graphs 1 Chapter 5 5.1 Graphing Sine and Cosine Functions Pages 222 237 Complete the following table using your calculator. Round answers to the nearest tenth. 2
LRC Circuit PHYS 296 Your name Lab section
 LRC Circuit PHYS 296 Your name Lab section PRE-LAB QUIZZES 1. What will we investigate in this lab? 2. Figure 1 on the following page shows an LRC circuit with the resistor of 1 Ω, the capacitor of 33
LabVIEW Day 2: Other loops, Other graphs
 LabVIEW Day 2: Other loops, Other graphs Vern Lindberg From now on, I will not include the Programming to indicate paths to icons for the block diagram. I assume you will be getting comfortable with the
Experiment 8: An AC Circuit
 Experiment 8: An AC Circuit PART ONE: AC Voltages. Set up this circuit. Use R = 500 Ω, L = 5.0 mh and C =.01 μf. A signal generator built into the interface provides the emf to run the circuit from Output
I = I 0 cos 2 θ (1.1)
") Chapter 1 Faraday Rotation Experiment objectives: Observe the Faraday Effect, the rotation of a light wave s polarization vector in a material with a magnetic field directed along the wave s direction.
Chapter 1 Faraday Rotation Experiment objectives: Observe the Faraday Effect, the rotation of a light wave s polarization vector in a material with a magnetic field directed along the wave s direction.
Properties of Magnetism
 Science Objectives Students will describe the magnetic field around an electromagnet. Students will relate the strength of a solenoid-type electromagnet to the number of turns of a wire on the electromagnet.
Magnitude and Phase Measurements. Analog Discovery
 Magnitude and Phase Measurements Analog Discovery Set up the oscilloscope to measure the signal of the reference voltage (the input voltage from the arbitrary function generator, in this case) and the
Integrators, differentiators, and simple filters
 BEE 233 Laboratory-4 Integrators, differentiators, and simple filters 1. Objectives Analyze and measure characteristics of circuits built with opamps. Design and test circuits with opamps. Plot gain vs.
Slope as Rate TEACHER NOTES
 Math Objectives Students will be able to interpret the slope of a line as the rate of change of the y-coordinate per unit increase in the x-coordinate as one moves from left to right along the line. Students
Page 21 GRAPHING OBJECTIVES:
 Page 21 GRAPHING OBJECTIVES: 1. To learn how to present data in graphical form manually (paper-and-pencil) and using computer software. 2. To learn how to interpret graphical data by, a. determining the
Getting Started with. Math & Science Learning Technology
 Getting Started with Math & Science Learning Technology Important notice regarding book materials Texas Instruments makes no warranty, either expressed or implied, including but not limited to any implied
Aliasing. Consider an analog sinusoid, representing perhaps a carrier in a radio communications system,
 Aliasing Digital spectrum analyzers work differently than analog spectrum analyzers. If you place an analog sinusoid at the input to an analog spectrum analyzer and if the frequency range displayed by
I look forward to seeing you on August 24!!
 AP Physics 1 Summer Assignment Packet Welcome to AP Physics 1! Your summer assignment is below. You are to complete the entire packet and bring it with you on the first day of school (Monday August 24,
Pre-Calculus TI-Nspire Exponentials & Logarithms
 Exponentialis ~ Logarithmus by Suzanne Moyers Time required 45-55 minutes Activity Overview In this story-style activity, students work through a step-by-step review of solving exponential equations using
Sound synthesis with Pure Data
 Sound synthesis with Pure Data 1. Start Pure Data from the programs menu in classroom TC307. You should get the following window: The DSP check box switches sound output on and off. Getting sound out First,
Perfect Shuffles TEACHER NOTES MATH NSPIRED. Math Objectives. Vocabulary. About the Lesson. TI-Nspire Navigator System
 Math Objectives Students will create a piecewise linear function to model a method for shuffling a deck of cards. Students will apply composite functions to represent two or more shuffles of a deck. Students
One of the classes that I have taught over the past few years is a technology course for
 Trigonometric Functions through Right Triangle Similarities Todd O. Moyer, Towson University Abstract: This article presents an introduction to the trigonometric functions tangent, cosecant, secant, and
TImath.com. Geometry. Perspective Drawings
 Perspective Drawings ID: 9424 Time required 35 minutes Activity Overview In this activity, students draw figures in one- and two-point perspective and compare and contrast the two types of drawings. They
TEACHER NOTES MIDDLE GRADES SCIENCE NSPIRED
 Science Objectives Students will explore an animation of particle flow in a battery. Students will vary the electron flow in a DC circuit with a battery of varying voltages and one, two, and three resistors.
AC Theory and Electronics
 AC Theory and Electronics An Alternating Current (AC) or Voltage is one whose amplitude is not constant, but varies with time about some mean position (value). Some examples of AC variation are shown below:
Objective: Use the addition of adjacent angle measures to solve problems using a symbol for the unknown angle measure.
 Lesson 10 Objective: Use the addition of adjacent angle measures to solve problems using a Suggested Lesson Structure Fluency Practice Application Problem Concept Development Student Debrief Total Time
Lesson 17. Student Outcomes. Lesson Notes. Classwork. Example 1 (5 10 minutes): Predicting the Pattern in the Residual Plot
: Predicting the Pattern in the Residual Plot") Student Outcomes Students use a graphing calculator to construct the residual plot for a given data set. Students use a residual plot as an indication of whether the model used to describe the relationship
Student Outcomes Students use a graphing calculator to construct the residual plot for a given data set. Students use a residual plot as an indication of whether the model used to describe the relationship
DC and AC Circuits. Objective. Theory. 1. Direct Current (DC) R-C Circuit
 R-C Circuit") [International Campus Lab] Objective Determine the behavior of resistors, capacitors, and inductors in DC and AC circuits. Theory ----------------------------- Reference -------------------------- Young
[International Campus Lab] Objective Determine the behavior of resistors, capacitors, and inductors in DC and AC circuits. Theory ----------------------------- Reference -------------------------- Young
How to Graph Trigonometric Functions
 How to Graph Trigonometric Functions This handout includes instructions for graphing processes of basic, amplitude shifts, horizontal shifts, and vertical shifts of trigonometric functions. The Unit Circle
Introduction to Simulink
 EE 460 Introduction to Communication Systems MATLAB Tutorial #3 Introduction to Simulink This tutorial provides an overview of Simulink. It also describes the use of the FFT Scope and the filter design
Chapter 6 Title Blocks
 Chapter 6 Title Blocks In previous exercises, every drawing started by creating a number of layers. This is time consuming and unnecessary. In this exercise, we will start a drawing by defining layers
AreaSketch Pro Overview for ClickForms Users
 AreaSketch Pro Overview for ClickForms Users Designed for Real Property Specialist Designed specifically for field professionals required to draw an accurate sketch and calculate the area and perimeter
Precalculus ~ Review Sheet
 Period: Date: Precalculus ~ Review Sheet 4.4-4.5 Multiple Choice 1. The screen below shows the graph of a sound recorded on an oscilloscope. What is the period and the amplitude? (Each unit on the t-axis
Lenses and Light TEACHER NOTES SCIENCE NSPIRED. Science Objectives. Vocabulary. About the Lesson. TI-Nspire Navigator. Activity Materials
 Science Objectives Students will explore the direction of light rays through concave and convex lenses. Students will determine the affect the focal points have on light rays leaving a lens. Students will
Algebra 2/Trigonometry Review Sessions 1 & 2: Trigonometry Mega-Session. The Unit Circle
 Algebra /Trigonometry Review Sessions 1 & : Trigonometry Mega-Session Trigonometry (Definition) - The branch of mathematics that deals with the relationships between the sides and the angles of triangles
Wondering About Waves
 Science Objectives Students will explore and compare the properties of standing waves and an electromagnetic wave. Students will observe different resonant frequencies of a standing wave on a spring. Vocabulary
Name: Lab Partner: Section:
 Chapter 11 Wave Phenomena Name: Lab Partner: Section: 11.1 Purpose Wave phenomena using sound waves will be explored in this experiment. Standing waves and beats will be examined. The speed of sound will
Time-Varying Signals
 Time-Varying Signals Objective This lab gives a practical introduction to signals that varies with time using the components such as: 1. Arbitrary Function Generator 2. Oscilloscopes The grounding issues
Secondary Math Amplitude, Midline, and Period of Waves
 Secondary Math 3 7-6 Amplitude, Midline, and Period of Waves Warm UP Complete the unit circle from memory the best you can: 1. Fill in the degrees 2. Fill in the radians 3. Fill in the coordinates in the
What are the chances?
 What are the chances? Student Worksheet 7 8 9 10 11 12 TI-Nspire Investigation Student 90 min Introduction In probability, we often look at likelihood of events that are influenced by chance. Consider
INTRODUCTION TO AGILENT VEE
 INTRODUCTION TO AGILENT VEE I. Introduction The Agilent Visual Engineering Environment (VEE) is a graphical data flow programming language from Agilent Technologies (Keysight) for automated test, measurement,
Graphing Techniques. Figure 1. c 2011 Advanced Instructional Systems, Inc. and the University of North Carolina 1
 Graphing Techniques The construction of graphs is a very important technique in experimental physics. Graphs provide a compact and efficient way of displaying the functional relationship between two experimental
Building Concepts: Visualizing Quadratic Expressions
 Building Concepts: Visualizing Quadratic Epressions Lesson Overview In this TI-Nspire lesson, students manipulate geometric figures to eplore equivalent epressions that can be epressed in the form b c
Student Exploration: Quadratics in Factored Form
 Name: Date: Student Exploration: Quadratics in Factored Form Vocabulary: factored form of a quadratic function, linear factor, parabola, polynomial, quadratic function, root of an equation, vertex of a
Graphs of Reciprocals
 Graphs of Reciprocals The reciprocal of a number is divided by that number So the reciprocal of 3 is 3 5 The reciprocal of is 5 5 The only number that cannot have a reciprocal is 0 Dividing by zero is
Alternating voltages and currents
 Alternating voltages and currents Introduction - Electricity is produced by generators at power stations and then distributed by a vast network of transmission lines (called the National Grid system) to
Exercise 2-6. Target Bearing Estimation EXERCISE OBJECTIVE
 Exercise 2-6 EXERCISE OBJECTIVE When you have completed this exercise, you will be able to evaluate the position of the target relative to a selected beam using the A-scope display. You will be able to
MTH 1825 Sample Exam 4 Fall 2014
 Name (print) Section Signature PID Instructions: Please check to make sure your exam has all 8 pages (including cover) before you begin. Please read the following instructions carefully. 1. DO NOT OPEN
3. Use your unit circle and fill in the exact values of the cosine function for each of the following angles (measured in radians).
.") Graphing Sine and Cosine Functions Desmos Activity 1. Use your unit circle and fill in the exact values of the sine function for each of the following angles (measured in radians). sin 0 sin π 2 sin π
Graphing Sine and Cosine Functions Desmos Activity 1. Use your unit circle and fill in the exact values of the sine function for each of the following angles (measured in radians). sin 0 sin π 2 sin π
Experiment 2: Electronic Enhancement of S/N and Boxcar Filtering
 Experiment 2: Electronic Enhancement of S/N and Boxcar Filtering Synopsis: A simple waveform generator will apply a triangular voltage ramp through an R/C circuit. A storage digital oscilloscope, or an
Graphing Sine and Cosine
 The problem with average monthly temperatures on the preview worksheet is an example of a periodic function. Periodic functions are defined on p.254 Periodic functions repeat themselves each period. The
Worksheet for Exploration 31.1: Amplitude, Frequency and Phase Shift
 Worksheet for Exploration 31.1: Amplitude, Frequency and Phase Shift We characterize the voltage (or current) in AC circuits in terms of the amplitude, frequency (period) and phase. The sinusoidal voltage
LABORATORY 3: Transient circuits, RC, RL step responses, 2 nd Order Circuits
 LABORATORY 3: Transient circuits, RC, RL step responses, nd Order Circuits Note: If your partner is no longer in the class, please talk to the instructor. Material covered: RC circuits Integrators Differentiators
5 Day Unit Plan. Algebra/Grade 9. JenniferJohnston
 5 Day Unit Plan Algebra/Grade 9 JenniferJohnston Geometer s Sketchpad Graph Explorer Algebra I TI-83 Plus Topics in Algebra Application Transform Application Overall Objectives Students will use a variety
Introduction. Chapter Time-Varying Signals
 Chapter 1 1.1 Time-Varying Signals Time-varying signals are commonly observed in the laboratory as well as many other applied settings. Consider, for example, the voltage level that is present at a specific
CHAPTER 14 ALTERNATING VOLTAGES AND CURRENTS
 CHAPTER 4 ALTERNATING VOLTAGES AND CURRENTS Exercise 77, Page 28. Determine the periodic time for the following frequencies: (a) 2.5 Hz (b) 00 Hz (c) 40 khz (a) Periodic time, T = = 0.4 s f 2.5 (b) Periodic
Understanding Projection Systems
 Understanding Projection Systems A Point: A point has no dimensions, a theoretical location that has neither length, width nor height. A point shows an exact location in space. It is important to understand
Lab 8 - INTRODUCTION TO AC CURRENTS AND VOLTAGES
 08-1 Name Date Partners ab 8 - INTRODUCTION TO AC CURRENTS AND VOTAGES OBJECTIVES To understand the meanings of amplitude, frequency, phase, reactance, and impedance in AC circuits. To observe the behavior
PHYSICS LAB. Sound. Date: GRADE: PHYSICS DEPARTMENT JAMES MADISON UNIVERSITY
 PHYSICS LAB Sound Printed Names: Signatures: Date: Lab Section: Instructor: GRADE: PHYSICS DEPARTMENT JAMES MADISON UNIVERSITY Revision August 2003 Sound Investigations Sound Investigations 78 Part I -
Sonoma State University Department of Engineering Science Spring 2017
 EE 110 Introduction to Engineering & Laboratory Experience Saeid Rahimi, Ph.D. Lab 4 Introduction to AC Measurements (I) AC signals, Function Generators and Oscilloscopes Function Generator (AC) Battery
ENG 100 Lab #2 Passive First-Order Filter Circuits
 ENG 100 Lab #2 Passive First-Order Filter Circuits In Lab #2, you will construct simple 1 st -order RL and RC filter circuits and investigate their frequency responses (amplitude and phase responses).
Speed of Sound in Air
 Speed of Sound in Air OBJECTIVE To explain the condition(s) necessary to achieve resonance in an open tube. To understand how the velocity of sound is affected by air temperature. To determine the speed
Experiment #2: Introduction to Lab Equipment: Function Generator, Oscilloscope, and Multisim
 SCHOOL OF ENGINEERING AND APPLIED SCIENCE DEPARTMENT OF ELECTRICAL AND COMPUTER ENGINEERING ECE 2110: CIRCUIT THEORY LABORATORY Experiment #2: Introduction to Lab Equipment: Function Generator, Oscilloscope,
Experiment P01: Understanding Motion I Distance and Time (Motion Sensor)
") PASCO scientific Physics Lab Manual: P01-1 Experiment P01: Understanding Motion I Distance and Time (Motion Sensor) Concept Time SW Interface Macintosh file Windows file linear motion 30 m 500 or 700 P01
PASCO scientific Physics Lab Manual: P01-1 Experiment P01: Understanding Motion I Distance and Time (Motion Sensor) Concept Time SW Interface Macintosh file Windows file linear motion 30 m 500 or 700 P01
Analytic Geometry/ Trigonometry
 Analytic Geometry/ Trigonometry Course Numbers 1206330, 1211300 Lake County School Curriculum Map Released 2010-2011 Page 1 of 33 PREFACE Teams of Lake County teachers created the curriculum maps in order
Physics B Waves and Sound Name: AP Review. Show your work:
 Physics B Waves and Sound Name: AP Review Mechanical Wave A disturbance that propagates through a medium with little or no net displacement of the particles of the medium. Parts of a Wave Crest: high point
PARCC Grade 4 Mathematics
 PARCC Grade Mathematics Lesson : Performance-Based Assessment Number and Operations-Fractions Fraction Equivalents Rationale Goals Students develop understanding and utilize strategies for comparing and
Excel Tool: Plots of Data Sets
 Excel Tool: Plots of Data Sets Excel makes it very easy for the scientist to visualize a data set. In this assignment, we learn how to produce various plots of data sets. Open a new Excel workbook, and
All activity guides can be found online. Helping Teachers Make A Difference
 Helping Teachers Make A Difference All activity guides can be found online. Feed the Spiders Reproducible Helping Teachers Make A Difference 2014 Really Good Stuff 1-800-366-1920 www.reallygoodstuff.com