Getting Started with Algebra 2. Perimeter and Area Models ID: 9837
|
|
|
- Laurence Webster
- 6 years ago
- Views:
Transcription
1 Perimeter and Area Models ID: 9837 By Holly Thompson Time required 30 minutes Activity Overview Students will look at data for the perimeter and area changes of a rectangle and triangle as their dimensions change. They will find that perimeter and area are modeled by linear and quadratic functions, respectively. Concepts Perimeter and area Linear and quadratic modeling Teacher Preparation This activity can be used in an Algebra 2 class or in a Precalculus class at any point in the class when linear and/or quadratic models are discussed. It could also be used in an Honors Algebra I class where students have done some work with area and perimeter. Students should already be familiar with the general shape of quadratic functions. The screenshots on pages 2 4 demonstrate expected student results. Refer to the screenshots on page 5 for a preview of the student TI-Nspire document (.tns file). To download the student.tns file and student worksheet, go to education.ti.com/exchange and enter 9837 in the quick search box. Classroom Management This activity is intended to be initially teacher-led, followed by students working individually, with a partner, or in small groups. You may use the following pages to present the material to the class and encourage discussion. Students will follow along using their handhelds. Be sure to cover all the material necessary for students total comprehension. The student worksheet Alg2Act18_PerimeterAreaModel_worksheet_EN is intended to guide students through the main ideas of the activity.. It also serves as a place for students to record their answers. Alternatively, you may wish to have the class record their answers on separate sheets of paper, or just use the questions posed to engage a class discussion. TI-Nspire Applications Calculator, Graphs & Geometry, Lists & Spreadsheet, Notes 2008 Texas Instruments Incorporated Page 1

.")
2 Problem 1 A rectangle On page 1.2, students will drag point P to make the rectangle larger, changing its length and width, and therefore changing its perimeter and area as well. After they increase the size of the rectangle, they should view the data on page 1.3, displaying the values of the length, width, perimeter, and area of the rectangle that was collected as they moved point P. As a class, enter the formulas for perimeter and area of a rectangle and point out the formulas in the gray formula cells for Columns C and D (underneath the column title). They can then easily see how the perimeter and area are calculated. The scatter plot on page 1.4 shows the length vs. the perimeter of the rectangle. Discuss as a class which parent function would represent this data. You may wish to have students estimate a linear function for the data. Alternatively, have them graph the equation y = x and then transform the graph to fit the data. If you would like students to use this method, have them use the Text tool (MENU > Actions > Text) to display the equation y=x on the screen. Dragging the equation to the axes will display its graph, which can then be grabbed and dragged accordingly Texas Instruments Incorporated Page 2
 can be designated as the 1st Result Column.")
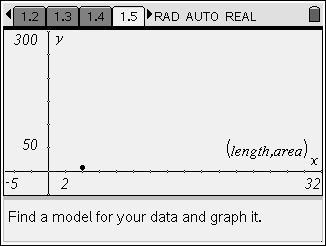
3 Yet another option is to have students perform a regression. Back on page 1.3, students can select MENU > Statistics > Stat Calculations > Linear Regression (mx+b). They should select length for the X List, and perimeter for the Y List. The regression equation can be saved as f1, and Column E (type e[ ]) can be designated as the 1st Result Column. Advancing again to page 1.4, students should press / + G to show the Entry Line, then to access f1(x), and then to graph the regression line. You may wish to have students clean up the regression equation by rounding. The regression equation is approximately y = 3x. A scatter plot showing length vs. area is shown on page 1.5. Again, discuss as a class which parent function would represent this data. As before, you can have students estimate a quadratic function for the data, transform the graph of y = x 2 to fit the data, or perform a quadratic regression. To perform a quadratic regression, return to page 1.3 and select MENU > Statistics > Stat Calculations > Quadratic Regression. Choose length for the X List and area for the Y List. Save the regression equation as f2, and set the first results column as g[ ]. On page 1.5, have students graph the regression equation as before and clean up the equation by rounding. The regression equation is approximately y = 0.5x Texas Instruments Incorporated Page 3

, the values for perimeter and area are collected from the diagram rather than")
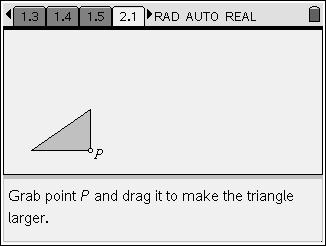
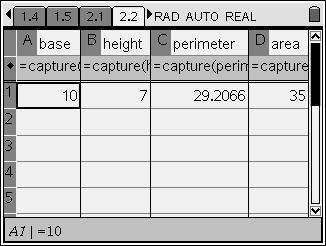
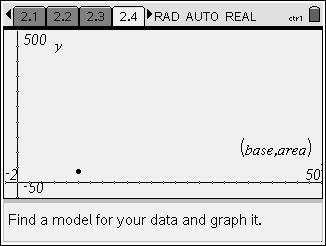
4 Problem 2 A triangle For Problem 2, students will complete the same investigation using measurements from a triangle rather than a rectangle. This will enable them to see that perimeter is linear and area is quadratic, even if the shape of the figure is changed. If students are confident with how they completed the last problem, they could work on this problem in groups. Note: To ensure that each column will have the same number of entries (necessary for creating the scatter plot), the values for perimeter and area are collected from the diagram rather than calculated in the spreadsheet. On page 2.2, have students perform a linear regression to find the equation that models the scatter plot (base, perimeter). They should find regression equation is approximately y = 2.6x + 3. On page 2.2, students should perform a quadratic regression to find that an approximate model for the data (base, area) is y = 0.25x 2 + x. After students complete the above tasks, discuss as a class how the models can be useful and why perimeter is linear and area is quadratic. (Perimeter is one-dimensional and area is two-dimensional.) 2008 Texas Instruments Incorporated Page 4


5 Perimeter and Area Models ID: 9837 (Student)TI-Nspire File: Alg2Act18_PerimeterAreaModel_EN.tns 2008 Texas Instruments Incorporated Page 5
Algebra/Geometry. Slope/Triangle Area Exploration
 Slope/Triangle Area Exploration ID: Time required 60 minutes Topics: Linear Functions, Triangle Area, Rational Functions Graph lines in slope-intercept form Find the coordinate of the x- and y-intercepts
Algebra/Geometry. Slope/Triangle Area Exploration
 Slope/Triangle Area Exploration ID: 9863 Time required 60 90 minutes Topics: Linear Functions, Triangle Area, Rational Functions Graph lines in slope-intercept form Find the coordinate of the x- and y-intercepts
TImath.com. Geometry. Scale Factor
 Scale Factor ID: 8299 Time required 45 minutes Activity Overview Students will dilate polygons and find the perimeter and area of both the pre-image and image. Then they find the ratios of the perimeters
Physics. AC Circuits ID: 9525
 AC Circuits ID: 9525 Time required 45 minutes Activity Overview In this activity, students explore a model of alternating electric current. They observe the effects of varying voltage, angular velocity,
The Ladder Revisited. by Dr. Irina Lyublinskaya, College of Staten Island, CUNY, NY
 Grade level: 9-1 The Ladder Revisited. by Dr. Irina Lyublinskaya, College of Staten Island, CUNY, NY Activity overview In this activity students explore the locus of mid-point of the hypotenuse of a fixed
TIalgebra.com Algebra 1
 Perpendicular Slopes ID: 8973 Time required 45 minutes Topic: Linear Functions Graph lines whose slopes are negative reciprocals and measure the angles to verify they are perpendicular. Activity Overview
Rate of Change and Slope by Paul Alves
 Rate of Change and Slope by Paul Alves Activity overview This lesson was designed for the Grade 10 Applied curriculum in Ontario. In that course, students are expected to connect the rate of change of
TImath.com. Geometry. Angle Relationships
 Angle Relationships ID: 8670 Time required 45 minutes Activity Overview In this activity, students explore the angle relationships that exist when two lines intersect. They begin by exploring vertical
Getting Started with. Math & Science Learning Technology
 Getting Started with Math & Science Learning Technology Important notice regarding book materials Texas Instruments makes no warranty, either expressed or implied, including but not limited to any implied
Exploring the Pythagorean Theorem
 Exploring the Pythagorean Theorem Lesson 11 Mathematics Objectives Students will analyze relationships to develop the Pythagorean Theorem. Students will find missing sides in right triangles using the
TImath.com Calculus. ln(a + h) ln(a) 1. = and verify the Logarithmic Rule for
 ln(a) 1. = and verify the Logarithmic Rule for") The Derivative of Logs ID: 9093 Time required 45 minutes Activity Overview Students will use the graph of the natural logarithm function to estimate the graph of the derivative of this function. They will
The Derivative of Logs ID: 9093 Time required 45 minutes Activity Overview Students will use the graph of the natural logarithm function to estimate the graph of the derivative of this function. They will
Exploring Triangles. Exploring Triangles. Overview. Concepts Understanding area of triangles Relationships of lengths of midsegments
 Exploring Triangles Concepts Understanding area of triangles Relationships of lengths of midsegments of triangles Justifying parallel lines Materials TI-Nspire TI N-spire document Exploring Triangles Overview
TImath.com. Geometry. Perspective Drawings
 Perspective Drawings ID: 9424 Time required 35 minutes Activity Overview In this activity, students draw figures in one- and two-point perspective and compare and contrast the two types of drawings. They
Perfect Shuffles TEACHER NOTES MATH NSPIRED. Math Objectives. Vocabulary. About the Lesson. TI-Nspire Navigator System
 Math Objectives Students will create a piecewise linear function to model a method for shuffling a deck of cards. Students will apply composite functions to represent two or more shuffles of a deck. Students
Activity overview. Background. Concepts. Random Rectangles
 by: Bjørn Felsager Grade level: secondary (Years 9-12) Subject: mathematics Time required: 90 minutes Activity overview What variables characterize a rectangle? What kind of relationships exists between
Building Concepts: Ratios Within and Between Scaled Shapes
 Lesson Overview In this TI-Nspire lesson, students learn that ratios are connected to geometry in multiple ways. When one figure is an enlarged or reduced copy of another by some scale factor, the ratios
Building 3-D Initials with a Vanishing Point
 Grade level: 9-12 Building 3-D Initials with a Vanishing Point Tallahassee Activity overview Students will use a vanishing point for a one point perspective drawing of the initial of their choice. Concepts
Investigating the Sine Function
 Grade level: 9-12 Investigating the Sine Function by Marco A. Gonzalez Activity overview In this activity, students will use their Nspire handhelds to discover the different attributes of the graph of
Products of Linear Functions
 Math Objectives Students will understand relationships between the horizontal intercepts of two linear functions and the horizontal intercepts of the quadratic function resulting from their product. Students
Activity Overview This activity takes the concept of derivative and applies it to various maximum and minimum problems.
 TI-Nspire Activity: Derivatives: Applied Maxima and Minima By: Tony Duncan Activity Overview This activity takes the concept of derivative and applies it to various maximum and minimum problems. Concepts
Topic: Right Triangles & Trigonometric Ratios Calculate the trigonometric ratios for , and triangles.
 Investigating Special Triangles ID: 7896 Time required 45 minutes Activity Overview In this activity, students will investigate the properties of an isosceles triangle. Then students will construct a 30-60
Use Linear Regression to Find the Best Line on a Graphing Calculator
 In an earlier technology assignment, you created a scatter plot of the US Student to Teacher Ratio for public schools from the table below. The scatter plot is shown to the right of the table and includes
Student Handout. Dog Pen Problem
 Student Handout Name Problem 1 Launch the Problem Dog Pen Problem A farmer wants to make the largest possible rectangular pen for his dogs. He has 60 feet of fencing. What is the largest area the pen can
Graph simple non-linear relations with and without the use of digital technologies and solve simple related equations.
 ACMNA296 7 8 9 10 11 12 TI-Nspire Investigation Student 50 min Objective Graph simple non-linear relations with and without the use of digital technologies and solve simple related equations. Introduction
2.3 Quick Graphs of Linear Equations
 2.3 Quick Graphs of Linear Equations Algebra III Mr. Niedert Algebra III 2.3 Quick Graphs of Linear Equations Mr. Niedert 1 / 11 Forms of a Line Slope-Intercept Form The slope-intercept form of a linear
Parallelograms. Aim. Equipment. Introduction Setting up the calculations. Teacher Notes
 Teacher Notes 7 8 9 10 11 12 TI-Nspire CAS Investigation Student 30min Aim The aim of this investigation is to learn the formulas for finding the perimeter and area of a parallelogram, and a rhombus, which
Visualizing Equations TEACHER NOTES MATH NSPIRED
 Math Objectives Students will describe what it means to solve a linear equation. Students will recognize how to maintain the equality between two expressions when adding or taking away tiles Vocabulary
Optimization Exploration: The Inscribed Rectangle. Learning Objectives: Materials:
 Optimization Exploration: The Inscribed Rectangle Lesson Information Written by Jonathan Schweig and Shira Sand Subject: Pre-Calculus Calculus Algebra Topic: Functions Overview: Students will explore some
Properties of Magnetism
 Science Objectives Students will describe the magnetic field around an electromagnet. Students will relate the strength of a solenoid-type electromagnet to the number of turns of a wire on the electromagnet.
Math Labs. Activity 1: Rectangles and Rectangular Prisms Using Coordinates. Procedure
 Math Labs Activity 1: Rectangles and Rectangular Prisms Using Coordinates Problem Statement Use the Cartesian coordinate system to draw rectangle ABCD. Use an x-y-z coordinate system to draw a rectangular
5 Day Unit Plan. Algebra/Grade 9. JenniferJohnston
 5 Day Unit Plan Algebra/Grade 9 JenniferJohnston Geometer s Sketchpad Graph Explorer Algebra I TI-83 Plus Topics in Algebra Application Transform Application Overall Objectives Students will use a variety
Selecting the Right Model Studio PC Version
 Name Recitation Selecting the Right Model Studio PC Version We have seen linear and quadratic models for various data sets. However, once one collects data it is not always clear what model to use; that
9/4/2013. Math. Curriculum Council September 5, topics nouns What? rigor verbs How?
 Math Curriculum Council September 5, 2013 Cognitive Change rigor verbs How? Content Change topics nouns What? 1 CHANGES TO STUDENT EXPECTATIONS NEW Standard Change of Grade Level Change of Strand Other
TEACHER NOTES MIDDLE GRADES SCIENCE NSPIRED
 Science Objectives Students will explore an animation of particle flow in a battery. Students will vary the electron flow in a DC circuit with a battery of varying voltages and one, two, and three resistors.
Polar Conics TEACHER NOTES MATH NSPIRED. Math Objectives. Vocabulary. About the Lesson. TI-Nspire Navigator System
 Math Objectives Students will understand that the equations for conics can be expressed in polar form. Students will be able to describe the relationship between eccentricity and the type of conic section.
Gaithersburg Middle School. Honors Geometry. Summer Packet
 Name: Date: Gaithersburg Middle School Honors Geometry Summer Packet Honors Geometry Page 1 Summer, 2013 Dear student, Hooray! Summer vacation is almost here and the start of the new school year is just
National Curriculum Statement: Substitute values into formulas to determine an unknown (ACMNA234)
") Cat and Mouse Teacher Notes 7 8 9 0 2 Aim TI-Nspire CAS Investigation Student 30min The aim of this investigation is to determine positive integer solutions for a game which is represented as a linear
Cat and Mouse Teacher Notes 7 8 9 0 2 Aim TI-Nspire CAS Investigation Student 30min The aim of this investigation is to determine positive integer solutions for a game which is represented as a linear
What is the expected number of rolls to get a Yahtzee?
 Honors Precalculus The Yahtzee Problem Name Bolognese Period A Yahtzee is rolling 5 of the same kind with 5 dice. The five dice are put into a cup and poured out all at once. Matching dice are kept out
Algebra. Teacher s Guide
 Algebra Teacher s Guide WALCH PUBLISHING Table of Contents To the Teacher.......................................................... vi Classroom Management..................................................
Linear, Quadratic and Cubic Function Explorer Teacher Notes
 Introduction LinQuadCubic Explorer Linear, Quadratic and Cubic Function Explorer Teacher Notes The aim of this.tns file is to provide an environment in which students can explore all aspects of linear,
Math 259 Winter Recitation Handout 6: Limits in Two Dimensions
 Math 259 Winter 2009 Recitation Handout 6: its in Two Dimensions As we have discussed in lecture, investigating the behavior of functions with two variables, f(x, y), can be more difficult than functions
Slope as Rate TEACHER NOTES
 Math Objectives Students will be able to interpret the slope of a line as the rate of change of the y-coordinate per unit increase in the x-coordinate as one moves from left to right along the line. Students
Microsoft Excel: Data Analysis & Graphing. College of Engineering Engineering Education Innovation Center
 Microsoft Excel: Data Analysis & Graphing College of Engineering Engineering Education Innovation Center Objectives Use relative, absolute, and mixed cell referencing Identify the types of graphs and their
Solids Washers /G. TEACHER NOTES MATH NSPIRED. Math Objectives. Vocabulary. About the Lesson. TI-Nspire Navigator System
 Math Objectives Students will be able to visualize the solid generated by revolving the region bounded between two function graphs and the vertical lines x = a and x = b about the x-axis. Students will
Visualizing Integers TEACHER NOTES MATH NSPIRED. Math Objectives. Vocabulary. About the Lesson. TI-Nspire Navigator System
 Math Objectives Students will identify expressions that balance an equation. Students will find values that satisfy integer equalities. Students will recognize and use the additive inverse property. Students
Graphs of linear equations will be perfectly straight lines. Why would we say that A and B are not both zero?
 College algebra Linear Functions : Definition, Horizontal and Vertical Lines, Slope, Rate of Change, Slopeintercept Form, Point-slope Form, Parallel and Perpendicular Lines, Linear Regression (sections.3
This tutorial will lead you through step-by-step to make the plot below using Excel.
 GES 131 Making Plots with Excel 1 / 6 This tutorial will lead you through step-by-step to make the plot below using Excel. Number of Non-Student Tickets vs. Student Tickets Y, Number of Non-Student Tickets
Building Concepts: Visualizing Quadratic Expressions
 Building Concepts: Visualizing Quadratic Epressions Lesson Overview In this TI-Nspire lesson, students manipulate geometric figures to eplore equivalent epressions that can be epressed in the form b c
Building Concepts: Fractions and Unit Squares
 Lesson Overview This TI-Nspire lesson, essentially a dynamic geoboard, is intended to extend the concept of fraction to unit squares, where the unit fraction b is a portion of the area of a unit square.
Computer Algebra Systems Activity: Binomial Probability
 Computer Algebra Systems Activity: Binomial Probability Topic: Binomial Probability R. Meisel, April 14, 2009 rollym@vaxxine.com Notes to the Teacher: a) This activity is designed to use the CAS on the
CHM 109 Excel Refresher Exercise adapted from Dr. C. Bender s exercise
 CHM 109 Excel Refresher Exercise adapted from Dr. C. Bender s exercise (1 point) (Also see appendix II: Summary for making spreadsheets and graphs with Excel.) You will use spreadsheets to analyze data
2016 Geometry Honors Summer Packet
 Name: 2016 Geometry Honors Summer Packet This packet is due the first day of school. It will be graded for completion and effort shown. There will be an assessment on these concepts the first week of school.
Simulating Rectangles
 Simulating Rectangles Exploring Mathematics with Fathom Summer Institute Materials: Paper Scissors Try to get rectangles that are different from those you see around you. You can use either an inspector
Pre-Calculus TI-Nspire Exponentials & Logarithms
 Exponentialis ~ Logarithmus by Suzanne Moyers Time required 45-55 minutes Activity Overview In this story-style activity, students work through a step-by-step review of solving exponential equations using
TImath.com. Statistics. Too Many Choices!
 Too Many Choices! ID: 11762 Time required 40 minutes Activity Overview In this activity, students will investigate the fundamental counting principle, permutations, and combinations. They will find the
Data Analysis Part 1: Excel, Log-log, & Semi-log plots
 Data Analysis Part 1: Excel, Log-log, & Semi-log plots Why Excel is useful Excel is a powerful tool used across engineering fields. Organizing data Multiple types: date, text, numbers, currency, etc Sorting
CHM 152 Lab 1: Plotting with Excel updated: May 2011
 CHM 152 Lab 1: Plotting with Excel updated: May 2011 Introduction In this course, many of our labs will involve plotting data. While many students are nerds already quite proficient at using Excel to plot
Decide how many topics you wish to revise at a time (let s say 10)
") 1 Minute Maths for the Higher Exam (grades B, C and D topics*) Too fast for a first-time use but... brilliant for topics you have already understood and want to quickly revise. for the Foundation Exam
1 Minute Maths for the Higher Exam (grades B, C and D topics*) Too fast for a first-time use but... brilliant for topics you have already understood and want to quickly revise. for the Foundation Exam
Points, Lines, & Slopes (Oh My!)
") About the Lesson In this activity students will explore the relationship among coordinates of points and locations on the coordinate plane, the relationships of lines with their equations, slopes and y-intercepts,
About the Lesson In this activity students will explore the relationship among coordinates of points and locations on the coordinate plane, the relationships of lines with their equations, slopes and y-intercepts,
Physics 253 Fundamental Physics Mechanic, September 9, Lab #2 Plotting with Excel: The Air Slide
 1 NORTHERN ILLINOIS UNIVERSITY PHYSICS DEPARTMENT Physics 253 Fundamental Physics Mechanic, September 9, 2010 Lab #2 Plotting with Excel: The Air Slide Lab Write-up Due: Thurs., September 16, 2010 Place
Student Exploration: Quadratics in Factored Form
 Name: Date: Student Exploration: Quadratics in Factored Form Vocabulary: factored form of a quadratic function, linear factor, parabola, polynomial, quadratic function, root of an equation, vertex of a
Worksheets for GCSE Mathematics. Sequences & Patterns. Mr Black's Maths Resources for Teachers Grades 1-9. Algebra
 Worksheets for GCSE Mathematics Sequences & Patterns Mr Black's Maths Resources for Teachers Grades 1-9 Algebra Sequences and Patterns Worksheets Contents Differentiated Independent Learning Worksheets
Chapter 7 Repetitive Change: Cyclic Functions
 Chapter 7 Repetitive Change: Cyclic Functions 7.1 Cycles and Sine Functions Data that is periodic may often be modeled by trigonometric functions. This chapter will help you use Excel to deal with periodic
Appendix 3 - Using A Spreadsheet for Data Analysis
 105 Linear Regression - an Overview Appendix 3 - Using A Spreadsheet for Data Analysis Scientists often choose to seek linear relationships, because they are easiest to understand and to analyze. But,
Mathematics Geometry Grade 6AB
 Mathematics Geometry Grade 6AB It s the Right Thing Subject: Mathematics: Geometry: Ratio and Proportion Level: Grade 7 Abstract: Students will learn the six types of triangles and the characteristics
Fungus Farmers LEAF CUTTING ANTS A C T I V I T Y. Activity Overview. How much leaf do leaf cutter ants chew?
 How much leaf do leaf cutter ants chew? Activity Overview Leaf cutting ants carry away leaf pieces that are up to 30 times their weight. They sometimes carry these pieces 100-200 meters (about 2 football
Actual testimonials from people that have used the survival guide:
 Algebra 1A Unit: Coordinate Plane Assignment Sheet Name: Period: # 1.) Page 206 #1 6 2.) Page 206 #10 26 all 3.) Worksheet (SIF/Standard) 4.) Worksheet (SIF/Standard) 5.) Worksheet (SIF/Standard) 6.) Worksheet
The activity looks at a sequence of growing patterns using sticks and blobs.
 Sticks and Blobs Key words: sequence, term Objectives Solve word problems and investigate in a range of contexts. Generate and describe sequences. Generate terms of a sequence using term-to-term and position-to-term
6.1.2: Graphing Quadratic Equations
 6.1.: Graphing Quadratic Equations 1. Obtain a pair of equations from your teacher.. Press the Zoom button and press 6 (for ZStandard) to set the window to make the max and min on both axes go from 10
Trigonometric Transformations TEACHER NOTES MATH NSPIRED
 Math Objectives Students will determine the type of function modeled by the height of a capsule on the London Eye observation wheel. Students will translate observational information to use as the parameters
GREATER CLARK COUNTY SCHOOLS PACING GUIDE. Grade 4 Mathematics GREATER CLARK COUNTY SCHOOLS
 GREATER CLARK COUNTY SCHOOLS PACING GUIDE Grade 4 Mathematics 2014-2015 GREATER CLARK COUNTY SCHOOLS ANNUAL PACING GUIDE Learning Old Format New Format Q1LC1 4.NBT.1, 4.NBT.2, 4.NBT.3, (4.1.1, 4.1.2,
Sect 4.5 Inequalities Involving Quadratic Function
 71 Sect 4. Inequalities Involving Quadratic Function Objective #0: Solving Inequalities using a graph Use the graph to the right to find the following: Ex. 1 a) Find the intervals where f(x) > 0. b) Find
CLEMSON MIDDLE SCHOOL MATHEMATICS PROJECT UNIT 5: GEOMETRIC RELATIONSHIPS
 CLEMSON MIDDLE SCHOOL MATHEMATICS PROJECT UNIT 5: GEOMETRIC RELATIONSHIPS PROBLEM 1: PERIMETER AND AREA TRAINS Let s define a train as the shape formed by congruent, regular polygons that share a side.
Laboratory 1: Motion in One Dimension
 Phys 131L Spring 2018 Laboratory 1: Motion in One Dimension Classical physics describes the motion of objects with the fundamental goal of tracking the position of an object as time passes. The simplest
Math 165 Section 3.1 Linear Functions
 Math 165 Section 3.1 Linear Functions - complete this page Read the book or the power point presentations for this section. Complete all questions on this page Also complete all questions on page 6 1)
Excel Tool: Plots of Data Sets
 Excel Tool: Plots of Data Sets Excel makes it very easy for the scientist to visualize a data set. In this assignment, we learn how to produce various plots of data sets. Open a new Excel workbook, and
Math 1023 College Algebra Worksheet 1 Name: Prof. Paul Bailey September 22, 2004
 Math 1023 College Algebra Worksheet 1 Name: Prof. Paul Bailey September 22, 2004 Every vertical line can be expressed by a unique equation of the form x = c, where c is a constant. Such lines have undefined
AREA AND PERIMETER RECTANGLE WORKSHEETS ARCHIVE
 29 April, 2018 AREA AND PERIMETER RECTANGLE WORKSHEETS ARCHIVE Document Filetype: PDF 443.87 KB 0 AREA AND PERIMETER RECTANGLE WORKSHEETS ARCHIVE Download free printable worksheets on Finding Perimeter
Geometry. Teacher s Guide
 Geometry Teacher s Guide WALCH PUBLISHING Table of Contents To the Teacher.......................................................... vi Classroom Management..................................................
Lenses and Light TEACHER NOTES SCIENCE NSPIRED. Science Objectives. Vocabulary. About the Lesson. TI-Nspire Navigator. Activity Materials
 Science Objectives Students will explore the direction of light rays through concave and convex lenses. Students will determine the affect the focal points have on light rays leaving a lens. Students will
Aim #35.1: How do we graph using a table?
 A) Take out last night's homework Worksheet - Aim 34.2 B) Copy down tonight's homework Finish aim 35.1 Aim #35.1: How do we graph using a table? C) Plot the following points... a) (-3, 5) b) (4, -2) c)
Building Concepts: Connecting Ratios and Scaling
 Lesson Overview In this TI-Nspire lesson, students investigate ratios and scale factors. Scale factors are ratios that can be used to make a figure smaller or larger, depending on whether the scale factor
Lesson 1 6. Algebra: Variables and Expression. Students will be able to evaluate algebraic expressions.
 Lesson 1 6 Algebra: Variables and Expression Students will be able to evaluate algebraic expressions. P1 Represent and analyze patterns, rules and functions with words, tables, graphs and simple variable
To describe the centre and spread of a univariate data set by way of a 5-figure summary and visually by a box & whisker plot.
 Five Figure Summary Teacher Notes & Answers 7 8 9 10 11 12 TI-Nspire Investigation Student 60 min Aim To describe the centre and spread of a univariate data set by way of a 5-figure summary and visually
ideas with idea packet Transformations are Easier if the Force is with You IMPACT Sponsored by:
 ideas with 2016-2017 IMPACT idea packet Sponsored by: Transformations are Easier if the Force is with You Transformations are Easier if the Force is with You Disseminator: Richard A. Boyd Email: riboyd@dadeschools.net
TAKING A WALK IN THE NEUROSCIENCE LABORATORIES
 TAKING A WALK IN THE NEUROSCIENCE LABORATORIES Instructional Objectives Students will analyze acceleration data and make predictions about velocity and use Riemann sums to find velocity and position. Degree
Volume of Revolution Investigation
 Student Investigation S2 Volume of Revolution Investigation Student Worksheet Name: Setting up your Page In order to take full advantage of Autograph s unique 3D world, we first need to set up our page
Grades 6 8 Innoventure Components That Meet Common Core Mathematics Standards
 Grades 6 8 Innoventure Components That Meet Common Core Mathematics Standards Strand Ratios and Relationships The Number System Expressions and Equations Anchor Standard Understand ratio concepts and use
Write a spreadsheet formula in cell A3 to calculate the next value of h. Formulae
 Hire a coach In this activity you will use Excel to draw line graphs which show the connection between variables in real situations. You will also study how features of the graphs are related to the information
Forensics with TI-NspireTM Technology
 Forensics with TI-NspireTM Technology 2013 Texas Instruments Incorporated 1 education.ti.com Science Objectives Identify counterfeit coins based on the characteristic property of density. Model data using
UNIT 2: RATIONAL NUMBER CONCEPTS WEEK 5: Student Packet
 Name Period Date UNIT 2: RATIONAL NUMBER CONCEPTS WEEK 5: Student Packet 5.1 Fractions: Parts and Wholes Identify the whole and its parts. Find and compare areas of different shapes. Identify congruent
Comparing Across Categories Part of a Series of Tutorials on using Google Sheets to work with data for making charts in Venngage
 Comparing Across Categories Part of a Series of Tutorials on using Google Sheets to work with data for making charts in Venngage These materials are based upon work supported by the National Science Foundation
Geometer s Sketchpad Version 4
 Geometer s Sketchpad Version 4 For PC Name: Date: INVESTIGATION: The Pythagorean Theorem Directions: Use the steps below to lead you through the investigation. After each step, be sure to click in the
Algebra 2. TMT 3 Algebra 2: Student Lesson 2 140
 A.1(B) collect and organize data, make and interpret scatterplots, fit the graph of a function to the data, interpret the results, and proceed to model, predict, and make decisions and critical judgments.
Graphing Exponential Functions Answer Key Algebra 2
 Graphing Answer Key Algebra 2 Free PDF ebook Download: Graphing Answer Key Algebra 2 Download or Read Online ebook graphing exponential functions answer key algebra 2 in PDF Format From The Best User Guide
PART I: Emmett s teacher asked him to analyze the table of values of a quadratic function to find key features. The table of values is shown below:
 Math (L-3a) Learning Targets: I can find the vertex from intercept solutions calculated by quadratic formula. PART I: Emmett s teacher asked him to analyze the table of values of a quadratic function to
Coordinate Algebra 1 Common Core Diagnostic Test 1. about 1 hour and 30 minutes for Justin to arrive at work. His car travels about 30 miles per
 1. When Justin goes to work, he drives at an average speed of 55 miles per hour. It takes about 1 hour and 30 minutes for Justin to arrive at work. His car travels about 30 miles per gallon of gas. If
Mathematics Success Grade 8
 T936 Mathematics Success Grade 8 [OBJECTIVE] The student will find the line of best fit for a scatter plot, interpret the equation and y-intercept of the linear representation, and make predictions based
Class 9 Coordinate Geometry
 ID : in-9-coordinate-geometry [1] Class 9 Coordinate Geometry For more such worksheets visit www.edugain.com Answer the questions (1) Find the coordinates of the point shown in the picture. (2) Find the
Lesson 17. Student Outcomes. Lesson Notes. Classwork. Example 1 (5 10 minutes): Predicting the Pattern in the Residual Plot
: Predicting the Pattern in the Residual Plot") Student Outcomes Students use a graphing calculator to construct the residual plot for a given data set. Students use a residual plot as an indication of whether the model used to describe the relationship
Student Outcomes Students use a graphing calculator to construct the residual plot for a given data set. Students use a residual plot as an indication of whether the model used to describe the relationship