User Reference Manual
|
|
|
- Angelica Newton
- 6 years ago
- Views:
Transcription


1 User Reference Manual IN SITU HYBRIDIZATION QUANTIFICATION (for research purposes only)
2 Contents Overview... 3 System Requirements... 3 Compatible File Formats... 3 Input Parameters... 4 Output Parameters... 7 Histograms... 7 Quantifying Single Probe RNA ISH Slides Quantifying Single Probe SISH & CISH Slides Quantifying Dual Probe SISH & CISH Slides Contact Information... 13
3 Overview The Indica Labs ISH quantification tool is intended for research use only. It can be used to measure SISH, CISH, Dual CISH, or RNA ISH signals in digital microscopic images. The algorithm generates a markup image that is used by the pathologist to assess performance of the algorithm and for algorithm tuning purposes. It also generates quantitative data describing the analyzed regions of tissue. These data include total number of cells, total number of signals, average number of signals per cell, and a histogram which displays the frequency of cells that have 1, 2, 3,4 signals. All output data can be easily exported to an excel file, CSV (comma separated value) file. System Requirements The Indica Labs ISH quantification tool is designed to integrate seamlessly into the Aperio release 11 platform. This software can be installed to run server-side with the Aperio Spectrum software as well as client side within the Aperio ImageScope software. Both ImageScope and Spectrum should be at version 11.0 or later. Compatible File Formats Since this tool can be fully integrated into the Aperio platform it can be used to analyze all image formats that are compatible with Aperio ImageScope and Spectrum. At the time of writing this document, this includes the following image formats: JPG TIFF SVS (Aperio) NDPI (Hamamatsu) MRXS (Zeiss) JP2 CWS (Olympus)
4 Input Parameters This image analysis tool allows the user to fine tune the algorithm to meet the user s specific needs or to improve performance on a specific stain or tissue type. The following section describes each of the input parameters are in detail: Nuclear Stain specifies the optical densities of the RGB color components of the nuclear stain. Default is Haematoxylin. This parameter should consist of three comma separated decimal values each ranging from 0.0 to 1.0. The simplest way to generate these values is to download the free ImageScope EyeDropper Plugin and click on a representative nucleus. The EyeDropper plugin will calculate the RGB OD values for you and copy them to the clipboard. Note, this value is not used if Positive Signal Stain is set to 1.0, 1.0, 1.0 (see below). Positive Signal Stain 1 RNA ISH and CISH assays often identify the signals by staining them with a particular color. This parameter allows you to specify that color by providing comma separated optical densities of the RGB color components of the positive signal stain. Default is DAB. For non-black signals, the simplest way to generate the values for this parameter is to download the free ImageScope EyeDropper Plugin and click on a representative signal to calculate the RGB OD values. Then use the Markup Image parameter to verify the stain separation is working properly. Note, if your positive signals are black (as in SISH), then this value should be set to 1.0,1.0,1.0. Positive Signal Stain 2 For dual probe ISH assays, this value should define the stain for probe 2. Note, it is important that probe 1 and probe 2 are not swapped because the algorithm will calculated the ratios based on the number of probe 1 signals divided by the number of probe 2 signals. Set this value to: o 0.0,0.0,0.0 for single probe ISH. o 1.0,1.0,1.0 for dual probe ISH where probe 2 is black. o X,Y,Z for dual probe ISH where probe 2 is colored. Nuclear Contrast Threshold In order to detect nuclei, the algorithm relies on sufficient contrast between the darker nucleus and the lighter background staining. This value dictates how much contrast is required for nuclear detection. The value ranges from zero to one. Decreasing the value results in fewer nuclei detected, increasing the value results in more. Note, sometimes increasing this value has the unexpected effect of removing nuclei. This occurs because
5 multiple nuclei are joined together and then disqualified because their large size exceeds the Maximum Nuclear Size parameter. Minimum Nuclear Optical Density This parameter allows the user exclude faintly stained objects that are misinterpreted as nuclei. Since nuclei are typically stained darkest with haematoxylin you can set this threshold such that darker objects are true nuclei and lighter objects are not nuclei. The value of this parameter can be a decimal value ranging from 0 (totally white) to 1 (totally black). Values closer to zero will result in more nuclei detected and values closer to 1 will result in only the darkest nuclei being detected. Minimum Nuclear Size This parameter allows the algorithm to exclude objects that are too small in area to be nuclei. The specified value in microns squared should be set to the smallest nucleus size that you d like to detect. Objects smaller than this will not be counted and objects larger than this might be counted. Maximum Nuclear Size This parameter allows the algorithm to exclude objects that are too large in area to be nuclei. The specified value in microns squared should be set to the largest nucleus size that you d like to detect. Objects larger than this will not be counted and objects smaller than this might be counted. Nuclear Segmentation Aggressiveness Oftentimes multiple nuclei can be touching or overlapping resulting in what looks can be mistaken for a single connected object. This tool uses a segmentation algorithm to separate the connected nuclei and this parameter controls the level of segmentation that will occur. It ranges from 0.0 to 1.0. Increasing this value will result in more aggressive segmentation and ultimately a higher number of smaller vacuoles. Cell Radius From Nuclei This parameter allows the user to specify a cytoplasmic region around each nucleus (colored yellow in the markup image). For signal counting purposes, these areas are considered part of the cell. To only count signals within the nucleus, set this value to zero. Signal 1 Contrast Threshold This parameter controls how sensitive the algorithm should be when detecting signals (spots) for probe 1. Decreasing this value will cause will cause more probe 1 signals to be detected, but may result in
6 some false positives. Increasing this value will cause less signals to be detected but may result in false negatives. Signal 2 Contrast Threshold This parameter controls how sensitive the algorithm should be when detecting signals (spots) for probe 2. Decreasing this value will cause will cause more probe 2 signals to be detected, but may result in some false positives. Increasing this value will cause less signals to be detected but may result in false negatives. For single probe applications this parameter is not used. Signal 1 Size Quite often the CISH or SISH signals are tightly clustered and cannot be separated by eye or by computer algorithm. In these situations our software uses patent pending techniques to estimate the total number of signals within a cluster of signals. This value represents the estimated spot size in microns squared. Decreasing this value will cause signal 1 clusters to be counted as more signals and will result in a higher total signal 1 count and increasing this value will cause clusters to be calculated as less signals resulting in a lower total signal 1 count. In order to tune this parameter it is recommended that you create several annotation regions each one around individual cells. Then based on the results you can determine which signals are being counted as individual or multiple and can adjust the spot size as needed. Signal 2 Size Quite often the CISH or SISH signals are tightly clustered and cannot be separated by eye or by computer algorithm. In these situations our software uses patent pending techniques to estimate the total number of signals within a cluster of signals. This value represents the estimated spot size in microns squared for signal 2. Decreasing this value will cause signal 2 clusters to be counted as more signals and will result in a higher total signal 2 count and increasing this value will cause clusters to be calculated as less signals resulting in a lower total signal 2 count. In order to tune this parameter it is recommended that you create several annotation regions each one around individual cells. Then based on the results you can determine which signals are being counted as individual or multiple and can adjust the spot size as needed. Output Image This parameter is useful for verifying the effectiveness of the stain separation. After modifying Nuclear Stain, Positive Signal Stain 1, or Positive Signal Stain 2 be sure to test each of the corresponding output images to be sure they represent the separated stain.
7 Output Parameters This image analysis tool reports a set of results for each distinct analysis region and for the entire digital slide if analyzed. These results include the following output parameters: Total Cell Count total number of nuclei that were detected. Total Signal 1 Count - the total number of copies that were counted for probe 1. Total Signal 2 Count - the total number of copies that were counted for probe 2. Signal1/Signal2 total signal 1 count divided by total signal 2 count. Total Signal 1 Area this value represents the total area (in microns squared) of all counted copies of signal 1. Total Signal 2 Area this value represents the total area (in microns squared) of all counted copies of signal 2. Avg Signal 1 Per Cell this value represents the average number of signal 1 copies in a cell or the Total Signal 1 Count divided by the Total Cell Count. Avg Signal 2 Per Cell this value represents the average number of signal 2 copies in a cell or the Total Signal 2 Count divided by the Total Cell Count. Avg Signal 1 Area Per Cell this value (in microns squared) is the Total Signal 1 Area divided by the Total Cell Count. Avg Signal 1 Area Per Cell this value (in microns squared) is the Total Signal 2 Area divided by the Total Cell Count. Avg Signal 1 Optical Density this value describes how dark (optically dense) the signal 1 stain is within the signal 1 copies. It ranges from 0.0 to 1.0 where larger values are darker and smaller values are lighter. Avg Signal 2 Optical Density this value describes how dark (optically dense) the signal 2 stain is within the signal 2 copies. It ranges from 0.0 to 1.0 where larger values are darker and smaller values are lighter. Histograms This image analysis tool also generates a set of histograms which describe the frequency of cells having certain characteristics. These histograms are:


8 Probe 1 Signals Per Cell Histogram Displays the distribution of cells containing 0, 1, 2, 3, 4 copies of Probe1 Probe 2 Signals Per Cell Histogram Displays the distribution of cells containing 0, 1, 2, 3, 4 copies of Probe 2


9 Signal 1 / Signal 2 Ratio Histogram Displays the distribution of cells containing various ratios of signal 1 / signal 2.
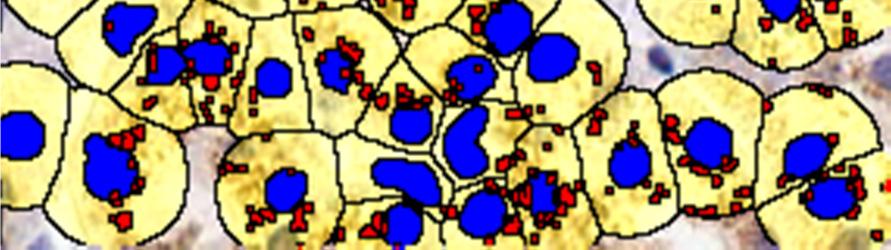
10 Quantifying Single Probe RNA ISH Slides The algorithm can also be tuned to measure and count RNA ISH signals as shown below The blue areas represent the nuclei of cells found by the algorithm, the yellow areas represent the area that s been designated as cytoplasm surrounding the nucleus, and the red areas represent the RNA signals. In order to analyze RNA ISH slides, please note the following suggestions: Specify the nuclear stain and the positive signal stain 1. To simplify this, process, download the Free ImageScope EyeDropper Tool. For single probe applications be sure to unset the positive signal stain 2 (i.e. set it to 0.0,0.0,0.0) If the cell signals fall outside of the nucleus, but you still want to count them on a per cell basis, then adjust the Cell Radius from Nuclei parameter. This will in increase or decrease the size of the yellow areas in the image shown above.
11 Quantifying Single Probe SISH & CISH Slides In the example below, you can see the results of running the algorithm in a small area of a digitized SISH slide. The blue areas represent the nuclei of cells found by the algorithm, and the yellow areas represent the individual signals and red areas represent the clustered signals. Individual signals are counted as 1 copy and clustered signals are counted as two or more according to their size. In order to analyze single probe SISH and CISH slides, please note the following suggestions: Specify the nuclear stain and the positive signal stain 1. To simplify this, process, download the Free ImageScope EyeDropper Tool. Note, since the probe color is typically colorless (black) set the positive signal stain 1 optical densities to 1.0,1.0,1.0. Unset the positive signal stain 2 (i.e. set it to 0.0,0.0,0.0) Since the signals are expected to lie within the cell nuclei you can optionally set Cell Radius from Nuclei to zero so that only signals within the nuclei are counted and the signals from tangentially cut cells are not counted.
 signals and red areas represent the clustered")


12 Quantifying Dual Probe SISH & CISH Slides In the example below, you can see the results of running the algorithm in a small area of a Ventana INFORM Her2 Dual ISH slide. The blue areas represent the nuclei of cells found by the algorithm, and the orange areas represent the individual probe 1 (Her2) signals and red areas represent the clustered Her2 signals. Chr17 is specified as probe 2 and it s individual and clustered signals are colored cyan and green respectively. In order to analyze single probe SISH and CISH slides, please note the following suggestions: Specify the nuclear stain, positive signal stain 1, and positive signal stain 2. To simplify this, process, download the Free ImageScope EyeDropper Tool. Typically for dual CISH, probe 1 will be black, in which case positive signal stain 1 should be set to 1.0,1.0,1.0. Since the signals are expected to lie within the cell nuclei you can optionally set Cell Radius from Nuclei to zero so that only signals within the nuclei are counted and the signals from tangentially cut cells are not counted.
13 Contact Information For technical support and other information, please contact Indica Labs, Inc. Visit: Dial: +1 (505)
Positive Pixel Count Algorithm. User s Guide
 Positive Pixel Count Algorithm User s Guide Copyright 2004, 2006 2008 Aperio Technologies, Inc. Part Number/Revision: MAN 0024, Revision B Date: December 9, 2008 This document applies to software versions
Image Analysis for Fluorescence
 Image Analysis for Fluorescence Terminology Table Image Analysis Macro Colocalization Intensity Dye AFI The extraction of meaningful information from digital images by means of digital image processing
Algorithm User Guide:
 Algorithm User Guide: Positive Pixel Count Use the Aperio algorithms to adjust (tune) the parameters until the quantitative results are sufficiently accurate for the purpose for which you intend to use
Definiens. Tissue Studio 4.2. Tutorial 1: Composer and Nuclear Markers
 Definiens Tissue Studio 4.2 Tutorial 1: Composer and Nuclear Markers Tutorial 1: Composer and Nuclear Markers Imprint and Version Copyright 2015 Definiens AG. All rights reserved. This document may be
ImageJ, A Useful Tool for Image Processing and Analysis Joel B. Sheffield
 ImageJ, A Useful Tool for Image Processing and Analysis Joel B. Sheffield Temple University Dedicated to the memory of Dan H. Moore (1909-2008) Presented at the 2008 meeting of the Microscopy and Microanalytical
MetaXpress Software: Cell Scoring Module
 MetaXpress Software: Cell Scoring Module Cell Scoring Module Overview The Cell Scoring module can be used to analyze cells imaged in 2 wavelengths W1 should be a stain for all nuclei (e.g. DAPI, Hoechst,
Image Viewing. with ImageScope
 Image Viewing with ImageScope ImageScope Components Use ImageScope to View These File Types: ScanScope Virtual Slides.SVS files created when the ScanScope scanner scans glass microscope slides. JPEG files
Light Microscopy. Upon completion of this lecture, the student should be able to:
 Light Light microscopy is based on the interaction of light and tissue components and can be used to study tissue features. Upon completion of this lecture, the student should be able to: 1- Explain the
IncuCyte ZOOM Fluorescent Processing Overview
 IncuCyte ZOOM Fluorescent Processing Overview The IncuCyte ZOOM offers users the ability to acquire HD phase as well as dual wavelength fluorescent images of living cells producing multiplexed data that
ImageJ: Introduction to Image Analysis 3 May 2012 Jacqui Ross
 Biomedical Imaging Research Unit School of Medical Sciences Faculty of Medical and Health Sciences The University of Auckland Private Bag 92019 Auckland 1142, NZ Ph: 373 7599 ext. 87438 http://www.fmhs.auckland.ac.nz/sms/biru/.
Positive Pixel Count Algorithm
 The Pathology Company Positive Pixel Count Algorithm User s Guide MAN-0024, Revision E 1 December 2014 Positive Pixel Count Algorithm User s Guide This document applies to eslide Manager Release 12.2 and
IncuCyte ZOOM Scratch Wound Processing Overview
 IncuCyte ZOOM Scratch Wound Processing Overview The IncuCyte ZOOM Scratch Wound assay utilizes the WoundMaker-IncuCyte ZOOM-ImageLock Plate system to analyze both 2D-migration and 3D-invasion in label-free,
inform ADVANCED IMAGE ANALYSIS SOFTWARE inform User Manual
 inform ADVANCED IMAGE ANALYSIS SOFTWARE inform User Manual Notice The information in this document is subject to change without notice and should not be construed as a commitment by PerkinElmer, Inc. PerkinElmer
IncuCyte ZOOM Scratch Wound Processing Overview
 IncuCyte ZOOM Scratch Wound Processing Overview The IncuCyte ZOOM Scratch Wound assay utilizes the WoundMaker-IncuCyte ZOOM-ImageLock Plate system to analyze both 2D-migration and 3D-invasion in label-free,
Digital Pathology at Johns Hopkins Practical Research and Clinical Considerations
 Digital Pathology at Johns Hopkins Practical Research and Clinical Considerations July 10, 2017 Alexander Baras, MD, PhD Assistant Professor of Pathology, Urology, and Oncology Associate Director of Pathology
Adobe Studio on Adobe Photoshop CS2 Enhance scientific and medical images. 2 Hide the original layer.
 1 Adobe Studio on Adobe Photoshop CS2 Light, shadow and detail interact in wild and mysterious ways in microscopic photography, posing special challenges for the researcher and educator. With Adobe Photoshop
Supplemental Reference Guide
 Supplemental Reference Guide QuantiGene ViewRNA mirna ISH Cell Assay P/N 19167 Rev.A 120623 For research use only. Not for use in diagnostic procedures. Trademarks Affymetrix and, and QuantiGene are trademarks
Image segmentation applied to cytology
 Image segmentation applied to cytology Niels VAN VLIET LRDE seminar, May 14, 2003 Table of contents Table of contents Introduction... 2... 17 [1/4] Extraction of the background...
ImageScope. User s Guide
 ImageScope User s Guide Copyright 2006 2011, Aperio Technologies, Inc. Part Number/Revision: MAN 0001, Revision I Date: 5 January 2011 This document applies to software versions Release 11 and later. All
Introduction to Image Analysis with
 Introduction to Image Analysis with PLEASE ENSURE FIJI IS INSTALLED CORRECTLY! WHAT DO WE HOPE TO ACHIEVE? Specifically, the workshop will cover the following topics: 1. Opening images with Bioformats
Tadrosoft. HistoCytometer. User s Manual.
 Tadrosoft HistoCytometer User s Manual www.bialith.com 2 First Edition 01.05.2011 www.bialith.com 3 Contents 0. LEGAL INFORMATION...4 License Agreement...4 Trade Marks...4 Copyright...4 Disclaimer...4
Centre for Computational and Numerical Studies, Institute of Advanced Study in Science and Technology 2. Dept. of Statistics, Gauhati University
 Cervix Cancer Diagnosis from Pap Smear Images Using Structure Based Segmentation and Shape Analysis 1 Lipi B. Mahanta, 2 Dilip Ch. Nath, 1 Chandan Kr. Nath 1 Centre for Computational and Numerical Studies,
Using the Advanced Sharpen Transformation
 Using the Advanced Sharpen Transformation Written by Jonathan Sachs Revised 10 Aug 2014 Copyright 2002-2014 Digital Light & Color Introduction Picture Window Pro s Advanced Sharpen transformation is a
(Quantitative Imaging for) Colocalisation Analysis
 Colocalisation Analysis") (Quantitative Imaging for) Colocalisation Analysis or Why Colour Merge / Overlay Images are EVIL! Special course for DIGS-BB PhD program What is an Image anyway..? An image is a representation of reality
(Quantitative Imaging for) Colocalisation Analysis or Why Colour Merge / Overlay Images are EVIL! Special course for DIGS-BB PhD program What is an Image anyway..? An image is a representation of reality
Version 6. User Manual OBJECT
 Version 6 User Manual OBJECT 2006 BRUKER OPTIK GmbH, Rudolf-Plank-Str. 27, D-76275 Ettlingen, www.brukeroptics.com All rights reserved. No part of this publication may be reproduced or transmitted in any
Stereotopix Research. Precision Pathology. Highthroughput. pathology. powered by newcast. Advantages of Stereotopix : RUO
 Precision Pathology Highthroughput pathology Stereotopix Research powered by newcast RUO Researchers use quantitative microscopy in many ways with the goal of producing high-quality, quantitative results
Specifications for a successful analysis. Standard Tool. 1 Description of WimTube... 2
 Specifications for a successful analysis Standard Tool 1 Description of WimTube... 2 2 Specifications for the input files... 2 2.1 Description... 2 2.2 Valid Formats... 2 2.3 Microscopy Techniques... 2
Technical Aspects in Digital Pathology
 Technical Aspects in Digital Pathology Yukako Yagi, PhD yyagi@mgh.harvard.edu Director of the MGH Pathology Imaging & Communication Technology Center Assistant Professor of Pathology, Harvard Medical School
Crystal Vis Final Report
 Crystal Vis Final Report Figure 1 The breadboard microscope with LED flash illumination. Figure 2 First tests in the breadboard microscope with the printed flow cell using Thiamine as the sample. Figure
3) Start ImageJ, install CM Engine as a macro (instructions here:
 Start ImageJ, install CM Engine as a macro (instructions here:") Instructions for CM Engine use 1) Download CM Engine from SourceForge (http://cm- engine.sourceforge.net/) or from the Rothstein Lab website (http://www.rothsteinlab.com/cm- engine.zip ). 2) Download ImageJ
Instructions for CM Engine use 1) Download CM Engine from SourceForge (http://cm- engine.sourceforge.net/) or from the Rothstein Lab website (http://www.rothsteinlab.com/cm- engine.zip ). 2) Download ImageJ
Photoshop: Manipulating Photos
 Photoshop: Manipulating Photos All Labs must be uploaded to the University s web server and permissions set properly. In this lab we will be manipulating photos using a very small subset of all of Photoshop
Computer system This distribution of pd is executable under the cygwin system ( on a Windows XP system running on an I86 PC.
 pd Documentation August 19, 2008 Lynn Epstein Introduction pd (for picture decompose) is an image analysis program in which the user identifies standards for each category of interest. For example, the
Using Binary Layers with NIS-Elements
 Using Binary Layers with NIS-Elements Overview This technical note describes the usage of Binary Layers with NIS-Elements. Binary layers form an extension of simple intensity thresholding technique, allowing
Tribometrics. Version 2.11
 Tribometrics Version 2.11 Table of Contents Tribometrics... 1 Version 2.11... 1 1. About This Document... 4 1.1. Conventions... 4 2. Introduction... 5 2.1. Software Features... 5 2.2. Tribometrics Overview...
CAPTURING IMAGES ON THE HIGH-MAGNIFICATION MICROSCOPE
 University of Virginia ITC Academic Computing Health Sciences CAPTURING IMAGES ON THE HIGH-MAGNIFICATION MICROSCOPE Introduction The Olympus BH-2 microscope in ACHS s microscope lab has objectives from
Photoshop: Manipulating Photos
 Photoshop: Manipulating Photos All Labs must be uploaded to the University s web server and permissions set properly. In this lab we will be manipulating photos using a very small subset of all of Photoshop
Terms and Definitions. Scanning
 Terms and Definitions Scanning A/D Converter Building block of a scanner. Converts the electric, analog signals to computer-ready, digital signals. Scanners Aliasing The visibility of individual pixels,
Lab One: Techniques for Better Microscope Use
 Name BioPreAP/GT Purpose: Lab One: Techniques for Better Microscope Use Part A: Microscope Parts and Functions *Refer to Fig. 1 to refresh your memory on the parts of the microscope. *The objectives are
THEORY AND APPROACHES TO AUTOMATED IMAGE ANALYSIS IN DIGITAL PATHOLOGY
 THEORY AND APPROACHES TO AUTOMATED IMAGE ANALYSIS IN DIGITAL PATHOLOGY Kyle Takayama, MS Charles River Laboratories EVERY STEP OF THE WAY EVERY STEP OF THE WAY MORPHOMETRY Measurements or counts performed
Digital Pathology and Image Analysis. Queen s University Department of Pathology and Molecular Medicine Shakeel Virk
 Digital Pathology and Image Analysis Queen s University Department of Pathology and Molecular Medicine Shakeel Virk Outline Digital Pathology and Image Analysis capabilities at Queen s Laboratory for Molecular
A Basic Guide to Photoshop Adjustment Layers
 A Basic Guide to Photoshop Adjustment Layers Photoshop has a Panel named Adjustments, based on the Adjustment Layers of previous versions. These adjustments can be used for non-destructive editing, can
Microscopes & cells. 2. arm. 3. ocular lens. 4. objective lenses. 5. stage. 6. slide clamp. 7. stage controls
 Microscopes & cells Objectives: At the end of this lab you should be able to: o demonstrate the safe and proper handling of a microscope, including carrying a microscope, slide placement, and storage.
Tube Formation Analysis in the Automated Cellular Analysis System
 Tube Formation Analysis in the Automated Cellular Analysis System 1 ibidi GmbH, Version 1.0, 2017-07-14 Table of Content Specifications... 3 Step-by-Step Guide... 4 Analysis... 6 Example Report Job...
#P Quality Measures for Imaging-based Cellular Assays
 Abstract #P1224 - Quality Measures for Imaging-based Cellular Assays Ilya Ravkin, Vitra Bioscience, Inc. Z-factor and related measures are useful in estimating assay variability in HTS caused by assay
MIF ZEISS LSM510 CONFOCAL USER PROTOCOL
 MIF ZEISS LSM510 CONFOCAL USER PROTOCOL START-UP Turn on the Mercury Bulb Power Supply (if needed). Power-on the Control Box. Turn on the computer. Open the LSM 510 software. Choose Scan New Images and
ColorCode 3-D Editor Version 1.2 Manual. Make ColorCode 3-D, Auto 3-D and Standard 3-D images on your PC by ColorCode 3-D, Denmark!!!
 US Patent No. 6,687,003 AU Patent No. 763370 EP Patent No. 1131658 ColorCode 3-D Editor Version 1.2 Manual Make ColorCode 3-D, Auto 3-D and Standard 3-D images on your PC 2012 by ColorCode 3-D, Denmark!!!
Products - Microarray Scanners - Laser Scanners - InnoScan 900 Series and MAPIX Software
 Products - Microarray Scanners - Laser Scanners - InnoScan 900 Series and MAPIX Software Arrayit offers the world s only next generation microarray scanning technology, with proprietary rotary motion control,
Comparison of Segmentation Framework on Digital Microscope Images for Acute Lymphoblastic Leukemia Diagnosis using RGB and HSV Color Spaces
 ` VOLUME 2 ISSUE 2 Comparison of Segmentation Framework on Digital Microscope Images for Acute Lymphoblastic Leukemia Diagnosis using RGB and HSV Color Spaces 1 Kamal A. ElDahshan, 2 Mohammed I. Youssef,
Introduction to BioImage Analysis using Fiji
 Introduction to BioImage Analysis using Fiji CellNetworks Math-Clinic core facility Qi Gao Carlo A. Beretta 12.05.2017 Math-Clinic core facility Data analysis services on bioinformatics & bioimage analysis:
Zeiss Axioskop II. The AIF's "routine" light microscope. (Installed 8/24/04)AxioCam installed July 11th 2005
AxioCam installed July 11th 2005") Zeiss Axioskop II The AIF's "routine" light microscope. (Installed 8/24/04)AxioCam installed July 11th 2005 Featuring: Phase Contrast Darkfield DIC/Nomarski Brightfield Fluorescent filters for Dapi, FITC,Rhodamine
Zeiss Axioskop II The AIF's "routine" light microscope. (Installed 8/24/04)AxioCam installed July 11th 2005 Featuring: Phase Contrast Darkfield DIC/Nomarski Brightfield Fluorescent filters for Dapi, FITC,Rhodamine
MEDICAL EDUCATION TECHNOLOGY
 Snipping Tool Overview The Snipping Tool provides a way to capture images from your display screen and imbed them in documents you develop. This is especially useful in Histopathology lab, since it allows
Arcturus XT Laser Capture Microdissection System AutoScanXT Software Module. User Manual
 Arcturus XT Laser Capture Microdissection System AutoScanXT Software Module User Manual For Research Use Only. Not intended for any animal or human therapeutic or diagnostic use. Information in this document
InScape: Making Virtual Pathology a Reality
 InScape: Making Virtual Pathology a Reality Sally S. Agersborg, M.D., Ph.D. Quest Diagnostics, Nichols Institute San Juan Capistrano, CA Company Overview Quest Diagnostics, Nichols Institute the world
printing An designer s guide to newsprint printing
 7 Toptips printing An designer s guide to newsprint printing The Meeting Place of Intelligent Business Introduction Our aim in producing this guide is to help you modify your files to meet our paper and
A Basic Guide to Photoshop CS Adjustment Layers
 A Basic Guide to Photoshop CS Adjustment Layers Alvaro Guzman Photoshop CS4 has a new Panel named Adjustments, based on the Adjustment Layers of previous versions. These adjustments can be used for non-destructive
EmbryoCellect. RHS Scanning and Analysis Instructions. for. Genepix Pro Software
 EmbryoCellect RHS Scanning and Analysis Instructions for Genepix Pro Software EmbryoCellect Genepix Pro Scanning and Analysis Technical Data Sheet Version 1.0 October 2015 1 Copyright Reproductive Health
Spatial intensity distribution analysis Matlab user guide
 Spatial intensity distribution analysis Matlab user guide August 2011 Guide on how to use the SpIDA graphical user interface. This little tutorial provides a step by step tutorial explaining how to get
MAKE SURE YOUR SLIDES ARE CLEAN (TOP & BOTTOM) BEFORE LOADING DO NOT LOAD SLIDES DURING SOFTWARE INITIALIZATION
 BEFORE LOADING DO NOT LOAD SLIDES DURING SOFTWARE INITIALIZATION") Olympus VS120-L100 Slide Scanner Standard Operating Procedure Startup 1) Red power bar switch (behind monitor) 2) Computer 3) Login: UserVS120 account (no password) 4) Double click: WAIT FOR INITIALIZATION
Olympus VS120-L100 Slide Scanner Standard Operating Procedure Startup 1) Red power bar switch (behind monitor) 2) Computer 3) Login: UserVS120 account (no password) 4) Double click: WAIT FOR INITIALIZATION
What are some of the characteristics of plant and animal cells?
 What are some of the characteristics of plant and animal cells? BACKGROUND Ever since the first microscope was used, biologists have been interested in studying the cellular organization of all living
Color Correction with Curves
 Lecture 02 wk 07 with Curves Channels o Photoshop uses Channels to provide access to the different color components of an image. o In most cases, an image is composed of one or more 8-bit channels. o Channels
Using Adobe Photoshop
 Using Adobe Photoshop 4 Colour is important in most art forms. For example, a painter needs to know how to select and mix colours to produce the right tones in a picture. A Photographer needs to understand
3.4 COLOR CORRECTION
 3.4 COLOR CORRECTION After you have arranged and edited your video and audio clips to your sequence, you are ready for color correction. Color correction is a step in the process of film editing that can
Calibration. Accessing printable pages. Menu Map. Phaser 7300 Color Printer
 Phaser 7300 Color Printer ibration large amount of information is stored in your printer as printable pages. The following pages are samples of the printable page for this topic. 730058 ll the printable
Color and More. Color basics
 Color and More In this lesson, you'll evaluate an image in terms of its overall tonal range (lightness, darkness, and contrast), its overall balance of color, and its overall appearance for areas that
DIGITAL PHOTOGRAPHY Camera and image capture
 DIGITAL PHOTOGRAPHY Camera and image capture The higher the number of pixels, the better the resolution. Your camera should be able to capture images of at least 1200 x 900 pixels which is equivalent to
Using the Nikon TE2000 Inverted Microscope
 Wellcome Trust Centre for Human Genetics Molecular Cytogenetics and Microscopy Core Using the Nikon TE2000 Inverted Microscope Fluorescence image acquisition using Scanalytic s IPLab software and the B&W
HoloMonitor M4. For powerful discoveries in your incubator
 HoloMonitor M4 For powerful discoveries in your incubator HoloMonitor offers unique imaging capabilities that greatly enhance our understanding of cell behavior, previously unachievable by other technologies
Introduction to Color Theory
 Introduction to Color Theory This overview will give you an essential primer on the definition of color, from its origins to current day definitions. It provides a deeper understanding of the printing
Color aspects and Color Standardization in Digital Microscopy
 Color aspects and Color Standardization in Digital Microscopy Yukako Yagi, PhD yyagi@partners.org Director of the MGH Pathology Imaging & Communication Technology Center Assistant Professor of Pathology,
Laboratory 2: Microscopy and Observation of Cells authors: Dr. Ruth Dahlquist-Willard & Michael Kunz
 Laboratory 2: Microscopy and Observation of Cells authors: Dr. Ruth Dahlquist-Willard & Michael Kunz Corresponding Readings: Campbell Ch. 4 BIOL-100L Safety Information: We will be using laboratory glassware
Aperio ImageScope. User s Guide. For research use only. Not for use in diagnostic procedures.
 Aperio ImageScope User s Guide For research use only. Not for use in diagnostic procedures. MAN-0001, Revision Q 5 December 2017 Aperio ImageScope User s Guide This document applies to Aperio eslide Manager
White Blood Cells Identification and Counting from Microscopic Blood Image
 White Blood Cells Identification and Counting from Microscopic Blood Image Lorenzo Putzu, and Cecilia Di Ruberto Abstract The counting and analysis of blood cells allows the evaluation and diagnosis of
A quick overview of the basics of my workflow in. Those gaps in Photoshop s Histogram indicate missing information.
 Another Photoshop tutorial by Bruce Philpott Copyright 2007 Bruce Philpott A quick overview of the basics of my workflow in Adobe Camera Raw This short tutorial certainly won t cover everything about Adobe
CS 547 Digital Imaging Lecture 2
 CS 547 Digital Imaging Lecture 2 Basic Photo Corrections & Retouching and Repairing Selection Tools Rectangular marquee tool Use to select rectangular images Elliptical Marque Tool Use to select elliptical
Master digital black and white conversion with our Photoshop plug-in. Black & White Studio plug-in - Tutorial
 Master digital black and white conversion with our Photoshop plug-in This Photoshop plug-in turns Photoshop into a digital darkroom for black and white. Use the light sensitivity of films (Tri-X, etc)
The Unique Role of Lucis Differential Hysteresis Processing (DHP) in Digital Image Enhancement
 in Digital Image Enhancement") The Unique Role of Lucis Differential Hysteresis Processing (DHP) in Digital Image Enhancement Brian Matsumoto, Ph.D. Irene L. Hale, Ph.D. Imaging Resource Consultants and Research Biologists, University
The Unique Role of Lucis Differential Hysteresis Processing (DHP) in Digital Image Enhancement Brian Matsumoto, Ph.D. Irene L. Hale, Ph.D. Imaging Resource Consultants and Research Biologists, University
RGB Line Follower. 1. Basic knowledge of RGB line follower
 RGB Line Follower 1. Basic knowledge of RGB line follower The RGB Line Follower module is designed for line patrol competitions. It contains 4 RGB fill lights and 4 photosensitive receiving tubes. The
Quick Guide. NucleoCounter NC-3000
 Quick Guide NucleoCounter NC-3000 Table of contents Setting up the FlexiCyte Protocol 2 Editing Image Capture and Analysis Parameters 3 Optimizing Exposure Time 4 Compensation for Spectral Overlap 6 Creating
Proudly serving laboratories worldwide since 1979 SPECIFICATIONS
 www.ietltd.com Proudly serving laboratories worldwide since 1979 SPECIFICATIONS Scan RDI Specifications System Components Main analytical console Laser Module CRT Printer Data Manager Motorized stage (option)
FIJI/Image J for Quantification Hands on session
 FIJI/Image J for Quantification Hands on session Dr Paul McMillan Biological Optical Microscopy Platform Hands on demonstrations FIJI set up Line Profile Thresholding Area of stain Cell confluence Nuclei
Chapter 8. Representing Multimedia Digitally
 Chapter 8 Representing Multimedia Digitally Learning Objectives Explain how RGB color is represented in bytes Explain the difference between bits and binary numbers Change an RGB color by binary addition
Microvasculature on a chip: study of the Endothelial Surface Layer and the flow structure of Red Blood Cells
 Supplementary Information Microvasculature on a chip: study of the Endothelial Surface Layer and the flow structure of Red Blood Cells Daria Tsvirkun 1,2,5, Alexei Grichine 3,4, Alain Duperray 3,4, Chaouqi
Movie 3. Basic Camera Raw workflow
 Movie 3 Basic Camera Raw workflow 1 The tone adjustment controls The tone adjustment controls allow you to make adjustments to the highlight and shadow clipping points as well as the overall tone balance
Bandpass Edge Dichroic Notch & More
 Edmund Optics BROCHURE Filters COPYRIGHT 217 EDMUND OPTICS, INC. ALL RIGHTS RESERVED 1/17 Bandpass Edge Dichroic Notch & More Contact us for a Stock or Custom Quote Today! USA: +1-856-547-3488 EUROPE:
Digital Imaging Outline
 Digital Microscopy and Imaging Update Michael Feldman, MD, PhD Associate Professor of Pathology Assistant Dean for Information Technology University of Pennsylvania School of Medicine (Feldmanm@mail.med.upenn.edu)
Spotxel 1.7 Microarray Image and Data Analysis Software User s Guide
 Spotxel 1.7 Microarray Image and Data Analysis Software User s Guide 27 April 2017 - Rev 7 Spotxel is only intended for research and not intended or approved for diagnosis of disease in humans or animals.
The 2 in 1 Grey White Balance Colour Card. user guide.
 The 2 in 1 Grey White Balance Colour Card user guide www.greywhitebalancecolourcard.co.uk Contents 01 Introduction 05 02 System requirements 06 03 Download and installation 07 04 Getting started 08 Creating
Anatomy: Introduction to the Light Microscope
 Anatomy: Introduction to the Light Microscope Background: Microscopes are very important tools in biology. The term microscope can be translated as to view the tiny, because microscopes are used to study
HISTOGRAMS. These notes are a basic introduction to using histograms to guide image capture and image processing.
 HISTOGRAMS Roy Killen, APSEM, EFIAP, GMPSA These notes are a basic introduction to using histograms to guide image capture and image processing. What are histograms? Histograms are graphs that show what
Machinery HDR Effects 3
 1 Machinery HDR Effects 3 MACHINERY HDR is a photo editor that utilizes HDR technology. You do not need to be an expert to achieve dazzling effects even from a single image saved in JPG format! MACHINERY
In this rather technical follow-up article to my original
 Adjusting Photographs for Print or Web Use In this rather technical follow-up article to my original photography article, I will discuss how I use Photoshop CS5 after taking photos of flow blue or mulberry
NPTEL VIDEO COURSE PROTEOMICS PROF. SANJEEVA SRIVASTAVA
 HANDOUT LECTURE-31 MICROARRAY WORK-FLOW: IMAGE SCANNING AND DATA PROCESSING Slide 1: This module contains the summary of the discussion with Mr. Pankaj Khanna, an application specialist from Spinco Biotech,
Automated Cellular Imaging and Analysis System
 Automated Cellular Imaging and Analysis System CELLULAR IMAGING AND ANALYSIS FOR SCREENING AUTOMATED ACQUISITION AUTOMATED ANALYSIS HIGH RESOLUTION The ImageXpress TM 5000A automated cellular imaging and
Instruction Manual. Mark Deimund, Zuyi (Jacky) Huang, Juergen Hahn
 Huang, Juergen Hahn") Instruction Manual Mark Deimund, Zuyi (Jacky) Huang, Juergen Hahn This manual is for the program that implements the image analysis method presented in our paper: Z. Huang, F. Senocak, A. Jayaraman, and
Instruction Manual Mark Deimund, Zuyi (Jacky) Huang, Juergen Hahn This manual is for the program that implements the image analysis method presented in our paper: Z. Huang, F. Senocak, A. Jayaraman, and
Part I: Bruker Esprit Mapping Options
 Part I: Bruker Esprit Mapping Options Mapping Panel Overview 5. 4. 2. 6. 3. 7. 8. 9. 1. 10. Mapping Panel Overview 1. Element selector - can turn individual elements (as well as the image overlay) on/off.
Introduction to BioImage Analysis
 Introduction to BioImage Analysis Qi Gao CellNetworks Math-Clinic core facility 22-23.02.2018 MATH- CLINIC Math-Clinic core facility Data analysis services on bioimage analysis & bioinformatics: 1-to-1
SoilJ Technical Manual
 SoilJ Technical Manual Version 0.0.3 2017-09-08 John Koestel Introduction SoilJ is a plugin for the JAVA-based, free and open image processing software ImageJ (Schneider, Rasband, et al., 2012). It is
CONTENT INTRODUCTION BASIC CONCEPTS Creating an element of a black-and white line drawing DRAWING STROKES...
 USER MANUAL CONTENT INTRODUCTION... 3 1 BASIC CONCEPTS... 3 2 QUICK START... 7 2.1 Creating an element of a black-and white line drawing... 7 3 DRAWING STROKES... 15 3.1 Creating a group of strokes...
Supplemental Figure 1: Histogram of 63x Objective Lens z axis Calculated Resolutions. Results from the MetroloJ z axis fits for 5 beads from each
 Supplemental Figure 1: Histogram of 63x Objective Lens z axis Calculated Resolutions. Results from the MetroloJ z axis fits for 5 beads from each lens with a 1 Airy unit pinhole setting. Many water lenses
Tablet overrides: overrides current settings for opacity and size based on pen pressure.
 Photoshop 1 Painting Eye Dropper Tool Samples a color from an image source and makes it the foreground color. Brush Tool Paints brush strokes with anti-aliased (smooth) edges. Brush Presets Quickly access