Outline. Background NOAA s GOES-R Proving Ground (PG) Selected PG applications from Suomi-NPP VIIRS Transitioning to AHI: Conclusions
|
|
|
- Allen Carter
- 5 years ago
- Views:
Transcription


1
 The last geostationary satellite to offer a true color imaging")
2 Outline Background NOAA s GOES-R Proving Ground (PG) Selected PG applications from Suomi-NPP VIIRS Transitioning to AHI: Selected AHI RGB Applications True Color and Hybrid Green GeoColor Blended Imagery Lofted Dust Conclusions NASA ATS-3 (1967) The last geostationary satellite to offer a true color imaging capability. 2

 development Himawari-8 AHI provides closest proxy to GOES-R ABI")
3 NOAA s GOES-R Proving Ground Vision: Bridge the gap between researchers and forecasters Objectives: Day-1 readiness and maximum utilization of the GOES-R observing system A conduit for research satellite products to be hosted on operational display systems Approach: Use proxy data to anticipate future GOES-R Advanced Baseline Imager capabilities Demonstrate ABI-caliber products/techniques in the operational environment Engage in 2-way dialogue to enable research-tooperations-to-research (R2O2R) development Himawari-8 AHI provides closest proxy to GOES-R ABI 3

4 Proving Ground Demonstrations: MODIS/VIIRS Cloud/Snow 4


5 Proving Ground Demonstrations: MODIS/VIIRS Blue-Light Dust New Mexico Lofted Dust Texas 5

6 Proving Ground Applications: MSG DEBRA Dust Mask Syria Iraq Iran Saudi Arabia 6
 RED Colors are dependent on temperature, water vapor and ozone Dry/Subsidence Warm, moist (tropical): green Warm, dry: orange Cold, dry (polar): purple Cold, moist: blue A frontal system passes")
7 AHI Airmass RGB (EUMETSAT) Band 8 (6.2 µm) BLUE Band ( µm) GREEN Band 8-10 ( µm) RED Colors are dependent on temperature, water vapor and ozone Dry/Subsidence Warm, moist (tropical): green Warm, dry: orange Cold, dry (polar): purple Cold, moist: blue A frontal system passes over Japan UTC 2 November 2015 Moist/Ascent Low tropopause height/strong subsidence: red Warm land surface: black Cold clouds: 7
 RED Fires Relatively cool/small fires only detected at 3.")

8 AHI Fire Temperature RGB Band 5 (1.6 µm) BLUE Band 6 (2.3 µm) GREEN Band 7 (3.9 µm) RED Fires Relatively cool/small fires only detected at 3.9 µm appear red Warmer/larger fires detected in both 3.9 µm and 2.25 µm appear Very large/hot fires detected in all three bands and appear Bush land fires detected in Australia UTC 11 October 2015 Liquid clouds: blue Ice clouds: dark green 8

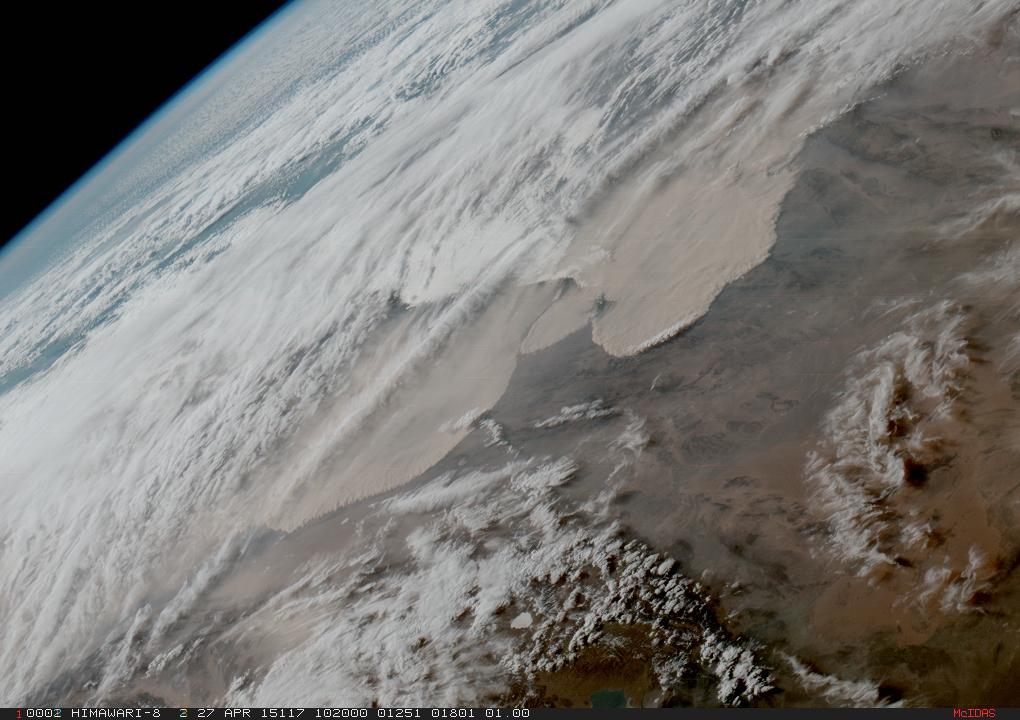
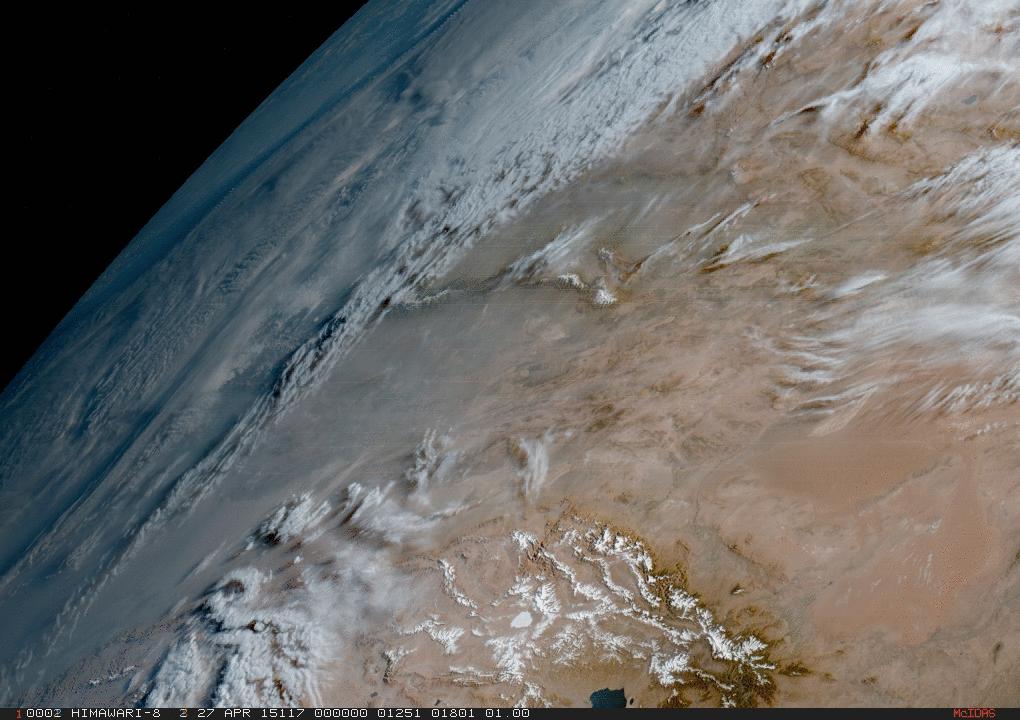
9 AHI True Color: Rayleigh Corrections Molecular scatter of sunlight by the gaseous atmosphere is significant, particularly in the blue-band Adapted atmospheric correction software, applied previously to SeaWiFS/MODIS/VIIRS sensors, to AHI bands Corrections are a function of solar & satellite geometry Blue Green Red NIR Corrected These atmospheric corrections are a critical step in attaining high-quality true color imagery 9
10 True True Color Rayleigh-Corrected No Correction 10


11 Inconsistency with MODIS/VIIRS VIIRS AHI ASTER Spectral Database AHI MODIS Soil Grass Comparisons of AHI true color imagery to VIIRS & MODIS showed vegetation too brown, deserts too red The 510 nm AHI band misses the 555 nm chlorophyll signal, and mineral soils are more absorbing.(modis/viirs both use 11
 Provides enhancement to green vegetation and mineral soils (e.g., deserts).")
12 Proposing a Hybrid Green Band Blend 510 nm green band with vegetation-sensitive 856 nm band to produce a hybrid green band (G H ): G H = F * R_510 + (1-F) * R_856 F ~ 0.93 (experimental) Provides enhancement to green vegetation and mineral soils (e.g., deserts). Minimal impact to other features of the scene (clouds, ocean, and shallowwater coloration) Grass Soil AHI Band 4 (856 nm) provides a boost to the 510 nm vegetation and soil reflectance 12
13 True Color Rayleigh Hybrid

14 14


15 Hybrid Green True Color Examples 15

 B, R, NIR G S = F (B,R,NIR) (AHI) B, G, R, NIR 510 nm (land, shallow water,")
*R 856, F = 0.93 Synthetic Miller, S. D., C.")
16 A Synthetic Green Band for ABI GOES-R ABI has no green band we must approximate it via correlations with other available bands. We are using Himawari-8 AHI for this development. (ABI) B, R, NIR G S = F (B,R,NIR) (AHI) B, G, R, NIR 510 nm (land, shallow water, deep water) B R NIR For GOES-R ABI, we will first construct G S (510 nm), then compute G H,S via: G H,S = F*G S + (1-F)*R 856, F = 0.93 Synthetic Miller, S. D., C. Schmidt, T. Schmit, and D. Hillger, 2012, Int. J. Rem. Sens., 33(13),
17 Merging Layers of Information The GeoColor Concept Layers of Information (2 layer example) Top Layer Spatial Opacity Rules for Top Layer (Black= Opaque, White=Transparent) Bottom Layer Blended Layer Each layer of information has an associated opacity field that is defined at the pixel level. A separate blend is done for each color gun (R/G/B). Concept can be extended to N-dimensional blending, allowing for simultaneous display of multiple layers. 17
18 AHI GeoColor (Provisional) 18
 Dust Mask")


19 Future Layers: AHI (Provisional) Dust Mask Visible Dust Enhancement In early development for AHI, DEBRA is a confidence factor that could readily be used as another layer in GeoColor...


20 Optical Flow Image Filtering Sequential Basic Fading Optical Flow Filtering We are collaborating with computer scientist Dan Delany to apply the Farnebäck dense optical flow algorithm to geostationary imagery. Farnebäck, G., 2003: Two-frame motion estimation based on polynomial expansion. Proc. 13 th Scandinavian Conf. on Image Anal.,

21 AHI GeoColor (Optical Flow) Example Courtesy of Dan Delany, Data Journalist 21
22 Conclusions Himawari-8 AHI provides a first opportunity to apply multispectral MODIS/VIIRS imagery algorithms to geostationary satellite data. AHI provides the best-available surrogate to GOES-R ABI for Proving Ground demonstrations. Development of AHI products will facilitate rapid transition of similar products to ABI. CIRA is collaborating closely with JMA to help users realize the full potential of AHI capabilities. ありがとう Thanks!
Himawari 8/AHI True Color Reproduction Imagery
 Himawari 8/AHI True Color Reproduction Imagery Hidehiko MURATA, Kotaro SAITO, Yasuhiko SUMIDA Meteorological Satellite Center Japan Meteorological Agency 1 Introduction Himawari 8/AHI s three visible bands
Limb Correction of Infrared Imagery in Cloudy Regions for the Improved Interpretation of RGB Composites
 Limb Correction of Infrared Imagery in Cloudy Regions for the Improved Interpretation of RGB Composites Nicholas Elmer 1,4, Emily Berndt 2,4, Gary Jedlovec 3,4 1 Department of Atmospheric Science, University
SEN3APP Stakeholder Workshop, Helsinki Yrjö Rauste/VTT Kaj Andersson/VTT Eija Parmes/VTT
 Optical Products from Sentinel-2 and Suomi- NPP/VIIRS SEN3APP Stakeholder Workshop, Helsinki 19.11.2015 Yrjö Rauste/VTT Kaj Andersson/VTT Eija Parmes/VTT Structure of Presentation High-resolution data
Recent developments in Deep Blue satellite aerosol data products from NASA GSFC
 Recent developments in Deep Blue satellite aerosol data products from NASA GSFC Andrew M. Sayer, N. Christina Hsu (PI), Corey Bettenhausen, Myeong-Jae Jeong Climate & Radiation Laboratory, NASA Goddard
Interpreting land surface features. SWAC module 3
 Interpreting land surface features SWAC module 3 Interpreting land surface features SWAC module 3 Different kinds of image Panchromatic image True-color image False-color image EMR : NASA Echo the bat
Lecture 6: Multispectral Earth Resource Satellites. The University at Albany Fall 2018 Geography and Planning
 Lecture 6: Multispectral Earth Resource Satellites The University at Albany Fall 2018 Geography and Planning Outline SPOT program and other moderate resolution systems High resolution satellite systems
Inter comparison of Terra and Aqua MODIS Reflective Solar Bands Using Suomi NPP VIIRS
 Inter comparison of Terra and Aqua Reflective Solar Bands Using Suomi NPP VIIRS Slawomir Blonski, * Changyong Cao, Sirish Uprety, ** and Xi Shao * NOAA NESDIS Center for Satellite Applications and Research
Satellite Imagery and Remote Sensing. DeeDee Whitaker SW Guilford High EES & Chemistry
 Satellite Imagery and Remote Sensing DeeDee Whitaker SW Guilford High EES & Chemistry whitakd@gcsnc.com Outline What is remote sensing? How does remote sensing work? What role does the electromagnetic
JMA Activities on New-generation Himawari-8 Geostationary Satellite in RA-V. Hiroshi KOIDE Japan Meteorological Agency(JMA)
") JMA Activities on New-generation Himawari-8 Geostationary Satellite in RA-V Hiroshi KOIDE Japan Meteorological Agency(JMA) 16 th RA-V Tropical Cyclone Committee, Solomon Islands, 27 August 2016 Himawari-8/9
JMA Activities on New-generation Himawari-8 Geostationary Satellite in RA-V Hiroshi KOIDE Japan Meteorological Agency(JMA) 16 th RA-V Tropical Cyclone Committee, Solomon Islands, 27 August 2016 Himawari-8/9
IKONOS High Resolution Multispectral Scanner Sensor Characteristics
 High Spatial Resolution and Hyperspectral Scanners IKONOS High Resolution Multispectral Scanner Sensor Characteristics Launch Date View Angle Orbit 24 September 1999 Vandenberg Air Force Base, California,
AVHRR/3 Operational Calibration
 AVHRR/3 Operational Calibration Jörg Ackermann, Remote Sensing and Products Division 1 Workshop`Radiometric Calibration for European Missions, 30/31 Aug. 2017`,Frascati (EUM/RSP/VWG/17/936014) AVHRR/3
INNOVATIVE IDEAS FOR USING THE HYPERESPECTRAL LEVEL 1 DATA OF THE NEXT GEOSTATIONARY MTG-IRS IN NOWCASTING
 INNOVATIVE IDEAS FOR USING THE HYPERESPECTRAL LEVEL 1 DATA OF THE NEXT GEOSTATIONARY MTG-IRS IN NOWCASTING Miguel A. Martinez, 1 Xavier Calbet 2 (1) Agencia Estatal de Meteorología (AEMET), Spain (2) EUMETSAT
Joint Polar Satellite System (JPSS) Calibration/Validation Plan for Imagery Product
 Calibration/Validation Plan for Imagery Product") Joint Polar Satellite System (JPSS) Calibration/Validation Plan for Imagery Product Version 2.0 Date: 15 December 2015 Prepared By: Don Hillger [NOAA/NESDIS/StAR] Thomas Kopp [The Aerospace Corp.] Page
Joint Polar Satellite System (JPSS) Calibration/Validation Plan for Imagery Product Version 2.0 Date: 15 December 2015 Prepared By: Don Hillger [NOAA/NESDIS/StAR] Thomas Kopp [The Aerospace Corp.] Page
NOAA JPSS and GOES Fire Products R. Bradley Pierce and Shobha Kondragunta NOAA/NESDIS/STAR
 NOAA JPSS and GOES Fire Products R. Bradley Pierce and Shobha Kondragunta NOAA/NESDIS/STAR Outline VIIRS Aerosol Optical Depth and Fire Radiative Power ABI Aerosol Optical Depth and Fire Radiative Power
Introduction to Remote Sensing Fundamentals of Satellite Remote Sensing. Mads Olander Rasmussen
 Introduction to Remote Sensing Fundamentals of Satellite Remote Sensing Mads Olander Rasmussen (mora@dhi-gras.com) 01. Introduction to Remote Sensing DHI What is remote sensing? the art, science, and technology
FOR 353: Air Photo Interpretation and Photogrammetry. Lecture 2. Electromagnetic Energy/Camera and Film characteristics
 FOR 353: Air Photo Interpretation and Photogrammetry Lecture 2 Electromagnetic Energy/Camera and Film characteristics Lecture Outline Electromagnetic Radiation Theory Digital vs. Analog (i.e. film ) Systems
Detecting Greenery in Near Infrared Images of Ground-level Scenes
 Detecting Greenery in Near Infrared Images of Ground-level Scenes Piotr Łabędź Agnieszka Ozimek Institute of Computer Science Cracow University of Technology Digital Landscape Architecture, Dessau Bernburg
An Introduction to Remote Sensing & GIS. Introduction
 An Introduction to Remote Sensing & GIS Introduction Remote sensing is the measurement of object properties on Earth s surface using data acquired from aircraft and satellites. It attempts to measure something
Suomi NPP VIIRS Calibration/ Validation Progress Update
 Suomi NPP VIIRS Calibration/ Validation Progress Update C. Cao 1, Q. Liu 2, S. Blonski 2, X. Shao 2, and S. Uprety 3 1 NOAA/NESDIS Center for Satellite Applications and Research 2 ESSIC, University of
Haze Detection and Removal in Sentinel 3 OLCI Level 1B Imagery Using a New Multispectral Data Dehazing Method
 Haze Detection and Removal in Sentinel 3 OLCI Level 1B Imagery Using a New Multispectral Data Dehazing Method Xinxin Busch Li, Stephan Recher, Peter Scheidgen July 27 th, 2018 Outline Introduction» Why
BLENDED "SANDWICH" IMAGE PRODUCTS IN NOWCASTING
 BLENDED "SANDWICH" IMAGE PRODUCTS IN NOWCASTING Martin Setvák 1, Zdeněk Charvát 1, Michaela Valachová 2,1, Kristopher Bedka 3 1 Czech Hydrometeorological Institute, Satellite Dept., Na Šabatce 17, Praha,
From Proba-V to Proba-MVA
 From Proba-V to Proba-MVA Fabrizio Niro ESA Sensor Performances Products and Algorithm (SPPA) ESA UNCLASSIFIED - For Official Use Proba-V extension in the Copernicus era Proba-V was designed with the main
Looking at 637 nm VIIRS band, S-NPP
 Looking at 637 nm VIIRS band, S-NPP bguenther@stellarsolutions.com (Sharpening I1) B. GUENTHER STELLAR SOLUTIONS, INC NOAA-JPSS 1 I am looking at houses and have a desire to know how much living area this
Development of normalized vegetation, soil and water indices derived from satellite remote sensing data
 Development of normalized vegetation, soil and water indices derived from satellite remote sensing data Takeuchi, W. & Yasuoka, Y. IIS/UT, Japan E-mail: wataru@iis.u-tokyo.ac.jp Nov. 25th, 2004 ACRS2004
A New Lossless Compression Algorithm For Satellite Earth Science Multi-Spectral Imagers
 A New Lossless Compression Algorithm For Satellite Earth Science Multi-Spectral Imagers Irina Gladkova a and Srikanth Gottipati a and Michael Grossberg a a CCNY, NOAA/CREST, 138th Street and Convent Avenue,
XSAT Ground Segment at CRISP
 XSAT Ground Segment at CRISP LIEW Soo Chin Head of Research, CRISP http://www.crisp.nus.edu.sg 5 th JPTM for Sentinel Asia Step-2, 14-16 Nov 2012, Daejeon, Korea Centre for Remote Imaging, Sensing and
Sensor resolutions from space: the tension between temporal, spectral, spatial and swath. David Bruce UniSA and ISU
 Sensor resolutions from space: the tension between temporal, spectral, spatial and swath David Bruce UniSA and ISU 1 Presentation aims 1. Briefly summarize the different types of satellite image resolutions
John P. Stevens HS: Remote Sensing Test
 Name(s): Date: Team name: John P. Stevens HS: Remote Sensing Test 1 Scoring: Part I - /18 Part II - /40 Part III - /16 Part IV - /14 Part V - /93 Total: /181 2 I. History (3 pts. each) 1. What is the name
Evaluation of FLAASH atmospheric correction. Note. Note no SAMBA/10/12. Authors. Øystein Rudjord and Øivind Due Trier
 Evaluation of FLAASH atmospheric correction Note Note no Authors SAMBA/10/12 Øystein Rudjord and Øivind Due Trier Date 16 February 2012 Norsk Regnesentral Norsk Regnesentral (Norwegian Computing Center,
Image Band Transformations
 Image Band Transformations Content Band math Band ratios Vegetation Index Tasseled Cap Transform Principal Component Analysis (PCA) Decorrelation Stretch Image Band Transformation Purposes Image band transforms
GIS Data Collection. Remote Sensing
 GIS Data Collection Remote Sensing Data Collection Remote sensing Introduction Concepts Spectral signatures Resolutions: spectral, spatial, temporal Digital image processing (classification) Other systems
The USGEO Satellite Needs process provides the firstever whole-of-government approach to identifying desired satellite products across the civilian
 Observations (USGEO) Satellite Needs Identifying Federal Satellite User Needs Glenn Bethel / USDA SNWG Co-Chair The USGEO Satellite Needs process provides the firstever whole-of-government approach to
PLANET SURFACE REFLECTANCE PRODUCT
 PLANET SURFACE REFLECTANCE PRODUCT FEBRUARY 2018 SUPPORT@PLANET.COM PLANET.COM VERSION 1.0 TABLE OF CONTENTS 3 Product Description 3 Atmospheric Correction Methodology 5 Product Limitations 6 Product Assessment
Improvement of Himawari-8 observation data quality
 17 November 2016 Meteorological Satellite Center Japan Meteorological Agency Improvement of Himawari-8 observation data quality The Japan Meteorological Agency (JMA) updated its Himawari-8 ground processing
NEW ATMOSPHERIC CORRECTION METHOD BASED ON BAND RATIOING
 NEW ATMOSPHERIC CORRECTION METHOD BASED ON BAND RATIOING DEPARTMENT OF PHYSICS/COLLEGE OF EDUCATION FOR GIRLS, UNIVERSITY OF KUFA, AL-NAJAF,IRAQ hussienalmusawi@yahoo.com ABSTRACT The Atmosphere plays
JP Stevens High School: Remote Sensing
 1 Name(s): ANSWER KEY Date: Team name: JP Stevens High School: Remote Sensing Scoring: Part I - /18 Part II - /40 Part III - /16 Part IV - /14 Part V - /93 Total: /181 2 I. History (3 pts each) 1. What
Interrogating MODIS & AIRS data using HYDRA
 Interrogating MODIS & AIRS data using HYDRA Paul Menzel NOAA Satellite and Information Services What is HYDRA? What can it do? Some examples How to get it? HYperspectral viewer for Development of Research
Figure 1: Percent reflectance for various features, including the five spectra from Table 1, at different wavelengths from 0.4µm to 1.4µm.
 Section 1: The Electromagnetic Spectrum 1. The wavelength range that has the highest reflectance for broadleaf vegetation and needle leaf vegetation is 0.75µm to 1.05µm. 2. Dry soil can be distinguished
On the use of water color missions for lakes in 2021
 Lakes and Climate: The Role of Remote Sensing June 01-02, 2017 On the use of water color missions for lakes in 2021 Cédric G. Fichot Department of Earth and Environment 1 Overview 1. Past and still-ongoing
HIMAWARI-8 COHERENT NOISE REDUCTION
 Place image here (10 x 3.5 ) HIMAWARI-8 COHERENT NOISE REDUCTION DR. PAUL GRIFFITH Harris Space and Intelligence Systems, Fort Wayne, Indiana USA NON-EXPORT CONTROLLED THESE ITEM(S) / DATA HAVE BEEN REVIEWED
Workshop on Practical Applications of MODIS Data in Australia
 Workshop on Practical Applications of MODIS Data in Australia Leeuwin Centre, Floreat WA November 26-29, 2002 Liam Gumley Space Science and Engineering Center University of Wisconsin-Madison Introduction
How can we "see" using the Infrared?
 The Infrared Infrared light lies between the visible and microwave portions of the electromagnetic spectrum. Infrared light has a range of wavelengths, just like visible light has wavelengths that range
Geospatial Vision and Policies Korean Industry View 26 November, 2014 SI Imaging Services
 Geospatial Vision and Policies Korean Industry View 26 November, 2014 SI Imaging Services Distribution Limitation, SI Imaging Services Proprietary Data : The data contained in this document, without the
DIGITALGLOBE ATMOSPHERIC COMPENSATION
 See a better world. DIGITALGLOBE BEFORE ACOMP PROCESSING AFTER ACOMP PROCESSING Summary KOBE, JAPAN High-quality imagery gives you answers and confidence when you face critical problems. Guided by our
MULTISPECTRAL IMAGE PROCESSING I
 TM1 TM2 337 TM3 TM4 TM5 TM6 Dr. Robert A. Schowengerdt TM7 Landsat Thematic Mapper (TM) multispectral images of desert and agriculture near Yuma, Arizona MULTISPECTRAL IMAGE PROCESSING I SENSORS Multispectral
Image interpretation and analysis
 Image interpretation and analysis Grundlagen Fernerkundung, Geo 123.1, FS 2014 Lecture 7a Rogier de Jong Michael Schaepman Why are snow, foam, and clouds white? Why are snow, foam, and clouds white? Today
NASA OBPG Satellite Ocean Color Update
 NASA OBPG Satellite Ocean Color Update Bryan Franz and the Ocean Biology Processing Group NASA Goddard Space Flight Center IOCS Meeting Ocean Color Research Team Meeting 18 May 2017, Lisbon, Portugal NASA
Fundamentals of Remote Sensing
 Climate Variability, Hydrology, and Flooding Fundamentals of Remote Sensing May 19-22, 2015 GEO-Latin American & Caribbean Water Cycle Capacity Building Workshop Cartagena, Colombia 1 Objective To provide
CLOUD SCREENING METHOD FOR OCEAN COLOR OBSERVATION BASED ON THE SPECTRAL CONSISTENCY
 CLOUD SCREENING METHOD FOR OCEAN COLOR OBSERVATION BASED ON THE SPECTRAL CONSISTENCY H. Fukushima a, K. Ogata a, M. Toratani a a School of High-technology for Human Welfare, Tokai University, Numazu, 410-0395
Present and future of marine production in Boka Kotorska
 Present and future of marine production in Boka Kotorska First results from satellite remote sensing for the breeding areas of filter feeders in the Bay of Kotor INTRODUCTION Environmental monitoring is
Passive Microwave Sensors LIDAR Remote Sensing Laser Altimetry. 28 April 2003
 Passive Microwave Sensors LIDAR Remote Sensing Laser Altimetry 28 April 2003 Outline Passive Microwave Radiometry Rayleigh-Jeans approximation Brightness temperature Emissivity and dielectric constant
Lab 1: Introduction to MODIS data and the Hydra visualization tool 21 September 2011
 WMO RA Regional Training Course on Satellite Applications for Meteorology Cieko, Bogor Indonesia 19-27 September 2011 Kathleen Strabala University of Wisconsin-Madison, USA kathy.strabala@ssec.wisc.edu
Menzel / Antonelli Lab 1 Using HYDRA to Inspect Multispectral Remote Sensing Data
 Menzel / Antonelli Lab 1 Using HYDRA to Inspect Multispectral Remote Sensing Data Table: MODIS Channel Number, Wavelength (µm), and Primary Application Reflective Bands Emissive Bands 1,2 0.645, 0.865
Climate and Space. Leina Hutchinson April 8, 2019
 Climate and Space Leina Hutchinson April 8, 2019 NASA Background Originally founded as NACA (National Advisory Committee for Aeronautics) in 1915 Became NASA (National Aeronautics and Space Administration)
Using Freely Available. Remote Sensing to Create a More Powerful GIS
 Using Freely Available Government Data and Remote Sensing to Create a More Powerful GIS All rights reserved. ENVI, E3De, IAS, and IDL are trademarks of Exelis, Inc. All other marks are the property of
GEOSS Americas/Caribbean Remote Sensing Workshop November Lab 2 Investigating Cloud Phase, NDVI, Ocean Color and Sea Surface Temperatures
 GEOSS Americas/Caribbean Remote Sensing Workshop 26-30 November 2007 Lab 2 Investigating Cloud Phase, NDVI, Ocean Color and Sea Surface Temperatures Kathleen Strabala kathy.strabala@ssec.wisc.edu Table:
3/31/03. ESM 266: Introduction 1. Observations from space. Remote Sensing: The Major Source for Large-Scale Environmental Information
 Remote Sensing: The Major Source for Large-Scale Environmental Information Jeff Dozier Observations from space Sun-synchronous polar orbits Global coverage, fixed crossing, repeat sampling Typical altitude
1. INTRODUCTION. GOCI : Geostationary Ocean Color Imager
 1. INTRODUCTION The Korea Ocean Research and Development Institute (KORDI) releases an announcement of opportunity (AO) to carry out scientific research for the utilization of GOCI data. GOCI is the world
Basic Hyperspectral Analysis Tutorial
 Basic Hyperspectral Analysis Tutorial This tutorial introduces you to visualization and interactive analysis tools for working with hyperspectral data. In this tutorial, you will: Analyze spectral profiles
Plant Health Monitoring System Using Raspberry Pi
 Volume 119 No. 15 2018, 955-959 ISSN: 1314-3395 (on-line version) url: http://www.acadpubl.eu/hub/ http://www.acadpubl.eu/hub/ 1 Plant Health Monitoring System Using Raspberry Pi Jyotirmayee Dashᵃ *, Shubhangi
GOES-16 ABI On-Orbit Performance
 GOES-16 ABI On-Orbit Performance Xiangqian WU b, Fangfang YU a, Vladimir KONDRATOVICH a, Boryana EFREMOVA a, Xi SHAO a, Robert IACOVAZZI a, Haifeng QIAN a, Hye Lim YOO a, Li ZHU a, and Changyong CAO b
Geo/SAT 2 INTRODUCTION TO REMOTE SENSING
 Geo/SAT 2 INTRODUCTION TO REMOTE SENSING Paul R. Baumann, Professor Emeritus State University of New York College at Oneonta Oneonta, New York 13820 USA COPYRIGHT 2008 Paul R. Baumann Introduction Remote
Image Fusion. Pan Sharpening. Pan Sharpening. Pan Sharpening: ENVI. Multi-spectral and PAN. Magsud Mehdiyev Geoinfomatics Center, AIT
 1 Image Fusion Sensor Merging Magsud Mehdiyev Geoinfomatics Center, AIT Image Fusion is a combination of two or more different images to form a new image by using certain algorithms. ( Pohl et al 1998)
Introduction. Introduction. Introduction. Introduction. Introduction
 Identifying habitat change and conservation threats with satellite imagery Extinction crisis Volker Radeloff Department of Forest Ecology and Management Extinction crisis Extinction crisis Conservationists
60 Years of Earth Imaging from Satellites
 50 May-June 2018 60 Years of Earth Imaging from Satellites By Don Hillger and Garry Toth Satellite imagery is a common and integral part of modern life, from the frequent cloud photos used for weather
Active and Passive Microwave Remote Sensing
 Active and Passive Microwave Remote Sensing Passive remote sensing system record EMR that was reflected (e.g., blue, green, red, and near IR) or emitted (e.g., thermal IR) from the surface of the Earth.
The Global Imager (GLI)
") The Global Imager (GLI) Launch : Dec.14, 2002 Initial check out : to Apr.14, 2003 (~L+4) First image: Jan.25, 2003 Second image: Feb.6 and 7, 2003 Calibration and validation : to Dec.14, 2003(~L+4) for
The Global Imager (GLI) Launch : Dec.14, 2002 Initial check out : to Apr.14, 2003 (~L+4) First image: Jan.25, 2003 Second image: Feb.6 and 7, 2003 Calibration and validation : to Dec.14, 2003(~L+4) for
Sommersemester Prof. Dr. Christoph Kleinn Institut für Waldinventur und Waldwachstum Arbeitsbereich Fernerkundung und Waldinventur.
 Basics of Remote Sensing Some literature references Franklin, SE 2001 Remote Sensing for Sustainable Forest Management Lewis Publishers 407p Lillesand, Kiefer 2000 Remote Sensing and Image Interpretation
Remote Sensing for Rangeland Applications
 Remote Sensing for Rangeland Applications Jay Angerer Ecological Training June 16, 2012 Remote Sensing The term "remote sensing," first used in the United States in the 1950s by Ms. Evelyn Pruitt of the
Nighttime VIIRS LCLUC Applications
 Nighttime VIIRS LCLUC Applications Christopher D. Elvidge, Ph.D. Earth Observation Group NOAA National Geophysical Data Center Boulder, Colorado USA chris.elvidge@noaa.gov Kimberly Baugh, Feng Chi Hsu,
Lecture 7 Earth observation missions
 Remote sensing for agricultural applications: principles and methods (2013-2014) Instructor: Prof. Tao Cheng (tcheng@njau.edu.cn). Nanjing Agricultural University Lecture 7 Earth observation missions May
Urban Classification of Metro Manila for Seismic Risk Assessment using Satellite Images
 Urban Classification of Metro Manila for Seismic Risk Assessment using Satellite Images Fumio YAMAZAKI/ yamazaki@edm.bosai.go.jp Hajime MITOMI/ mitomi@edm.bosai.go.jp Yalkun YUSUF/ yalkun@edm.bosai.go.jp
Remote Sensing Part 3 Examples & Applications
 Remote Sensing Part 3 Examples & Applications Review: Spectral Signatures Review: Spectral Resolution Review: Computer Display of Remote Sensing Images Individual bands of satellite data are mapped to
Mod. 2 p. 1. Prof. Dr. Christoph Kleinn Institut für Waldinventur und Waldwachstum Arbeitsbereich Fernerkundung und Waldinventur
 Histograms of gray values for TM bands 1-7 for the example image - Band 4 and 5 show more differentiation than the others (contrast=the ratio of brightest to darkest areas of a landscape). - Judging from
remote sensing? What are the remote sensing principles behind these Definition
 Introduction to remote sensing: Content (1/2) Definition: photogrammetry and remote sensing (PRS) Radiation sources: solar radiation (passive optical RS) earth emission (passive microwave or thermal infrared
Microwave Remote Sensing (1)
") Microwave Remote Sensing (1) Microwave sensing encompasses both active and passive forms of remote sensing. The microwave portion of the spectrum covers the range from approximately 1cm to 1m in wavelength.
Microwave Remote Sensing (1) Microwave sensing encompasses both active and passive forms of remote sensing. The microwave portion of the spectrum covers the range from approximately 1cm to 1m in wavelength.
Light penetration within a clear water body. E z = E 0 e -kz
 THE BLUE PLANET 1 2 Light penetration within a clear water body E z = E 0 e -kz 3 4 5 6 Pure Seawater Phytoplankton b w 10-2 m -1 b w 10-2 m -1 b w, Morel (1974) a w, Pope and Fry (1997) b chl,loisel and
Remote Sensing and GIS
 Remote Sensing and GIS Atmosphere Reflected radiation, e.g. Visible Emitted radiation, e.g. Infrared Backscattered radiation, e.g. Radar (λ) Visible TIR Radar & Microwave 11/9/2017 Geo327G/386G, U Texas,
Practical Uses of Satellite Data in Forest Management
 Practical Uses of Satellite Data in Forest Management GCFF Conference April 2018 Copernicus: Sentinel-2 The Optical Imaging Mission for Land Services 1 Uses for Satellite Imagery 1. Introduction 2. Satellite
Valuable New Information for Precision Agriculture. Mike Ritter Founder & CEO - SLANTRANGE, Inc.
 Valuable New Information for Precision Agriculture Mike Ritter Founder & CEO - SLANTRANGE, Inc. SENSORS Accurate, Platform- Agnostic ANALYTICS On-Board, On-Location SLANTRANGE Delivering Valuable New Information
RADAR (RAdio Detection And Ranging)
") RADAR (RAdio Detection And Ranging) CLASSIFICATION OF NONPHOTOGRAPHIC REMOTE SENSORS PASSIVE ACTIVE DIGITAL CAMERA THERMAL (e.g. TIMS) VIDEO CAMERA MULTI- SPECTRAL SCANNERS VISIBLE & NIR MICROWAVE Real
RADAR (RAdio Detection And Ranging) CLASSIFICATION OF NONPHOTOGRAPHIC REMOTE SENSORS PASSIVE ACTIVE DIGITAL CAMERA THERMAL (e.g. TIMS) VIDEO CAMERA MULTI- SPECTRAL SCANNERS VISIBLE & NIR MICROWAVE Real
COMPATIBILITY AND INTEGRATION OF NDVI DATA OBTAINED FROM AVHRR/NOAA AND SEVIRI/MSG SENSORS
 COMPATIBILITY AND INTEGRATION OF NDVI DATA OBTAINED FROM AVHRR/NOAA AND SEVIRI/MSG SENSORS Gabriele Poli, Giulia Adembri, Maurizio Tommasini, Monica Gherardelli Department of Electronics and Telecommunication
1. Theory of remote sensing and spectrum
 1. Theory of remote sensing and spectrum 7 August 2014 ONUMA Takumi Outline of Presentation Electromagnetic wave and wavelength Sensor type Spectrum Spatial resolution Spectral resolution Mineral mapping
Multi-sensor data base over desert sites for calibration purpose. P. Henry ¹, X. Briottet ², C. Miesch ², F. Cabot ¹ ¹CNES, ²ONERA
 Multi-sensor data base over desert sites for calibration purpose P. Henry ¹, X. Briottet ², C. Miesch ², F. Cabot ¹ ¹CNES, ²ONERA Outline Introduction SADE database Calibration method Some results Desert
9/12/2011. Training Course Remote Sensing Basic Theory & Image Processing Methods September 2011
 Training Course Remote Sensing Basic Theory & Image Processing Methods 19 23 September 2011 Popular Remote Sensing Sensors & their Selection Michiel Damen (September 2011) damen@itc.nl 1 Overview Low resolution
Sea surface temperature observation through clouds by the Advanced Microwave Scanning Radiometer 2
 Sea surface temperature observation through clouds by the Advanced Microwave Scanning Radiometer 2 Akira Shibata Remote Sensing Technology Center of Japan (RESTEC) Tsukuba-Mitsui blds. 18F, 1-6-1 Takezono,
746A27 Remote Sensing and GIS. Multi spectral, thermal and hyper spectral sensing and usage
 746A27 Remote Sensing and GIS Lecture 3 Multi spectral, thermal and hyper spectral sensing and usage Chandan Roy Guest Lecturer Department of Computer and Information Science Linköping University Multi
GOES-R: Significance of Spatial Resolution in Satellite Imagery
 GOES-R: Significance of Spatial Resolution in Satellite Imagery Source/Authors: Peter Dorofy, John Moore, The Institute for Earth Observations at Palmyra Cove Nature Park, Palmyra, NJ (www.palmyracove.org).
Dirty REMOTE SENSING Lecture 3: First Steps in classifying Stuart Green Earthobservation.wordpress.com
 Dirty REMOTE SENSING Lecture 3: First Steps in classifying Stuart Green Earthobservation.wordpress.com Stuart.Green@Teagasc.ie You have your image, but is it any good? Is it full of cloud? Is it the right
Multispectral Scanners for Wildland Fire Assessment NASA Ames Research Center Earth Science Division. Bruce Coffland U.C.
 Multispectral Scanners for Wildland Fire Assessment NASA Earth Science Division Bruce Coffland U.C. Santa Cruz Slide Fire Burn Area (MASTER/B200) R 2.2um G 0.87um B 0.65um Airborne Science & Technology
Fires, Flares and Lights: Mapping Anthropogenic Emission Sources with Nighttime Low light Imaging Satellite Data
 Fires, Flares and Lights: Mapping Anthropogenic Emission Sources with Nighttime Low light Imaging Satellite Data Christopher D. Elvidge, Ph.D. Earth Observation Group NOAA National Geophysical Data Center
I nnovative I maging & R esearch I 2. Assessing and Removing AWiFS Systematic Geometric and Atmospheric Effects to Improve Land Cover Change Detection
 I nnovative I maging & esearch Assessing and emoving AWiFS Systematic Geometric and Atmospheric Effects to Improve Land Cover Change Detection Mary Pagnutti obert E. yan Spring LCLUC Science Team Meeting
Basic Digital Image Processing. The Structure of Digital Images. An Overview of Image Processing. Image Restoration: Line Drop-outs
 Basic Digital Image Processing A Basic Introduction to Digital Image Processing ~~~~~~~~~~ Rev. Ronald J. Wasowski, C.S.C. Associate Professor of Environmental Science University of Portland Portland,
Towards the Intercalibration of EO medium resolution multi-spectral imagers : MEREMSII Final Report Executive Summary
 Page : i Towards the Intercalibration of EO medium resolution multi-spectral imagers MEREMSII FINAL REPORT EXECUTIVE SUMMARY ESA contract: 4000101605/10/NL/CBi ARGANS Reference: 003-009 Date: 14 January
Module 3 Introduction to GIS. Lecture 8 GIS data acquisition
 Module 3 Introduction to GIS Lecture 8 GIS data acquisition GIS workflow Data acquisition (geospatial data input) GPS Remote sensing (satellites, UAV s) LiDAR Digitized maps Attribute Data Management Data
CCDs for Earth Observation James Endicott 1 st September th UK China Workshop on Space Science and Technology, Milton Keynes, UK
 CCDs for Earth Observation James Endicott 1 st September 2011 7 th UK China Workshop on Space Science and Technology, Milton Keynes, UK Introduction What is this talk all about? e2v sensors in spectrometers
Lab 6: Multispectral Image Processing Using Band Ratios
 Lab 6: Multispectral Image Processing Using Band Ratios due Dec. 11, 2017 Goals: 1. To learn about the spectral characteristics of vegetation and geologic materials. 2. To experiment with vegetation indices
EFFECT OF DEGRADATION ON MULTISPECTRAL SATELLITE IMAGE
 Journal of Al-Nahrain University Vol.11(), August, 008, pp.90-98 Science EFFECT OF DEGRADATION ON MULTISPECTRAL SATELLITE IMAGE * Salah A. Saleh, ** Nihad A. Karam, and ** Mohammed I. Abd Al-Majied * College
The studies began when the Tiros satellites (1960) provided man s first synoptic view of the Earth s weather systems.
 provided man s first synoptic view of the Earth s weather systems.") Remote sensing of the Earth from orbital altitudes was recognized in the mid-1960 s as a potential technique for obtaining information important for the effective use and conservation of natural resources.
Remote sensing of the Earth from orbital altitudes was recognized in the mid-1960 s as a potential technique for obtaining information important for the effective use and conservation of natural resources.
NON-PHOTOGRAPHIC SYSTEMS: Multispectral Scanners Medium and coarse resolution sensor comparisons: Landsat, SPOT, AVHRR and MODIS
 NON-PHOTOGRAPHIC SYSTEMS: Multispectral Scanners Medium and coarse resolution sensor comparisons: Landsat, SPOT, AVHRR and MODIS CLASSIFICATION OF NONPHOTOGRAPHIC REMOTE SENSORS PASSIVE ACTIVE DIGITAL