JCMT HETERODYNE DR FROM DATA TO SCIENCE
|
|
|
- Naomi Carter
- 5 years ago
- Views:
Transcription
1 JCMT HETERODYNE DR FROM DATA TO SCIENCE
2

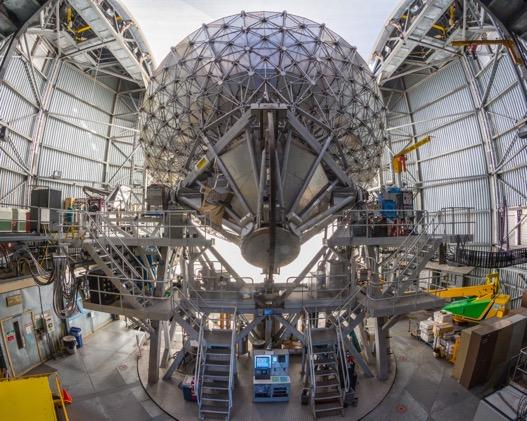
3 JCMT HETERODYNE - SHANGHAI WORKSHOP OCTOBER 2016 JCMT HETERODYNE INSTRUMENTATION RxA Single pixel receiver 230 GHz HARP 16 pixel 345 GHz array receiver ACSIS multi-channel digital spectrometer

4 JCMT HETERODYNE INSTRUMENTATION


5 THE DATA -RXA Heterodyne recieven at ASIAA RxA: GHz Single Side Band receiver. Beam is ~20 at 230GHz.
6 THE DATA - HARP HARP: GHz Single Side Band receiver. Has a instantaneous bandwidth of ~ 2 GHz and an Intermediate Frequency (IF) of 5 GHz.
7 THE DATA - HARP

8 THE DATA - HARP
9 THE DATA - HARP - OBSERVING MODES: STARE Compact source? Use a stare.

10 THE DATA - HARP - OBSERVING MODES: JIGGLE Moderate extent (less than 2 arcmins)? Use a jiggle Jiggle: moves secondary mirror to fill in the 30 spacing between HARP receptors to make a 2'x2' map. Two main spacings: HARP4 4x4 jiggle, undersampled pixels HARP5 5x5 jiggle, oversampled, 6 pixels
11 THE DATA - HARP - OBSERVING MODES: RATSER Large extent (greater than 2 arcmins)? Use a raster Raster: Scan or 'on-the-fly' technique. HARP: array rotated at deg to scan direction, with 7.3 pixels often repeated with 90 deg rotation to create 'basket-weave' maps


12 THE DATA - HARP Example: G34.3 integrated intensity images HARP Stare HARP Jiggle-map HARP Raster map 2 arcmin 2 arcmin 6 arcmin 30 pixels 6 pixels 7.25 pixels
13 THE SIGNAL PATH Slides take from: Richard Hills Talk, TIARA Summer School, Taiwan 2016
14 THE DATA - ACSIS ACSIS spectrometer options: 250 MHz bandwidth; spectral resolution MHz 1000 MHz bandwidth; spectral resolution MHz 1-4 subbands (RxA3) 1-2 subbands (HARP) (for 2 subbands resolution 0.061/0.977 MHz) e.g. for simultaneous observations of C 18 O and 13 CO for 420 MHz (2x250) and 1800 MHz (2x1000) modes the two subbands have to be merged in the reduction
15 THE DATA - ACSIS CRL2688 ACSIS examples (HARP) 250 MHz ( MHz) 420 MHz (0.061 MHz) 1000 MHz (0.488 MHz) 1800 MHz (0.977 MHz) G34.3 2x250 MHz (0.061 MHz) 13 CO(3-2)+C 18 O(3-2)
16 Pointing The Observatory Focus Calibration The data Raw data format Reduce the data The Astronomer First Het DR Session Examine the reduced data Second Het DR Session
17 POINTING We have a known position, converted from sky frame to azimuth and elevation taking into account several locational, time and astronomical factors The telescope is imperfect uneven track, temperature changes between front and back legs (6 /degree) etc We must therefore point (and re-point throughout the night typically every hour to two hours or so). The observatory monitors nightly/weekly pointing offsets to look for systematic offsets/trends in this data
18 POINTING Observe bright point source: GL5379 Investigation via GAIA. A clear difference in line intensity can be seen when comparing the left vs. right spectra from our five point pointing pattern (meaning a pointing change is expected):

19 POINTING Observe bright point source: GL5379 Investigation via GAIA. A clear difference in line intensity can be seen when comparing the left vs. right spectra from our five point pointing pattern (meaning a pointing change is expected):

20 POINTING Identify/select spectral line to analyze for pointing (remember we know the expected line brightness):
: 2 3 1 with requested changes: 3.43 arcsec in AZ and -4.")
21 POINTING Reduction result - with current peak and requested peak change (with the knowledge of the expected intensity): with requested changes: 3.43 arcsec in AZ and arcsec in EL
22 FOCUS During a focus the secondary mirror is moved in 0.3mm increments closer and further away the nominal position through a total of seven positions. A gaussian fit to the result enables us to establish where the signal strength is the strongest. we do this in x y and z-axis. We do a single x, y and z-axis focus at the start of every night The telescope is imperfect and so we require repeated z-axis focus taken throughout the night as the dome temperature changes.
; again selecting")
23 FOCUS Seven focus spectra stacked(crl2688); again selecting spectral line:

24 FOCUS Focus reduction result (Gaussian fit to seven points representing the line peak of each of seven spectra): Done in the blink of an eye by the Telescope Operator - typically nothing you need to worry about as an observer
25 CALIBRATION INTERNAL - DATA INTO T A * Every observation is calibrated to T A * (a reminder you are a Radio Astronomer!) We know the temperature based on internal instrument calibration on hot and cold loads and knowledge of the ambient temperatures. We check this temperature scale against sources of known brightnesses. We do this throughout the night for various frequencies and bandwidths. From these observations we also monitor the calibration of the telescope over a longer period of time.

26 CALIBRATION SOURCES - CHECK FOR PERFORMANCE
27 JCMT DR1: HETERODYNE DR FROM DATA TO SCIENCE
28 JCMT DR1 - SHANGHAI WORKSHOP OCTOBER 2016 THE DATA - INSPECTING THE RAW DATA software: STARLINK, packages: KAPPA various analysis tools, i.e. fitslist, hdstrace, ndftrace GAIA GUI based visualization and analysis, including data cubes SPLAT GUI based visualization an analysis for spectra
29 JCMT DR1 - SHANGHAI WORKSHOP OCTOBER 2016 THE DATA - THE RAW DATA - FILENAMES One subband: a _00006_01_0001.sdf Two subbands: a _00006_01_0001.sdf a _00006_02_0001.sdf Large maps: a _00006_01_0001.sdf a _00006_01_0002.sdf etc a (ACSIS) UT-date Scan number Subband number File number Easiest is to make a text file myfiles.list with a list of file names to be reduced. Files are cubes with dimensions Velocity/Receptor/Time, viewable with GAIA.
30 JCMT DR1 - SHANGHAI WORKSHOP OCTOBER 2016 THE DATA - INSPECTING THE RAW DATA AIM (1/2) - By the end of this session you should know: How are the raw data arranged? What were the typical system and receiver temperatures observed? What object/frequency did you look at? What was the 225GHz opacity of the observation (how transparent was the atmosphere)? What was the elevation when the observation was taken? - estimate of the expected rms

31 JCMT DR1 - SHANGHAI WORKSHOP OCTOBER 2016 THE DATA - GENERIC REDUCTION When reducing our HARP data we will be running a Data reduction pipeline - ORACDR - a data driven pipeline A file containing code performing a meaningful data reduction step A file containing a list of individual data reduction steps. A file containing code performing a meaningful data reduction step

32 JCMT DR1 - SHANGHAI WORKSHOP OCTOBER 2016
33 JCMT DR1 - SHANGHAI WORKSHOP OCTOBER 2016 But don't get overwhelmed by in this the takeaway point is that the pipeline does an automatic reduction on your data for more info: you need to sanity check the output and adjust as needed!
34 JCMT DR1 - SHANGHAI WORKSHOP OCTOBER 2016 Recipe Description of emission Baseline method Narrowline One or more narrow lines are expected across the band. Select this recipe if the expected lines are less than about 8 km/s wide. Smoothing: Spatial = 5x5 pixels Frequency = 10 channels Broadline Gradient Lineforest This recipe is designed for wide lines that extend over a large fraction of the band. The line is typically too weak to see in a single observation so a pre-determined baseline window and linear baselines are used. Typically one moderately wide line is expected, for which the center velocity varies significantly across the field. The expected lines should be wider than about 8 km/s and probably not wider than 20% of the available bandwidth. A forest of lines is expected across the band. Optionally separate moments map for each line are created. Uses the outer 10% of each end of the spectra to fit a firstorder polynomial. Smoothing: Spatial = 3x3 pixels Frequency = 25 channels Smoothing: Spatial = none Frequency = 10 channels Examples of typical spectra for broadline, narrowline, continuum, lineforest recipes Narrowline: linewidth < 8 km/s Gradient: 8 km/s < linewidth < 40 km/s Broadline: linewidth > 40 km/s (but those limits are not well-defined) for more info:
35 JCMT DR1 - SHANGHAI WORKSHOP OCTOBER 2016 THE DATA - GENERIC REDUCTION AIM (2/2) - By the end of the session you should: Run the raw data through the ORAC-DR pipeline Obtained a reduced cube of your chosen object Opened up your cube in >> gaia Examined a spectrum in >> splat Calculated the rms in your spectrum, for a given resolution If you have a single line: Estimate the peak temperature, if you have a basket weave produce an integrated intensity map.
36 JCMT DR2: HETERODYNE DR FROM DATA TO SCIENCE
37 JCMT DR2 - SHANGHAI WORKSHOP OCTOBER 2016 Tailoring the reduction Reduction recipes offered Bespoke reduction Checking the calibration Applying correction factors Examining the data Extracting the science!

38 JCMT DR2 - SHANGHAI WORKSHOP OCTOBER 2016 INITIAL REDUCTION - FROM DR1 SESSION
39 JCMT DR2 - SHANGHAI WORKSHOP OCTOBER 2016 T A * TO SOURCE TEMPERATURE η MB - converting to T MB efficiency - looking at the Power from central telescope main beam use if source size < main beam size estimates come from planet observations η fss - converting to T R * efficiency - looking at the Power from across the main beam and side lobes use if source size > main beam size estimates come from moon observations
40 JCMT DR2 - SHANGHAI WORKSHOP OCTOBER 2016 PLANETARY EFFICIENCIES
41 JCMT DR2 - SHANGHAI WORKSHOP OCTOBER 2016 AN ADDITIONAL STEP: RXA - SIDEBAND RATIO CORRECTION

42 JCMT DR2 - SHANGHAI WORKSHOP OCTOBER 2016 AN ADDITIONAL STEP: RXA - SIDEBAND RATIO CORRECTION
43 JCMT DR2 - SHANGHAI WORKSHOP OCTOBER 2016 THE DATA - ADVANCED REDUCTION AIM (1/2) - By the end of this session you should know: How to run with a reduction of your choosing or a different reduction to the one specified beware unless reduced in new directory files will be overwritten Choose a specific recipe, specify the binning/pixels Apply an efficiency factor to your data
44 JCMT DR2 - SHANGHAI WORKSHOP OCTOBER 2016 THE DATA - EXTRACTING SCIENCE AIM (2/2) - By the end of this session you should know: How to produce channel maps (cube) How to produce position-velocity diagrams (cubes) How to find clumps How to produce a grid of spectra if time: Investigate GAIA s tools - catalogs, GAIA3D, contouring
Heterodyne Calibration
 Heterodyne Calibration Sarah Graves (With a great deal of help from all at EAO, especially Jan Wouterloot and Per Friberg) 1/32 Overview 1)Calibration applied while observing: Carried out by telescope
Guide to observation planning with GREAT
 Guide to observation planning with GREAT G. Sandell GREAT is a heterodyne receiver designed to observe spectral lines in the THz region with high spectral resolution and sensitivity. Heterodyne receivers
The Heterodyne Instrument for the Far-Infrared (HIFI) and its data
 and its data") The Heterodyne Instrument for the Far-Infrared (HIFI) and its data D. Teyssier ESAC 28/10/2016 Outline 1. What was HIFI and how did it work 2. What was HIFI good for science cases 3. The HIFI calibration
The Heterodyne Instrument for the Far-Infrared (HIFI) and its data D. Teyssier ESAC 28/10/2016 Outline 1. What was HIFI and how did it work 2. What was HIFI good for science cases 3. The HIFI calibration
German Receiver for Astronomy at THz Frequencies
 German Receiver for Astronomy at THz Frequencies ATM 1-5 THz, 14 km altitude German SOFIA workshop 28,02.2011 Page 1 GREAT - the Consortium GREAT, L#1 & L#2 channels PI-Instrument funded and developed
Wide-Band Imaging. Outline : CASS Radio Astronomy School Sept 2012 Narrabri, NSW, Australia. - What is wideband imaging?
 Wide-Band Imaging 24-28 Sept 2012 Narrabri, NSW, Australia Outline : - What is wideband imaging? - Two Algorithms Urvashi Rau - Many Examples National Radio Astronomy Observatory Socorro, NM, USA 1/32
ALMA Memo #289 Atmospheric Noise in Single Dish Observations Melvyn Wright Radio Astronomy Laboratory, University of California, Berkeley 29 February
 ALMA Memo #289 Atmospheric Noise in Single Dish Observations Melvyn Wright Radio Astronomy Laboratory, University of California, Berkeley 29 February 2000 Abstract Atmospheric noise and pointing fluctuations
Observing Techniques and Calibration. David Frayer (Green Bank Observatory)
") Observing Techniques and Calibration David Frayer (Green Bank Observatory) The GBT provides a lot of observing choices Pick receiver based on frequency Pick backend based on observing type (line, continuum,
Observing Techniques and Calibration David Frayer (Green Bank Observatory) The GBT provides a lot of observing choices Pick receiver based on frequency Pick backend based on observing type (line, continuum,
The 4mm (68-92 GHz) Receiver
 Receiver") Chapter 18 The 4mm (68-92 GHz) Receiver 18.1 Overview The 4 mm receiver ( W-band ) is a dual-beam, dual-polarization receiver which covers the frequency range of approximately 67-93 GHz. The performance
Chapter 18 The 4mm (68-92 GHz) Receiver 18.1 Overview The 4 mm receiver ( W-band ) is a dual-beam, dual-polarization receiver which covers the frequency range of approximately 67-93 GHz. The performance
Radio Frequency Monitoring for Radio Astronomy
 Radio Frequency Monitoring for Radio Astronomy Purpose, Methods and Formats Albert-Jan Boonstra IUCAF RFI-Mitigation Workshop Bonn, March 28-30, 2001 Contents Monitoring goals in radio astronomy Operational
Technical Considerations: Nuts and Bolts Project Planning and Technical Justification
 Technical Considerations: Nuts and Bolts Project Planning and Technical Justification Atacama Large Millimeter/submillimeter Array Expanded Very Large Array Robert C. Byrd Green Bank Telescope Very Long
Commissioning Report for the ATCA L/S Receiver Upgrade Project
 Commissioning Report for the ATCA L/S Receiver Upgrade Project N. M. McClure-Griffiths, J. B. Stevens, & S. P. O Sullivan 8 June 211 1 Introduction The original Australia Telescope Compact Array (ATCA)
Planning ALMA Observations
 Planning Observations Atacama Large mm/sub-mm Array Mark Lacy North American Science Center Atacama Large Millimeter/submillimeter Array Expanded Very Large Array Robert C. Byrd Green Bank Telescope Very
Recent progress and future development of Nobeyama 45-m Telescope
 Recent progress and future development of Nobeyama 45-m Telescope Masao Saito: Director of Nobeyama Radio Observatory Tetsuhiro Minamidani: Nobeyama Radio Observatory Outline Nobeyama 45-m Telescope Recent
The Cosmic Microwave Background Radiation B. Winstein, U of Chicago
 The Cosmic Microwave Background Radiation B. Winstein, U of Chicago Lecture #1 Lecture #2 What is it? How its anisotropies are generated? What Physics does it reveal? How it is measured. Lecture #3 Main
EVLA Scientific Commissioning and Antenna Performance Test Check List
 EVLA Scientific Commissioning and Antenna Performance Test Check List C. J. Chandler, C. L. Carilli, R. Perley, October 17, 2005 The following requirements come from Chapter 2 of the EVLA Project Book.
esma SOFTWARE INTERFACE Mark Bentum Version 0.3 August 10, 2005
 esma SOFTWARE INTERFACE Mark Bentum Version 0.3 August 10, 2005 In this document the software issues of the esma will be discussed. The esma, the extended Submillimeter Array, is a visiting instrument
ATCA Antenna Beam Patterns and Aperture Illumination
 1 AT 39.3/116 ATCA Antenna Beam Patterns and Aperture Illumination Jared Cole and Ravi Subrahmanyan July 2002 Detailed here is a method and results from measurements of the beam characteristics of the
Spectral Line II: Calibration and Analysis. Spectral Bandpass: Bandpass Calibration (cont d) Bandpass Calibration. Bandpass Calibration
 Bandpass Calibration. Bandpass Calibration") Spectral Line II: Calibration and Analysis Bandpass Calibration Flagging Continuum Subtraction Imaging Visualization Analysis Spectral Bandpass: Spectral frequency response of antenna to a spectrally flat
Spectral Line II: Calibration and Analysis Bandpass Calibration Flagging Continuum Subtraction Imaging Visualization Analysis Spectral Bandpass: Spectral frequency response of antenna to a spectrally flat
Wide Bandwidth Imaging
 Wide Bandwidth Imaging 14th NRAO Synthesis Imaging Workshop 13 20 May, 2014, Socorro, NM Urvashi Rau National Radio Astronomy Observatory 1 Why do we need wide bandwidths? Broad-band receivers => Increased
Observing Modes and Real Time Processing
 2010-11-30 Observing with ALMA 1, Observing Modes and Real Time Processing R. Lucas November 30, 2010 Outline 2010-11-30 Observing with ALMA 2, Observing Modes Interferometry Modes Interferometry Calibrations
HERA User Manual. The commissioning team version 2.0. November 18, 2009
 HERA User Manual The commissioning team version 2.0 November 18, 2009 1 Introduction The HEterodyne Receiver Array HERA is a receiver system with 18 SIS mixers tunable from 215 to 272 GHz arranged in a
To print higher-resolution math symbols, click the Hi-Res Fonts for Printing button on the jsmath control panel.
 To print higher-resolution math symbols, click the Hi-Res Fonts for Printing button on the jsmath control panel. Radiometers Natural radio emission from the cosmic microwave background, discrete astronomical
Southern African Large Telescope. RSS CCD Geometry
 Southern African Large Telescope RSS CCD Geometry Kenneth Nordsieck University of Wisconsin Document Number: SALT-30AM0011 v 1.0 9 May, 2012 Change History Rev Date Description 1.0 9 May, 2012 Original
Evolution of the Capabilities of the ALMA Array
 Evolution of the Capabilities of the ALMA Array This note provides an outline of how we plan to build up the scientific capabilities of the array from the start of Early Science through to Full Operations.
Dealing with Noise. Stéphane GUILLOTEAU. Laboratoire d Astrophysique de Bordeaux Observatoire Aquitain des Sciences de l Univers
 Dealing with Noise Stéphane GUILLOTEAU Laboratoire d Astrophysique de Bordeaux Observatoire Aquitain des Sciences de l Univers I - Theory & Practice of noise II Low S/N analysis Outline 1. Basic Theory
Sideband Smear: Sideband Separation with the ALMA 2SB and DSB Total Power Receivers
 and DSB Total Power Receivers SCI-00.00.00.00-001-A-PLA Version: A 2007-06-11 Prepared By: Organization Date Anthony J. Remijan NRAO A. Wootten T. Hunter J.M. Payne D.T. Emerson P.R. Jewell R.N. Martin
Plan for Imaging Algorithm Research and Development
 Plan for Imaging Algorithm Research and Development S. Bhatnagar July 05, 2009 Abstract Many scientific deliverables of the next generation radio telescopes require wide-field imaging or high dynamic range
PdBI data calibration. Vincent Pie tu IRAM Grenoble
 PdBI data calibration Vincent Pie tu IRAM Grenoble IRAM mm-interferometry School 2008 1 Data processing strategy 2 Data processing strategy Begins with proposal/setup preparation. Depends on the scientific
NHSC/PACS Webinar. Aperture and pointing corrections for point sources
 NHSC/PACS Webinar Aperture and pointing corrections for point sources D. Fadda December 13, 2012 page 1 Introduction This web-seminar will introduce you to the aperture correction and pointing/jitter correction
Recent imaging results with wide-band EVLA data, and lessons learnt so far
 Recent imaging results with wide-band EVLA data, and lessons learnt so far Urvashi Rau National Radio Astronomy Observatory (USA) 26 Jul 2011 (1) Introduction : Imaging wideband data (2) Wideband Imaging
ALMA water vapour radiometer project
 ALMA water vapour radiometer project Why water vapour radiometers? Science requirements/instrument specifications Previous work ALMA Phase 1 work Kate Isaak and Richard Hills Cavendish Astrophysics, Cambridge
EVLA Memo #166 Comparison of the Performance of the 3-bit and 8-bit Samplers at C (4 8 GHz), X (8 12 GHz) and Ku (12 18 GHz) Bands
, X (8 12 GHz) and Ku (12 18 GHz) Bands") EVLA Memo #166 Comparison of the Performance of the 3-bit and 8-bit Samplers at C (4 8 GHz), X (8 12 GHz) and Ku (12 18 GHz) Bands E. Momjian and R. Perley NRAO March 27, 2013 Abstract We present sensitivity
EVLA Memo #166 Comparison of the Performance of the 3-bit and 8-bit Samplers at C (4 8 GHz), X (8 12 GHz) and Ku (12 18 GHz) Bands E. Momjian and R. Perley NRAO March 27, 2013 Abstract We present sensitivity
Chapter 3. Instrumentation. 3.1 Telescope Site Layout. 3.2 Telescope Optics
 Chapter 3 Instrumentation 3.1 Telescope Site Layout The 12m is located on the southwest ridge of Kitt Peak, about two miles below the top of the mountain. Other telescopes on the southwest ridge are the
Components of Imaging at Low Frequencies: Status & Challenges
 Components of Imaging at Low Frequencies: Status & Challenges Dec. 12th 2013 S. Bhatnagar NRAO Collaborators: T.J. Cornwell, R. Nityananda, K. Golap, U. Rau J. Uson, R. Perley, F. Owen Telescope sensitivity
Argus Users Guide. David Frayer (Green Bank Observatory)
") Argus Users Guide David Frayer (Green Bank Observatory) Observer Information Ø Argus Observer s Web page: www.gb.nrao.edu/argus Ø Example Argus observing scripts are located at: /home/astro-util/projects/argus/obs
Argus Users Guide David Frayer (Green Bank Observatory) Observer Information Ø Argus Observer s Web page: www.gb.nrao.edu/argus Ø Example Argus observing scripts are located at: /home/astro-util/projects/argus/obs
Hewett 1 Imaged by Amateur
 Hewett 1 Imaged by Amateur Largest Planetary Nebula in Sky reported by Hewett, et al on 4 Nov2003. Estimated to be 2 degrees diameter Serendipitous discovery by spectral analysis of Sloan Survey data Emission
LOFAR DATA SCHOOL 2016
 LOFAR DATA SCHOOL 2016 Tied Array Imaging (II), with contributions from: RRL group Scintillation (R. Fallows) Pulsar Working Group Radio Observatory Outline Tools Calibration (Cyg A imaging) Beams Scientific
PACS SED and large range scan AOT release note PACS SED and large range scan AOT release note
 Page: 1 of 16 PACS SED and large range scan AOT PICC-KL-TN-039 Prepared by Bart Vandenbussche Alessandra Contursi Helmut Feuchtgruber Ulrich Klaas Albrecht Poglitsch Pierre Royer Roland Vavrek Approved
Introduction to Radio Astronomy!
 Introduction to Radio Astronomy! Sources of radio emission! Radio telescopes - collecting the radiation! Processing the radio signal! Radio telescope characteristics! Observing radio sources Sources of
Comparing MMA and VLA Capabilities in the GHz Band. Socorro, NM Abstract
 Comparing MMA and VLA Capabilities in the 36-50 GHz Band M.A. Holdaway National Radio Astronomy Observatory Socorro, NM 87801 September 29, 1995 Abstract I explore the capabilities of the MMA and the VLA,
Atacama Large Millimeter/submillimeter Array Expanded Very Large Array Robert C. Byrd Green Bank Telescope Very Long Baseline Array
 Atacama Large Millimeter/submillimeter Array Expanded Very Large Array Robert C. Byrd Green Bank Telescope Very Long Baseline Array Self-Calibration Ed Fomalont (NRAO) ALMA Data workshop Dec. 2, 2011 Atacama
Symmetry in the Ka-band Correlation Receiver s Input Circuit and Spectral Baseline Structure NRAO GBT Memo 248 June 7, 2007
 Symmetry in the Ka-band Correlation Receiver s Input Circuit and Spectral Baseline Structure NRAO GBT Memo 248 June 7, 2007 A. Harris a,b, S. Zonak a, G. Watts c a University of Maryland; b Visiting Scientist,
Multiplying Interferometers
 Multiplying Interferometers L1 * L2 T + iv R1 * R2 T - iv L1 * R2 Q + iu R1 * L2 Q - iu Since each antenna can output both L and R polarization, all 4 Stokes parameters are simultaneously measured without
Spectral Line Imaging
 ATNF Synthesis School 2003 Spectral Line Imaging Juergen Ott (ATNF) Juergen.Ott@csiro.au Topics Introduction to Spectral Lines Velocity Reference Frames Bandpass Calibration Continuum Subtraction Gibbs
High Fidelity Imaging of Extended Sources. Rick Perley NRAO Socorro, NM
 High Fidelity Imaging of Extended Sources Rick Perley NRAO Socorro, NM A Brief History of Calibration (VLA) An Amazing Fact: The VLA was proposed, and funded, without any real concept of how to calibrate
Spectral Line Observing
 Spectral Line Observing Ylva Pihlström, UNM Eleventh Synthesis Imaging Workshop Socorro, June 10-17, 2008 Introduction 2 Spectral line observers use many channels of width δν, over a total bandwidth Δν.
HIFI Pipelines and Data Products
 Adwin Boogert, NHSC/IPAC, Pasadena, CA, USA Thanks to: Pat Morris, Carolyn McCoey, Jesus Martin Pintado, Colin Borys, Russ Shipman, Steve Lord CH3CN at 765.5 GHz WBS H Herschel DP Workshop ESAC, Madrid,
GBT Spectral-Line Data Reduction and Tutorials. David Frayer (Green Bank Observatory)
") GBT Spectral-Line Data Reduction and Tutorials David Frayer (Green Bank Observatory) www.gb.nrao.edu/cde2017 Click to login into Green Bank GBO startkde on Processing Machine ssh planck startkde Public
GBT Spectral-Line Data Reduction and Tutorials David Frayer (Green Bank Observatory) www.gb.nrao.edu/cde2017 Click to login into Green Bank GBO startkde on Processing Machine ssh planck startkde Public
Presented by Jerry Hubbell Lake of the Woods Observatory (MPC I24) President, Rappahannock Astronomy Club
 President, Rappahannock Astronomy Club") Presented by Jerry Hubbell Lake of the Woods Observatory (MPC I24) President, Rappahannock Astronomy Club ENGINEERING A FIBER-FED FED SPECTROMETER FOR ASTRONOMICAL USE Objectives Discuss the engineering
Presented by Jerry Hubbell Lake of the Woods Observatory (MPC I24) President, Rappahannock Astronomy Club ENGINEERING A FIBER-FED FED SPECTROMETER FOR ASTRONOMICAL USE Objectives Discuss the engineering
ALMA Memo 553. First Astronomical Observations with an ALMA Band 6 ( GHz) Sideband-Separating SIS Mixer-Preamp
 Sideband-Separating SIS Mixer-Preamp") Presented at the 17 th International Symposium on Space Terahertz Technology, Paris, May 2006. http://www.alma.nrao.edu/memos/ ALMA Memo 553 15 August 2006 First Astronomical Observations with an ALMA
Presented at the 17 th International Symposium on Space Terahertz Technology, Paris, May 2006. http://www.alma.nrao.edu/memos/ ALMA Memo 553 15 August 2006 First Astronomical Observations with an ALMA
G. Serra.
 G. Serra gserra@oa-cagliari.inaf.it on behalf of Metrology team* *T. Pisanu, S. Poppi, F.Buffa, P. Marongiu, R. Concu, G. Vargiu, P. Bolli, A. Saba, M.Pili, E.Urru Astronomical Observatory of Cagliari
Imaging Simulations with CARMA-23
 BIMA memo 101 - July 2004 Imaging Simulations with CARMA-23 M. C. H. Wright Radio Astronomy laboratory, University of California, Berkeley, CA, 94720 ABSTRACT We simulated imaging for the 23-antenna CARMA
Planning (VLA) observations
 observations") Planning () observations 14 th Synthesis Imaging Workshop (May 2014) Loránt Sjouwerman National Radio Astronomy Observatory (Socorro, NM) Atacama Large Millimeter/submillimeter Array Karl G. Jansky Very
Planning () observations 14 th Synthesis Imaging Workshop (May 2014) Loránt Sjouwerman National Radio Astronomy Observatory (Socorro, NM) Atacama Large Millimeter/submillimeter Array Karl G. Jansky Very
Spectral Line Bandpass Removal Using a Median Filter Travis McIntyre The University of New Mexico December 2013
 Spectral Line Bandpass Removal Using a Median Filter Travis McIntyre The University of New Mexico December 2013 Abstract For spectral line observations, an alternative to the position switching observation
REDUCTION OF ALMA DATA USING CASA SOFTWARE
 REDUCTION OF ALMA DATA USING CASA SOFTWARE Student: Nguyen Tran Hoang Supervisor: Pham Tuan Anh Hanoi, September - 2016 1 CONTENS Introduction Interferometry Scientific Target M100 Calibration Imaging
NIRSPEC Data Reduction Pipeline Data Products Specification
 NIRSPEC Data Reduction Pipeline Data Products Specification Table of Contents 1 Introduction... 2 2 Data Products... 2 2.1 Tables...2 2.1.1 Table Format...2 2.1.2 Flux Table...3 2.1.3 Profile Table...4
arxiv:astro-ph/ v1 21 Jun 2006
 Ð Ú Ø ÓÒ Ò Ð Ô Ò Ò Ó Ø ËÅ ÒØ ÒÒ ÓÙ ÔÓ Ø ÓÒ Satoki Matsushita a,c, Masao Saito b,c, Kazushi Sakamoto b,c, Todd R. Hunter c, Nimesh A. Patel c, Tirupati K. Sridharan c, and Robert W. Wilson c a Academia
More Radio Astronomy
 More Radio Astronomy Radio Telescopes - Basic Design A radio telescope is composed of: - a radio reflector (the dish) - an antenna referred to as the feed on to which the radiation is focused - a radio
Single Dish Observing Techniques and Calibration
 Single Dish Observing Techniques and Calibration David Frayer (NRAO) {some slides taken from past presentations of Ron Maddalena and Karen O Neil} What does the telescope measure: Ta = antenna temperature
HIFI Pipelines and Data Products
 Carolyn McCoey, Adwin Boogert, Pat Morris, Jesus Martin-Pintado, Colin Borys, Russ Shipman, Steve Lord CH3CN at 765.5 GHz WBS-H Herschel DP Workshop ESAC, Madrid, E, 2009 March 24-27 page 1 HIFI instrument
A Quick Review. Spectral Line Calibration Techniques with Single Dish Telescopes. The Rayleigh-Jeans Approximation. Antenna Temperature
 Spectral Line Calibration Techniques with Single Dish Telescopes A Quick Review K. O Neil NRAO - GB A Quick Review A Quick Review The Rayleigh-Jeans Approximation Antenna Temperature Planck Law for Blackbody
Calibrating VISTA Data
 Calibrating VISTA Data IR Camera Astronomy Unit Queen Mary University of London Cambridge Astronomical Survey Unit, Institute of Astronomy, Cambridge Jim Emerson Simon Hodgkin, Peter Bunclark, Mike Irwin,
Locally Optimized Combination of Images (LOCI) Algorithm
 Algorithm") Locally Optimized Combination of Images (LOCI) Algorithm Keck NIRC2 Implementation using Matlab Justin R. Crepp 1. INTRODUCTION Of the myriad post-processing techniques used to reduce highcontrast imaging
Locally Optimized Combination of Images (LOCI) Algorithm Keck NIRC2 Implementation using Matlab Justin R. Crepp 1. INTRODUCTION Of the myriad post-processing techniques used to reduce highcontrast imaging
Millimetre and Radio Astronomy Techniques for Star Forma:on Studies II
 Millimetre and Radio Astronomy Techniques for Star Forma:on Studies II John Conway Onsala Space Observatory, Sweden &Nordic ALMA ARC node (john.conway@chalmers.se) Today prac:cal details... For details
Wide-field, wide-band and multi-scale imaging - II
 Wide-field, wide-band and multi-scale imaging - II Radio Astronomy School 2017 National Centre for Radio Astrophysics / TIFR Pune, India 28 Aug 8 Sept, 2017 Urvashi Rau National Radio Astronomy Observatory,
LOFAR update: long baselines and other random topics
 LOFAR update: long baselines and other random topics AIfA/MPIfR lunch colloquium Olaf Wucknitz wucknitz@astro.uni-bonn.de Bonn, 6th April 20 LOFAR update: long baselines and other random topics LOFAR previous
Radiometric Solar Telescope (RaST) The case for a Radiometric Solar Imager,
 The case for a Radiometric Solar Imager,") SORCE Science Meeting 29 January 2014 Mark Rast Laboratory for Atmospheric and Space Physics University of Colorado, Boulder Radiometric Solar Telescope (RaST) The case for a Radiometric Solar Imager,
SORCE Science Meeting 29 January 2014 Mark Rast Laboratory for Atmospheric and Space Physics University of Colorado, Boulder Radiometric Solar Telescope (RaST) The case for a Radiometric Solar Imager,
JCMT Work Packages for the esma Phase I & II, 230 GHz tests
 JCMT Work Packages for the esma Phase I & II, 230 GHz tests Huib Jan van Langevelde, Per Friberg, Remo Tilanus Version 1.1; 2004/12/21 1. Introduction This document attempts to disseminate the work required
Observing with Argus. David Frayer (Green Bank Observatory) Version
 Version") Observing with Argus David Frayer (Green Bank Observatory) Version 2017.12 1 Index 4 Argus Block Diagram 5 Argus Array Orientation 6-9 Argus Performance 10-11 Must read for Argus observers 12-16 Preparing
Observing with Argus David Frayer (Green Bank Observatory) Version 2017.12 1 Index 4 Argus Block Diagram 5 Argus Array Orientation 6-9 Argus Performance 10-11 Must read for Argus observers 12-16 Preparing
Introduction to Imaging in CASA
 Introduction to Imaging in CASA Mark Rawlings, Juergen Ott (NRAO) Atacama Large Millimeter/submillimeter Array Expanded Very Large Array Robert C. Byrd Green Bank Telescope Very Long Baseline Array Overview
SOAR Integral Field Spectrograph (SIFS): Call for Science Verification Proposals
: Call for Science Verification Proposals") Published on SOAR (http://www.ctio.noao.edu/soar) Home > SOAR Integral Field Spectrograph (SIFS): Call for Science Verification Proposals SOAR Integral Field Spectrograph (SIFS): Call for Science Verification
Published on SOAR (http://www.ctio.noao.edu/soar) Home > SOAR Integral Field Spectrograph (SIFS): Call for Science Verification Proposals SOAR Integral Field Spectrograph (SIFS): Call for Science Verification
ACIS ( , ) total e e e e-11 1.
 total e e e e-11 1.") 1 SUMMARY 1 SNR 0509-68.7 1 Summary Common Name: N 103B Distance: 50 kpc (distance to LMC, Westerlund(1990) ) Center of X-ray emission (J2000): ( 05 08 59.7, -68 43 35.5 ) X-ray size: 32 x 30 Description:??
1 SUMMARY 1 SNR 0509-68.7 1 Summary Common Name: N 103B Distance: 50 kpc (distance to LMC, Westerlund(1990) ) Center of X-ray emission (J2000): ( 05 08 59.7, -68 43 35.5 ) X-ray size: 32 x 30 Description:??
Next Generation Very Large Array Memo No. 47 Resolution and Sensitivity of ngvla-revb. C.L. Carilli (NRAO)
") Next Generation Very Large Array Memo No. 47 Resolution and Sensitivity of ngvla-revb C.L. Carilli (NRAO) Abstract I investigate the noise performance vs. resolution for the new ngvlarevb configuration.
Next Generation Very Large Array Memo No. 47 Resolution and Sensitivity of ngvla-revb C.L. Carilli (NRAO) Abstract I investigate the noise performance vs. resolution for the new ngvlarevb configuration.
A new K-band (18-26 GHz) 7-horn multi-feed receiver: Calibration campaign at Medicina 32 m dish
 7-horn multi-feed receiver: Calibration campaign at Medicina 32 m dish") A new K-band (18-26 GHz) 7-horn multi-feed receiver: Calibration campaign at Medicina 32 m dish R.Verma, G.Maccaferri, A.Orfei I.Prandoni, L.Gregorini IRA 430/09 Contents 1 6 1.1 Goals............................................
A new K-band (18-26 GHz) 7-horn multi-feed receiver: Calibration campaign at Medicina 32 m dish R.Verma, G.Maccaferri, A.Orfei I.Prandoni, L.Gregorini IRA 430/09 Contents 1 6 1.1 Goals............................................
NHSC/PACS Web Tutorials Running the PACS Spectrometer pipeline for CHOP/NOD Mode. PACS-301 Level 0 to 1 processing
 NHSC/PACS s Running the PACS Spectrometer pipeline for CHOP/NOD Mode page 1 PACS-301 Level 0 to 1 processing Prepared by Dario Fadda September 2012 Introduction This tutorial will guide you through the
6. Very low level processing (radiometric calibration)
") Master ISTI / PARI / IV Introduction to Astronomical Image Processing 6. Very low level processing (radiometric calibration) André Jalobeanu LSIIT / MIV / PASEO group Jan. 2006 lsiit-miv.u-strasbg.fr/paseo
Master ISTI / PARI / IV Introduction to Astronomical Image Processing 6. Very low level processing (radiometric calibration) André Jalobeanu LSIIT / MIV / PASEO group Jan. 2006 lsiit-miv.u-strasbg.fr/paseo
A Crash Course in CASA With a focus on calibration
 A Crash Course in CASA With a focus on calibration CASA team NRAO Atacama Large Millimeter/submillimeter Array Expanded Very Large Array Robert C. Byrd Green Bank Telescope Very Long Baseline Array CASA
Introduction to Radio Interferometry Sabrina Stierwalt Alison Peck, Jim Braatz, Ashley Bemis
 Introduction to Radio Interferometry Sabrina Stierwalt Alison Peck, Jim Braatz, Ashley Bemis Atacama Large Millimeter/submillimeter Array Expanded Very Large Array Robert C. Byrd Green Bank Telescope Very
Spectral and Radiometric characteristics of MTG-IRS. Dorothee Coppens, Bertrand Theodore
 Spectral and Radiometric characteristics of MTG-IRS Dorothee Coppens, Bertrand Theodore 1 ECMWF workshop on Assimilation of Hyper-spectral Geostationary Satellite Observations 22-25 May 2017 Outlines 1)
328 IMPROVING POLARIMETRIC RADAR PARAMETER ESTIMATES AND TARGET IDENTIFICATION : A COMPARISON OF DIFFERENT APPROACHES
 328 IMPROVING POLARIMETRIC RADAR PARAMETER ESTIMATES AND TARGET IDENTIFICATION : A COMPARISON OF DIFFERENT APPROACHES Alamelu Kilambi 1, Frédéric Fabry, Sebastian Torres 2 Atmospheric and Oceanic Sciences,
PACS data reduction for the PEP deep extragalactic survey
 PACS data reduction for the PEP deep extragalactic survey D. Lutz, P. Popesso, S. Berta and the PEP reduction team Herschel map making workshop Jan 28-31 2013 Ugly! Boring! how do we detect yet more of
When, why and how to self-cal Nathan Brunetti, Crystal Brogan, Amanda Kepley
 When, why and how to self-cal Nathan Brunetti, Crystal Brogan, Amanda Kepley Atacama Large Millimeter/submillimeter Array Expanded Very Large Array Robert C. Byrd Green Bank Telescope Very Long Baseline
THE KAROO ARRAY TELESCOPE (KAT) & FPA EFFORT IN SOUTH AFRICA
 & FPA EFFORT IN SOUTH AFRICA") THE KAROO ARRAY TELESCOPE (KAT) & FPA EFFORT IN SOUTH AFRICA Dr. Dirk Baker (KAT FPA Sub-system Manager) Prof. Justin Jonas (SKA SA Project Scientist) Ms. Anita Loots (KAT Project Manager) Mr. David de
THE KAROO ARRAY TELESCOPE (KAT) & FPA EFFORT IN SOUTH AFRICA Dr. Dirk Baker (KAT FPA Sub-system Manager) Prof. Justin Jonas (SKA SA Project Scientist) Ms. Anita Loots (KAT Project Manager) Mr. David de
Potential benefits of freeform optics for the ELT instruments. J. Kosmalski
 Potential benefits of freeform optics for the ELT instruments J. Kosmalski Freeform Days, 12-13 th October 2017 Summary Introduction to E-ELT intruments Freeform design for MAORY LGS Free form design for
ALMA Phase Calibration, Phase Correction and the Water Vapour Radiometers
 ALMA Phase Calibration, Phase Correction and the Water Vapour Radiometers B. Nikolic 1, J. S. Richer 1, R. E. Hills 1,2 1 MRAO, Cavendish Lab., University of Cambridge 2 Joint ALMA Office, Santiago, Chile
Gain And Arbitrary Beamwidth Measurement For Identical Test Antennas
 Simple Antenna Measurements Using DAMs5.0 Advanced Software DESKTOP ANTENNA TEST SYSTEM Gain And Arbitrary Beamwidth Measurement For Identical Test Antennas This note demonstrates the measurement proceeder
Simulation study for the Stratospheric Inferred Wind (SIW) sub-millimeter limb sounder
 sub-millimeter limb sounder") Simulation study for the Stratospheric Inferred Wind (SIW) sub-millimeter limb sounder Philippe Baron1, Donal Murtagh2 (PI), Patrick Eriksson2, Kristell Pérot2 and Satoshi Ochiai1 (1) National Institute
Simulation study for the Stratospheric Inferred Wind (SIW) sub-millimeter limb sounder Philippe Baron1, Donal Murtagh2 (PI), Patrick Eriksson2, Kristell Pérot2 and Satoshi Ochiai1 (1) National Institute
Information for users of the SOAR Goodman Spectrograph Multi-Object Slit (MOS) mode. César Briceño and Sean Points
 mode. César Briceño and Sean Points") Information for users of the SOAR Goodman Spectrograph Multi-Object Slit (MOS) mode César Briceño and Sean Points CTIO, June 2014 The Goodman Spectrograph has been offered for use in MOS mode starting
Information for users of the SOAR Goodman Spectrograph Multi-Object Slit (MOS) mode César Briceño and Sean Points CTIO, June 2014 The Goodman Spectrograph has been offered for use in MOS mode starting
Analysis of Persistent RFI Signals Captured Using the CISR Coherent Sampling Mode
 Analysis of Persistent RFI Signals Captured Using the CISR Coherent Sampling Mode S.W. Ellingson and K.H. Lee February 13, 26 Contents 1 Introduction 2 2 Methodology 2 2.1 Hardware Configuration and Data
Calibration in practice. Vincent Piétu (IRAM)
") Calibration in practice Vincent Piétu (IRAM) Outline I. The Plateau de Bure interferometer II. On-line calibrations III. CLIC IV. Off-line calibrations Foreword An automated data reduction pipeline exists
Calibration in practice Vincent Piétu (IRAM) Outline I. The Plateau de Bure interferometer II. On-line calibrations III. CLIC IV. Off-line calibrations Foreword An automated data reduction pipeline exists
The WVR at Effelsberg. Thomas Krichbaum
 The WVR at Effelsberg Alan Roy Ute Teuber Helge Rottmann Thomas Krichbaum Reinhard Keller Dave Graham Walter Alef The Scanning 18-26 GHz WVR for Effelsberg ν = 18.5 GHz to 26.0 GHz Δν = 900 MHz Channels
SKA1 low Baseline Design: Lowest Frequency Aspects & EoR Science
 SKA1 low Baseline Design: Lowest Frequency Aspects & EoR Science 1 st science Assessment WS, Jodrell Bank P. Dewdney Mar 27, 2013 Intent of the Baseline Design Basic architecture: 3-telescope, 2-system
Towards SKA Multi-beam concepts and technology
 Towards SKA Multi-beam concepts and technology SKA meeting Meudon Observatory, 16 June 2009 Philippe Picard Station de Radioastronomie de Nançay philippe.picard@obs-nancay.fr 1 Square Kilometre Array:
GPI INSTRUMENT PAGES
 GPI INSTRUMENT PAGES This document presents a snapshot of the GPI Instrument web pages as of the date of the call for letters of intent. Please consult the GPI web pages themselves for up to the minute
Why? When? How What to do What to worry about
 Tom Muxlow Data Combination Why? When? How What to do What to worry about Combination imaging or separate imaging??..using (e-)merlin (e-)merlin covers a unique range of telescope separations, intermediate
Fundamentals of the GBT and Single-Dish Radio Telescopes Dr. Ron Maddalena
 Fundamentals of the GB and Single-Dish Radio elescopes Dr. Ron Maddalena March 2016 Associated Universities, Inc., 2016 National Radio Astronomy Observatory Green Bank, WV National Radio Astronomy Observatory
APO TripleSpecTool User's Guide
 APO TripleSpecTool User's Guide Updated 09MAR2009 Table of Contents 7. APOTripleSpecTool 7.1. Installation 7.1.a. Computer Requirements 7.1.b. Download 7.1.c. IDL Setup 7.2. Data Preparation 7.3. Quickstart
Chapter 5. SPECTRAL LINE OBSERVING 1
 Chapter 5. SPECTRAL LINE OBSERVING 1 CHAPTER 5 Spectral Line Observing 5.1 Startup Checklist Once the scientific goals of the observing session are clearly in mind, you must decide upon the equipment and
Some Spectral Measurements at C and Ku Bands
 Some Spectral Measurements at C and Ku Bands R. D. Norrod, R. J. Simon, W. A. Sizemore October 5, 2005 Introduction A GBT spectral line observer reported difficulty observing in the frequency range 3.9-4.2
Guide to Processing Spectra Using the BASS Software
 British Astronomical Association Supporting amateur astronomers since 1890 Guide to Processing Spectra Using the BASS Software Andrew Wilson 04 June 2017 Applicable to BASS Project Version 1.9.7 by John