Regression: Tree Rings and Measuring Things
|
|
|
- Blaze Freeman
- 5 years ago
- Views:
Transcription
1 Objectives: Measure biological data Use biological measurements to calculate means, slope and intercept Determine best linear fit of data Interpret fit using correlation Materials: Ruler (in millimeters) Calculator Regression Activity Sheet Instructional Plan: Regression: Tree Rings and Measuring Things Assemble students in groups of 2 3 with a calculator and ruler for each group. Using the sheet Example: Regression have the students examine the scatter plot of growth rings by tree diameter. Have the students consult and draw an approximate best linear fit line through the points. Have them compare the position of the line, the y intercept, and the nearest (x, y) coordinates to those in the associated Calculations section. How well did they approximate the line? Next, explain they will be measuring biological data and calculating variables to exactly determine the mean x and y coordinates, slope, and y intercept. To compare their calculations to their estimation skills, have the students measure the diameter and count the growth rings of the sample trees on the Regression Exercise sheet, entering the data into the table provided. Next have students plot the data. Then have the students calculate the mean of the x data (x ) and the mean of the y data (y ). Note that the point ( x, y is on the line of best fit for this data. Have the students draw their own line of the best fit Each student will determine the equation of their line. Also have the students use their calculator to find the equation of best fit. Also, have students consider what the slope means in terms of the plotted points (rate of change). Assessments: Ask the students, Why is it important to know the best fit line? The answer is it allows us to predict either DBH (y) or the number of growth rings (x), using only one coordinate value. As an example, give the students an array of values for either DBH or growth rings or both. Have them use the best fit line to predict what the corresponding value for each. Data could be presented similar to: Unknown Forest Tree 1 Tree 2 Tree 3 Tree 4 Tree 5 Rings (x) Diameter (y) Following this exercise, discuss what other types of situations would benefit from knowing how to predict values using regression from a smaller data set.
2 Tennessee Mathematical Standards: Understand that a function is a rule that assigns to each input exactly one output. The graph of a function is the set of ordered pairs consisting of an input and the corresponding output. Interpret the equation y = mx + b as defining a linear function, whose graph is a straight line. Construct and interpret scatter plots for bivariate measurement data to investigate patterns of association between two quantities. Describe patterns such as clustering, outliers, positive or negative association, linear association, and nonlinear association. Know that straight lines are widely used to model relationships between two quantitative variables. For scatter plots that suggest a linear association, informally fit a straight line, and informally assess the model fit by judging the closeness of the data points to the line. Use the equation of a linear model to solve problems in the context of bivariate measurement data, interpreting the slope and intercept. Developed by Greg Wiggins, Suzanne Lenhart, and Cameron Cook.
3 Regression Exercise: As part of a forest health survey, samples (cross sections) of American beech were taken from a cove forest in the Great Smoky Mountains National Park. Measure the diameter (in millimeters) and count the corresponding growth rings, record it in the table and, plot the data on the grid. Use the data to calculate the slope intercept line of best fit. Forest Samples Growth Rings (x) Diameter (y) Plot this data on the grid provided. Calculate the mean of the x values and the mean of the y values. x : y : (x, y ). This order pair would be on the line of best fit. Draw your line of best fit for the plotted data. Then find the equation of your line. Find the line of best fit using your calculator.
4 Regression Exercise: As part of a forest health survey, samples (cross sections) of American beech were taken from a cove forest in the Great Smoky Mountains National Park. Measure the diameter (in millimeters) and count the corresponding growth rings, record it in the table and, plot the data on the grid. Use the data to calculate the slope intercept line of best fit. Forest Samples Growth Rings (x) Diameter (y) Plot this data on the grid provided. Calculate the mean of the x values and the mean of the y values. x : y : (x, y ). This order pair would be on the line of best fit. Draw your line of best fit for the plotted data. Then find the equation of your line. Find the line of best fit using your calculator.
5
/5 = 14.2 y : (53+40+47+34+46)/5 = 44 Line of best fit: y = 2.05x + 14.89 b: 44 2.")
6 Regression Exercise Key: Forest Samples Growth Rings (x) Diameter (y) Calculations: x : ( )/5 = 14.2 y : ( )/5 = 44 Line of best fit: y = 2.05x b: (14.2) = 14.89
.")
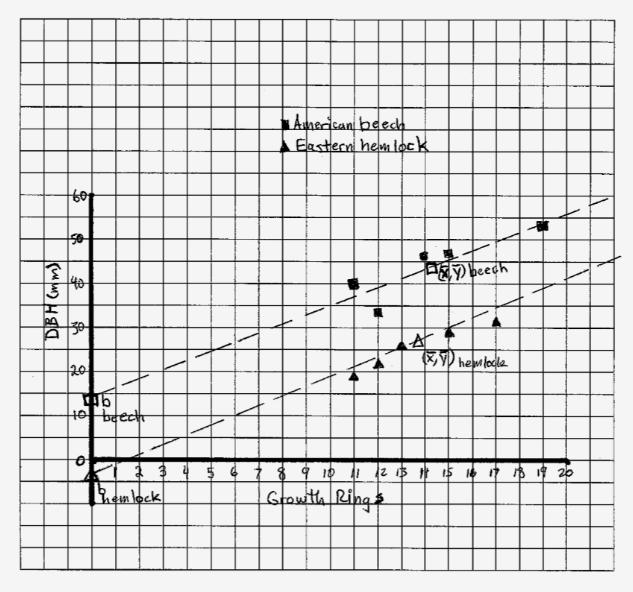
7 Comparative Regression Exercise: Samples (cross sections) of two tree species, American beech and eastern hemlock, were taken from a cove forest in the Great Smoky Mountains National Park to compare growth rate and site suitability (suitability indicated by higher correlation coefficient). Measure the diameter (in millimeters) and count the corresponding growth rings of each sample and record it in the table. Using different color ink or different symbols for each tree species, plot the data on the grid. Use the data to calculate the slopeintercept line of best fit.
8 Forest Samples Growth Rings (x) Diameter (y) American Calculations: x : y : Find line of best fit. Eastern Calculations: x : y : Find line of best fit:
9
10 Comparative Regression Exercise Key Forest Samples 1 2 American Calculations: x : ( )/5 = Growth Rings (x) Diameter (y) y : ( )/5 = 44 Line of best fit: y = 2.05x m: 79.5/38.8 = 2.05 b: (14.2) = Eastern Calculations: x : ( )/5 = 13.6 y : ( )/5 = 25.6 Line of best fit: y = 2.12x 3.23 b: (13.6) = 3.23
11
Graphs of linear equations will be perfectly straight lines. Why would we say that A and B are not both zero?
 College algebra Linear Functions : Definition, Horizontal and Vertical Lines, Slope, Rate of Change, Slopeintercept Form, Point-slope Form, Parallel and Perpendicular Lines, Linear Regression (sections.3
Statistics and Probability. Line of Best Fit. Talk About It. More Ideas. Formative Assessment
 Line of Best Fit Objective Previously, students learned how to graph a scatter plot diagram. From their diagram, they were able to determine that the coordinate pairs may have a linear relationship, even
Scatter Plots, Correlation, and Lines of Best Fit
 Lesson 7.3 Objectives Interpret a scatter plot. Identify the correlation of data from a scatter plot. Find the line of best fit for a set of data. Scatter Plots, Correlation, and Lines of Best Fit A video
Multiple Choice: Identify the choice that best completes the statement or answers the question.
 Name: Class: Multiple Choice: Identify the choice that best completes the statement or answers the question. 1. A floral delivery company conducts a study to measure the effect of worker experience on
Unit 4 Review. Multiple Choice: Identify the choice that best completes the statement or answers the question.
 Name: Ms. Logan Class: Date: Unit 4 Review Multiple Choice: Identify the choice that best completes the statement or answers the question. 1. A floral delivery company conducts a study to measure the effect
Multiple Choice: Identify the choice that best completes the statement or answers the question.
 Name: Date: Multiple Choice: Identify the choice that best completes the statement or answers the question. 1. A floral delivery company conducts a study to measure the effect of worker experience on productivity.
1. Graph y = 2x 3. SOLUTION: The slope-intercept form of a line is y = mx + b, where m is the slope, and b is the y-intercept.
 1. Graph y = 2x 3. The slope-intercept form of a line is y = mx + b, where m is the slope, and b is the y-intercept. Plot the y-intercept (0, 3). The slope is. From (0, 3), move up 2 units and right 1
2.3 Quick Graphs of Linear Equations
 2.3 Quick Graphs of Linear Equations Algebra III Mr. Niedert Algebra III 2.3 Quick Graphs of Linear Equations Mr. Niedert 1 / 11 Forms of a Line Slope-Intercept Form The slope-intercept form of a linear
Page 21 GRAPHING OBJECTIVES:
 Page 21 GRAPHING OBJECTIVES: 1. To learn how to present data in graphical form manually (paper-and-pencil) and using computer software. 2. To learn how to interpret graphical data by, a. determining the
Algebra I Notes Unit Seven: Writing Linear Equations
 Sllabus Objective.6 The student will be able to write the equation of a linear function given two points, a point and the slope, table of values, or a graphical representation. Slope-Intercept Form of
Appendix C: Graphing. How do I plot data and uncertainties? Another technique that makes data analysis easier is to record all your data in a table.
 Appendix C: Graphing One of the most powerful tools used for data presentation and analysis is the graph. Used properly, graphs are an important guide to understanding the results of an experiment. They
Name: Date: Period: Activity 4.6.2: Point-Slope Form of an Equation. 0, 4 and moving to another point on the line using the slope.
 Name: Date: Period: Activity.6.2: Point-Slope Form of an Equation 1.) Graph the equation y x = + starting at ( ) 0, and moving to another point on the line using the slope. 2.) Now, draw another graph
Mathematics Success Grade 8
 T936 Mathematics Success Grade 8 [OBJECTIVE] The student will find the line of best fit for a scatter plot, interpret the equation and y-intercept of the linear representation, and make predictions based
Find the equation of a line given its slope and y-intercept. (Problem Set exercises 1 6 are similar.)
") Directions Each problem below is similar to the example with the same number in your textbook. After reading through an example in your textbook, or watching one of the videos of that example on MathTV,
Directions Each problem below is similar to the example with the same number in your textbook. After reading through an example in your textbook, or watching one of the videos of that example on MathTV,
Algebra Success. LESSON 16: Graphing Lines in Standard Form. [OBJECTIVE] The student will graph lines described by equations in standard form.
![Algebra Success. LESSON 16: Graphing Lines in Standard Form. [OBJECTIVE] The student will graph lines described by equations in standard form.](/thumbs/93/113878239.jpg "Algebra Success. LESSON 16: Graphing Lines in Standard Form. [OBJECTIVE] The student will graph lines described by equations in standard form.") T328 [OBJECTIVE] The student will graph lines described by equations in standard form. [MATERIALS] Student pages S125 S133 Transparencies T336, T338, T340, T342, T344 Wall-size four-quadrant grid [ESSENTIAL
T328 [OBJECTIVE] The student will graph lines described by equations in standard form. [MATERIALS] Student pages S125 S133 Transparencies T336, T338, T340, T342, T344 Wall-size four-quadrant grid [ESSENTIAL
The Picture Tells the Linear Story
 The Picture Tells the Linear Story Students investigate the relationship between constants and coefficients in a linear equation and the resulting slopes and y-intercepts on the graphs. This activity also
Reminders. Quiz today. Please bring a calculator to the quiz
 Reminders Quiz today Please bring a calculator to the quiz 1 Regression Review (sort of Ch. 15) Warning: Outside of known textbook space Aaron Zimmerman STAT 220 - Summer 2014 Department of Statistics
Foundations for Functions
 Activity: Spaghetti Regression Activity 1 TEKS: Overview: Background: A.2. Foundations for functions. The student uses the properties and attributes of functions. The student is expected to: (D) collect
Algebra & Trig. 1. , then the slope of the line is given by
 Algebra & Trig. 1 1.4 and 1.5 Linear Functions and Slope Slope is a measure of the steepness of a line and is denoted by the letter m. If a nonvertical line passes through two distinct points x, y 1 1
Chapter 7, Part 1B Equations & Functions
 Chapter 7, Part 1B Equations & Functions Fingerstache Fingerstaches cost $7 per box. Copy and complete the table to find the cost of 2, 3, and 4 boxes. Number of Boxes Multiply by 7 Cost 1 1 x 7 $7 2 3
Lesson 4.6 Best Fit Line
 Lesson 4.6 Best Fit Line Concept: Using & Interpreting Best Fit Lines EQs: -How do we determine a line of best fit from a scatter plot? (S.ID.6 a,c) -What does the slope and intercept tell me about the
Graphing Lines with a Table
 Graphing Lines with a Table Select (or use pre-selected) values for x Substitute those x values in the equation and solve for y Graph the x and y values as ordered pairs Connect points with a line Graph
Table 1. List of NFL divisions that have won the Superbowl over the past 52 years.
 MA 2113 Homework #1 Table 1. List of NFL divisions that have won the Superbowl over the past 52 years. NFC North AFC West NFC East NFC North AFC South NFC North NFC East NFC East AFC West NFC East AFC
Outcome 7 Review. *Recall that -1 (-5) means
 means") Outcome 7 Review Level 2 Determine the slope of a line that passes through A(3, -5) and B(-2, -1). Step 1: Remember that ordered pairs are in the form (x, y). Label the points so you can substitute into
Outcome 7 Review Level 2 Determine the slope of a line that passes through A(3, -5) and B(-2, -1). Step 1: Remember that ordered pairs are in the form (x, y). Label the points so you can substitute into
y-intercept remains constant?
 1. The graph of a line that contains the points ( 1, 5) and (4, 5) is shown below. Which best represents this line if the slope is doubled and the y-intercept remains constant? F) G) H) J) 2. The graph
Section 3 Correlation and Regression - Worksheet
 The data are from the paper: Exploring Relationships in Body Dimensions Grete Heinz and Louis J. Peterson San José State University Roger W. Johnson and Carter J. Kerk South Dakota School of Mines and
GREATER CLARK COUNTY SCHOOLS PACING GUIDE. Algebra I MATHEMATICS G R E A T E R C L A R K C O U N T Y S C H O O L S
 GREATER CLARK COUNTY SCHOOLS PACING GUIDE Algebra I MATHEMATICS 2014-2015 G R E A T E R C L A R K C O U N T Y S C H O O L S ANNUAL PACING GUIDE Quarter/Learning Check Days (Approx) Q1/LC1 11 Concept/Skill
Section 1.3. Slope formula: If the coordinates of two points on the line are known then we can use the slope formula to find the slope of the line.
 MATH 11009: Linear Functions Section 1.3 Linear Function: A linear function is a function that can be written in the form f(x) = ax + b or y = ax + b where a and b are constants. The graph of a linear
Appendix 3 - Using A Spreadsheet for Data Analysis
 105 Linear Regression - an Overview Appendix 3 - Using A Spreadsheet for Data Analysis Scientists often choose to seek linear relationships, because they are easiest to understand and to analyze. But,
MS Algebra A-F-IF-7 Ch. 5.6a Graph Using Slope-Intercept Form. Mr. Deyo Graph Using Slope-Intercept Form
 MS Algebra A-F-IF-7 Ch. 5.6a Graph Using Slope-Intercept Form Mr. Deyo Graph Using Slope-Intercept Form Title: 5.6a Slope-Intercept Form Date: Learning Target By the end of the period, I will apply the
Review for Mastery. Identifying Linear Functions
 Identifying Linear Functions You can determine if a function is linear by its graph, ordered pairs, or equation. Identify whether the graph represents a linear function. Step 1: Determine whether the graph
Plotting Points in 2-dimensions. Graphing 2 variable equations. Stuff About Lines
 Plotting Points in 2-dimensions Graphing 2 variable equations Stuff About Lines Plotting Points in 2-dimensions Plotting Points: 2-dimension Setup of the Cartesian Coordinate System: Draw 2 number lines:
Review Journal 6 Assigned Work: Page 146, All questions
 MFM2P Linear Relations Checklist 1 Goals for this unit: I can explain the properties of slope and calculate its value as a rate of change. I can determine y-intercepts and slopes of given relations. I
Mathematics Paper 3 (Calculator) Common questions: Foundation/Higher tier
 Common questions: Foundation/Higher tier") Pearson Edexcel Level 1/Level 2 GCSE (9 1) Mathematics Paper 3 (Calculator) Common questions: Foundation/Higher tier Specimen Paper Set 1 Paper Reference 1MA1/3F - 3H You must have: Ruler graduated in
Pearson Edexcel Level 1/Level 2 GCSE (9 1) Mathematics Paper 3 (Calculator) Common questions: Foundation/Higher tier Specimen Paper Set 1 Paper Reference 1MA1/3F - 3H You must have: Ruler graduated in
November 28, scatterplots and lines of fit ink.notebook. Page 153. Page 154. Page Scatter Plots and Line of Fit.
 . scatterplots and lines of fit ink.notebook Page Page Page. Scatter Plots and Line of Fit Page Page 6 Page 7 . scatterplots and lines of fit ink.notebook Lesson Objectives Standards Lesson Notes Lesson
Algebra 1B. Chapter 6: Linear Equations & Their Graphs Sections 6-1 through 6-7 & 7-5. COLYER Fall Name: Period:
 Chapter 6: Linear Equations & Their Graphs Sections 6-1 through 6-7 & 7-5 COLYER Fall 2016 Name: Period: What s the Big Idea? Analyzing Linear Equations & Inequalities What can I expect to understand when
Elizabeth Blackwell MS 210Q- 8th Grade Mid-Winter Recess Assignment
 Class: Date: Elizabeth Blackwell MS 210Q- 8th Grade Mid-Winter Recess Assignment The following assignment has been provided for students for the Winter Recess.. Please assist your child in completing this
Mathematics Success Grade 8
 Mathematics Success Grade 8 T429 [OBJECTIVE] The student will solve systems of equations by graphing. [PREREQUISITE SKILLS] solving equations [MATERIALS] Student pages S207 S220 Rulers [ESSENTIAL QUESTIONS]
Lesson 6.1 Linear Equation Review
 Name: Lesson 6.1 Linear Equation Review Vocabulary Equation: a math sentence that contains Linear: makes a straight line (no Variables: quantities represented by (often x and y) Function: equations can
Determine the intercepts of the line and ellipse below: Definition: An intercept is a point of a graph on an axis. Line: x intercept(s)
") Topic 1 1 Intercepts and Lines Definition: An intercept is a point of a graph on an axis. For an equation Involving ordered pairs (x, y): x intercepts (a, 0) y intercepts (0, b) where a and b are real
Topic 1 1 Intercepts and Lines Definition: An intercept is a point of a graph on an axis. For an equation Involving ordered pairs (x, y): x intercepts (a, 0) y intercepts (0, b) where a and b are real
Experiment G: Introduction to Graphical Representation of Data & the Use of Excel
 Experiment G: Introduction to Graphical Representation of Data & the Use of Excel Scientists answer posed questions by performing experiments which provide information about a given problem. After collecting
Student Exploration: Standard Form of a Line
 Name: Date: Student Exploration: Standard Form of a Line Vocabulary: slope, slope-intercept form, standard form, x-intercept, y-intercept Prior Knowledge Questions (Do these BEFORE using the Gizmo.) 1.
Graphing Techniques. Figure 1. c 2011 Advanced Instructional Systems, Inc. and the University of North Carolina 1
 Graphing Techniques The construction of graphs is a very important technique in experimental physics. Graphs provide a compact and efficient way of displaying the functional relationship between two experimental
10 GRAPHING LINEAR EQUATIONS
 0 GRAPHING LINEAR EQUATIONS We now expand our discussion of the single-variable equation to the linear equation in two variables, x and y. Some examples of linear equations are x+ y = 0, y = 3 x, x= 4,
Architects use isometric paper. An isometric drawing is a view seen from above that represents the three dimensions of the space.
 Architecture 5: Isometric Drawings GOAL: Create a three-dimensional looking drawing of your team s tiny house or apartment. Architects use isometric paper. An isometric drawing is a view seen from above
Math 65A Elementary Algebra A Exam II STUDY GUIDE and REVIEW Chapter 2, Sections 3 5, and Chapter 3, Sections 1-3
 Exam II STUDY GUIDE and REVIEW Chapter 2, Sections 5, and Chapter, Sections 1 - Exam II will be given on Thursday, April 10. You will have the entire class time for the exam. It will cover Chapter 2, Sections
LINEAR EQUATIONS IN TWO VARIABLES
 LINEAR EQUATIONS IN TWO VARIABLES What You Should Learn Use slope to graph linear equations in two " variables. Find the slope of a line given two points on the line. Write linear equations in two variables.
NOTES: Chapter 6 Linear Functions
 NOTES: Chapter 6 Linear Functions Algebra 1-1 COLYER Fall 2016 Student Name: Page 2 Section 6.1 ~ Rate of Change and Slope Rate of Change: A number that allows you to see the relationship between two quantities
In this section, we find equations for straight lines lying in a coordinate plane.
 2.4 Lines Lines In this section, we find equations for straight lines lying in a coordinate plane. The equations will depend on how the line is inclined. So, we begin by discussing the concept of slope.
4.4 Slope and Graphs of Linear Equations. Copyright Cengage Learning. All rights reserved.
 4.4 Slope and Graphs of Linear Equations Copyright Cengage Learning. All rights reserved. 1 What You Will Learn Determine the slope of a line through two points Write linear equations in slope-intercept
Sect Linear Equations in Two Variables
 99 Concept # Sect. - Linear Equations in Two Variables Solutions to Linear Equations in Two Variables In this chapter, we will examine linear equations involving two variables. Such equations have an infinite
E. Slope-Intercept Form and Direct Variation (pp )
") and Direct Variation (pp. 32 35) For any two points, there is one and only one line that contains both points. This fact can help you graph a linear equation. Many times, it will be convenient to use the
and Direct Variation (pp. 32 35) For any two points, there is one and only one line that contains both points. This fact can help you graph a linear equation. Many times, it will be convenient to use the
3.4 and 4.3 Explain Graphing and Writing Linear Equations in Standard Form - Notes
 3.4 and 4.3 Explain Graphing and Writing Linear Equations in Standard Form - Notes Essential Question: How can you describe the graph of the equation Ax + By = C? How can you write the equation of a line
Math 1023 College Algebra Worksheet 1 Name: Prof. Paul Bailey September 22, 2004
 Math 1023 College Algebra Worksheet 1 Name: Prof. Paul Bailey September 22, 2004 Every vertical line can be expressed by a unique equation of the form x = c, where c is a constant. Such lines have undefined
Outcome 9 Review Foundations and Pre-Calculus 10
 Outcome 9 Review Foundations and Pre-Calculus 10 Level 2 Example: Writing an equation in slope intercept form Slope-Intercept Form: y = mx + b m = slope b = y-intercept Ex : Write the equation of a line
CHM 109 Excel Refresher Exercise adapted from Dr. C. Bender s exercise
 CHM 109 Excel Refresher Exercise adapted from Dr. C. Bender s exercise (1 point) (Also see appendix II: Summary for making spreadsheets and graphs with Excel.) You will use spreadsheets to analyze data
IED Detailed Outline. Unit 1 Design Process Time Days: 16 days. An engineering design process involves a characteristic set of practices and steps.
 IED Detailed Outline Unit 1 Design Process Time Days: 16 days Understandings An engineering design process involves a characteristic set of practices and steps. Research derived from a variety of sources
Section 2.3 Task List
 Summer 2017 Math 108 Section 2.3 67 Section 2.3 Task List Work through each of the following tasks, carefully filling in the following pages in your notebook. Section 2.3 Function Notation and Applications
Chapter 7 Graphing Equations of Lines and Linear Models; Rates of Change Section 3 Using Slope to Graph Equations of Lines and Linear Models
 Math 167 Pre-Statistics Chapter 7 Graphing Equations of Lines and Linear Models; Rates of Change Section 3 Using Slope to Graph Equations of Lines and Linear Models Objectives 1. Use the slope and the
Math 152 Rodriguez Blitzer 2.5 The Point-Slope Form of the Equation of a Line
 Math 152 Rodriguez Blitzer 2.5 The Point-Slope Form of the Equation of a Line I. Point-Slope Form A. Linear equations we have seen so far: 1. standard form: Ax +By=C A, B, and C real numbers 2. slope-intercept
6.1 Slope of a Line Name: Date: Goal: Determine the slope of a line segment and a line.
 6.1 Slope of a Line Name: Date: Goal: Determine the slope of a line segment and a line. Toolkit: - Rate of change - Simplifying fractions Main Ideas: Definitions Rise: the vertical distance between two
The study of human populations involves working not PART 2. Cemetery Investigation: An Exercise in Simple Statistics POPULATIONS
 PART 2 POPULATIONS Cemetery Investigation: An Exercise in Simple Statistics 4 When you have completed this exercise, you will be able to: 1. Work effectively with data that must be organized in a useful
Use smooth curves to complete the graph between and beyond the vertical asymptotes.
 5.3 Graphs of Rational Functions Guidelines for Graphing Rational Functions 1. Find and plot the x-intercepts. (Set numerator = 0 and solve for x) 2. Find and plot the y-intercepts. (Let x = 0 and solve
MULTIPLE CHOICE. Choose the one alternative that best completes the statement or answers the question.
 Practice for Final Exam Name Identify the following variable as either qualitative or quantitative and explain why. 1) The number of people on a jury A) Qualitative because it is not a measurement or a
Laboratory 2: Graphing
 Purpose It is often said that a picture is worth 1,000 words, or for scientists we might rephrase it to say that a graph is worth 1,000 words. Graphs are most often used to express data in a clear, concise
 Page 1 of 1-7 Equations Teks Focus TEKS (2)(B) Derive and use the distance, slope, and midpoint formulas to verify geometric relationships, including congruence of segments and parallelism or perpendicularity
Spring 2017 Math 54 Test #2 Name:
 Spring 2017 Math 54 Test #2 Name: You may use a TI calculator and formula sheets from the textbook. Show your work neatly and systematically for full credit. Total points: 101 1. (6) Suppose P(E) = 0.37
This lab is to be completed using University computer labs in your own time.
 College of Natural Resources Department of Forest Resources Forest Measurements and Inventory Laboratory 3 Part 1: Introduction to Excel The objectives of this laboratory exercise are to: Become familiar
Science Binder and Science Notebook. Discussions
 Lane Tech H. Physics (Joseph/Machaj 2016-2017) A. Science Binder Science Binder and Science Notebook Name: Period: Unit 1: Scientific Methods - Reference Materials The binder is the storage device for
Lesson 1b Linear Equations
 In the first lesson we looked at the concepts and rules of a Function. The first Function that we are going to investigate is the Linear Function. This is a good place to start because with Linear Functions,
2008 Excellence in Mathematics Contest Team Project A. School Name: Group Members:
 2008 Excellence in Mathematics Contest Team Project A School Name: Group Members: Reference Sheet Frequency is the ratio of the absolute frequency to the total number of data points in a frequency distribution.
Pre-LAB 5 Assignment
 Name: Lab Partners: Date: Pre-LA 5 Assignment Fundamentals of Circuits III: Voltage & Ohm s Law (Due at the beginning of lab) Directions: Read over the Lab Fundamentals of Circuits III: Voltages :w & Ohm
Revision: April 18, E Main Suite D Pullman, WA (509) Voice and Fax
 Voice and Fax") Lab 1: Resistors and Ohm s Law Revision: April 18, 2010 215 E Main Suite D Pullman, WA 99163 (509) 334 6306 Voice and Fax Overview In this lab, we will experimentally explore the characteristics of resistors.
Lab 1: Resistors and Ohm s Law Revision: April 18, 2010 215 E Main Suite D Pullman, WA 99163 (509) 334 6306 Voice and Fax Overview In this lab, we will experimentally explore the characteristics of resistors.
Ch. 6 Linear Functions Notes
 First Name: Last Name: Block: Ch. 6 Linear Functions Notes 6.1 SLOPE OF A LINE Ch. 6.1 HW: p. 9 #4 1, 17,,, 8 6. SLOPES OF PARALLEL AND PERPENDICULAR LINES 6 Ch. 6. HW: p. 49 # 6 odd letters, 7 0 8 6.
Today We will: Create linear equations from a context and model with tables and graphs.
 U2D11 Math 8C U2D11 Today We will: Create linear equations from a context and model with tables and graphs. U2D11 A quick review: Plotting Points Plot the points A(2, 3) B(-1, -4) C(-3, 3) C A D(4, -2)
Year 11 Graphing Notes
 Year 11 Graphing Notes Terminology It is very important that students understand, and always use, the correct terms. Indeed, not understanding or using the correct terms is one of the main reasons students
Tasks for this target will ask students to graph one or more proportional relationships and connect the unit rate(s) to the context of the problem.
 to the context of the problem.") Grade 8 Math C1 TC Claim 1: Concepts and Procedures Students can explain and apply mathematical concepts and carry out mathematical procedures with precision and fluency. Content Domain: Expressions and
Grade 8 Math C1 TC Claim 1: Concepts and Procedures Students can explain and apply mathematical concepts and carry out mathematical procedures with precision and fluency. Content Domain: Expressions and
4 The Cartesian Coordinate System- Pictures of Equations
 The Cartesian Coordinate System- Pictures of Equations Concepts: The Cartesian Coordinate System Graphs of Equations in Two Variables x-intercepts and y-intercepts Distance in Two Dimensions and the Pythagorean
8.EE. Development from y = mx to y = mx + b DRAFT EduTron Corporation. Draft for NYSED NTI Use Only
 8.EE EduTron Corporation Draft for NYSED NTI Use Only TEACHER S GUIDE 8.EE.6 DERIVING EQUATIONS FOR LINES WITH NON-ZERO Y-INTERCEPTS Development from y = mx to y = mx + b DRAFT 2012.11.29 Teacher s Guide:
Slope-Intercept Form. Find the x- and y-intercepts. 1. y 3x 6 2. y 2x 8. Graph each equation. 3. y 1 x 3 4. y 5x 5 5. y x 4
 Practice A Slope-Intercept Form Find the x- and y-intercepts. 1. y 3x 6. y x 8 _ Graph each equation. 3. y 1 x 3 4. y 5x 5 5. y x 4 Write the equation of the line in slope-intercept form. 6. 7. _ Practice
GCSE 9-1 Higher Edexcel Set B Paper 1 - Non Calculator
 Name: GCSE 9-1 Higher Edexcel Set B Paper 1 - Non Calculator Equipment 1. A black ink ball-point pen. 2. A pencil. 3. An eraser. 4. A ruler. 5. A pair of compasses. 6. A protractor. Guidance 1. Read each
3-4 Slope-Intercept Form. State the slope and the y-intercept for the graph of each equation. 1. y = 3x + 4 ANSWER: 3; 4. 2.
 State the slope and the y-intercept for the graph of each equation. 1. y = 3x + 4 3; 4 Write an equation in slope-intercept form for the graph shown. 6. 2. y = x ; 3. 3x + y = 4 3; 4 Write an equation
8.5 Training Day Part II
 26 8.5 Training Day Part II A Solidify Understanding Task Fernando and Mariah continued training in preparation for the half marathon. For the remaining weeks of training, they each separately kept track
Math + 4 (Red) SEMESTER 1. { Pg. 1 } Unit 1: Whole Number Sense. Unit 2: Whole Number Operations. Unit 3: Applications of Operations
 SEMESTER 1. { Pg. 1 } Unit 1: Whole Number Sense. Unit 2: Whole Number Operations. Unit 3: Applications of Operations") Math + 4 (Red) This research-based course focuses on computational fluency, conceptual understanding, and problem-solving. The engaging course features new graphics, learning tools, and games; adaptive
Math + 4 (Red) This research-based course focuses on computational fluency, conceptual understanding, and problem-solving. The engaging course features new graphics, learning tools, and games; adaptive
Graphs. This tutorial will cover the curves of graphs that you are likely to encounter in physics and chemistry.
 Graphs Graphs are made by graphing one variable which is allowed to change value and a second variable that changes in response to the first. The variable that is allowed to change is called the independent
Discovery Activity: Slope
 Page 1 of 14 1. Lesson Title: Discovering Slope-Intercept Form 2. Lesson Summary: This lesson is a review of slope and guides the students through discovering slope-intercept form using paper/pencil and
Math Labs. Activity 1: Rectangles and Rectangular Prisms Using Coordinates. Procedure
 Math Labs Activity 1: Rectangles and Rectangular Prisms Using Coordinates Problem Statement Use the Cartesian coordinate system to draw rectangle ABCD. Use an x-y-z coordinate system to draw a rectangular
Solving Equations and Graphing
 Solving Equations and Graphing Question 1: How do you solve a linear equation? Answer 1: 1. Remove any parentheses or other grouping symbols (if necessary). 2. If the equation contains a fraction, multiply
Slope-Intercept Form of a Line
 Lesson Plan Lecture Edition Slope-Intercept Form of a Line Objectives Students will: discover how slope effects the graph of a line. relate b to the y-intercept of a line. determine the equation of a line
Biological Inventories
 Field Lab 1 Urban Ecology Center Biological Inventories Introduction In order to begin work on our semester research project, this week we will be conducting biological inventories at a moderately disturbed
Crosscutting Concepts (from the SDE instructional unit resources document)
") Get in Line! Lessons 1 A & B: Linear data experiments Lesson Overview In this series of lessons, students will complete hands-on experiments to collect data in the form of x- and y- coordinates. They will
Get in Line! Lessons 1 A & B: Linear data experiments Lesson Overview In this series of lessons, students will complete hands-on experiments to collect data in the form of x- and y- coordinates. They will
Name Period Date LINEAR FUNCTIONS STUDENT PACKET 5: INTRODUCTION TO LINEAR FUNCTIONS
 Name Period Date LF5.1 Slope-Intercept Form Graph lines. Interpret the slope of the graph of a line. Find equations of lines. Use similar triangles to explain why the slope m is the same between any two
Chapter 2: PRESENTING DATA GRAPHICALLY
 2. Presenting Data Graphically 13 Chapter 2: PRESENTING DATA GRAPHICALLY A crowd in a little room -- Miss Woodhouse, you have the art of giving pictures in a few words. -- Emma 2.1 INTRODUCTION Draw a
NUMBERS & OPERATIONS. 1. Understand numbers, ways of representing numbers, relationships among numbers and number systems.
 7 th GRADE GLE S NUMBERS & OPERATIONS 1. Understand numbers, ways of representing numbers, relationships among numbers and number systems. A) Read, write and compare numbers (MA 5 1.10) DOK 1 * compare
Practice 5-6. Linear Equations y = mx + b. Name Class Date
 Name Class Date Practice 5-6 Linear Equations y = mx + b 5-6 Linear Equations y = mx + b 1. Write an equation for the line in slope-intercept form. Use integers or 2. Write an equation for the line in
Q Scheme Marks AOs. 1a All points correctly plotted. B2 1.1b 2nd Draw and interpret scatter diagrams for bivariate data.
 1a All points correctly plotted. B2 2nd Draw and interpret scatter diagrams for bivariate data. 1b The points lie reasonably close to a straight line (o.e.). 2.4 2nd Draw and interpret scatter diagrams
A slope of a line is the ratio between the change in a vertical distance (rise) to the change in a horizontal
 to the change in a horizontal") The Slope of a Line (2.2) Find the slope of a line given two points on the line (Objective #1) A slope of a line is the ratio between the change in a vertical distance (rise) to the change in a horizontal
The Slope of a Line (2.2) Find the slope of a line given two points on the line (Objective #1) A slope of a line is the ratio between the change in a vertical distance (rise) to the change in a horizontal
Study Guide: Slope and Linear Equations
 Rates and Unit Rates A rate is a proportional relationship between two quantities. Unit rate is a rate where the second quantity is 1. Example: Pauline can mow 35 square feet of lawn is 2.5 minutes. (this
Mathematics 205 HWK 2 Solutions Section 12.4 p588. x\y 0 1 2
 Mathematics 205 HWK 2 Solutions Section 12.4 p588 Problem 3, 12.4, p588. Decide whether the table of values could represent values f a linear function. x\y 0 1 2 0 0 5 10 1 2 7 12 2 4 9 14 Solution. F
Section 2-4: Writing Linear Equations, Including Concepts of Parallel & Perpendicular Lines + Graphing Practice
 Section 2-4: Writing Linear Equations, Including Concepts of Parallel & Perpendicular Lines + Graphing Practice Name Date CP If an equation is linear, then there are three formats typically used to express