Environmental Remote Sensing GEOG 2021
|
|
|
- Brett Foster
- 6 years ago
- Views:
Transcription
1 Environmental Remote Sensing GEOG 2021 Lecture 2 Image display and enhancement

2 2
3 Image Display and Enhancement Purpose visual enhancement to aid interpretation enhancement for improvement of information extraction techniques 3
4 How to? Altering image contrast Histogram Manipulation Display Properties Transformations Density slicing Greyscale Display Colour composites Pseudocoluor Re-express or Transformation Image arithmetic (+ ) 4
5 Histogram Manipulation WHAT IS A HISTOGRAM? Frequency of occurrence (of specific DN) 5

6 Histogram Manipulation Analysis of histogram information on the dynamic range and distribution of DN attempts at visual enhancement also useful for analysis, e.g. when a multimodal distribution is observed 6
7 Histogram Manipulation Typical histogram manipulation algorithms: Change the original values So that more of the available range is used This then increases the contrast between features and their backgrounds e.g. Linear Contrast Stretch 7
8 Histogram Manipulation Central Massachusetts (Original) tail 8
9 Histogram Manipulation Central Massachusetts (Linear Stretch:22-140) 9

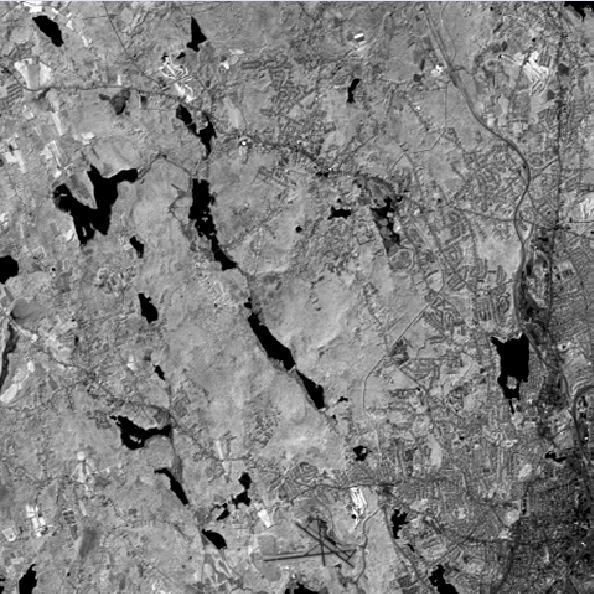
10 Histogram Manipulation Central Massachusetts (Linear Stretch:37-118) 10

11 Histogram Manipulation output Typical histogram manipulation algorithms: Linear Transformation input 11

12 Histogram Manipulation output Typical histogram manipulation algorithms: Linear Transformation input 12
13 Histogram Manipulation Typical histogram manipulation algorithms: Linear Contrast Stretch Can automatically scale between upper and lower limits or apply manual limits or apply piecewise operator But automatic not always useful... 13
14 Histogram Manipulation Typical histogram manipulation algorithms: Histogram Equalisation Attempt is made to equalise the frequency distribution across the full DN range 14
15 Histogram Manipulation Typical histogram manipulation algorithms: Histogram Equalisation Attempt to split the histogram into equal areas 15
16 Histogram Manipulation Typical histogram manipulation algorithms: Histogram Equalisation Resultant histogram uses DN range in proportion to frequency of occurrence 16


17 Histogram Manipulation Original Histogram Linear Stretch Histogram Equalisation 17
18 Histogram Manipulation Typical histogram manipulation algorithms: Histogram Equalisation Useful automatic operation, attempting to produce flat histogram Doesn t suffer from tail problems of linear transformation Like all these transforms, not always successful Histogram Normalisation is similar idea Attempts to produce normal distribution in output histogram both useful when a distribution is very skewed or multimodal skewed 18
19 Density Slicing 19
20 Density Slicing Highlight different but internally homogeneous areas At the expense of loss of detail 20
21 Density Slicing Use single cutoff = Thresholding 21
22 Density Slicing Multiple cutoffs Or don t always want to use full dynamic range of display Density slicing: a crude form of classification 22
23 Black & White, so far Greyscale, actually Single band 23

24 Bands RS images capture EM energy (i.e. light) by sampling over predetermined wavelength ranges which are referred to as 'bands' i.e. blue, green, red, near-infrared, mid-infrared, farinfrared, thermal infrared. 24

25 Colour Composites Real Colour composite red band on red green band on green blue band on blue Swanley, Landsat TM
26 Colour Composites Real Colour composite red band on red 26
27 Colour Composites Real Colour composite red band on red green band on green 27

28 Colour Composites Real Colour composite red band on red green band on green blue band on blue approximation to real colour... 28


29 Colour Composites False Colour composite NIR band on red red band on green green band on blue 29
30 Colour Composites False Colour composite NIR band on red red band on green green band on blue 30

31 Colour Composites False Colour composite many channel data, much not comparable to RGB (visible) e.g. Multi-polarisation SAR HH: Horizontal transmitted polarization and Horizontal received polarization VV: Vertical transmitted polarization and Vertical received polarization HV: Horizontal transmitted polarization and Vertical received polarization 31
 e.g.")
32 Colour Composites False Colour composite many channel data, much not comparable to RGB (visible) e.g. Multi-temporal data AVHRR MVC 1995 April August September 32
33 Greyscale Display Put same information on R,G,B: August 1995 August 1995 August

34 Pseudocolour use colour to enhance features in a single band each DN assigned a different 'colour' in the image display 34
 colour")
35 Pseudocolour Human visual system is particularly efficient in detecting variations in hue and saturation, but not so effective in detecting intensity variations Mapping from a 1-D greyscale to a 3-D (RGB) colour 35
36 Image Arithmetic 36
37 Image Arithmetic Combine multiple channels of information to enhance features e.g. NDVI = (NIR-R)/(NIR+R) Normalized Difference Vegetation Index 37
38 Image Arithmetic Combine multiple channels of information to enhance features e.g. NDVI (NIR-R)/(NIR+R) 38

39 Image Arithmetic Common operators: Ratio Landsat TM 1992 Southern Vietnam: green band what is the shading? 39

40 Image Arithmetic Common operators: Ratio topographic effects visible in all bands FCC 40
41 Image Arithmetic Common operators: Ratio (ch a /ch b ) apply band ratio = NIR/red what effect has it had? 41
 Reduces topographic")

42 Image Arithmetic Common operators: Ratio (ch a /ch b ) Reduces topographic effects Enhance/reduce spectral features e.g. ratio vegetation indices (SAVI, NDVI++) 42

43 Image Arithmetic Common operators: Subtraction MODIS NIR: Botswana Oct 2000 Predicted Reflectance Based on tracking reflectance for previous period examine CHANGE 43

44 Image Arithmetic Measured reflectance 44
 measured minus predicted")
45 Image Arithmetic Difference (Z score) measured minus predicted noise 45

")

46 Image Arithmetic Common operators: Addition + Reduce noise (increase SNR) averaging, smoothing... Normalisation (as in NDVI) = 46
47 Image Arithmetic Common operators: Multiplication rarely used per se: logical operations? land/sea mask 47
48 Summary Histogram Manipulation Properties Density slicing Transformations Display Colour composites Greyscale Display Pseudocoluor Image arithmetic + 48
49 Summary Followup: web material Mather chapters (e-book available through UCL lib) Follow up material on web and other RS texts Access Journals 49
Remote Sensing and Image Processing: 4
 Remote Sensing and Image Processing: 4 Dr. Mathias (Mat) Disney UCL Geography Office: 301, 3rd Floor, Chandler House Tel: 7670 4290 Email: mdisney@geog.ucl.ac.uk www.geog.ucl.ac.uk/~mdisney 1 Image display
Image interpretation and analysis
 Image interpretation and analysis Grundlagen Fernerkundung, Geo 123.1, FS 2014 Lecture 7a Rogier de Jong Michael Schaepman Why are snow, foam, and clouds white? Why are snow, foam, and clouds white? Today
RGB colours: Display onscreen = RGB
 RGB colours: http://www.colorspire.com/rgb-color-wheel/ Display onscreen = RGB DIGITAL DATA and DISPLAY Myth: Most satellite images are not photos Photographs are also 'images', but digital images are
Course overview; Remote sensing introduction; Basics of image processing & Color theory
 GEOL 1460 /2461 Ramsey Introduction to Remote Sensing Fall, 2018 Course overview; Remote sensing introduction; Basics of image processing & Color theory Week #1: 29 August 2018 I. Syllabus Review we will
Remote Sensing. The following figure is grey scale display of SPOT Panchromatic without stretching.
 Remote Sensing Objectives This unit will briefly explain display of remote sensing image, geometric correction, spatial enhancement, spectral enhancement and classification of remote sensing image. At
GE 113 REMOTE SENSING. Topic 7. Image Enhancement
 GE 113 REMOTE SENSING Topic 7. Image Enhancement Lecturer: Engr. Jojene R. Santillan jrsantillan@carsu.edu.ph Division of Geodetic Engineering College of Engineering and Information Technology Caraga State
REMOTE SENSING INTERPRETATION
 REMOTE SENSING INTERPRETATION Jan Clevers Centre for Geo-Information - WU Remote Sensing --> RS Sensor at a distance EARTH OBSERVATION EM energy Earth RS is a tool; one of the sources of information! 1
Image enhancement. Introduction to Photogrammetry and Remote Sensing (SGHG 1473) Dr. Muhammad Zulkarnain Abdul Rahman
 Dr. Muhammad Zulkarnain Abdul Rahman") Image enhancement Introduction to Photogrammetry and Remote Sensing (SGHG 1473) Dr. Muhammad Zulkarnain Abdul Rahman Image enhancement Enhancements are used to make it easier for visual interpretation
Image enhancement Introduction to Photogrammetry and Remote Sensing (SGHG 1473) Dr. Muhammad Zulkarnain Abdul Rahman Image enhancement Enhancements are used to make it easier for visual interpretation
MODULE 4 LECTURE NOTES 4 DENSITY SLICING, THRESHOLDING, IHS, TIME COMPOSITE AND SYNERGIC IMAGES
 MODULE 4 LECTURE NOTES 4 DENSITY SLICING, THRESHOLDING, IHS, TIME COMPOSITE AND SYNERGIC IMAGES 1. Introduction Digital image processing involves manipulation and interpretation of the digital images so
Apply Colour Sequences to Enhance Filter Results. Operations. What Do I Need? Filter
 Apply Colour Sequences to Enhance Filter Results Operations What Do I Need? Filter Single band images from the SPOT and Landsat platforms can sometimes appear flat (i.e., they are low contrast images).
Exercise 4-1 Image Exploration
 Exercise 4-1 Image Exploration With this exercise, we begin an extensive exploration of remotely sensed imagery and image processing techniques. Because remotely sensed imagery is a common source of data
Using QuickBird Imagery in ESRI Software Products
 Using QuickBird Imagery in ESRI Software Products TABLE OF CONTENTS 1. Introduction...2 Purpose Scope Image Stretching Color Guns 2. Imagery Usage Instructions...4 ArcView 3.x...4 ArcGIS...7 i Using QuickBird
RADAR (RAdio Detection And Ranging)
") RADAR (RAdio Detection And Ranging) CLASSIFICATION OF NONPHOTOGRAPHIC REMOTE SENSORS PASSIVE ACTIVE DIGITAL CAMERA THERMAL (e.g. TIMS) VIDEO CAMERA MULTI- SPECTRAL SCANNERS VISIBLE & NIR MICROWAVE Real
RADAR (RAdio Detection And Ranging) CLASSIFICATION OF NONPHOTOGRAPHIC REMOTE SENSORS PASSIVE ACTIVE DIGITAL CAMERA THERMAL (e.g. TIMS) VIDEO CAMERA MULTI- SPECTRAL SCANNERS VISIBLE & NIR MICROWAVE Real
366 Glossary. Popular method for scale drawings in a computer similar to GIS but without the necessity for spatial referencing CEP
 366 Glossary GISci Glossary ASCII ASTER American Standard Code for Information Interchange Advanced Spaceborne Thermal Emission and Reflection Radiometer Computer Aided Design Circular Error Probability
An Introduction to Remote Sensing & GIS. Introduction
 An Introduction to Remote Sensing & GIS Introduction Remote sensing is the measurement of object properties on Earth s surface using data acquired from aircraft and satellites. It attempts to measure something
The techniques with ERDAS IMAGINE include:
 The techniques with ERDAS IMAGINE include: 1. Data correction - radiometric and geometric correction 2. Radiometric enhancement - enhancing images based on the values of individual pixels 3. Spatial enhancement
Introduction to Remote Sensing
 Introduction to Remote Sensing Dr. Mathias (Mat) Disney UCL Geography Office: 301, 3rd Floor, Chandler House Tel: 7670 4290 Email: mdisney@ucl.geog.ac.uk www.geog.ucl.ac.uk/~mdisney 1 Course outline Format
Digital Image Processing (DIP)
") University of Kurdistan Digital Image Processing (DIP) Lecture 6: Color Image Processing Instructor: Kaveh Mollazade, Ph.D. Department of Biosystems Engineering, Faculty of Agriculture, University of Kurdistan,
University of Kurdistan Digital Image Processing (DIP) Lecture 6: Color Image Processing Instructor: Kaveh Mollazade, Ph.D. Department of Biosystems Engineering, Faculty of Agriculture, University of Kurdistan,
Image interpretation I and II
 Image interpretation I and II Looking at satellite image, identifying different objects, according to scale and associated information and to communicate this information to others is what we call as IMAGE
Mod. 2 p. 1. Prof. Dr. Christoph Kleinn Institut für Waldinventur und Waldwachstum Arbeitsbereich Fernerkundung und Waldinventur
 Histograms of gray values for TM bands 1-7 for the example image - Band 4 and 5 show more differentiation than the others (contrast=the ratio of brightest to darkest areas of a landscape). - Judging from
Lab 7 Julia Janicki. Introduction and methods
 Lab 7 Julia Janicki Introduction and methods The purpose of the lab is to map flood extent after a flooding event that occurred in Houston, Texas. Two Sentinel-1 images with C-band wavelength were used
Introduction to Remote Sensing
 Introduction to Remote Sensing Spatial, spectral, temporal resolutions Image display alternatives Vegetation Indices Image classifications Image change detections Accuracy assessment Satellites & Air-Photos
Image Band Transformations
 Image Band Transformations Content Band math Band ratios Vegetation Index Tasseled Cap Transform Principal Component Analysis (PCA) Decorrelation Stretch Image Band Transformation Purposes Image band transforms
Image and video processing
 Image and video processing Processing Colour Images Dr. Yi-Zhe Song The agenda Introduction to colour image processing Pseudo colour image processing Full-colour image processing basics Transforming colours
Chapter 3 Part 2 Color image processing
 Chapter 3 Part 2 Color image processing Motivation Color fundamentals Color models Pseudocolor image processing Full-color image processing: Component-wise Vector-based Recent and current work Spring 2002
Color Image Processing
 Color Image Processing Jesus J. Caban Outline Discuss Assignment #1 Project Proposal Color Perception & Analysis 1 Discuss Assignment #1 Project Proposal Due next Monday, Oct 4th Project proposal Submit
Introduction to Remote Sensing Part 1
 Introduction to Remote Sensing Part 1 A Primer on Electromagnetic Radiation Digital, Multi-Spectral Imagery The 4 Resolutions Displaying Images Corrections and Enhancements Passive vs. Active Sensors Radar
Remote Sensing for Rangeland Applications
 Remote Sensing for Rangeland Applications Jay Angerer Ecological Training June 16, 2012 Remote Sensing The term "remote sensing," first used in the United States in the 1950s by Ms. Evelyn Pruitt of the
Midterm Review. Image Processing CSE 166 Lecture 10
 Midterm Review Image Processing CSE 166 Lecture 10 Topics covered Image acquisition, geometric transformations, and image interpolation Intensity transformations Spatial filtering Fourier transform and
For a long time I limited myself to one color as a form of discipline. Pablo Picasso. Color Image Processing
 For a long time I limited myself to one color as a form of discipline. Pablo Picasso Color Image Processing 1 Preview Motive - Color is a powerful descriptor that often simplifies object identification
Introduction to Remote Sensing Fundamentals of Satellite Remote Sensing. Mads Olander Rasmussen
 Introduction to Remote Sensing Fundamentals of Satellite Remote Sensing Mads Olander Rasmussen (mora@dhi-gras.com) 01. Introduction to Remote Sensing DHI What is remote sensing? the art, science, and technology
Enhancement of Multispectral Images and Vegetation Indices
 Enhancement of Multispectral Images and Vegetation Indices ERDAS Imagine 2016 Description: We will use ERDAS Imagine with multispectral images to learn how an image can be enhanced for better interpretation.
Remote Sensing Instruction Laboratory
 Laboratory Session 217513 Geographic Information System and Remote Sensing - 1 - Remote Sensing Instruction Laboratory Assist.Prof.Dr. Weerakaset Suanpaga Department of Civil Engineering, Faculty of Engineering
1. What values did you use for bands 2, 3 & 4? Populate the table below. Compile the relevant data for the additional bands in the data below:
 Graham Emde GEOG3200: Remote Sensing Lab # 3: Atmospheric Correction Introduction: This lab teachs how to use INDRISI to correct for atmospheric haze in remotely sensed imagery. There are three models
Land Cover Analysis to Determine Areas of Clear-cut and Forest Cover in Olney, Montana. Geob 373 Remote Sensing. Dr Andreas Varhola, Kathry De Rego
 1 Land Cover Analysis to Determine Areas of Clear-cut and Forest Cover in Olney, Montana Geob 373 Remote Sensing Dr Andreas Varhola, Kathry De Rego Zhu an Lim (14292149) L2B 17 Apr 2016 2 Abstract Montana
How to Access Imagery and Carry Out Remote Sensing Analysis Using Landsat Data in a Browser
 How to Access Imagery and Carry Out Remote Sensing Analysis Using Landsat Data in a Browser Including Introduction to Remote Sensing Concepts Based on: igett Remote Sensing Concept Modules and GeoTech
8. EDITING AND VIEWING COORDINATES, CREATING SCATTERGRAMS AND PRINCIPAL COMPONENTS ANALYSIS
 Editing and viewing coordinates, scattergrams and PCA 8. EDITING AND VIEWING COORDINATES, CREATING SCATTERGRAMS AND PRINCIPAL COMPONENTS ANALYSIS Aim: To introduce you to (i) how you can apply a geographical
Detecting Greenery in Near Infrared Images of Ground-level Scenes
 Detecting Greenery in Near Infrared Images of Ground-level Scenes Piotr Łabędź Agnieszka Ozimek Institute of Computer Science Cracow University of Technology Digital Landscape Architecture, Dessau Bernburg
Unit 8: Color Image Processing
 Unit 8: Color Image Processing Colour Fundamentals In 666 Sir Isaac Newton discovered that when a beam of sunlight passes through a glass prism, the emerging beam is split into a spectrum of colours The
Remote Sensing Exam 2 Study Guide
 Remote Sensing Exam 2 Study Guide Resolution Analog to digital Instantaneous field of view (IFOV) f ( cone angle of optical system ) Everything in that area contributes to spectral response mixels Sampling
RADAR REMOTE SENSING
 RADAR REMOTE SENSING Jan G.P.W. Clevers & Steven M. de Jong Chapter 8 of L&K 1 Wave theory for the EMS: Section 1.2 of L&K E = electrical field M = magnetic field c = speed of light : propagation direction
2017 REMOTE SENSING EVENT TRAINING STRATEGIES 2016 SCIENCE OLYMPIAD COACHING ACADEMY CENTERVILLE, OH
 2017 REMOTE SENSING EVENT TRAINING STRATEGIES 2016 SCIENCE OLYMPIAD COACHING ACADEMY CENTERVILLE, OH This presentation was prepared using draft rules. There may be some changes in the final copy of the
Lecture Notes Prepared by Prof. J. Francis Spring Remote Sensing Instruments
 Lecture Notes Prepared by Prof. J. Francis Spring 2005 Remote Sensing Instruments Material from Remote Sensing Instrumentation in Weather Satellites: Systems, Data, and Environmental Applications by Rao,
Dirty REMOTE SENSING Lecture 3: First Steps in classifying Stuart Green Earthobservation.wordpress.com
 Dirty REMOTE SENSING Lecture 3: First Steps in classifying Stuart Green Earthobservation.wordpress.com Stuart.Green@Teagasc.ie You have your image, but is it any good? Is it full of cloud? Is it the right
Fig Color spectrum seen by passing white light through a prism.
 1. Explain about color fundamentals. Color of an object is determined by the nature of the light reflected from it. When a beam of sunlight passes through a glass prism, the emerging beam of light is not
YIQ color model. Used in United States commercial TV broadcasting (NTSC system).
.") CMY color model Each color is represented by the three secondary colors --- cyan (C), magenta (M), and yellow (Y ). It is mainly used in devices such as color printers that deposit color pigments. It is
CMY color model Each color is represented by the three secondary colors --- cyan (C), magenta (M), and yellow (Y ). It is mainly used in devices such as color printers that deposit color pigments. It is
ECE/OPTI533 Digital Image Processing class notes 288 Dr. Robert A. Schowengerdt 2003
 Motivation Large amount of data in images Color video: 200Mb/sec Landsat TM multispectral satellite image: 200MB High potential for compression Redundancy (aka correlation) in images spatial, temporal,
Digital Image Processing
 Digital Image Processing 1 Patrick Olomoshola, 2 Taiwo Samuel Afolayan 1,2 Surveying & Geoinformatic Department, Faculty of Environmental Sciences, Rufus Giwa Polytechnic, Owo. Nigeria Abstract: This paper
Introduction to Remote Sensing
 Introduction to Remote Sensing Daniel McInerney Urban Institute Ireland, University College Dublin, Richview Campus, Clonskeagh Drive, Dublin 14. 16th June 2009 Presentation Outline 1 2 Spaceborne Sensors
Preparing Remote Sensing Data for Natural Resources Mapping (image enhancement, rectifications )
") Preparing Remote Sensing Data for Natural Resources Mapping (image enhancement, rectifications ) Why is this important What are the major approaches Examples of digital image enhancement Follow up exercises
Preparing Remote Sensing Data for Natural Resources Mapping (image enhancement, rectifications ) Why is this important What are the major approaches Examples of digital image enhancement Follow up exercises
REMOTE SENSING FOR FLOOD HAZARD STUDIES.
 REMOTE SENSING FOR FLOOD HAZARD STUDIES. OPTICAL SENSORS. 1 DRS. NANETTE C. KINGMA 1 Optical Remote Sensing for flood hazard studies. 2 2 Floods & use of remote sensing. Floods often leaves its imprint
Module 11 Digital image processing
 Introduction Geo-Information Science Practical Manual Module 11 Digital image processing 11. INTRODUCTION 11-1 START THE PROGRAM ERDAS IMAGINE 11-2 PART 1: DISPLAYING AN IMAGE DATA FILE 11-3 Display of
Module 3 Introduction to GIS. Lecture 8 GIS data acquisition
 Module 3 Introduction to GIS Lecture 8 GIS data acquisition GIS workflow Data acquisition (geospatial data input) GPS Remote sensing (satellites, UAV s) LiDAR Digitized maps Attribute Data Management Data
SECTION I - CHAPTER 2 DIGITAL IMAGING PROCESSING CONCEPTS
 RADT 3463 - COMPUTERIZED IMAGING Section I: Chapter 2 RADT 3463 Computerized Imaging 1 SECTION I - CHAPTER 2 DIGITAL IMAGING PROCESSING CONCEPTS RADT 3463 COMPUTERIZED IMAGING Section I: Chapter 2 RADT
Image transformations
 Image transformations Digital Numbers may be composed of three elements: Atmospheric interference (e.g. haze) ATCOR Illumination (angle of reflection) - transforms Albedo (surface cover) Image transformations
Interpreting land surface features. SWAC module 3
 Interpreting land surface features SWAC module 3 Interpreting land surface features SWAC module 3 Different kinds of image Panchromatic image True-color image False-color image EMR : NASA Echo the bat
GEOI 313: Digital Image Processing - I
 GEOI 33: Digital Image Processing - I Module I: Image Representation Image Display For remote sensing computing, the image display is especially important because the analyst must be able to examine images
remote sensing? What are the remote sensing principles behind these Definition
 Introduction to remote sensing: Content (1/2) Definition: photogrammetry and remote sensing (PRS) Radiation sources: solar radiation (passive optical RS) earth emission (passive microwave or thermal infrared
Basic Digital Image Processing. The Structure of Digital Images. An Overview of Image Processing. Image Restoration: Line Drop-outs
 Basic Digital Image Processing A Basic Introduction to Digital Image Processing ~~~~~~~~~~ Rev. Ronald J. Wasowski, C.S.C. Associate Professor of Environmental Science University of Portland Portland,
Achim J. Lilienthal Mobile Robotics and Olfaction Lab, AASS, Örebro University
 Achim J. Lilienthal Mobile Robotics and Olfaction Lab, Room T1227, Mo, 11-12 o'clock AASS, Örebro University (please drop me an email in advance) achim.lilienthal@oru.se 1 2. General Introduction Schedule
BSB663 Image Processing Pinar Duygulu. Slides are adapted from Gonzales & Woods, Emmanuel Agu Suleyman Tosun
 BSB663 Image Processing Pinar Duygulu Slides are adapted from Gonzales & Woods, Emmanuel Agu Suleyman Tosun Histograms Histograms Histograms Histograms Histograms Interpreting histograms Histograms Image
Remote Sensing Platforms
 Types of Platforms Lighter-than-air Remote Sensing Platforms Free floating balloons Restricted by atmospheric conditions Used to acquire meteorological/atmospheric data Blimps/dirigibles Major role - news
Lab 3: Image Enhancements I 65 pts Due > Canvas by 10pm
 Geo 448/548 Spring 2016 Lab 3: Image Enhancements I 65 pts Due > Canvas by 3/11 @ 10pm For this lab, you will learn different ways to calculate spectral vegetation indices (SVIs). These are one category
Digital Image Processing. Lecture # 8 Color Processing
 Digital Image Processing Lecture # 8 Color Processing 1 COLOR IMAGE PROCESSING COLOR IMAGE PROCESSING Color Importance Color is an excellent descriptor Suitable for object Identification and Extraction
GEOG432: Remote sensing Lab 3 Unsupervised classification
 GEOG432: Remote sensing Lab 3 Unsupervised classification Goal: This lab involves identifying land cover types by using agorithms to identify pixels with similar Digital Numbers (DN) and spectral signatures
Development of normalized vegetation, soil and water indices derived from satellite remote sensing data
 Development of normalized vegetation, soil and water indices derived from satellite remote sensing data Takeuchi, W. & Yasuoka, Y. IIS/UT, Japan E-mail: wataru@iis.u-tokyo.ac.jp Nov. 25th, 2004 ACRS2004
MODULE 4 LECTURE NOTES 1 CONCEPTS OF COLOR
 MODULE 4 LECTURE NOTES 1 CONCEPTS OF COLOR 1. Introduction The field of digital image processing relies on mathematical and probabilistic formulations accompanied by human intuition and analysis based
A (very) brief introduction to Remote Sensing: From satellites to maps!
 brief introduction to Remote Sensing: From satellites to maps!") Spatial Data Analysis and Modeling for Agricultural Development, with R - Workshop A (very) brief introduction to Remote Sensing: From satellites to maps! Earthlights DMSP 1994-1995 https://wikimedia.org/
Spatial Data Analysis and Modeling for Agricultural Development, with R - Workshop A (very) brief introduction to Remote Sensing: From satellites to maps! Earthlights DMSP 1994-1995 https://wikimedia.org/
CS 565 Computer Vision. Nazar Khan PUCIT Lecture 4: Colour
 CS 565 Computer Vision Nazar Khan PUCIT Lecture 4: Colour Topics to be covered Motivation for Studying Colour Physical Background Biological Background Technical Colour Spaces Motivation Colour science
Introduction to image processing for remote sensing: Practical examples
 Università degli studi di Roma Tor Vergata Corso di Telerilevamento e Diagnostica Elettromagnetica Anno accademico 2010/2011 Introduction to image processing for remote sensing: Practical examples Dr.
SEMI-SUPERVISED CLASSIFICATION OF LAND COVER BASED ON SPECTRAL REFLECTANCE DATA EXTRACTED FROM LISS IV IMAGE
 SEMI-SUPERVISED CLASSIFICATION OF LAND COVER BASED ON SPECTRAL REFLECTANCE DATA EXTRACTED FROM LISS IV IMAGE B. RayChaudhuri a *, A. Sarkar b, S. Bhattacharyya (nee Bhaumik) c a Department of Physics,
Image acquisition. Midterm Review. Digitization, line of image. Digitization, whole image. Geometric transformations. Interpolation 10/26/2016
 Image acquisition Midterm Review Image Processing CSE 166 Lecture 10 2 Digitization, line of image Digitization, whole image 3 4 Geometric transformations Interpolation CSE 166 Transpose these matrices
A SYNERGETIC USE OF REMOTE-SENSED DATA TO ASSESS THE EVOLUTION OF BURNT AREA BY WILDFIRES IN PORTUGAL
 A SYNERGETIC USE OF REMOTE-SENSED DATA TO ASSESS THE EVOLUTION OF BURNT AREA BY WILDFIRES IN PORTUGAL Teresa J. Calado and Carlos C. DaCamara CGUL, Faculty of Sciences, University of Lisbon, Campo Grande,
Urban Classification of Metro Manila for Seismic Risk Assessment using Satellite Images
 Urban Classification of Metro Manila for Seismic Risk Assessment using Satellite Images Fumio YAMAZAKI/ yamazaki@edm.bosai.go.jp Hajime MITOMI/ mitomi@edm.bosai.go.jp Yalkun YUSUF/ yalkun@edm.bosai.go.jp
Digital Image Processing. Lecture # 6 Corner Detection & Color Processing
 Digital Image Processing Lecture # 6 Corner Detection & Color Processing 1 Corners Corners (interest points) Unlike edges, corners (patches of pixels surrounding the corner) do not necessarily correspond
OPTICAL RS IMAGE INTERPRETATION
 1 OPTICAL RS IMAGE INTERPRETATION Lecture 8 Visible Middle Infrared Image Bands 2 Data Processing Information data in a useable form Interpretation Visual AI (Machine learning) Recognition, Classification,
INSTITUTIONEN FÖR SYSTEMTEKNIK LULEÅ TEKNISKA UNIVERSITET
 INSTITUTIONEN FÖR SYSTEMTEKNIK LULEÅ TEKNISKA UNIVERSITET Some color images on this slide Last Lecture 2D filtering frequency domain The magnitude of the 2D DFT gives the amplitudes of the sinusoids and
F2 - Fire 2 module: Remote Sensing Data Classification
 F2 - Fire 2 module: Remote Sensing Data Classification F2.1 Task_1: Supervised and Unsupervised classification examples of a Landsat 5 TM image from the Center of Portugal, year 2005 F2.1 Task_2: Burnt
An Automated Operational System for Collating Field and Satellite Data for Grassland Curing Assessment. Presented by: Alex Chen and Danielle Martin
 An Automated Operational System for Collating Field and Satellite Data for Grassland Curing Assessment Presented by: Alex Chen and Danielle Martin Outline Rationale Background Automated Web-Based System
Lecture 13: Remotely Sensed Geospatial Data
 Lecture 13: Remotely Sensed Geospatial Data A. The Electromagnetic Spectrum: The electromagnetic spectrum (Figure 1) indicates the different forms of radiation (or simply stated light) emitted by nature.
General Workflow for Processing L, Ha, R, G, and B Components in ImagesPlus
 General Workflow for Processing L, Ha, R, G, and B Components in ImagesPlus This general workflow can be used with component images from a DSLR, one shot color CCD, or monochrome CCD with minor adjustment
CanImage. (Landsat 7 Orthoimages at the 1: Scale) Standards and Specifications Edition 1.0
 Standards and Specifications Edition 1.0") CanImage (Landsat 7 Orthoimages at the 1:50 000 Scale) Standards and Specifications Edition 1.0 Centre for Topographic Information Customer Support Group 2144 King Street West, Suite 010 Sherbrooke, QC
CanImage (Landsat 7 Orthoimages at the 1:50 000 Scale) Standards and Specifications Edition 1.0 Centre for Topographic Information Customer Support Group 2144 King Street West, Suite 010 Sherbrooke, QC
Application of GIS to Fast Track Planning and Monitoring of Development Agenda
 Application of GIS to Fast Track Planning and Monitoring of Development Agenda Radiometric, Atmospheric & Geometric Preprocessing of Optical Remote Sensing 13 17 June 2018 Outline 1. Why pre-process remotely
An Introduction to Geomatics. Prepared by: Dr. Maher A. El-Hallaq خاص بطلبة مساق مقدمة في علم. Associate Professor of Surveying IUG
 An Introduction to Geomatics خاص بطلبة مساق مقدمة في علم الجيوماتكس Prepared by: Dr. Maher A. El-Hallaq Associate Professor of Surveying IUG 1 Airborne Imagery Dr. Maher A. El-Hallaq Associate Professor
GEOG432: Remote sensing Lab 3 Unsupervised classification
 GEOG432: Remote sensing Lab 3 Unsupervised classification Goal: This lab involves identifying land cover types by using agorithms to identify pixels with similar Digital Numbers (DN) and spectral signatures
Use of digital aerial camera images to detect damage to an expressway following an earthquake
 Use of digital aerial camera images to detect damage to an expressway following an earthquake Yoshihisa Maruyama & Fumio Yamazaki Department of Urban Environment Systems, Chiba University, Chiba, Japan.
Unsupervised Classification
 Unsupervised Classification Using SAGA Tutorial ID: IGET_RS_007 This tutorial has been developed by BVIEER as part of the IGET web portal intended to provide easy access to geospatial education. This tutorial
NON-PHOTOGRAPHIC SYSTEMS: Multispectral Scanners Medium and coarse resolution sensor comparisons: Landsat, SPOT, AVHRR and MODIS
 NON-PHOTOGRAPHIC SYSTEMS: Multispectral Scanners Medium and coarse resolution sensor comparisons: Landsat, SPOT, AVHRR and MODIS CLASSIFICATION OF NONPHOTOGRAPHIC REMOTE SENSORS PASSIVE ACTIVE DIGITAL
Lab 6: Multispectral Image Processing Using Band Ratios
 Lab 6: Multispectral Image Processing Using Band Ratios due Dec. 11, 2017 Goals: 1. To learn about the spectral characteristics of vegetation and geologic materials. 2. To experiment with vegetation indices
Remote Sensing. Odyssey 7 Jun 2012 Benjamin Post
 Remote Sensing Odyssey 7 Jun 2012 Benjamin Post Definitions Applications Physics Image Processing Classifiers Ancillary Data Data Sources Related Concepts Outline Big Picture Definitions Remote Sensing
SCATTERING POLARIMETRY PART 1. Dr. A. Bhattacharya (Slide courtesy Prof. E. Pottier and Prof. L. Ferro-Famil)
") SCATTERING POLARIMETRY PART 1 Dr. A. Bhattacharya (Slide courtesy Prof. E. Pottier and Prof. L. Ferro-Famil) 2 That s how it looks! Wave Polarisation An electromagnetic (EM) plane wave has time-varying
SCATTERING POLARIMETRY PART 1 Dr. A. Bhattacharya (Slide courtesy Prof. E. Pottier and Prof. L. Ferro-Famil) 2 That s how it looks! Wave Polarisation An electromagnetic (EM) plane wave has time-varying
Today s Presentation. Introduction Study area and Data Method Results and Discussion Conclusion
 Today s Presentation Introduction Study area and Data Method Results and Discussion Conclusion 2 The urban population in India is growing at around 2.3% per annum. An increased urban population in response
IMAGE ANALYSIS TOOLBOX AND ENHANCED SATELLITE IMAGERY INTEGRATED INTO THE MAPPLACE By Ward E. Kilby 1, Karl Kliparchuk 2 and Andrew McIntosh 2
 IMAGE ANALYSIS TOOLBOX AND ENHANCED SATELLITE IMAGERY INTEGRATED INTO THE MAPPLACE By Ward E. Kilby 1, Karl Kliparchuk 2 and Andrew McIntosh 2 KEYWORDS: MapPlace, Landsat, ASTER, Image Analysis, Structural
Center for Advanced Land Management Information Technologies (CALMIT), School of Natural Resources, University of Nebraska-Lincoln
, School of Natural Resources, University of Nebraska-Lincoln") Geoffrey M. Henebry, Andrés Viña, and Anatoly A. Gitelson Center for Advanced Land Management Information Technologies (CALMIT), School of Natural Resources, University of Nebraska-Lincoln Introduction
Geoffrey M. Henebry, Andrés Viña, and Anatoly A. Gitelson Center for Advanced Land Management Information Technologies (CALMIT), School of Natural Resources, University of Nebraska-Lincoln Introduction
SEN3APP Stakeholder Workshop, Helsinki Yrjö Rauste/VTT Kaj Andersson/VTT Eija Parmes/VTT
 Optical Products from Sentinel-2 and Suomi- NPP/VIIRS SEN3APP Stakeholder Workshop, Helsinki 19.11.2015 Yrjö Rauste/VTT Kaj Andersson/VTT Eija Parmes/VTT Structure of Presentation High-resolution data
Hello, welcome to the video lecture series on Digital image processing. (Refer Slide Time: 00:30)
") Digital Image Processing Prof. P. K. Biswas Department of Electronics and Electrical Communications Engineering Indian Institute of Technology, Kharagpur Module 11 Lecture Number 52 Conversion of one Color
Digital Image Processing Prof. P. K. Biswas Department of Electronics and Electrical Communications Engineering Indian Institute of Technology, Kharagpur Module 11 Lecture Number 52 Conversion of one Color
Figure 1: Percent reflectance for various features, including the five spectra from Table 1, at different wavelengths from 0.4µm to 1.4µm.
 Section 1: The Electromagnetic Spectrum 1. The wavelength range that has the highest reflectance for broadleaf vegetation and needle leaf vegetation is 0.75µm to 1.05µm. 2. Dry soil can be distinguished
Synthetic aperture RADAR (SAR) principles/instruments October 31, 2018
 principles/instruments October 31, 2018") GEOL 1460/2461 Ramsey Introduction to Remote Sensing Fall, 2018 Synthetic aperture RADAR (SAR) principles/instruments October 31, 2018 I. Reminder: Upcoming Dates lab #2 reports due by the start of next
GEOL 1460/2461 Ramsey Introduction to Remote Sensing Fall, 2018 Synthetic aperture RADAR (SAR) principles/instruments October 31, 2018 I. Reminder: Upcoming Dates lab #2 reports due by the start of next
University of Texas at San Antonio EES 5053 Term Project CORRELATION BETWEEN NDVI AND SURFACE TEMPERATURES USING LANDSAT ETM + IMAGERY NEWFEL MAZARI
 University of Texas at San Antonio EES 5053 Term Project CORRELATION BETWEEN NDVI AND SURFACE TEMPERATURES USING LANDSAT ETM + IMAGERY NEWFEL MAZARI Introduction and Objectives The present study is a correlation
ACTIVE SENSORS RADAR
 ACTIVE SENSORS RADAR RADAR LiDAR: Light Detection And Ranging RADAR: RAdio Detection And Ranging SONAR: SOund Navigation And Ranging Used to image the ocean floor (produce bathymetic maps) and detect objects