RSM Interpretation Pretest Tutorial
|
|
|
- Tyrone Woods
- 5 years ago
- Views:
Transcription
1 RSM Interpretation Pretest Tutorial This tutorial provides step-by-step instructions for RSM interpretation. The steps shown in this tutorial are very similar to JITC RSM interpretation compliance testing, therefore providing developers experience and familiarity with the testing process. Seven RSM TRE Sets are provided to assist/support an RSM exploitation application developer s pretest evaluation. The sample files can aide in the preparation testing of RSM exploitation applications before proceeding to JITC RSM compliance testing. Each TRE Set contains different RSM TREs. Although RSM interpreters are eventually required to integrate all eight RSM TREs, implementation priority in the early stages of deployment should support RSM TREs that will be employed and available in actual first file release. A concentrated production of RSM data has been presented in the following TREs: RSMIDA, RSMPCA, RSMPIA and RSMECA. It is recommended exploiter development focus on supporting these four TREs as a priority to the eight TREs listed in the RSM specification. The following is a list of required capabilities for all RSM exploitation applications. The application must present the user the following: 1) A corresponding row/column location from a supplied ground point location. 2) Partial derivative image row/column value from a supplied ground point location. 3) Partial derivative image row/column value from a supplied RSM adjustable parameter identification at supplied ground point location. 4) An RSM direct error covariance, from the corresponding original full image identification and number of active RSM error model adjustable parameters for each applicable image, and the (ordered) identification of these parameters for the associated image. 5) The RSM indirect error covariance for a set of images from the same sensor. For each image, the original full image ID and a set of image row/column locations are also specified in the request. The corresponding number and (ordered) identification of all active RSM error model adjustable parameters for each image (and common across images) are also requested as output, along with the RSM indirect error covariance. 6) The 2x2 unmodeled error covariance corresponding to a specified row/column location in the associated image. Also, AP can request the 2x2 unmodeled error cross-covariance corresponding to two specified row/column locations in the associated image (A ground point location(s) can be specified instead of a row/column location(s); the latter will be computed internally by the RSM exploiter.) 7) The illumination azimuth/elevation angles at specified image row/column location. (A ground point location can be specified instead of a row/column location; the latter will be computed internally by the RSM exploiter.) 8) The trajectory position/velocity at specified time. 9) The original full image ID.
2 10) The sensor ID. 11) The sensor type. 12) The original full image size. 13) The RSM image domain. 14) The edition ID. 15) The triangulation ID. 16) The RSM ground domain s height range. 17) The time-of-image corresponding to supplied row/column location. (A ground point location can be specified instead of a row/column location; the latter will be computed internally by the RSM exploiter.) 18) The identity and definition of RSM primary ground coordinate system 19) The polynomial and/or grid ground-to-image function fit error for all sections applicable to polynomials and/or all sections applicable to grids. For grids, the recommended interpolation order is also requested for each section. The following list provides the optional capabilities an interpreter may include: 1) The ground point horizontal coordinates at supplied image row/column and ground point height coordinate. 2) The value corresponding to the specified identity of an RSM adjustable parameter. 3) The identity of all active RSM adjustable parameters for the associated image that correspond to the RSM image support data error covariance, i.e., active error model adjustable parameters. 4) The RSM image support data error covariance element corresponding to the associated image and the specified identification of two RSM error model adjustable parameters. 5) The portion of the RSM direct error covariance associated with applicable images. Applicable images are the associated image and each image referenced by the RSM direct error covariance and for which an RSM TRE Set is available. The corresponding original full image identification, number of active RSM error model adjustable parameters and their (ordered) identification, are also requested for each applicable image. 6) The RSM indirect error covariance for a set of images from the same sensor in a direct error covariance form, directly suitable for use in a triangulation solution process, as detailed in the RSMECA TRE description. For each image, the original full image ID is also specified in the request. The corresponding number and (ordered) identification of all active RSM error model adjustable parameters for each image (and common across images) are also requested as output, along with the RSM indirect error covariance. In the direct error covariance form, the indirect error covariance is applicable to the images and independent of image row/column location(s). If there are k images and m adjustable parameter per image, the indirect error covariance is a km x km matrix.

3 It is recommended to follow these steps to successfully accomplish compliance pretesting for RSM interpretation. Step 1. Download the sample files. Go to the NITF website at o Click on the Sample Files link o Click on the RSM link

4 The RSM page provides a description of the data collected for the sample files. It also provides contact information if any questions or issues arise. o Click on the Sample files link at the bottom of the data description paragraph.

5 The link takes you to the page containing all the sample files, as well as a text file showing what values are in each field in each TRE, and an excel spreadsheet containing all the known input/output values collected by the NITF lab using a trusted RSM interpreter. The table containing all the sample files provides a description on what a particular NITF file contains. Also available from the table is the purpose of each file provided on the right side of the table. You will notice all files are organized in groups (Frame Sets), each group labeled 1-7 on the left side of the table. o To make downloading all files easier and more organized, it is recommended to create 7 folders on your hard drive, named Frame Set 1, Frame Set 2, etc. This will help keep all Frame Set files grouped together. o First, within the Frame Set 1 row, download the text file located all the way to the right side of the table. Click on the file name (Case1_parsed.txt), and save the file to the folder Frame Set 1.


6

7 o Remaining within the Frame Set 1 row, download the NITF file containing the RSM TREs by clicking on the zip files (i_6130a.ntf (.zip file)) and save to the folder Frame Set 1. Each unzipped NITF file is 90 MB. o Next, still remaining within the Frame Set 1 row, download the Excel file labeled Case1_Input_Output.exl located on the right side of the table. Click on the file name, and save to the folder Frame Set 1.
8 o Continue downloading each Frame Set group of files and saving each file in the appropriate folder. When all the files are saved, all Frame Set folders located on your hard drive should contain 3 files each; one text file, one zipped NITF file and one Excel file.


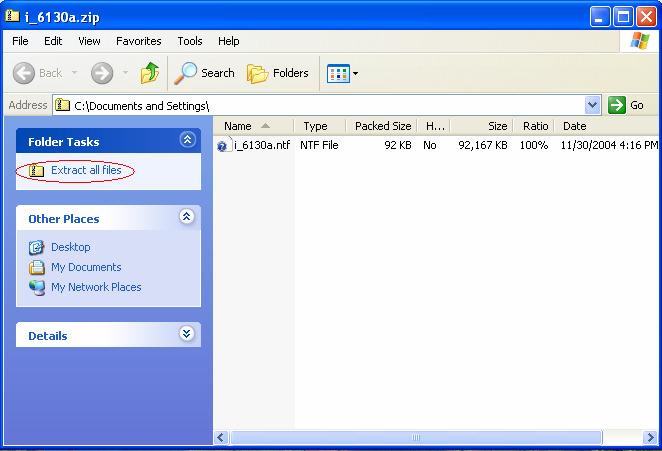
9 Open the Frame Set 1 folder and double click on the zipped NITF file to extract the image. Save the extracted file to the Frame Set 1 folder. The NITF file is now ready to be read by the RSM interpreter.

10
11 o Open all the Frame Set folders and extract all the NITF images from the zipped file. Save the extracted files to the appropriate Frame Set folder. Step 2. Interpret the NITF image RSM TREs and capture the output values. Open the Frame Set 1 Excel spreadsheet that was downloaded from the NITF website. Run the RSM interpreter. Open the NITF file from the Frame Set 1 folder with the RSM interpreter. o Provide the row/column values for the input lat/long/height values provided on the spreadsheet. Compare the row/column values given by the RSM interpreter to the values The values should be no greater than +5.0E-02 pixels difference. o Provide the partial derivatives of a row/column with respect to a ground point. The value displayed from the requested ground point is within 0.05 seconds, or E-07 radians, when compared to the value from the spreadsheet. o Provide the partial derivatives of image row/column with respect to a supplied RSM adjustable parameter identification. The value displayed from the requested image point locating partial derivative is within pixels when compared to the value from the spreadsheet o Provide the RSM direct error covariance, corresponding original full image ID and number of active RSM error model adjustable parameters for each applicable image. Also provide the ID of the parameters for the associated image. The value displayed for the requested corresponding original full image identification is the same value and the same amount of bytes, up to 80 total, as the original full image identification display value from the RSM reference test cases. The value displayed for the requested number of active RSM error model adjustable parameters for each applicable image is the same value (01-36, two bytes total) as the number display value from the RSM reference test cases.
12 The value displayed for the requested identification and value of the RSM error model adjustable parameters for the associated image is the same value (01-36,two bytes total) as the identifications display value from the RSM reference test cases. The value displayed for the requested RSM direct error covariance contains the same values (in the range and byte size as E+99) as the display value from the RSM reference test cases. o Provide the RSM indirect error covariance. The values displayed for the requested original full image identification for each image is the same value and the same amount of bytes, up to 80 total, as the display values from the RSM reference test cases. The values displayed for the requested indirect error covariance at supplied row/column locations and corresponding image IDs are the same values as compared to the display value from the RSM reference test cases. The values displayed for the requested corresponding number and identification of all active RSM error model adjustable parameters for each image is the same value (01-36, two bytes total) as the display value from the RSM reference test cases. The values displayed for the requested value of all active RSM error model adjustable parameters for each image is the same value as the display values from the RSM reference test cases. The values displayed for the requested RSM indirect error covariance for a set of images from the same sensor is the same value as the display values from the RSM reference test cases. o Provide the 2x2 unmodeled error covariance, the 2x2 unmodeled error cross-covariance corresponding to two specified (r,c) locations, and the 2x2 unmodeled error cross-covariance corresponding to a ground point location in the associated image. The values displayed from the requested 2 x 2 unmodeled error covariance corresponding to a row and column location is within +1.0E+00 of the display values from the RSM reference test cases.
13 The values displayed from the requested 2 x 2 unmodeled error cross-covariance corresponding to two specified row and column locations is within +1.0E+00 of the display values from the RSM reference test cases. The values displayed from the requested 2 x 2 unmodeled error cross-covariance corresponding to a ground point location(s) is within +1.0E+00 of the display values from the RSM reference test cases. o Provide the Illumination azimuth and elevation angle. The value displayed from the requested illumination azimuth/elevation angle at a supplied row/column location is the same value as the display value from the RSM reference test cases. o Provide the trajectory position and velocity. The value displayed from the requested trajectory position at a supplied time is the same value as the display value from the RSM reference test cases. The value displayed from the requested velocity at a supplied time is the same value as the display value from the RSM reference test cases. o Provide the image identification. The value displayed from the requested original full image identification is the same as the display value from the RSM reference test cases. o Provide the sensor identification. The value displayed from the requested sensor identification is the same as the display value from the RSM reference test cases. o Provide sensor type. The value displayed from the requested sensor type is the same as the display value from the RSM reference test cases. o Provide the original full image size.
14 The value displayed from the requested original full image size is the same as the display value from the RSM reference test cases. o Provide the RSM image domain. The value displayed from the requested RSM image domain is the same as the display value from the RSM reference test cases. o Provide the edition identification. The value displayed from the requested edition identification is the same as the display value from the RSM reference test cases. o Provide the triangulation identification. The value displayed from the requested original full image size is the same as the display value from the RSM reference test cases. o Provide the RSM ground domain height range. The value displayed from the requested RSM ground domain height range is within +1.0E+00 of the display value from the RSM reference test cases. o Provide the time of image corresponding to a row/column or ground point location. The value displayed from the requested time of image corresponding to a supplied row and column location is the same as the display value from the RSM reference test cases. The value displayed from the requested time of image corresponding to a supplied ground point location is the same as the display value from the RSM reference test cases. o Provide the RSM primary ground coordinate system. The value displayed from the requested RSM primary ground coordinate system is the same as the display value from the RSM reference test cases.
15 o Provide the polynomial and/or grid ground-to-image functional fit error value. The value display from the requested polynomial groundto-image functional fit error is within +1.00E-10 of the display value from the RSM reference test cases for both row and column in each section. The value displayed from the requested grid ground-toimage functional fit error is within +1.00E-10 of the display value from the RSM reference test cases for each row and column in each section.
Estimated Time Required to Complete: 45 minutes
 Estimated Time Required to Complete: 45 minutes This is the first in a series of incremental skill building exercises which explore sheet metal punch ifeatures. Subsequent exercises will address: placing
Standard Sudoku point. 1 point. P a g e 1
 P a g e 1 Standard 1-2 Place a digit from 1 to 6 in each empty cell so that each digit appears exactly once in each row, column and 2X box. 1 point A 6 2 6 2 1 5 1 point B 5 2 2 4 1 1 6 5 P a g e 2 Standard
Physics 253 Fundamental Physics Mechanic, September 9, Lab #2 Plotting with Excel: The Air Slide
 1 NORTHERN ILLINOIS UNIVERSITY PHYSICS DEPARTMENT Physics 253 Fundamental Physics Mechanic, September 9, 2010 Lab #2 Plotting with Excel: The Air Slide Lab Write-up Due: Thurs., September 16, 2010 Place
Lesson 3: Working with Landsat Data
 Lesson 3: Working with Landsat Data Lesson Description The Landsat Program is the longest-running and most extensive collection of satellite imagery for Earth. These datasets are global in scale, continuously
Digital Image Processing Labs DENOISING IMAGES
 Digital Image Processing Labs DENOISING IMAGES All electronic devices are subject to noise pixels that, for one reason or another, take on an incorrect color or intensity. This is partly due to the changes
Using Focus/Hide on a Pivot
 Using Focus/Hide on a Pivot Sometimes you want to focus on specific data in a pivot to see and analyze a specific part of the data that was brought back when you processed the report. You can accomplish
Open Loop Frequency Response
 TAKE HOME LABS OKLAHOMA STATE UNIVERSITY Open Loop Frequency Response by Carion Pelton 1 OBJECTIVE This experiment will reinforce your understanding of the concept of frequency response. As part of the
MISB RP 1107 RECOMMENDED PRACTICE. 24 October Metric Geopositioning Metadata Set. 1 Scope. 2 References. 2.1 Normative Reference
 MISB RP 1107 RECOMMENDED PRACTICE Metric Geopositioning Metadata Set 24 October 2013 1 Scope This Recommended Practice (RP) defines threshold and objective metadata elements for photogrammetric applications.
Stratigraphy Modeling Boreholes and Cross. Become familiar with boreholes and borehole cross sections in GMS
 v. 10.3 GMS 10.3 Tutorial Stratigraphy Modeling Boreholes and Cross Sections Become familiar with boreholes and borehole cross sections in GMS Objectives Learn how to import borehole data, construct a
Remote Sensing in an
 Chapter 8. Downloading Landsat Imagery using Earth Explorer Remote Sensing in an ArcMap Environment Remote Sensing Analysis in an ArcMap Environment Tammy E. Parece Image source: landsat.usgs.gov Tammy
Princeton ELE 201, Spring 2014 Laboratory No. 2 Shazam
 Princeton ELE 201, Spring 2014 Laboratory No. 2 Shazam 1 Background In this lab we will begin to code a Shazam-like program to identify a short clip of music using a database of songs. The basic procedure
Introduction to Filters
 Introduction to Filters Using SAGA Tutorial ID: IGET_RS_006 This tutorial has been developed by BVIEER as part of the IGET web portal intended to provide easy access to geospatial education. This tutorial
User Guide. Version 1.2. Copyright Favor Software. Revised:
 User Guide Version 1.2 Copyright 2009-2010 Favor Software Revised: 2010.05.18 Table of Contents Introduction...4 Installation on Windows...5 Installation on Macintosh...6 Registering Intwined Pattern Studio...7
Excel Lab 2: Plots of Data Sets
 Excel Lab 2: Plots of Data Sets Excel makes it very easy for the scientist to visualize a data set. In this assignment, we learn how to produce various plots of data sets. Open a new Excel workbook, and
User Guide. Version 1.4. Copyright Favor Software. Revised:
 User Guide Version 1.4 Copyright 2009-2012 Favor Software Revised: 2012.02.06 Table of Contents Introduction... 4 Installation on Windows... 5 Installation on Macintosh... 6 Registering Intwined Pattern
Grid Assembly. User guide. A plugin developed for microscopy non-overlapping images stitching, for the public-domain image analysis package ImageJ
 BIOIMAGING AND OPTIC PLATFORM Grid Assembly A plugin developed for microscopy non-overlapping images stitching, for the public-domain image analysis package ImageJ User guide March 2008 Introduction In
Applying mathematics to digital image processing using a spreadsheet
 Jeff Waldock Applying mathematics to digital image processing using a spreadsheet Jeff Waldock Department of Engineering and Mathematics Sheffield Hallam University j.waldock@shu.ac.uk Introduction When
MISB ST STANDARD. 27 February Metric Geopositioning Metadata Set. 1 Scope. 2 References. 2.1 Normative Reference
 MISB ST 1107.1 STANDARD Metric Geopositioning Metadata Set 27 February 2014 1 Scope This Standard (ST) defines threshold and objective metadata elements for photogrammetric applications. This ST defines
GigaPX Tools 2.0. Solutions for oversized images
 Solutions for oversized images Michele Bighignoli February 2016 Contents Introduction...1 Choose the right version...1 Format conversion...2 Crop image...5 Image resize...6 Split image...7 Merge tiles...9
Lab 4 Projectile Motion
 b Lab 4 Projectile Motion Physics 211 Lab What You Need To Know: 1 x = x o + voxt + at o ox 2 at v = vox + at at 2 2 v 2 = vox 2 + 2aΔx ox FIGURE 1 Linear FIGURE Motion Linear Equations Motion Equations
Matlab for CS6320 Beginners
 Matlab for CS6320 Beginners Basics: Starting Matlab o CADE Lab remote access o Student version on your own computer Change the Current Folder to the directory where your programs, images, etc. will be
Geomatica OrthoEngine v10.2 Tutorial DEM Extraction of WorldView-1 Data
 Geomatica OrthoEngine v10.2 Tutorial DEM Extraction of WorldView-1 Data WorldView 1, launched on September 18, 2007, offers a panchromatic imagery at a very high resolution of 50 cm at nadir. The key benefits
Digital Imaging Rochester Institute of Technology
 Digital Imaging 1999 Rochester Institute of Technology So Far... camera AgX film processing image AgX photographic film captures image formed by the optical elements (lens). Unfortunately, the processing
Lab 6 Profiles of DEMs and change detection by using the DEMs
 Lab 6 Profiles of DEMs and change detection by using the DEMs Introduction This lab will introduce you to change detection by subtraction between two images. You will subtract two Digital Elevation Model
Variance and Anomaly Analysis with WIM/WAM Mati Kahru
 Variance and Anomaly Analysis with WIM/WAM Mati Kahru 2008 1 Variance and Anomaly Analysis with WIM/WAM 1 Introduction Analysis of temporal variance of image data provides important clues on the functioning
Lab#2: Five Dimensions of GIS Data
 NRM338 Fall 2018 Lab#1 Page#1 of 13 Lab#2: Five Dimensions of GIS Data In this lab, we will explore five basic dimensions of GIS data Location or position Length and Area Measures (M-dimension) Elevation
Unsupervised Classification
 Unsupervised Classification Using SAGA Tutorial ID: IGET_RS_007 This tutorial has been developed by BVIEER as part of the IGET web portal intended to provide easy access to geospatial education. This tutorial
GET OVERLAPPED! Author: Huang Yi. Forum thread:
 GET OVERLAPPED! Author: Huang Yi Test page: http://logicmastersindia.com/2019/02s/ Forum thread: http://logicmastersindia.com/forum/forums/thread-view.asp?tid=2690 About this Test: This test presents a
1. Setup Output mode. 2. Using a Fixed tile size
 Tutorial Tiling Software version: Asanti 1.0 Document version: February 17, 2014 This tutorial demonstrates how to use tiling with Asanti. Tiling can only be executed on a system where Acrobat Pro X or
NCSS Statistical Software
 Chapter 147 Introduction A mosaic plot is a graphical display of the cell frequencies of a contingency table in which the area of boxes of the plot are proportional to the cell frequencies of the contingency
Lab 1. Motion in a Straight Line
 Lab 1. Motion in a Straight Line Goals To understand how position, velocity, and acceleration are related. To understand how to interpret the signed (+, ) of velocity and acceleration. To understand how
ECE3065 Class Project: CSI Wave Propagation
 ECE3065 Class Project: CSI Wave Propagation Due Date: 23 April 2009 (Thursday) 1 Introduction After taking Spring 2009 Electromagnetic Applications and graduating, a few of your classmates get together
Stratigraphy Modeling Boreholes and Cross Sections
 GMS TUTORIALS Stratigraphy Modeling Boreholes and Cross Sections The Borehole module of GMS can be used to visualize boreholes created from drilling logs. Also three-dimensional cross sections between
DSP First Lab 06: Digital Images: A/D and D/A
 DSP First Lab 06: Digital Images: A/D and D/A Pre-Lab and Warm-Up: You should read at least the Pre-Lab and Warm-up sections of this lab assignment and go over all exercises in the Pre-Lab section before
Terrain Modeling with ArcView GIS
 What You Will Need: A Pentium class PC with 32 MB of RAM (minimum) and 100 MB of free hard drive space, ArcView GIS 3.1 or higher and WinZip or an equivalent program, and an Internet connection. Data and/or
Welcome to the Sudoku and Kakuro Help File.
 HELP FILE Welcome to the Sudoku and Kakuro Help File. This help file contains information on how to play each of these challenging games, as well as simple strategies that will have you solving the harder
Lab 4 Projectile Motion
 b Lab 4 Projectile Motion What You Need To Know: x x v v v o ox ox v v ox at 1 t at a x FIGURE 1 Linear Motion Equations The Physics So far in lab you ve dealt with an object moving horizontally or an
Files Used in This Tutorial. Background. Calibrating Images Tutorial
 In this tutorial, you will calibrate a QuickBird Level-1 image to spectral radiance and reflectance while learning about the various metadata fields that ENVI uses to perform calibration. This tutorial
etatronix PMA-3 Transmitter Tester Manual
 etatronix PMA-3 Transmitter Tester Manual TxTester_Manual_rev1.02.docx 1 Version Version Status Changes Date Responsible 1 Release Initial release 01. Apr. 2015 CW 1.01 Release Updated Figure 4 for better
VISSIM Vehicle Actuated Programming (VAP) Tutorial
 Tutorial") VISSIM Vehicle Actuated Programming (VAP) Tutorial Introduction In previous labs, you learned the basic functions of VISSIM and configurations for realtime Hardware-in-the-Loop Simulation (HILS) using
VISSIM Vehicle Actuated Programming (VAP) Tutorial Introduction In previous labs, you learned the basic functions of VISSIM and configurations for realtime Hardware-in-the-Loop Simulation (HILS) using
Scratch LED Rainbow Matrix. Teacher Guide. Product Code: EL Scratch LED Rainbow Matrix - Teacher Guide
 1 Scratch LED Rainbow Matrix - Teacher Guide Product Code: EL00531 Scratch LED Rainbow Matrix Teacher Guide www.tts-shopping.com 2 Scratch LED Rainbow Matrix - Teacher Guide Scratch LED Rainbow Matrix
Remote Sensing 4113 Lab 08: Filtering and Principal Components Mar. 28, 2018
 Remote Sensing 4113 Lab 08: Filtering and Principal Components Mar. 28, 2018 In this lab we will explore Filtering and Principal Components analysis. We will again use the Aster data of the Como Bluffs
Clickteam Fusion 2.5 [Fastloops ForEach Loops] - Guide
![Clickteam Fusion 2.5 [Fastloops ForEach Loops] - Guide](/thumbs/72/66755963.jpg "Clickteam Fusion 2.5 [Fastloops ForEach Loops] - Guide") INTRODUCTION Built into Fusion are two powerful routines. They are called Fastloops and ForEach loops. The two are different yet so similar. This will be an exhaustive guide on how you can learn how to
INTRODUCTION Built into Fusion are two powerful routines. They are called Fastloops and ForEach loops. The two are different yet so similar. This will be an exhaustive guide on how you can learn how to
Photography Tips for Gastronome Articles Bruce Liebert, Bailli Provincial, Hawaii/Pacific Islands October 22, 2015
 Photography Tips for Gastronome Articles Bruce Liebert, Bailli Provincial, Hawaii/Pacific Islands October 22, 2015 Background I have been assisting with Gastronome articles since the 1990 s, primarily
Information representation
 2Unit Chapter 11 1 Information representation Revision objectives By the end of the chapter you should be able to: show understanding of the basis of different number systems; use the binary, denary and
Centre Name Centre Number Candidate Name Candidate Number
 Unit Title Developing Digital Games Unit Code R092 Session Jan / June / Nov Year 2 0 Centre Name Centre Number Candidate Name Candidate Number Criteria Teacher Comments Centre Mod LO1: Understand game
This tutorial will lead you through step-by-step to make the plot below using Excel.
 GES 131 Making Plots with Excel 1 / 6 This tutorial will lead you through step-by-step to make the plot below using Excel. Number of Non-Student Tickets vs. Student Tickets Y, Number of Non-Student Tickets
Lab 4 - Photogrammetry
 Name: GSP 216: Introduction to Remote Sensing Introduction Lab 4 - Photogrammetry Photogrammetry is process of making measurements from photographs. In this lab we will become familiar with the basic photogrammic
6.098/6.882 Computational Photography 1. Problem Set 1. Assigned: Feb 9, 2006 Due: Feb 23, 2006
 6.098/6.882 Computational Photography 1 Problem Set 1 Assigned: Feb 9, 2006 Due: Feb 23, 2006 Note The problems marked with 6.882 only are for the students who register for 6.882. (Of course, students
Using the Chip Database
 Using the Chip Database TUTORIAL A chip database is a collection of image chips or subsetted images where each image has a GCP associated with it. A chip database can be useful when orthorectifying different
CE 365K Exercise 2: HEC-RAS Modeling Spring 2014 Hydraulic Engineering Design
 CE 365K Exercise 2: HEC-RAS Modeling Spring 2014 Hydraulic Engineering Design This exercise was prepared by Fernando R. Salas and David R. Maidment Introduction In this exercise, we will learn how to setup
MRI Grid. The MRI Grid is a tool in MRI Cell Image Analyzer, that can be used to associate measurements with labeled positions on a board.
 Abstract The is a tool in MRI Cell Image Analyzer, that can be used to associate measurements with labeled positions on a board. Illustration 2: A grid on a binary image. Illustration 1: The interface
ZX Distance and Gesture Sensor Hookup Guide
 Page 1 of 13 ZX Distance and Gesture Sensor Hookup Guide Introduction The ZX Distance and Gesture Sensor is a collaboration product with XYZ Interactive. The very smart people at XYZ Interactive have created
Digital Images: A Technical Introduction
 Digital Images: A Technical Introduction Images comprise a significant portion of a multimedia application This is an introduction to what is under the technical hood that drives digital images particularly
Vectorworks Architect Tutorial Manual by Jonathan Pickup. Sample
 Vectorworks Architect Tutorial Manual by Jonathan Pickup Table of Contents Introduction...iii Step 1 Layer and Model Setup... 1 Document Setup...1 Layer Setup (Model Setup)...7 Step 2 Property Line...
Remote Sensing in an
 Chapter 11: Creating a Composite Image from Landsat Imagery Remote Sensing in an ArcMap Environment Remote Sensing Analysis in an ArcMap Environment Tammy E. Parece Image source: landsat.usgs.gov Tammy
Evaluation copy. Ocean Floor Mapping. computer OBJECTIVES MATERIALS PROCEDURE
 Name Date Ocean Floor Mapping Computer 12 Oceanographers, marine geologists, and archeologists use sound to investigate objects below the surfaces of bodies of water. A signal is sent out and bounces back
Remote Sensing and Image Processing: 4
 Remote Sensing and Image Processing: 4 Dr. Mathias (Mat) Disney UCL Geography Office: 301, 3rd Floor, Chandler House Tel: 7670 4290 Email: mdisney@geog.ucl.ac.uk www.geog.ucl.ac.uk/~mdisney 1 Image display
Radio Mobile. Software for Wireless Systems Planning
 Latin American Networking School (EsLaRed) Universidad de Los Andes Merida Venezuela Javier Triviño and E.Pietrosemoli Radio Mobile Software for Wireless Systems Planning About Radio Mobile It is a tool
Image Extraction using Image Mining Technique
 IOSR Journal of Engineering (IOSRJEN) e-issn: 2250-3021, p-issn: 2278-8719 Vol. 3, Issue 9 (September. 2013), V2 PP 36-42 Image Extraction using Image Mining Technique Prof. Samir Kumar Bandyopadhyay,
ARRAY PROCESSING FOR INTERSECTING CIRCLE RETRIEVAL
 16th European Signal Processing Conference (EUSIPCO 28), Lausanne, Switzerland, August 25-29, 28, copyright by EURASIP ARRAY PROCESSING FOR INTERSECTING CIRCLE RETRIEVAL Julien Marot and Salah Bourennane
[Use Element Selection tool to move raster towards green block.]
![[Use Element Selection tool to move raster towards green block.]](/thumbs/71/65972197.jpg "[Use Element Selection tool to move raster towards green block.]") Demo.dgn 01 High Performance Display Bentley Descartes has been designed to seamlessly integrate into the Raster Manager and all tool boxes, menus, dialog boxes, and other interface operations are consistent
Demo.dgn 01 High Performance Display Bentley Descartes has been designed to seamlessly integrate into the Raster Manager and all tool boxes, menus, dialog boxes, and other interface operations are consistent
Image Editor for Android Project
 Image Editor for Android Project Project Goal The goal of this project is to create an app that will allow you apply one of the following four transformations to an image: Invert colors Convert to Grayscale
Example Application C H A P T E R 4. Contents
 C H A P T E R 4 Example Application This chapter provides an example application of how to perform steady flow water surface profile calculations with HEC-RAS. The user is taken through a step-by-step
Display and Draw Features
 CHAPTER 7 Display and Draw Features 7.1 Overview Feature / Function Tool Display or draw DTM features, such as contours, triangles, lattices, voids, islands, etc. DTM Menu Bar Load > DTM Features GEOPAK
investigating characteristics and the display of TOMS ozone data
 exercise 1: investigating characteristics and the display of TOMS ozone data 1 exercise 1 investigating characteristics and the display of TOMS ozone data Before working with any set of data it is important
CS 200 Assignment 3 Pixel Graphics Due Monday May 21st 2018, 11:59 pm. Readings and Resources
 CS 200 Assignment 3 Pixel Graphics Due Monday May 21st 2018, 11:59 pm Readings and Resources Texts: Suggested excerpts from Learning Web Design Files The required files are on Learn in the Week 3 > Assignment
Final Project: NOTE: The final project will be due on the last day of class, Friday, Dec 9 at midnight.
 Final Project: NOTE: The final project will be due on the last day of class, Friday, Dec 9 at midnight. For this project, you may work with a partner, or you may choose to work alone. If you choose to
PATTERN MAKING FOR THE INFINITY WAND
 PATTERN MAKING FOR THE INFINITY WAND This tutorial will walk you through making patterns for the Infinity Wand and will explain how the wand interprets them. If you get confused, don t worry...keep reading,
Engineering 3821 Fall Pspice TUTORIAL 1. Prepared by: J. Tobin (Class of 2005) B. Jeyasurya E. Gill
 B. Jeyasurya E. Gill") Engineering 3821 Fall 2003 Pspice TUTORIAL 1 Prepared by: J. Tobin (Class of 2005) B. Jeyasurya E. Gill 2 INTRODUCTION The PSpice program is a member of the SPICE (Simulation Program with Integrated Circuit
Engineering 3821 Fall 2003 Pspice TUTORIAL 1 Prepared by: J. Tobin (Class of 2005) B. Jeyasurya E. Gill 2 INTRODUCTION The PSpice program is a member of the SPICE (Simulation Program with Integrated Circuit
Ambisonic Auralizer Tools VST User Guide
 Ambisonic Auralizer Tools VST User Guide Contents 1 Ambisonic Auralizer Tools VST 2 1.1 Plugin installation.......................... 2 1.2 B-Format Source Files........................ 3 1.3 Import audio
GEO/EVS 425/525 Unit 9 Aerial Photograph and Satellite Image Rectification
 GEO/EVS 425/525 Unit 9 Aerial Photograph and Satellite Image Rectification You have seen satellite imagery earlier in this course, and you have been looking at aerial photography for several years. You
Digital Drawings Submittal Process
 Digital Drawings Submittal Process A. Purpose a. All public improvement projects within the City of Olathe require digital copies of the Approved for Construction drawings and Construction Record Drawings
Multiplying Three Factors and Missing Factors
 LESSON 18 Multiplying Three Factors and Missing Factors Power Up facts count aloud Power Up C Count up and down by 5s between 1 and 51. Count up and down by 200s between 0 and 2000. mental math a. Number
Determining MTF with a Slant Edge Target ABSTRACT AND INTRODUCTION
 Determining MTF with a Slant Edge Target Douglas A. Kerr Issue 2 October 13, 2010 ABSTRACT AND INTRODUCTION The modulation transfer function (MTF) of a photographic lens tells us how effectively the lens
Please show the instructor your downloaded index files and orthoimages.
 Student Exercise 1: Sandia Forest Infestation Acquiring Orthophotos and Satellite Imagery Please show the instructor your downloaded index files and orthoimages. Objectives: Determine appropriate imagery
Lab for Working with Adobe Photoshop
 Lab for Working with Adobe Photoshop Try the tasks listed with one of the sample images supplied (You will find them in the Course Materials section of Blackboard as the file sample_images.zip. You will
PHATE Population Health Assessment Engine
 PHATE Population Health Assessment Engine PHATE is a population health tool that provides clinicians with a fuller understanding of their patient population in the context of their community. When used
Lab 8: Introduction to the e-puck Robot
 Lab 8: Introduction to the e-puck Robot This laboratory requires the following equipment: C development tools (gcc, make, etc.) C30 programming tools for the e-puck robot The development tree which is
Quick Start guide. Introduction
 Introduction The purpose of this guide is to help new users in their first setup with the Adamson Shooter predictive software for Adamson Y-Axis and SpekTrix speaker systems. Further detail can be obtained
Mastering AutoCAD 2D
 Course description: Mastering AutoCAD 2D Design and shape the world around you with the powerful, flexible features found in AutoCAD software, one of the world s leading 2D design applications. With robust
Image and Multidimensional Signal Processing
 Image and Multidimensional Signal Processing Professor William Hoff Dept of Electrical Engineering &Computer Science http://inside.mines.edu/~whoff/ Digital Image Fundamentals 2 Digital Image Fundamentals
Wisconsin Corner Point Identification System January 2006
 Wisconsin Corner Point Identification System January 2006 The Wisconsin Point Identification system was developed by a special committee chaired by Mike Romportl, Oneida County Surveyor in the early 1990
Radial trace filtering revisited: current practice and enhancements
 Radial trace filtering revisited: current practice and enhancements David C. Henley Radial traces revisited ABSTRACT Filtering seismic data in the radial trace (R-T) domain is an effective technique for
8. EDITING AND VIEWING COORDINATES, CREATING SCATTERGRAMS AND PRINCIPAL COMPONENTS ANALYSIS
 Editing and viewing coordinates, scattergrams and PCA 8. EDITING AND VIEWING COORDINATES, CREATING SCATTERGRAMS AND PRINCIPAL COMPONENTS ANALYSIS Aim: To introduce you to (i) how you can apply a geographical
Correcting Odometry Errors for Mobile Robots Using Image Processing
 Correcting Odometry Errors for Mobile Robots Using Image Processing Adrian Korodi, Toma L. Dragomir Abstract - The mobile robots that are moving in partially known environments have a low availability,
Assessment of Spatiotemporal Changes in Vegetation Cover using NDVI in The Dangs District, Gujarat
 Assessment of Spatiotemporal Changes in Vegetation Cover using NDVI in The Dangs District, Gujarat Using SAGA GIS and Quantum GIS Tutorial ID: IGET_CT_003 This tutorial has been developed by BVIEER as
ENSC 470/894 Lab 1 V2.0 (Sept )
") ENSC 470/894 Lab 1 V2.0 (Sept. 22 2013) Introduction: Lab 1 is designed to give students basic experience in optics. In the lab you will set up lenses on an optical table, with a LCD screen pattern as
ENSC 470/894 Lab 1 V2.0 (Sept. 22 2013) Introduction: Lab 1 is designed to give students basic experience in optics. In the lab you will set up lenses on an optical table, with a LCD screen pattern as
Cropping and Scaling for High Resolution Prints
 Cropping and Scaling for High Resolution Prints Step 1 Often when we capture an image, we don't have the luxury of time, angle, lens etc., to frame the scene just the way we would like to. So generally,
Purpose. Charts and graphs. create a visual representation of the data. make the spreadsheet information easier to understand.
 Purpose Charts and graphs are used in business to communicate and clarify spreadsheet information. convert spreadsheet information into a format that can be quickly and easily analyzed. make the spreadsheet
Copies of the Color by Pixel template sheets (included in the Resources section). Colored pencils, crayons, markers, or other supplies for coloring.
. Colored pencils, crayons, markers, or other supplies for coloring.") This offline lesson plan covers the basics of computer graphics. After learning about how graphics work, students will create their own Color by Pixel programs. The lesson plan consists of four parts,
This offline lesson plan covers the basics of computer graphics. After learning about how graphics work, students will create their own Color by Pixel programs. The lesson plan consists of four parts,
Geomatica OrthoEngine v10.2 Tutorial DEM Extraction of GeoEye-1 Data
 Geomatica OrthoEngine v10.2 Tutorial DEM Extraction of GeoEye-1 Data GeoEye 1, launched on September 06, 2008 is the highest resolution commercial earth imaging satellite available till date. GeoEye-1
Mobile Computing GNU Radio Laboratory1: Basic test
 Mobile Computing GNU Radio Laboratory1: Basic test 1. Now, let us try a python file. Download, open, and read the file base.py, which contains the Python code for the flowgraph as in the previous test.
Speed of Sound in Air
 Speed of Sound in Air OBJECTIVE To explain the condition(s) necessary to achieve resonance in an open tube. To understand how the velocity of sound is affected by air temperature. To determine the speed
Measurement and Data. Bar Graphs. Talk About It. More Ideas. Formative Assessment. Have children try the following problem.
 4 1.MD.4 Objective Common Core State Standards Bar Graphs Counting and classifying provide a foundation for the gathering and analysis of data. Moving collected information from a tally chart to a graph
Downloading and formatting remote sensing imagery using GLOVIS
 Downloading and formatting remote sensing imagery using GLOVIS Students will become familiarized with the characteristics of LandSat, Aerial Photos, and ASTER medium resolution imagery through the USGS
CanImage. (Landsat 7 Orthoimages at the 1: Scale) Standards and Specifications Edition 1.0
 Standards and Specifications Edition 1.0") CanImage (Landsat 7 Orthoimages at the 1:50 000 Scale) Standards and Specifications Edition 1.0 Centre for Topographic Information Customer Support Group 2144 King Street West, Suite 010 Sherbrooke, QC
CanImage (Landsat 7 Orthoimages at the 1:50 000 Scale) Standards and Specifications Edition 1.0 Centre for Topographic Information Customer Support Group 2144 King Street West, Suite 010 Sherbrooke, QC
Stable reading performance by ultimate lighting system
 1251 DPM 2D Code Reader SERIES Related Information General terms and conditions... F-3 Korea s KC-mark... P.1602 SAFETY USE MEASUREMENT HUMAN FA VISION DPM (Direct Part Marking) panasonic.net/id/pidsx/global
Quintic Software Tutorial 7c
 Quintic Software Tutorial 7c High-Speed Video Capture (Video Capture via USB or GigE) Contents Page 1. Single High-Speed Capture a. Camera Set-Up / Parameters b. Camera Tab (frame rate & exposure) c. Image
Expansion/Analysis of a Card Trick Comprised of Transformations in 2-Dimensional Matrices Aaron Kazam Sherbany, Clarkstown North High School, NY
 Expansion/Analysis of a Card Trick Comprised of Transformations in 2-Dimensional Matrices Aaron Kazam Sherbany, Clarkstown North High School, NY This paper illustrates the properties of a card trick which