High resolution kilometric range optical telemetry in air by Radio Frequency phase measurement
|
|
|
- Marlene Nicholson
- 5 years ago
- Views:
Transcription
1 High resolution kilometric range optical telemetry in air by Radio Frequency phase measurement Joffray Guillory 1, Radek Šmíd 1,3, Jorge García-Márquez 1, Daniel Truong 1, Christophe Alexandre 2, Jean-Pierre Wallerand 1 1 Laboratoire Commun de Métrologie LNE-Cnam (LCM), LNE, 1 rue Gaston Boissier, 7515 Paris, France 2 Centre d Études et de Recherche en Informatique et Communications (CEDRIC), Cnam, 292 rue S t -Martin, 753 Paris, France 3 Institute of Scientific Instruments of the CA, Kralovopolska 147, Brno, Czech Republic We have developed an optical Absolute Distance Meter (ADM) based on the measurement of the phase accumulated by a Radio Frequency (RF) wave during its propagation in the air by a laser beam. In this article, the ADM principle will be described and the main results presented. In particular, we will emphasize how the choice of an appropriate photodetector can significantly improve the telemeter performances by minimizing the amplitude to phase conversion. Our prototype, tested in the field, has proven its efficiency with a resolution better than 15 µm for a measurement time of 1 ms and distances up to 1.2 km. I. INTRODUCTION The optical interferometry is commonly used for sub-nanometer distance measurements 1,2. This technique is however limited to displacement measurements from an initial position, with steps lower than a quarter of the optical wavelength to determine the order of interference fringes without any ambiguity. Additionally, the optical beam must follow continuously the reflective target, with no beam interruption. To overcome these drawbacks, the interferometer can be coupled to an Absolute Distance Meter (ADM) that determines the absolute distance. ADMs are also used outdoor or in harsh industrial environments for distances exceeding a few tens of meters when classical optical interferometry becomes ineffective due to the atmospheric disturbances. Today, laser trackers are widely used in large scale manufacturing industry. They are very advanced systems achieving indoor, a measurement uncertainty of ±1 µm over a range of 1 m. This might be considered to be sufficient, but this value does not take into account the correction from the atmospheric parameters, necessary to know the air refractive index 3, and so the speed of light along the measurement path. For long range outdoor application, the best state-of-the-art commercial measurement devices claim an uncertainty of 1.6 mm up to 1 km. Nevertheless, based on early work 4,5 the Mekometer ME5 from the former Kern company is the most renowned instrument for geodetic application 6,7. Its resolution is 1 µm but is no more manufactured although still used in several geodetic institutes. In all cases the user has to correct the measurements realized by these instruments from the air refractive index effect.
2 The temperature, pressure, partial pressure of water vapor, and possibly CO 2 content have to be determined 8, usually using local sensors, even if the relevant parameters should be integrated all along the measurement beam path. Temperature and air pressure are the most critical measurands in the determination of the air refractive index. Indeed, a temperature error of 1 C accounts for 1-6 in the relative error on the distance measurement (i.e. 1 mm over 1 km) while a pressure error of 1 hpa accounts for (i.e. 3 µm over 1 km). To achieve a sub-millimetric accuracy over 1 km, a solution described in 9 consists in using two optical wavelengths and taking advantage of the knowledge of air index dispersion between these wavelengths in order to compensate the fluctuations of the air refractive index with temperature and pressure. To obtain a sub-millimetric uncertainty, the distance measurements have to be made at both wavelengths simultaneously with a much better uncertainty on each wavelength. The lower the dispersion between both wavelengths, the better is the requirement on the measurement uncertainty at each wavelength. For instance, for the couple 155 nm / 78 nm, the uncertainty required is 2 µm for individual wavelength measurement while it is only 5 µm for the couple 164 nm / 532 nm for a global uncertainty of 1 mm. A two-wavelength telemeter operating at nm and nm has already been developed in the past 1, 11. Some units were even marketed and called Terrameter. Large geodetic networks were measured with this instrument in the eighties. Today, this instrument is no more in operation because of its quite difficult use, requiring specific skills 12. Nevertheless, some large scale surveying applications such as distance measurements in high-energy physics facilities would greatly benefit from two-wavelength solutions. Therefore, we are developing such an ADM that aims to achieve a sub-millimetric accuracy over a kilometric range. Its design is based on widely available off-the-shelf components to remain affordable and adopts digital data processing. The instrument is therefore compact and includes a simple interface in order to facilitate its comparison in the field to other stateof-the-art technologies. This article presents the first step in the implementation of this instrument: the realization of a one-wavelength telemeter at 155 nm, a wavelength widely used in the telecommunication industry and where robust and reliable components are available. II. EXPERIMENTAL SETUP In the here exposed ADM, the distance is determined from the measurement of the phase accumulated by a Radio Frequency (RF) carrier during its propagation in air. The conversion of this phase shift into distance is deduced as follows: c 2 D k with (1) 2 n f RF 2
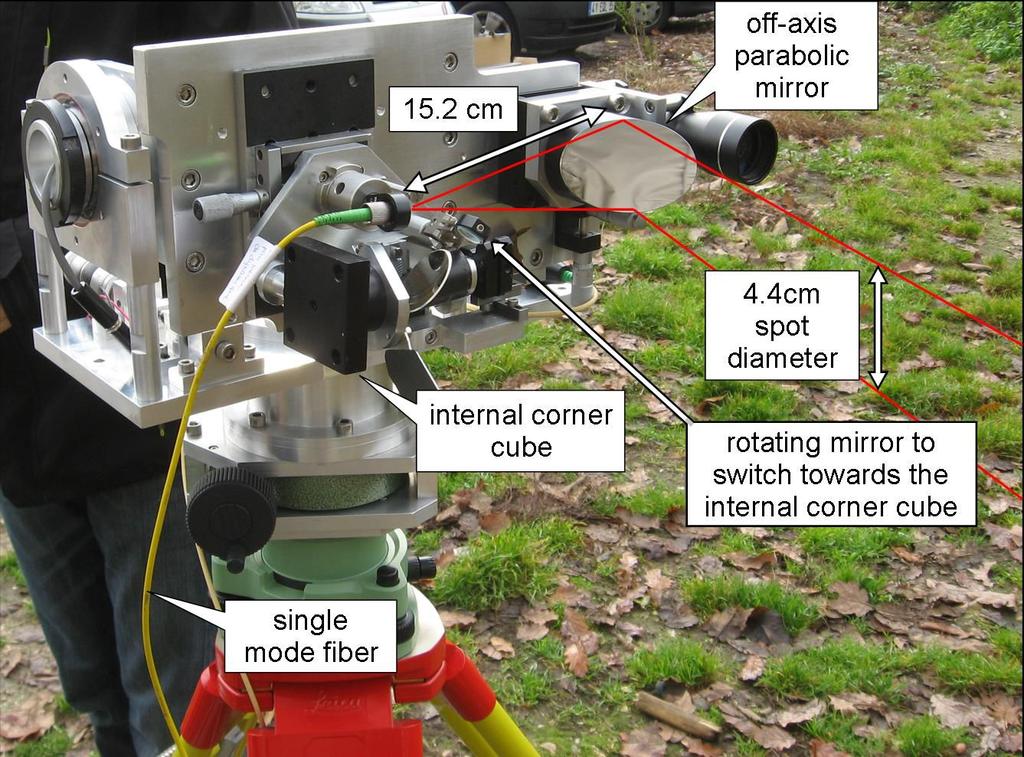
3 where D is the distance, the phase shift measured along the path, c the speed of light in vacuum, n the group refractive index of air, f RF the RF modulation frequency, and k an integer corresponding to the number of synthetic wavelengths Λ within the distance to be measured. The resolution on the measured distance depends on the synthetic wavelength. Our preliminary tests 13 were conducted at a frequency of 131 MHz (Λ = 23 cm) but, with the aim of continuous improvement, we have opted in the current developments for higher modulation frequencies: tests have been performed at MHz (Λ = 7 cm) and at MHz (Λ = 5 cm). However, a high modulation frequency involves an ambiguity in the value of k. Thus, to determine the number of synthetic wavelengths Λ within the distance to be measured, we also need to carry out distance measurements at low RF carriers. For this purpose, a second frequency synthesizer, with a tunable RF carrier ranging from a few khz up to several MHz, is used by changing the state of electrical switches (SWE on figure 1). Phasemeter RF amplifier SWE RF 2 S low RF carriers single chip SWE RF 1 DFB I BIAS Bias voltage Φ measure bias tee SWE mixer FIG. 1. Experimental ADM setup. Any distance is measured from the difference between the phase of the RF carrier at the synthesizer output and the same RF carrier that has been propagated in air by an optical beam. As depicted in Figure 1, this optical carrier, at 155 nm, is emitted by a temperature-controlled Distributed FeedBack (DFB) laser diode, intensity modulated by a RF signal using builtin Electro-Absorption Modulator (EAM), and amplified by an Erbium-Doped Fiber Amplifier (EDFA) before to pass through a 2x2 singlemode fiber-optic splitter that plays the role of a circulator. All these optoelectronic components are widely available on the market coming from the telecommunication industry and by this way, the ADM remains affordable. At the output of the singlemode non polarization-maintaining fiber, the optical beam is emitted in free space to be propagated over a long distance. To this end, we have designed our own optical head. As shown in Figure 2, we have chosen a 9 off-axis parabolic mirror to collimate the optical beam over a long distance. Thus the setup is achromatic and so ready to be used with another wavelength than 155 nm, for instance with a visible laser for alignment purpose. This mirror of 51 mm of diameter is placed at 152 mm from the fiber termination, giving a spot size of 44 mm at 155 nm (at 1 % power level) due to the.14 numerical aperture of the single mode fiber we used. S Φ reference S EAM SWE LO EDFA PD lens optical power meter RF 1 = MHz RF 2 = MHz LO = 59 MHz Optical fiber terminations 3 VOA singlemode fiber (1µm core diameter) RF = Radio Frequency LO = Local Oscillator S = RF Splitter DFB = Distributed FeedBack laser diode PD = PhotoDiode EDFA= Erbium Doped Fiber Amplifier VOA = Variable Optical Attenuator EAM = Electro-Absorption Modulator SWE = Electrical Switch Distance off-axis parabolic mirror optical splitter not used optical switch internal corner cube TARGET Measurement path fibered VOA. mirror Reference path corner cube
4 FIG. 2. Photograph of the optical head. After reflection on a corner cube of 127 mm diameter (the target) and focalization on the return path by the same 9 offaxis parabolic mirror, the beam is reinjected into the same singlemode fiber, which induces at least 9 db optical losses in optimal alignment conditions. Finally the signal is detected by an Indium Gallium Arsenide (InGaAs) photodiode, then down-converted by a Local Oscillator (LO) into an intermediate frequency of 1.5 MHz before amplification. This approach has two advantages: first, the system is less sensitive to the amplitude to phase (AM/PM) coupling occurring in the electronic stages, and secondly, this enables the use of affordable Analog-to-Digital Converters (ADC) working at 245 MSa/s with a resolution of 14 bits. The phasemeter itself, based on a homemade designed Field-Programmable Gate Array (FPGA), provides a resolution better than 5 µrad for a measurement time of 1 ms. Its operating frequency range covers 1 khz to 1 MHz with optimal performances between 1 MHz and 2 MHz. However, the optoelectronic and microwave components introduce drifts on the phase measurement caused, for example, by temperature changes or mechanical movement of fibers. To compensate these phase changes, an optical switch was set up as close as possible to the optical fiber termination to periodically every 25 ms measure the phase of the RF signal after propagation on a fiber-optic link (few centimeters) terminated by a fibered mirror (optical switch and reference path are depicted on figure 1). Since this fiber-optic distance is supposed to be fixed, all phase variations observed on this reference path will be interpreted as drifts from the system and so removed from the measured distance: measure reference (2) where measure is the phase shift on the measurement path (fiber-optic link and free-space propagation) and where reference is the phase shift on the reference path (fiber-optic link only). This fiber optic reference is well adapted for short term reference but evolves for period of minutes or day-to-day. To compensate this medium/long term drift a small corner cube (called internal corner cube), visible on the photograph of figure 2, was mounted on the optical head of the ADM. The free-space beam can then be deviated towards this internal corner cube thanks to a rotating mirror placed at the fiber output (in that case 4
5 the beam is collimated by a 5 cm focal-length off-axis parabolic mirror). Before each measurement, and every minute, the mirror switches between the measurement path and this short mechanical reference path. When the temperature around the optical head is quite stable this reference measurement is performed only every 5 or 1 minutes. Thus the final distance is measured as the difference between this internal corner cube and a second one placed far away (called the target). Therefore, the distance D is calculated in the following manner: Dmeasure path Dreference path D internal corner cube measure path Dreference path t arg et corner cube D (3) Lastly, it has to be noticed that all the fiber components have angle polished connectors in order to minimize back reflections in the optical setup. Indeed, if a small reflected signal (i.e. crosstalk) is added to the measurement signal, nonlinearity in the distance measurement will appear. In order to verify whether this effect can be neglected, the optical crosstalk is estimated by cutting the free-space measurement beam and by checking that the level of the detected RF signal is below 8 dbm. This procedure ensures a non-linearity below 3-5 µm (confirmed by tests on a 3 m long interferometric bench). III. AM/PM CONVERSIONS As already explained in Ref 14, the system is limited by the AM/PM conversions occurring in the reception stage of the telemeter, mainly in the photodiode. Indeed, after long distance propagation, the received light is subjected to a high intensity noise due to beam bending and scintillation events in air. For that reason we have quantified in our previous work 14 the AM/PM coupling for three different kinds of InGaAs photodetectors: a Metal-Semiconductor-Metal (MSM), an avalanche and a Schottky photodiode. At that time, the MSM photodiodes, a G796-3 from Hamamatsu (Table 1), was used in the telemeter and it turned out that it was not the best choice. Since then, we have completed our tests with a Positive-Intrinsic-Negative (PIN) InGaAs photodiode, the EM169-3 from EM4 (Table 1). The latter presents a very small AM/PM coupling compared to the other technologies. In fact, this photodiode has been characterized using a similar setup than the one presented in ref 14-Fig. 2, but with a RF carrier equal to 4261 MHz instead of 131 MHz. The comparison is presented in Figure 3: it represents the phase shift variations (PM record) induced by the photodetectors and the reception electronic stages when a Variable Optical Attenuator (VOA) based on a MicroElectroMechanical System (MEMS) is square-wave modulated to produce sudden optical power changes equal to 1 db (AM generation). For convenience, the phase shift variations have been converted into distances: the y-axis represents the distance variations for optical power variations of 1 db. 5
6 TABLE I. Summary of the characteristics of the two InGaAs photodiodes. MSM Photodiode PIN Photodiode Reference Hamamatsu G796-3 EM4 EM169-3 Active area dimension 2 x 2 µm² 32 µm diameter Bias voltage fixed to 12 V (not integrated bias tee) fixed to 5 V (built-in bias tee) Wavelength range [85-165] nm [ ] nm RF bandwidth rise / fall times of 4 / 12 ps 2 -3 db Typical responsivity nm nm Coupling free-space detector pigtailed detector (SMF-28 FC/APC) Maximum input power 2 mw 6 mw distance / optical power (µm/db) µw 3.1 µw 5.4 µw 63.6 µw 9.6µW EM4 PIN Hamamatsu MSM 113. µw 2.5 µw 35.8 µw 22.1 µw 11.4 µw µw 16.8 µw 52.8µW 3.7µW RF power detected at the phasemeter input (dbm) FIG. 3. Comparison between the MSM and PIN photodiodes modulated at 4261 MHz: distance variations as a function of the RF power detected by the phasemeter. The power values indicated in this graph correspond to the maximum values of the square optical power function. The photodiode bias voltages were fixed at 5 and 12 V for the PIN and MSM photodiodes, respectively. The results in Figure 3 are plotted as a function of the RF power detected by the phasemeter. Due to significant differences between the photodiode efficiencies and the fiber-to-photodiode couplings, Figure 3 shows a RF power difference at the phasemeter input of 15 db for a same optical power illuminating both photodetectors. Thus, in order to obtain the same RF powers (between -25 dbm and +5 dbm), the PIN photodiode should receive an optical power comprised between 1.8 µw and 52.8 µw, while the MSM photodiode should receive an optical power between 11.4 µw and µw. The EM4 PIN photodiode (the same we used in our measurements) was characterized in ref 15, at higher optical powers (up to 6 mw) and higher bias voltages (up to 2 V). Their measurements of the phase as a function of the optical power [ref 15, Fig. 2] show that the dependence of these two parameters becomes very low for an optical power below 1 mw (bias voltage of 12 V). This is in agreement with our measurements. However, contrary to ref 15, we did not observe transient response after a sudden change of the optical power, probably because the heating of our photodiode, proportional to the product of the bias voltage (5 V) and the photocurrent (5 µa), was low in our case. In addition to amplitude to phase conversions, we observed for the MSM photodiode a strong dependence of the phase of the detected RF signal on the position of the focused light onto the active area of the photodiode. A displacement of the spot 6
7 size of 2 µm on the active area can lead to an extra phase shift of one thousandth of the synthetic wavelength. Thanks to a fiber coupling and the illumination of the photodiode by a single mode fiber, this extra phase shift has a constant value and does not affect the accuracy and the resolution of our measurements. In the next section, the two photodiodes are compared when used for outdoor distance measurements up to 1.2 km. IV. DISTANCE MEASUREMENTS UP TO 1.2 KM The developed system was characterized outdoor for distances up to 1.2 km. The MSM photodiode was tested in November 214 during a calm day with a light wind of 14 km/h. The sky was partly cloudy, the temperature about 1 C and the humidity around 82 %. The PIN photodiode was tested in April 215 during also a calm, but a bit cloudier, day. The temperature was about 12 C. Both measurements were realized during favorable days when the atmosphere was quite stable. Since then, other tests were conducted with less favorable conditions, more sunny and windy, but no significant difference with results presented here was observed. Between both measurements the system has evolved, in particular the laboratory synthesizers working at MHz has been changed for more compact solutions based on a Voltage Controlled Oscillator (VCO) and a Phase-Locked Loop (PLL) working at MHz. A procedure to determine k, the integer number of synthetic wavelengths Λ within the measured distance (formula 1), was also implemented. In this case, as depicted in Figure 1, RF switches were added to the system to, on the one hand, enable the modulation of the laser diode at low frequency by a Direct Digital Synthesizer (DDS) and, on the other hand, enable direct phase measurements without down-conversion. The lowest frequency is 1 khz and corresponds to a half synthetic wavelength of 1499 m (or 2998 m for the round trip up to the corner cube). Thus, a coarse value of the corner cube position was obtained with a resolution slightly higher than 1 m. The distance measurement was then refined by increasing gradually the RF carrier: six different frequencies were used within the range 1 khz MHz. Finally, a resolution of approximately 1 mm was obtained at 13.5 MHz, sufficient to determine without any ambiguity the number of synthetic wavelengths at MHz, i.e. to calculate k. In the example of Figure 4, the coarse measurement provides a distance of m ± 7.3 mm (at 1 σ), which corresponds to a k value of at MHz. 7
8 45 Distance (m) STD STD = 451 mm 334 mm 91 mm 56 mm 7 mm the error bars are symmetric and 3 standard deviations long. for each distance, the standard deviation is indicated in red mm Half synthetic wavelength (m) FIG. 4. Results at 449 m using the PIN photodiode: determination of the number of synthetic wavelengths Λ within the distance to be measured. The comparison between the two photodiodes, MSM and PIN, is focused on the resolution of the ADM. We define this resolution as the standard deviation on valid points within 73 successive distance values, which requires less than one minute. Each individual point contains amplitude and phase information of RF signals integrated over 1 ms: one measurement is considered as valid if the detected RF power is higher than -45 dbm, i.e. the beam alignment is not completely lost, and lower than 9 dbm, i.e. the amplifiers are not saturated. In a first time, we have quantified the performances of our system when the MSM Photodiode is used. For a short distance of 2 m, the standard deviation was 12 µm, i.e. a relative resolution of When the measured distance increased, the standard deviation increased proportionally. For example, for a distance of 41 m as represented in Figure 5, the standard deviation has reached 114 µm, i.e. a relative resolution of Relative distance (mm) RF level (dbm) standard deviation of 114 µm before 1 2 the amplitude 3 selection, µm after red = -3.5 dbm ±.5 db % of selected points time (s) FIG. 5. Results at 41 m using the MSM photodiode: relative distances and corresponding RF levels as a function of time. Raw data are in grey and selected points in red. The distances are represented in relative (subtraction of the mean) to facilitate the readability of the distance variations. 8
9 .2.1 Relative distance (mm) FIG. 6. Results at 41 m using the MSM photodiode: relative distances as a function of the detected RF levels (raw data in grey and selected points in red). Figure 5 shows a clear correlation between amplitude variation of the detected RF signal and the measured distance. Figure 6 shows an amplitude to distance conversion factor of 36 µm/db over a range from -15 dbm to 3 dbm. To improve the resolution of the telemeter, we propose to select the distance values having the same amplitude. To this end, and to avoid the introduction of systematic errors on the measured distance, a proper reference amplitude has to be chosen. In our case, this reference is the amplitude of the reference path since, in our measurement procedure, the measured distance is always compared to it as stated in formula 3. This ensures that the two signals measure and reference induce the same amplitude to phase coupling. In practice, we adjust by means of a variable optical attenuator the signal amplitude of the reference path to the average value of the measurement path RF level (dbm) As shown in Figure 5, this solution is very effective. For a distance of 41 m, the standard deviation has been reduced to 12 µm by selecting the values with amplitude equal to -3.5 dbm ±.5 db. The relative resolution is thereby equal to 3 1-8, which represents an improvement by a factor of ten compared to the raw data. The drawback of this procedure is that with a range of ±.5 db, the number of relevant points is significantly reduced, especially when the measured distance increases. For instance, for a distance of 41 m, 13 % of the captured points were exploitable and only 4 % of them at 97 m. This phenomenon was not observed when using the PIN photodiode. In that case, the distance values were not correlated to the detected RF levels since this photodiode presents a very small AM/PM coupling. Thus, the data selection described above was not applied. In practice, the minimal acceptable RF level was nevertheless raised from -45 dbm to -15 dbm to slightly improve the standard deviation for distances higher than 1 km. Indeed, the ADM resolution significantly deteriorates when the RF signal at the phasemeter input becomes lower than -2 dbm. An example of the results obtained with the PIN photodiode is presented in Figure 7 for a distance of 449 m, a distance equivalent to the results depicted in Figure 5 where the MSM photodiode was used. 9
10 FIG. 7. Results at 449 m using the PIN photodiode: relative distances and corresponding RF levels as a function of time (raw data in grey and selected points in red). The sudden variations in grey correspond to a laser beam that has been cut. Nevertheless, the distance resolution of our system is still limited by the knowledge of the refractive index of air. Up to now, we have fixed n to 1. As a consequence, change in the atmospheric parameters during the measurement process introduces drifts in the distance measurements. For example, a linear drift of 122 µm has been observed in Figure 8 for a distance of 97 m (MSM photodiode). As we did not observe such a drift for shorter distances (1 m for instance) we are confident that this drift is a real distance variation or a change in the atmospheric parameters. This drift can be explained for instance by an average temperature change of only.13 C over 97 m and it should be removed by the two-wavelength system we are currently developing. Nevertheless, we can already simulate the temperature-compensated distance removing these drifts by a first or second order polynomial curve fitting. Thus, in Figure 8, the corrected standard deviation equals to 12 µm instead of 37 µm with the only amplitude selection. Relative distance (mm) RF level (dbm) standard deviation of 11 µm. amplitude selection is not required time (s) FIG. 8. Linear drift of 122 µm (in blue) for a distance of 97 m when using the MSM photodiode (raw data in grey and selected points in red). Figure 9 summarizes measurement results: using the MSM photodiode, the standard deviation of raw data increases linearly with the distance up to 2 µm at 1 km (for RF level between -45 dbm and +9 dbm). With a selection of distance values corresponding to an amplitude equal to the reference path (±.5 db), the standard deviation is always less than 36 µm. Lastly, if the long-term drift is removed to simulate stable atmospheric parameters, we always obtain a standard deviation better than 15 µm. Relative distance(mm) time (s) Using the PIN photodiode, the data selection is not necessarily required. Thus, in Figure 9, the raw results for the PIN photodiode are overlapped by the selected data (minimum acceptable RF level risen to -15 dbm), except for the last point corresponding to a distance of 1162 m. Finally, we always obtained a standard deviation better than 15 µm after removing the 1
11 long-term drifts, like for the MSM photodiode. Nevertheless, the number of acceptable measurement data is more important: 87 % for the PIN photodiode instead of 4 % for the MSM photodiode at around 9 m. For a kilometric range, the same number of valid measurement points can be obtained approximately 2 times faster with the PIN photodiode than with the MSM photodiode. When the weather is more sunny and windy the number of valid measurement points is lower because of stronger amplitude variations, but the distance measurement is still possible and no significant difference of the standard deviation is observed. FIG. 9. Standard variation over the measured distances as a function of the absolute distance. In blue: raw data; in red: data selection taking into account RF level; in black: data selection and drift removing. For each colour, dots are for MSM photodiode while circles are for PIN photodiode. The percentages of selected points are indicated in red. V. CONCLUSION Standard Deviation (µm) raw data with data selection (±.5 db) with data selection + drift removed 8 1% 92% 87% 82% PIN photodiode 6 (circles) 4% 4 13% 8% 5% MSM photodiode 76% 24% 22% (dots) Distance (m) We have presented our first step in the realization of an air index compensated telemeter, consisting in the development of a high resolution telemeter working at 155 nm. We have demonstrated a resolution of 15 µm for a range of operation up to 1.2 km, even when a strong amplitude noise was observed on the optical beam due to air turbulence. We have also shown that the choice of a PIN photodiode, rather insensitive to the amplitude to phase coupling, improved significantly the telemeter performances: the major part of data was relevant and could be kept for distance measurements. The final step of our development will consist in adding a second wavelength (around 78 nm) in order to realize simultaneous measurements at both wavelengths to implement real time air index compensation. ACKNOWLEDGMENTS This work was partly funded by the European Metrology Research Programme (EMRP). The EMRP is jointly funded by the EMRP participating countries within EURAMET and the European Union. 11
12 REFERENCES 1 F. C. Demarest, Meas. Sci. Technol. 9, 124 (1998). 2 N. Bobroff, Meas. Sci. Technol. 4, 97 (1993). 3 B. Edlén, Metrologia, Vol. 2, No. 2, 71 (1966). 4 K. D. Froome and R. H. Bradsell, Journal of scientific instruments, vol. 38, 468 (1961). 5 K. D. Froome and R. H. Bradsell, Journal of scientific instruments, vol. 43, 129 (1966). 6 Proceedings of the workshop on the use and calibration of the Kern ME5 Mekometer, Stanford Linear Accelerator center, Stanford University, Stanford, California (1992). (available on : reports3/slac-r-43.pdf). 7 J. M. Rüeger, Electronic distance measurement, An introduction, (fourth edition, Springer-Verlag Berlin Heidelberg 1996). 8 G. Bönsch and E. Potulski, Metrologia, Vol. 35, No. 2, 133 (1998). 9 K. Meiners-Hagen and and A. Abou-Zeid, Measurement Science and Technology, Vol. 19, No. 8, 844 (28). 1 K.B. Earnshaw and E.N. Hernandez, OSA Applied Optics, Vol. 11, No. 4, 749 (1972). 11 L.E. Slater and G.R. Huggett, Journal of geophysical research, vol. 81, No. 35, 6299 (1976). 12 J. Gervaise, First results of the geodetic measurements carried out with the Terrameter, two-wavelength electronic distance measurement instrument Geodätischen Seminar über Electrooptische Präzisionsstreckenmessung, München, pp (1983). 13 J. Guillory, J-P. Wallerand, A-F. Obaton and C. Alexandre, Proceedings of the 214 Conference on Precision Electromagnetic Measurements (CPEM214), Rio de Janeiro, Brazil, pp (214). 14 J. Guillory, J. García-Márquez, C. Alexandre, D. Truong and J-P. Wallerand, Measurement Science and Technology, Vol. 26, No. 8, 846 (215). 15 D.H. Phung, M. Merzougui, C. Alexandre, and M. lintz, IEEE Journal of Lightwave Technology (JLT), Vol. 32, No. 2, 3759 (214). 12
13 Phasemeter RF 2 low RF carriers RF amplifier SWE S single chip SWE RF 1 DFB I BIAS Φ measure S EAM Bias voltage SWE mixer S bias tee Φ reference SWE LO EDFA PD lens optical power meter RF 1 = MHz RF 2 = MHz LO = 59 MHz Optical fiber terminations VOA singlemode fiber (1µm core diameter) RF = Radio Frequency LO = Local Oscillator S = RF Splitter DFB = Distributed FeedBack laser diode PD = PhotoDiode EDFA = Erbium Doped Fiber Amplifier VOA = Variable Optical Attenuator EAM = Electro-Absorption Modulator SWE = Electrical Switch Distance off-axis parabolic mirror optical splitter not used optical switch internal corner cube VOA. Reference path TARGET Measurement path fibered mirror corner cube
14
15 distance / optical power (µm/db) µw 3.1 µw 5.4 µw 63.6 µw 9.6µW 16.8 µw EM4 PIN Hamamatsu MSM 113. µw 2.5 µw 35.8 µw 22.1 µw 11.4 µw µw 3.7µW 52.8µW RF power detected at the phasemeter input (dbm)
16 45 Distance (m) STD STD = 451 mm 334 mm 91 mm 56 mm 7 mm the error bars are symmetric and 3 standard deviations long. for each distance, the standard deviation is indicated in red mm Half synthetic wavelength (m)
17 Relative distance (mm) RF level (dbm) standard deviation of 114 µm before 1 2 the amplitude 3 selection, µm after red = -3.5 dbm ±.5 db 12.8% of selected points time (s)
18 .2.1 Distance relative (mm) niveau RF (dbm)
19 Relative distance (mm) RF level (dbm) standard deviation of 11 µm. amplitude selection is not required time (s)
20 time (s) Relative distance(mm)
21 Standard Deviation (µm) raw data with data selection (±.5 db) with data selection + drift removed 8 1% 92% 87% 82% PIN photodiode 6 (circles) 4% 4 13% 8% 5% MSM photodiode 76% 24% 22% (dots) Distance (m)
a 1550nm telemeter for outdoor application based on off-the-shelf components
 a 155nm telemeter for outdoor application based on off-the-shelf components Joffray Guillory, Jean-Pierre Wallerand, Jorge Garcia Marquez, Daniel Truong (mechanical engineering), Christophe Alexandre (digital
Air index compensation for absolute distance measurements
 JRP IND53 Metrology for large volume measurements LUMINAR Air index compensation for absolute distance measurements Jean-Pierre Wallerand, Joffray Guillory, Daniel Truong, Christophe Alexandre Conservatoire
Towards Kilometric Distance Measurements with Air Refractive Index Compensation
 Towards Kilometric Distance Measurements with Air Refractive Index Compensation J. Guillory, J-P. Wallerand, D. Truong Laboratoire Commun de Métrologie LNE-Cnam, LNE, rue Gaston Boissier, 755 Paris, France
A Multiwavelength Interferometer for Geodetic Lengths
 A Multiwavelength Interferometer for Geodetic Lengths K. Meiners-Hagen, P. Köchert, A. Abou-Zeid, Physikalisch-Technische Bundesanstalt, Braunschweig Abstract: Within the EURAMET joint research project
Absolute distance interferometer in LaserTracer geometry
 Absolute distance interferometer in LaserTracer geometry Corresponding author: Karl Meiners-Hagen Abstract 1. Introduction 1 In this paper, a combination of variable synthetic and two-wavelength interferometry
Stability of a Fiber-Fed Heterodyne Interferometer
 Stability of a Fiber-Fed Heterodyne Interferometer Christoph Weichert, Jens Flügge, Paul Köchert, Rainer Köning, Physikalisch Technische Bundesanstalt, Braunschweig, Germany; Rainer Tutsch, Technische
SUPPLEMENTARY INFORMATION DOI: /NPHOTON
 Supplementary Methods and Data 1. Apparatus Design The time-of-flight measurement apparatus built in this study is shown in Supplementary Figure 1. An erbium-doped femtosecond fibre oscillator (C-Fiber,
Performance of the Prototype NLC RF Phase and Timing Distribution System *
 SLAC PUB 8458 June 2000 Performance of the Prototype NLC RF Phase and Timing Distribution System * Josef Frisch, David G. Brown, Eugene Cisneros Stanford Linear Accelerator Center, Stanford University,
CHAPTER 5 FINE-TUNING OF AN ECDL WITH AN INTRACAVITY LIQUID CRYSTAL ELEMENT
 CHAPTER 5 FINE-TUNING OF AN ECDL WITH AN INTRACAVITY LIQUID CRYSTAL ELEMENT In this chapter, the experimental results for fine-tuning of the laser wavelength with an intracavity liquid crystal element
It s Our Business to be EXACT
 671 LASER WAVELENGTH METER It s Our Business to be EXACT For laser applications such as high-resolution laser spectroscopy, photo-chemistry, cooling/trapping, and optical remote sensing, wavelength information
ADALAM Sensor based adaptive laser micromachining using ultrashort pulse lasers for zero-failure manufacturing D2.2. Ger Folkersma (Demcon)
") D2.2 Automatic adjustable reference path system Document Coordinator: Contributors: Dissemination: Keywords: Ger Folkersma (Demcon) Ger Folkersma, Kevin Voss, Marvin Klein (Demcon) Public Reference path,
D2.2 Automatic adjustable reference path system Document Coordinator: Contributors: Dissemination: Keywords: Ger Folkersma (Demcon) Ger Folkersma, Kevin Voss, Marvin Klein (Demcon) Public Reference path,
1550 nm Programmable Picosecond Laser, PM
 1550 nm Programmable Picosecond Laser, PM The Optilab is a programmable laser that produces picosecond pulses with electrical input pulses. It functions as a seed pulse generator for Master Oscillator
Setup of the four-wavelength Doppler lidar system with feedback controlled pulse shaping
 Setup of the four-wavelength Doppler lidar system with feedback controlled pulse shaping Albert Töws and Alfred Kurtz Cologne University of Applied Sciences Steinmüllerallee 1, 51643 Gummersbach, Germany
Supplementary Figures
 Supplementary Figures Supplementary Figure 1: Mach-Zehnder interferometer (MZI) phase stabilization. (a) DC output of the MZI with and without phase stabilization. (b) Performance of MZI stabilization
NEW LASER ULTRASONIC INTERFEROMETER FOR INDUSTRIAL APPLICATIONS B.Pouet and S.Breugnot Bossa Nova Technologies; Venice, CA, USA
 NEW LASER ULTRASONIC INTERFEROMETER FOR INDUSTRIAL APPLICATIONS B.Pouet and S.Breugnot Bossa Nova Technologies; Venice, CA, USA Abstract: A novel interferometric scheme for detection of ultrasound is presented.
IST IP NOBEL "Next generation Optical network for Broadband European Leadership"
 DBR Tunable Lasers A variation of the DFB laser is the distributed Bragg reflector (DBR) laser. It operates in a similar manner except that the grating, instead of being etched into the gain medium, is
Examination Optoelectronic Communication Technology. April 11, Name: Student ID number: OCT1 1: OCT 2: OCT 3: OCT 4: Total: Grade:
 Examination Optoelectronic Communication Technology April, 26 Name: Student ID number: OCT : OCT 2: OCT 3: OCT 4: Total: Grade: Declaration of Consent I hereby agree to have my exam results published on
20 GHz High Power, High Linearity Photodiode Part #ARX zz-DC-C-FL-FC
 Ver 2a, 4-25-2018 Product Specification 5800 Uplander Way Culver City, CA 90230 Tel: (310) 642-7975 sales@apichip.com www.apichip.com 20 GHz High Power, High Linearity Photodiode Part #ARX-20-50-zz-DC-C-FL-FC
Optoelectronic Oscillator Topologies based on Resonant Tunneling Diode Fiber Optic Links
 Optoelectronic Oscillator Topologies based on Resonant Tunneling Diode Fiber Optic Links Bruno Romeira* a, José M. L Figueiredo a, Kris Seunarine b, Charles N. Ironside b, a Department of Physics, CEOT,
PHOTONIC INTEGRATED CIRCUITS FOR PHASED-ARRAY BEAMFORMING
 PHOTONIC INTEGRATED CIRCUITS FOR PHASED-ARRAY BEAMFORMING F.E. VAN VLIET J. STULEMEIJER # K.W.BENOIST D.P.H. MAAT # M.K.SMIT # R. VAN DIJK * * TNO Physics and Electronics Laboratory P.O. Box 96864 2509
High stability multiplexed fibre interferometer and its application on absolute displacement measurement and on-line surface metrology
 High stability multiplexed fibre interferometer and its application on absolute displacement measurement and on-line surface metrology Dejiao Lin, Xiangqian Jiang and Fang Xie Centre for Precision Technologies,
Agilent 8703B Lightwave Component Analyzer Technical Specifications. 50 MHz to GHz modulation bandwidth
 Agilent 8703B Lightwave Component Analyzer Technical Specifications 50 MHz to 20.05 GHz modulation bandwidth 2 The 8703B lightwave component analyzer is a unique, general-purpose instrument for testing
Demonstration of multi-cavity optoelectronic oscillators based on multicore fibers
 Demonstration of multi-cavity optoelectronic oscillators based on multicore fibers Sergi García, Javier Hervás and Ivana Gasulla ITEAM Research Institute Universitat Politècnica de València, Valencia,
High Sensitivity Interferometric Detection of Partial Discharges for High Power Transformer Applications
 High Sensitivity Interferometric Detection of Partial Discharges for High Power Transformer Applications Carlos Macià-Sanahuja and Horacio Lamela-Rivera Optoelectronics and Laser Technology group, Universidad
CHAPTER 4 RESULTS. 4.1 Introduction
 CHAPTER 4 RESULTS 4.1 Introduction In this chapter focus are given more on WDM system. The results which are obtained mainly from the simulation work are presented. In simulation analysis, the study will
International Conference on Space Optics ICSO 2000 Toulouse Labège, France 5 7 December 2000
 ICSO 000 5 7 December 000 Edited by George Otrio Spatialized interferometer in integrated optics A. Poupinet, L. Pujol, O. Sosnicki, J. Lizet, et al. ICSO 000, edited by George Otrio, Proc. of SPIE Vol.
Gigabit Transmission in 60-GHz-Band Using Optical Frequency Up-Conversion by Semiconductor Optical Amplifier and Photodiode Configuration
 22 Gigabit Transmission in 60-GHz-Band Using Optical Frequency Up-Conversion by Semiconductor Optical Amplifier and Photodiode Configuration Jun-Hyuk Seo, and Woo-Young Choi Department of Electrical and
Agilent 81980/ 81940A, Agilent 81989/ 81949A, Agilent 81944A Compact Tunable Laser Sources
 Agilent 81980/ 81940A, Agilent 81989/ 81949A, Agilent 81944A Compact Tunable Laser Sources December 2004 Agilent s Series 819xxA high-power compact tunable lasers enable optical device characterization
Spectrally resolved frequency comb interferometry for long distance measurement
 Spectrally resolved frequency comb interferometry for long distance measurement Steven van den Berg, Sjoerd van Eldik, Nandini Bhattacharya Workshop Metrology for Long Distance Surveying 21 November 2014
Lab 12 Microwave Optics.
 b Lab 12 Microwave Optics. CAUTION: The output power of the microwave transmitter is well below standard safety levels. Nevertheless, do not look directly into the microwave horn at close range when the
INGAAS FAST PIN (RF) AMPLIFIED PHOTODETECTORS
 AMPLIFIED PHOTODETECTORS") INGAAS FAST PIN (RF) AMPLIFIED PHOTODETECTORS High Signal-to-Noise Ratio Ultrafast up to 9.5 GHz Free-Space or Fiber-Coupled InGaAs Photodetectors Wavelength Range from 750-1650 nm FPD310 FPD510-F https://www.thorlabs.com/newgrouppage9_pf.cfm?guide=10&category_id=77&objectgroup_id=6687
INGAAS FAST PIN (RF) AMPLIFIED PHOTODETECTORS High Signal-to-Noise Ratio Ultrafast up to 9.5 GHz Free-Space or Fiber-Coupled InGaAs Photodetectors Wavelength Range from 750-1650 nm FPD310 FPD510-F https://www.thorlabs.com/newgrouppage9_pf.cfm?guide=10&category_id=77&objectgroup_id=6687
InP-based Waveguide Photodetector with Integrated Photon Multiplication
 InP-based Waveguide Photodetector with Integrated Photon Multiplication D.Pasquariello,J.Piprek,D.Lasaosa,andJ.E.Bowers Electrical and Computer Engineering Department University of California, Santa Barbara,
671 Series LASER WAVELENGTH METER. The Power of Precision in Wavelength Measurement. It's Our Business to be Exact! bristol-inst.
 671 Series LASER WAVELENGTH METER The Power of Precision in Wavelength Measurement It's Our Business to be Exact! bristol-inst.com The 671 Series Laser Wavelength Meter is ideal for scientists and engineers
Holography Transmitter Design Bill Shillue 2000-Oct-03
 Holography Transmitter Design Bill Shillue 2000-Oct-03 Planned Photonic Reference Distribution for Test Interferometer The transmitter for the holography receiver is made up mostly of parts that are already
LOGARITHMIC PROCESSING APPLIED TO NETWORK POWER MONITORING
 ARITHMIC PROCESSING APPLIED TO NETWORK POWER MONITORING Eric J Newman Sr. Applications Engineer in the Advanced Linear Products Division, Analog Devices, Inc., email: eric.newman@analog.com Optical power
Zeeman Shifted Modulation Transfer Spectroscopy in Atomic Cesium
 Zeeman Shifted Modulation Transfer Spectroscopy in Atomic Cesium Modulation transfer spectroscopy (MTS) is a useful technique for locking a laser on one of the closed cesium D transitions. We have focused
Optoelectronic Components Testing with a VNA(Vector Network Analyzer) VNA Roadshow Budapest 17/05/2016
 VNA Roadshow Budapest 17/05/2016") Optoelectronic Components Testing with a VNA(Vector Network Analyzer) VNA Roadshow Budapest 17/05/2016 Content Introduction Photonics & Optoelectronics components Optical Measurements VNA (Vector Network
Optoelectronic Components Testing with a VNA(Vector Network Analyzer) VNA Roadshow Budapest 17/05/2016 Content Introduction Photonics & Optoelectronics components Optical Measurements VNA (Vector Network
RADIO-OVER-FIBER TRANSPORT SYSTEMS BASED ON DFB LD WITH MAIN AND 1 SIDE MODES INJECTION-LOCKED TECHNIQUE
 Progress In Electromagnetics Research Letters, Vol. 7, 25 33, 2009 RADIO-OVER-FIBER TRANSPORT SYSTEMS BASED ON DFB LD WITH MAIN AND 1 SIDE MODES INJECTION-LOCKED TECHNIQUE H.-H. Lu, C.-Y. Li, C.-H. Lee,
Fiber-based components. by: Khanh Kieu
 Fiber-based components by: Khanh Kieu Projects 1. Handling optical fibers, numerical aperture 2. Measurement of fiber attenuation 3. Connectors and splices 4. Free space coupling of laser into fibers 5.
Swept Wavelength Testing:
 Application Note 13 Swept Wavelength Testing: Characterizing the Tuning Linearity of Tunable Laser Sources In a swept-wavelength measurement system, the wavelength of a tunable laser source (TLS) is swept
20 GHz High Power, High Linearity Photodiode
 Product Specification 20 GHz High Power, High Linearity Photodiode Part #ARX-20-50-zz-DC-C-FL-FC Ver 2a, 4-25-2018 PRODUCT FEATURES Ultra-high responsivity Very high optical power handling capability over
PoS(PhotoDet 2012)051
051") Optical to electrical detection delay in avalanche photodiode based detector and its interpretation Josef Blažej 1 E-mail: blazej@fjfi.cvut.cz Ivan Procházka Jan Kodet Technical University in Munich FSG,
Optical to electrical detection delay in avalanche photodiode based detector and its interpretation Josef Blažej 1 E-mail: blazej@fjfi.cvut.cz Ivan Procházka Jan Kodet Technical University in Munich FSG,
Spurious-Mode Suppression in Optoelectronic Oscillators
 Spurious-Mode Suppression in Optoelectronic Oscillators Olukayode Okusaga and Eric Adles and Weimin Zhou U.S. Army Research Laboratory Adelphi, Maryland 20783 1197 Email: olukayode.okusaga@us.army.mil
High-Power Highly Linear Photodiodes for High Dynamic Range LADARs
 High-Power Highly Linear Photodiodes for High Dynamic Range LADARs Shubhashish Datta and Abhay Joshi th June, 6 Discovery Semiconductors, Inc. 9 Silvia Street, Ewing, NJ - 868, USA www.discoverysemi.com
visibility values: 1) V1=0.5 2) V2=0.9 3) V3=0.99 b) In the three cases considered, what are the values of FSR (Free Spectral Range) and
 V1=0.5 2) V2=0.9 3) V3=0.99 b) In the three cases considered, what are the values of FSR (Free Spectral Range) and") EXERCISES OF OPTICAL MEASUREMENTS BY ENRICO RANDONE AND CESARE SVELTO EXERCISE 1 A CW laser radiation (λ=2.1 µm) is delivered to a Fabry-Pérot interferometer made of 2 identical plane and parallel mirrors
EXERCISES OF OPTICAL MEASUREMENTS BY ENRICO RANDONE AND CESARE SVELTO EXERCISE 1 A CW laser radiation (λ=2.1 µm) is delivered to a Fabry-Pérot interferometer made of 2 identical plane and parallel mirrors
Suppression of amplitude-to-phase noise conversion in balanced optical-microwave phase detectors
 Suppression of amplitude-to-phase noise conversion in balanced optical-microwave phase detectors Maurice Lessing, 1,2 Helen S. Margolis, 1 C. Tom A. Brown, 2 Patrick Gill, 1 and Giuseppe Marra 1* Abstract:
A NOVEL SCHEME FOR OPTICAL MILLIMETER WAVE GENERATION USING MZM
 A NOVEL SCHEME FOR OPTICAL MILLIMETER WAVE GENERATION USING MZM Poomari S. and Arvind Chakrapani Department of Electronics and Communication Engineering, Karpagam College of Engineering, Coimbatore, Tamil
PowerSource TM. Tunable High Power CW Laser Module with Integrated Wavelength Monitoring 1935 TLI. Principle and Setup CONTENTS DESCRIPTION STANDARDS
 1935 TLI Principle and Setup This application note describes how to implement the PowerSource TM 1935 TLI laser module in order to get the highest performance during its use. For a long life time operation,
3 General Principles of Operation of the S7500 Laser
 Application Note AN-2095 Controlling the S7500 CW Tunable Laser 1 Introduction This document explains the general principles of operation of Finisar s S7500 tunable laser. It provides a high-level description
Low Phase Noise Laser Synthesizer with Simple Configuration Adopting Phase Modulator and Fiber Bragg Gratings
 ALMA Memo #508 Low Phase Noise Laser Synthesizer with Simple Configuration Adopting Phase Modulator and Fiber Bragg Gratings Takashi YAMAMOTO 1, Satoki KAWANISHI 1, Akitoshi UEDA 2, and Masato ISHIGURO
Physics 476LW. Advanced Physics Laboratory - Microwave Optics
 Physics 476LW Advanced Physics Laboratory Microwave Radiation Introduction Setup The purpose of this lab is to better understand the various ways that interference of EM radiation manifests itself. However,
Photonics (OPTI 510R 2017) - Final exam. (May 8, 10:30am-12:30pm, R307)
 - Final exam. (May 8, 10:30am-12:30pm, R307)") Photonics (OPTI 510R 2017) - Final exam (May 8, 10:30am-12:30pm, R307) Problem 1: (30pts) You are tasked with building a high speed fiber communication link between San Francisco and Tokyo (Japan) which
Photonics (OPTI 510R 2017) - Final exam (May 8, 10:30am-12:30pm, R307) Problem 1: (30pts) You are tasked with building a high speed fiber communication link between San Francisco and Tokyo (Japan) which
S.M. Vaezi-Nejad, M. Cox, J. N. Copner
 Development of a Novel Approach for Accurate Measurement of Noise in Laser Diodes used as Transmitters for Broadband Communication Networks: Relative Intensity Noise S.M. Vaezi-Nejad, M. Cox, J. N. Copner
Optical generation of frequency stable mm-wave radiation using diode laser pumped Nd:YAG lasers
 Optical generation of frequency stable mm-wave radiation using diode laser pumped Nd:YAG lasers T. Day and R. A. Marsland New Focus Inc. 340 Pioneer Way Mountain View CA 94041 (415) 961-2108 R. L. Byer
Fibre Optic Sensors: basic principles and most common applications
 SMR 1829-21 Winter College on Fibre Optics, Fibre Lasers and Sensors 12-23 February 2007 Fibre Optic Sensors: basic principles and most common applications (PART 2) Hypolito José Kalinowski Federal University
Designing for Femtosecond Pulses
 Designing for Femtosecond Pulses White Paper PN 200-1100-00 Revision 1.1 July 2013 Calmar Laser, Inc www.calmarlaser.com Overview Calmar s femtosecond laser sources are passively mode-locked fiber lasers.
Femtosecond Synchronization of Laser Systems for the LCLS
 Femtosecond Synchronization of Laser Systems for the LCLS, Lawrence Doolittle, Gang Huang, John W. Staples, Russell Wilcox (LBNL) John Arthur, Josef Frisch, William White (SLAC) 26 Aug 2010 FEL2010 1 Berkeley
Department of Electrical Engineering and Computer Science, Massachusetts Institute of Technology, 77. Table of Contents 1
 Efficient single photon detection from 500 nm to 5 μm wavelength: Supporting Information F. Marsili 1, F. Bellei 1, F. Najafi 1, A. E. Dane 1, E. A. Dauler 2, R. J. Molnar 2, K. K. Berggren 1* 1 Department
Multi-format all-optical-3r-regeneration technology
 Multi-format all-optical-3r-regeneration technology Masatoshi Kagawa Hitoshi Murai Amount of information flowing through the Internet is growing by about 40% per year. In Japan, the monthly average has
Precision displacement interferometry with stabilization of wavelength on air
 EPJ Web of Conferences 48, 00014 (2013) DOI: 10.1051/epjconf/20134800014 Owned by the authors, published by EDP Sciences, 2013 Precision displacement interferometry with stabilization of wavelength on
Theory and Applications of Frequency Domain Laser Ultrasonics
 1st International Symposium on Laser Ultrasonics: Science, Technology and Applications July 16-18 2008, Montreal, Canada Theory and Applications of Frequency Domain Laser Ultrasonics Todd W. MURRAY 1,
BROAD-BAND rare-earth-doped fiber sources have been
 JOURNAL OF LIGHTWAVE TECHNOLOGY, VOL. 15, NO. 8, AUGUST 1997 1587 Feedback Effects in Erbium-Doped Fiber Amplifier/Source for Open-Loop Fiber-Optic Gyroscope Hee Gap Park, Kyoung Ah Lim, Young-Jun Chin,
Coherent Receivers Principles Downconversion
 Coherent Receivers Principles Downconversion Heterodyne receivers mix signals of different frequency; if two such signals are added together, they beat against each other. The resulting signal contains
CO2 laser heating system for thermal compensation of test masses in high power optical cavities. Submitted by: SHUBHAM KUMAR to Prof.
 CO2 laser heating system for thermal compensation of test masses in high power optical cavities. Submitted by: SHUBHAM KUMAR to Prof. DAVID BLAIR Abstract This report gives a description of the setting
SYLLABUS Optical Fiber Communication
 SYLLABUS Optical Fiber Communication Subject Code : IA Marks : 25 No. of Lecture Hrs/Week : 04 Exam Hours : 03 Total no. of Lecture Hrs. : 52 Exam Marks : 100 UNIT - 1 PART - A OVERVIEW OF OPTICAL FIBER
Pixel-remapping waveguide addition to an internally sensed optical phased array
 Pixel-remapping waveguide addition to an internally sensed optical phased array Paul G. Sibley 1,, Robert L. Ward 1,, Lyle E. Roberts 1,, Samuel P. Francis 1,, Simon Gross 3, Daniel A. Shaddock 1, 1 Space
Keysight Technologies Optical Power Meter Head Special Calibrations. Brochure
 Keysight Technologies Optical Power Meter Head Special Calibrations Brochure Introduction The test and measurement equipment you select and maintain in your production and qualification setups is one of
Performance Evaluation of 32 Channel DWDM System Using Dispersion Compensation Unit at Different Bit Rates
 Performance Evaluation of 32 Channel DWDM System Using Dispersion Compensation Unit at Different Bit Rates Simarpreet Kaur Gill 1, Gurinder Kaur 2 1Mtech Student, ECE Department, Rayat- Bahra University,
MICROWAVE OPTICS. Instruction Manual and Experiment Guide for the PASCO scientific Model WA-9314B G
 Includes Teacher's Notes and Typical Experiment Results Instruction Manual and Experiment Guide for the PASCO scientific Model WA-9314B 012-04630G MICROWAVE OPTICS 10101 Foothills Blvd. Roseville, CA 95678-9011
Directly Chirped Laser Source for Chirped Pulse Amplification
 Directly Chirped Laser Source for Chirped Pulse Amplification Input pulse (single frequency) AWG RF amp Output pulse (chirped) Phase modulator Normalized spectral intensity (db) 64 65 66 67 68 69 1052.4
Flicker noise of high-speed p-i-n photodiodes
 Jet Propulsion Laboratory California Institute of Technology Flicker noise of high-speed p-i-n photodiodes E. Rubiola #%, E. Salik @%, N. Yu %, L. Maleki % # FEMTO-ST Institute, Besançon, France % JPL/CALTECH,
The 34th International Physics Olympiad
 The 34th International Physics Olympiad Taipei, Taiwan Experimental Competition Wednesday, August 6, 2003 Time Available : 5 hours Please Read This First: 1. Use only the pen provided. 2. Use only the
Integrated Optoelectronic Chips for Bidirectional Optical Interconnection at Gbit/s Data Rates
 Bidirectional Optical Data Transmission 77 Integrated Optoelectronic Chips for Bidirectional Optical Interconnection at Gbit/s Data Rates Martin Stach and Alexander Kern We report on the fabrication and
Agilent 86030A 50 GHz Lightwave Component Analyzer Product Overview
 Agilent 86030A 50 GHz Lightwave Component Analyzer Product Overview 2 Characterize 40 Gb/s optical components Modern lightwave transmission systems require accurate and repeatable characterization of their
Dynamic gain-tilt compensation using electronic variable optical attenuators and a thin film filter spectral tilt monitor
 Dynamic gain-tilt compensation using electronic variable optical attenuators and a thin film filter spectral tilt monitor P. S. Chan, C. Y. Chow, and H. K. Tsang Department of Electronic Engineering, The
Frequency Scanned Interferometer Demonstration System
 Frequency Scanned Interferometer Demonstration System Jason Deibel, Sven Nyberg, Keith Riles, Haijun Yang University of Michigan, Ann Arbor American Linear Collider Workshop SLAC, Stanford University January
Highly Reliable 40-mW 25-GHz 20-ch Thermally Tunable DFB Laser Module, Integrated with Wavelength Monitor
 Highly Reliable 4-mW 2-GHz 2-ch Thermally Tunable DFB Laser Module, Integrated with Wavelength Monitor by Tatsuya Kimoto *, Tatsushi Shinagawa *, Toshikazu Mukaihara *, Hideyuki Nasu *, Shuichi Tamura
Realization of 16-channel digital PGC demodulator for fiber laser sensor array
 Journal of Physics: Conference Series Realization of 16-channel digital PGC demodulator for fiber laser sensor array To cite this article: Lin Wang et al 2011 J. Phys.: Conf. Ser. 276 012134 View the article
Optical phase-locked loop for coherent transmission over 500 km using heterodyne detection with fiber lasers
 Optical phase-locked loop for coherent transmission over 500 km using heterodyne detection with fiber lasers Keisuke Kasai a), Jumpei Hongo, Masato Yoshida, and Masataka Nakazawa Research Institute of
Mode analysis of Oxide-Confined VCSELs using near-far field approaches
 Annual report 998, Dept. of Optoelectronics, University of Ulm Mode analysis of Oxide-Confined VCSELs using near-far field approaches Safwat William Zaki Mahmoud We analyze the transverse mode structure
Femtosecond-stability delivery of synchronized RFsignals to the klystron gallery over 1-km optical fibers
 FEL 2014 August 28, 2014 THB03 Femtosecond-stability delivery of synchronized RFsignals to the klystron gallery over 1-km optical fibers Kwangyun Jung 1, Jiseok Lim 1, Junho Shin 1, Heewon Yang 1, Heung-Sik
Kit for building your own THz Time-Domain Spectrometer
 Kit for building your own THz Time-Domain Spectrometer 16/06/2016 1 Table of contents 0. Parts for the THz Kit... 3 1. Delay line... 4 2. Pulse generator and lock-in detector... 5 3. THz antennas... 6
Angular Drift of CrystalTech (1064nm, 80MHz) AOMs due to Thermal Transients. Alex Piggott
 AOMs due to Thermal Transients. Alex Piggott") Angular Drift of CrystalTech 38 197 (164nm, 8MHz) AOMs due to Thermal Transients Alex Piggott July 5, 21 1 .1 General Overview of Findings The AOM was found to exhibit significant thermal drift effects,
Angular Drift of CrystalTech 38 197 (164nm, 8MHz) AOMs due to Thermal Transients Alex Piggott July 5, 21 1 .1 General Overview of Findings The AOM was found to exhibit significant thermal drift effects,
A refractivity-compensated absolute distance interferometer as prospective novel primary standard for baseline calibrations
 A refractivity-compensated absolute distance interferometer as prospective novel primary standard for baseline calibrations (1), Alen Bošnjakovic (2) and Florian Pollinger (1) (1) Physikalisch-Technische
A PORTABLE RUBIDIUM FOUNTAIN 1
 A PORTABLE RUBIDIUM FOUNTAIN 1 P. D. Kunz Time and Frequency Division National Institute of Standards and Technology 325 Broadway, Boulder, CO 80305 kunzp@nist.gov T. P. Heavner (heavner@nist.gov) and
Instruction manual and data sheet ipca h
 1/15 instruction manual ipca-21-05-1000-800-h Instruction manual and data sheet ipca-21-05-1000-800-h Broad area interdigital photoconductive THz antenna with microlens array and hyperhemispherical silicon
Bias errors in PIV: the pixel locking effect revisited.
 Bias errors in PIV: the pixel locking effect revisited. E.F.J. Overmars 1, N.G.W. Warncke, C. Poelma and J. Westerweel 1: Laboratory for Aero & Hydrodynamics, University of Technology, Delft, The Netherlands,
LIGO Photodiode Development and Optical Platform for LIGO Photodetectors Testing
 LIGO Photodiode Development and Optical Platform for LIGO Photodetectors Testing EOPM EOAM PBS EOPM EOAM Ke-Xun Sun Photodiodes --- with Rana Adhikari, Peter Fritschel, Osamu Miyakawa, Allan Weinstein,
850NM SINGLE MODE VCSEL TO-46 PACKAGE
 DATA SHEET 850NM SINGLE MODE VCSEL TO-46 PACKAGE HFE4093-332 FEATURES: Designed for drive currents between 1 and 5 ma Optimized for low dependence of electrical properties over temperature High speed 1
Improving a commercially available heterodyne laser interferometer to sub-nm uncertainty
 Improving a commercially available heterodyne laser interferometer to sub-nm uncertainty H. Haitjema, S.J.A.G. Cosijns, N.J.J. Roset and M.J.Jansen Eindhoven University of Technology, PO Box 513, 56 MB
la. Smith and C.P. Burger Department of Mechanical Engineering Texas A&M University College Station Tx
 INJECTION LOCKED LASERS AS SURF ACE DISPLACEMENT SENSORS la. Smith and C.P. Burger Department of Mechanical Engineering Texas A&M University College Station Tx. 77843 INTRODUCTION In an age where engineered
R. J. Jones Optical Sciences OPTI 511L Fall 2017
 R. J. Jones Optical Sciences OPTI 511L Fall 2017 Semiconductor Lasers (2 weeks) Semiconductor (diode) lasers are by far the most widely used lasers today. Their small size and properties of the light output
The Lightwave Model 142 CW Visible Ring Laser, Beam Splitter, Model ATM- 80A1 Acousto-Optic Modulator, and Fiber Optic Cable Coupler Optics Project
 The Lightwave Model 142 CW Visible Ring Laser, Beam Splitter, Model ATM- 80A1 Acousto-Optic Modulator, and Fiber Optic Cable Coupler Optics Project Stephen W. Jordan Seth Merritt Optics Project PH 464
PHASE TO AMPLITUDE MODULATION CONVERSION USING BRILLOUIN SELECTIVE SIDEBAND AMPLIFICATION. Steve Yao
 PHASE TO AMPLITUDE MODULATION CONVERSION USING BRILLOUIN SELECTIVE SIDEBAND AMPLIFICATION Steve Yao Jet Propulsion Laboratory, California Institute of Technology 4800 Oak Grove Dr., Pasadena, CA 91109
An Optical Characteristic Testing System for the Infrared Fiber in a Transmission Bandwidth 9-11μm
 An Optical Characteristic Testing System for the Infrared Fiber in a Transmission Bandwidth 9-11μm Ma Yangwu *, Liang Di ** Center for Optical and Electromagnetic Research, State Key Lab of Modern Optical
Effects of Incident Optical Power on the Effective Reverse Bias Voltage of Photodiodes This Lab Fact demonstrates how the effective reverse bias
 Effects of Incident Optical Power on the Effective Reverse Bias Voltage of Photodiodes This Lab Fact demonstrates how the effective reverse bias voltage on a photodiode can vary as a function of the incident
LASER RANGE FINDING BASED ON CORRELATION METHOD
 LASER RANGE FINDING BASED ON CORRELATION METHOD B. Journet and J.C. Lourme Laboratoire d'electricité Signaux et Robotique Ecole Normale Supérieure de Cachan, France Abstract: The purpose of the paper is
Opto-VLSI-based reconfigurable photonic RF filter
 Research Online ECU Publications 29 Opto-VLSI-based reconfigurable photonic RF filter Feng Xiao Mingya Shen Budi Juswardy Kamal Alameh This article was originally published as: Xiao, F., Shen, M., Juswardy,
SPRAY DROPLET SIZE MEASUREMENT
 SPRAY DROPLET SIZE MEASUREMENT In this study, the PDA was used to characterize diesel and different blends of palm biofuel spray. The PDA is state of the art apparatus that needs no calibration. It is
Translational Doppler detection using direct-detect chirped, amplitude-modulated laser radar
 Translational Doppler detection using direct-detect chirped, amplitude-modulated laser radar William Ruff, Keith Aliberti, Mark Giza, William Potter, Brian Redman, Barry Stann US Army Research Laboratory