10:00-10:30 HOMOGENIZATION OF THE GLOBAL TEMPERATURE Victor Venema, University of Bonn
|
|
|
- Dwight Lloyd
- 5 years ago
- Views:
Transcription
 articles.")
1 10:00-10:30 HOMOGENIZATION OF THE GLOBAL TEMPERATURE Victor Venema, University of Bonn The comments in these notes are only intended to clarify the slides and should be seen as informal, just like words spoken at the meeting. The exact formulations are in the (to be published) articles. 1
2 Homogenization of the global temperature Victor Venema, University of Bonn, Meteorological institute, Bonn, Germany Ralf Lindau, University of Bonn, Meteorological institute, Bonn, Germany The global land temperature trend may be biased due to remaining inhomogeneities. Well-homogenized national datasets on average clearly show more warming than global collections (GHCN, CRUTEM, GISTEMP, etc.) when averaged over the region of common coverage. We will present the temperature trend differences for several dozen national temperature series. This finding makes research into statistical homogenization more pressing. We have estimates for the uncertainties due to remaining inhomogeneities from numerical validation studies. We urgently need analytic work on the uncertainties in a certain dataset or station that is based on the inhomogeneities found and the network characteristics. 2
3 Recent improvements in the quality of homogenization were largely due to the introduction of multiple breakpoint methods that can work with inhomogeneous reference series. These multiple breakpoint methods, however, do not have an optimal method yet to determine the number of breaks whose position can be accurately determined. The joint homogenization of all series simultaneously promises an optimal solution of the problem that also the reference stations have inhomogeneities. Also work on the selection of the best correction model (annual, seasonal, monthly, daily of the only the means or also of the higher moments) is needed. The homogenization of daily data is even harder. Only inhomogeneities in the mean, but not in the variability around the mean are used. Corrections in the variability are applied deterministically, while many error sources are not perfectly predictable. The correction of daily data should probably be treated similarly to downscaling. 2
4 3
5 4
6 5

7 Three correlated stations over 120 years to illustrate how relative homogenization works. More details on: 6

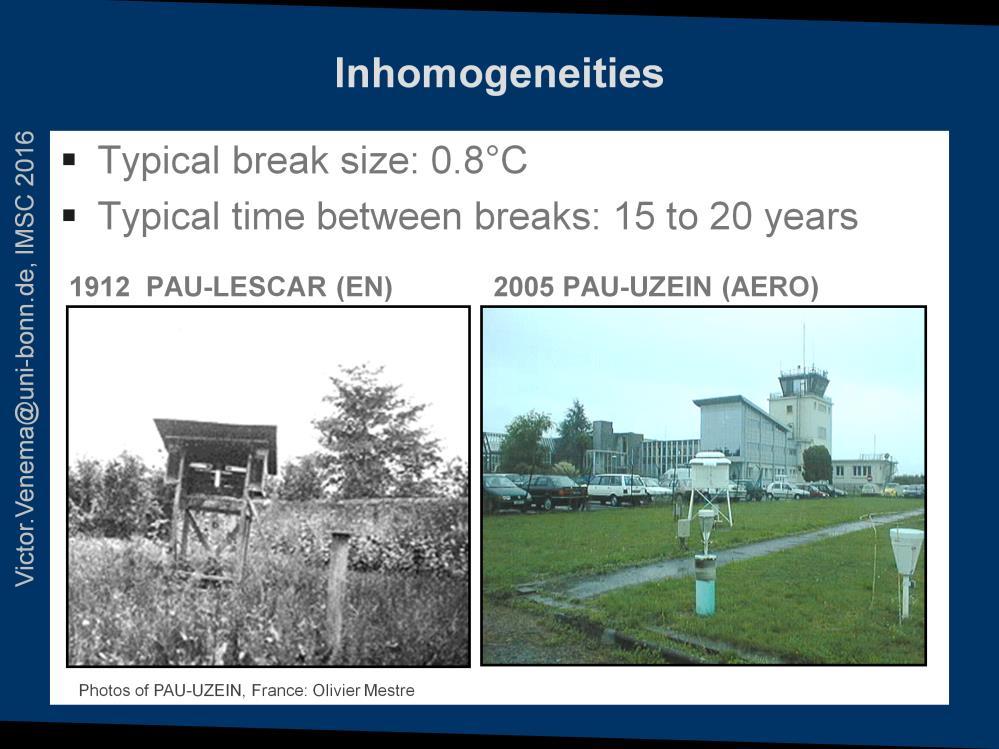
8 Station A has a break of 0.8 C in the middle in If you only had this signal it would be hard to see if this is a climatic trend or a break. 7
9 If you look at the difference series the break is much clearer. In this random example, it is still hard to decide if the break is abrupt or a short term gradual inhomogeneity. 8
10 Also gradual inhomogeneities in single series can be detected with relative homogenization. 9
11 Also multiple breakpoints can be detected with relative homogenization, which is quite typical for climate applications. 10
12 This is a short summary of the current state of a project comparing nationally/regionally homogenized temperature series with what global datasets say about the temperature increase in the same period. 11

13 This figure shows the *difference* in the temperature signals of BEST and the national series. Over longer periods we have less countries to compare with, but a clearer signal to analyse. The national series, which we trust more, show more warming than BEST. 1864: 7 countries 1926: 14 countries 12
14 Over shorter periods, we do not see much difference. We are currently analysing whether the quality of the datasets can explain the difference between the datasets (and periods shown). 13

15 Comparing all three global datasets that are mostly complete at the moment, we see that BEST has the largest difference, then GISTEM and the CRUCY. GHCN was similar to GISTEM and CRUCY similar to CRUTEM in previous analysis of a smaller number of series. 14
16 The previous slides suggest that homogenization is an important problem. We now introduce 5 problems in homogenization that are interesting for statisticians. The first problem is the multiple breakpoint problem. Rather than thinking in one break and incase of more just splitting the series, if you formulate the multiple breakpoint problem you make a decomposition of the difference time series in a break signal and noise. Already thinking in terms of a break signal (and its statistical properties) is very productive. 15

17 For high SNR the standard break search (PRODIGE) works well and how a low mean square error. However, if the SNR is about 0.5, this segmentation is about as good as a random segmentation. This can be understood by noticing that the random segmentation also explains half of the break variance. A random segmentation thus explains more variance than it would in case of white noise. A random segmentation is thus statistically significant, which is right because the signal contains breaks, but the positions are random relative to the real breaks. There is also an interaction between the break and noise signals that makes the explained variance even larger. For details see this manuscript: The SNR of the HOME benchmark dataset (Venema et al., 2012) was in average as high as Should have been around 2x smaller. 16

18 Especially because detection breaks is difficult for low SNR it is desirable to have methods to estimate the statistical properties of the break signal without have to homogenize a series. This slide shows a method developed by Ralf Lindau to do so by studying the relationship between the variance explained by the break signal in case you insert random breaks. In case of noise, the explained variance grows slowly with the number of random breaks inserted, in case of breaks it initially grows faster. How fast is an indication of the number of breaks. We are working on a method to estimate which fraction of the break variance is due to a random walk and how much is because of noisy deviations from a baseline. See next slide for the importance of this problem. 17
19 18
20 Relative homogenization (using a reference series) is necessary in climatology, however it does introduce the problem that breaks in the difference time series can also be due to the reference. The statistically tractable way to solve this is to detect breaks in multiple pairs of series simultaneously: joint detection. An important problem in climatology is that we sometimes have breaks that happen at the same time in all stations of a network. Nationally these breaks are known, but in global datasets this information is often lost and we need to detect them statistically. Joint detection should thus be performed on a large enough dataset so that multiple networks are included. 19
21 We have two main numerical estimates of the trend error remaining after homogenization. The estimate of HOME is certainly too small for Europe because the network-wide trend error was very small and thus hard to remove. The estimate of NOAA may be too large because the trend error was rather large. Both estimates are optimistic for the rest of the world where the station density is much lower and thus the SNR, which we have shown is very important. The International Surface Temperature Initiative (ISTI) is working on a numerical validation study that included the entire globe and thus samples all network densities. This will provide a better numerical estimate of the global temperature trend error after homogenization. 20

22 This is a figure from the NOAA validation study. Probably the most realistic case. It shows that the trend error in the raw data is reduced, but not fully removed. 21

23 In this less realistic case (too many small breaks) only half of the trend error is removed. That the breaks are more difficult could compensate for the lower network density in the rest of the world. 22

24 Figure illustrates a decomposition of three series. 23

25 When you compute the corrections, the predictors are the break positions and the predictand is the break signal. If you do not have perfect predictors, you will explain less than 100% of the break variance and thus also underestimate how much the trend would need to be corrected. Numerical studies show that when we know all breaks, the trend correction can be noisy, but is not biased. When there are errors in the break positions, we undercorrect the trend bias. 24
26 This figure illustrates why correcting a network-wide bias is difficult when using a composite reference. The grey lines and the highlighted blue line have a break in the period 1920 to This break introduces a network wide bias, but also has a station specific component. This station specific component is removed, but the network-wide bias is harder to remove because it is also in the reference. We thus need to remove all reference stations from our composite reference that contain breaks or use other methods to reduce the influence of breaks in the reference. 25

27 In the comparison study mentioned at the beginning half of the networks used a pairwise method for correction. Of those that used a composite reference most did not remove all stations with a break from their composite reference (some did apply other methods that may reduce the bias, such as iterations). 26

28 The previous problems were about the homogenization of the mean of monthly or annual means. Homogenization of daily data is a lot more difficult, but also more important because breaks in the tails are larger than the ones in the mean. Breaks in the variability are furthermore paramount for trend in extremes. The more extreme the extreme, the more important variance is. 27
29 28
. Possibly because the siting of these high-tech sub-daily siting has improved more.")
30 The sub-daily dataset HadISDH has a much stronger temperature bias than the one seen in GHCNv3 when homogenized with the same method (PHA). Possibly because the siting of these high-tech sub-daily siting has improved more. 29
")
31 Figures from Parker (1998) 30

32 This and the next slides show how large break in the tails can be. 31

33 Böhm, R., P.D. Jones, J. Hiebl, D. Frank, M. Brunetti, M. Maugeri. The early instrumental warm-bias: a solution for long central European temperature series Climatic Change, 101, pp , doi /s ,

34 Böhm, R., P.D. Jones, J. Hiebl, D. Frank, M. Brunetti, M. Maugeri. The early instrumental warm-bias: a solution for long central European temperature series Climatic Change, 101, pp , doi /s ,
35 34
36 35

37 Both the mean and the variance are important for changes in extremes. 36

38 Katz and Brown argue that if the mean and the variance change, there is always some threshold above which the change in the variance is more important than the change in the mean. (This could still be for extremes that have return periods beyond human time scales.) 37
. However, the error is a function of many other variables.")
39 Most used correction methods for daily data only correct for changes in the mean. Popular is the method of Lucie Vincent that uses the monthly mean adjustments. Current methods adjust the temperature as a function temperature (deterministic). However, the error is a function of many other variables. If these are unknown, this part should be added as noise (stochastically), rather than deterministically. 38
 of a series that has a trend, you also change the trend in the mean if you simply change the variance (by subtracting the mean and")
40 In downscaling it is known that applying deterministic corrections rather than adding noise leads to problems (variance inflation). If you would like to change the variance (and not the mean) of a series that has a trend, you also change the trend in the mean if you simply change the variance (by subtracting the mean and multiplying with a constant); see figure. If you add the variance as noise this does not happen. In homogenization, the difference times series normally does not have a trend, but there could be problems when correcting gradual inhomogeneities. These are corrected well with multiple breaks in the mean when homogenizing the mean, but in case we need to change the variance, we may see the variance inflation problem here. 39

41 Another problem is when there is a change in the cross-correlation between because the noise source changed. For example, first the noise is due to a radiation error and later due to a shorter response time. The radiation error will correlate with its neighbors, the faster response time will not. This leads to a change in the variance in the difference time series that is not indicative a change in the variance of the individual series. 40

42 In this example of the above problem with a change in the cross correlations, the variance which stayed the same before and after homogenization was change due to homogenization with HOMAD because the variance of the difference time series had changed. This likely happens for every deterministic correction method for the distribution. 41
 made the variance of the data worse. They could still improve the trend in the mean, like all the other methods.")
43 Numerical validation study of homogenization of daily data by Rachel Killick (nee Warren). She produced homogeneous data, added (stochastic) inhomogeneities that depend on clouds and wind. The methods that attempted to improve the distribution (PDF) made the variance of the data worse. They could still improve the trend in the mean, like all the other methods. 8 different algorithms homogenised the datasets: 3 made constant mean adjustments (Climatol-Daily, ACMANT and MAC-D), two others made variable mean adjustments (Climatol-Monthly and MASH) and DAP, HOM and SPLIDHOM were the only three that explicitly sought to homogenise the whole distribution and they were largely the lowest performing algorithms. Three reasons for this could be: 1, They only used one reference station, making it more likely that inhomogeneities were allocated to the wrong station, 2, Their detection algorithm was not sensitive enough, meaning that many inhomogeneities were left in the data and 3, They were tuned to European data and, although the data created were designed to be generaliseable, these specific data were made to mimic North America. The two plots show the percentage of station biases improved (reduced), unchanged and made worse (increased) out of number of total number of stations and the percentage of station variabilities (assessed using standard deviations) improved, 42
44 unchanged and made worse out of total number of stations for each algorithm. As I say, I didn't have any plots to illustrate this before, so only thought of creating these last week as they seemed the best way to get a reasonable amount of information across without using too much space, let me know if it isn't fit for purpose and I'll see what else I can come up with, I looked at density plots for regions, but when you are aggregating over such a big group the differences aren't really obvious. 42

45 The last problem is for both monthly means and daily distributions, it is how to select the right complexity for homogenization corrections. 43

46 Concluding, we see a stronger trend in national datasets, which we expect to be mostly better homogenized. Note, this is just the land surface temperature and not the global (land+ocean) temperature. This suggests a cooling bias in the global mean temperature. Our understanding of relative homogenization is that if there is a bias, we will undercorrect it. Especially when the SNR is low, the breaks are poorly defined and the correction methods can thus not improve the trends much. The situation for daily data my be even worse. Also many other changes in the climate system going faster than expected suggest that we underestimated the temperature trend. 44

47 Recap of the 5 main statistically interesting problems for during the Q&A. 45
10/27/2014. Content. What is all about Homogenization? What do we homogenize? Gradual inhomogeneities
 Current Homogenization Approaches Applied in Climate Science Strengths and Weaknesses Content The problems of homogenization (and solution paths) Direct homogenization Relative homogenization Absolute
Content. Many solutions (for monthly data)! Benchmark dataset ADVANCES IN HOMOGENISATION METHODS OF CLIMATE SERIES: AN INTEGRATED APPROACH
! Benchmark dataset ADVANCES IN HOMOGENISATION METHODS OF CLIMATE SERIES: AN INTEGRATED APPROACH") The COST-HOME monthly benchmark dataset with temperature and precipitation data for testing homogenisation algorithms Victor Venema, Enric Aguilar, José A. Guijarro and Olivier Mestre COST Action Content
The COST-HOME monthly benchmark dataset with temperature and precipitation data for testing homogenisation algorithms Victor Venema, Enric Aguilar, José A. Guijarro and Olivier Mestre COST Action Content
Changes in rainfall seasonality in the tropics
 SUPPLEMENTARY INFORMATION DOI: 10.1038/NCLIMATE1907 Changes in rainfall seasonality in the tropics Xue Feng 1, Amilcare Porporato 1,2 *, and Ignacio Rodriguez-Iturbe 3 Supplementary information 1 Department
Pixel Response Effects on CCD Camera Gain Calibration
 1 of 7 1/21/2014 3:03 PM HO M E P R O D UC T S B R IE F S T E C H NO T E S S UP P O RT P UR C HA S E NE W S W E B T O O L S INF O C O NTA C T Pixel Response Effects on CCD Camera Gain Calibration Copyright
Chapter 2 Distributed Consensus Estimation of Wireless Sensor Networks
 Chapter 2 Distributed Consensus Estimation of Wireless Sensor Networks Recently, consensus based distributed estimation has attracted considerable attention from various fields to estimate deterministic
Lecture - 06 Large Scale Propagation Models Path Loss
 Fundamentals of MIMO Wireless Communication Prof. Suvra Sekhar Das Department of Electronics and Communication Engineering Indian Institute of Technology, Kharagpur Lecture - 06 Large Scale Propagation
SELECTING RELEVANT DATA
 EXPLORATORY ANALYSIS The data that will be used comes from the reviews_beauty.json.gz file which contains information about beauty products that were bought and reviewed on Amazon.com. Each data point
MESA 1. INTRODUCTION
 MESA 1. INTRODUCTION MESA is a program that gives accurate trading signals based on the measurement of short term cycles in the market. Cycles exist on every scale from the atomic to the galactic. Therefore,
Chapter 4 SPEECH ENHANCEMENT
 44 Chapter 4 SPEECH ENHANCEMENT 4.1 INTRODUCTION: Enhancement is defined as improvement in the value or Quality of something. Speech enhancement is defined as the improvement in intelligibility and/or
The Calibration of Measurement Systems. The art of using a consistency chart
 Quality Digest Daily, December 5, 2016 Manuscript 302 The Calibration of Measurement Systems The art of using a consistency chart Donald J. Wheeler Who can be against apple pie, motherhood, or good measurements?
State-Space Models with Kalman Filtering for Freeway Traffic Forecasting
 State-Space Models with Kalman Filtering for Freeway Traffic Forecasting Brian Portugais Boise State University brianportugais@u.boisestate.edu Mandar Khanal Boise State University mkhanal@boisestate.edu
Towards Brain-inspired Computing
 Towards Brain-inspired Computing Zoltan Gingl (x,y), Sunil Khatri (+) and Laszlo B. Kish (+) (x) Department of Experimental Physics, University of Szeged, Dom ter 9, Szeged, H-6720 Hungary (+) Department
The outputs are, separately for each month, regional averages of two quantities:
 DO-IT-YOURSELF TEMPERATURE RECONSTRUCTION Author: Dr Michael Chase, 1 st February 2018 SCOPE This article describes a simple but effective procedure for regional average temperature reconstruction, a procedure
Mikko Myllymäki and Tuomas Virtanen
 NON-STATIONARY NOISE MODEL COMPENSATION IN VOICE ACTIVITY DETECTION Mikko Myllymäki and Tuomas Virtanen Department of Signal Processing, Tampere University of Technology Korkeakoulunkatu 1, 3370, Tampere,
UNEQUAL POWER ALLOCATION FOR JPEG TRANSMISSION OVER MIMO SYSTEMS. Muhammad F. Sabir, Robert W. Heath Jr. and Alan C. Bovik
 UNEQUAL POWER ALLOCATION FOR JPEG TRANSMISSION OVER MIMO SYSTEMS Muhammad F. Sabir, Robert W. Heath Jr. and Alan C. Bovik Department of Electrical and Computer Engineering, The University of Texas at Austin,
Propagation Channels. Chapter Path Loss
 Chapter 9 Propagation Channels The transmit and receive antennas in the systems we have analyzed in earlier chapters have been in free space with no other objects present. In a practical communication
Eric J. Nava Department of Civil Engineering and Engineering Mechanics, University of Arizona,
 A Temporal Domain Decomposition Algorithmic Scheme for Efficient Mega-Scale Dynamic Traffic Assignment An Experience with Southern California Associations of Government (SCAG) DTA Model Yi-Chang Chiu 1
Observed trends in the magnitude and persistence of
 Supplementary Information for: Observed trends in the magnitude and persistence of monthly temperature variability Timothy M. Lenton *, Vasilis Dakos,3, Sebastian Bathiany 4 and Marten Scheffer 4 Earth
Bias correction of satellite data at ECMWF. T. Auligne, A. McNally, D. Dee. European Centre for Medium-range Weather Forecast
 Bias correction of satellite data at ECMWF T. Auligne, A. McNally, D. Dee European Centre for Medium-range Weather Forecast 1. Introduction The Variational Bias Correction (VarBC) is an adaptive bias correction
Voice Activity Detection
 Voice Activity Detection Speech Processing Tom Bäckström Aalto University October 2015 Introduction Voice activity detection (VAD) (or speech activity detection, or speech detection) refers to a class
Mod. 2 p. 1. Prof. Dr. Christoph Kleinn Institut für Waldinventur und Waldwachstum Arbeitsbereich Fernerkundung und Waldinventur
 Histograms of gray values for TM bands 1-7 for the example image - Band 4 and 5 show more differentiation than the others (contrast=the ratio of brightest to darkest areas of a landscape). - Judging from
Abrupt Changes Detection in Fatigue Data Using the Cumulative Sum Method
 Abrupt Changes Detection in Fatigue Using the Cumulative Sum Method Z. M. NOPIAH, M.N.BAHARIN, S. ABDULLAH, M. I. KHAIRIR AND C. K. E. NIZWAN Department of Mechanical and Materials Engineering Universiti
CLIMATE DATA RECORDS (CDRS) HISTORY, STATUS, & FUTURE
 HISTORY, STATUS, & FUTURE") CLIMATE DATA RECORDS (CDRS) HISTORY, STATUS, & FUTURE JOHN BATES JOHN BATES CONSULTING, ARDEN, NC ORCID.ORG/0000-0002-8124-0406 JOHN.BATES28704@GMAIL.COM THE BASIS FOR THE NOAA CLIMATE DATA RECORD (CDR)
CLIMATE DATA RECORDS (CDRS) HISTORY, STATUS, & FUTURE JOHN BATES JOHN BATES CONSULTING, ARDEN, NC ORCID.ORG/0000-0002-8124-0406 JOHN.BATES28704@GMAIL.COM THE BASIS FOR THE NOAA CLIMATE DATA RECORD (CDR)
Statistics, Probability and Noise
 Statistics, Probability and Noise Claudia Feregrino-Uribe & Alicia Morales-Reyes Original material: Rene Cumplido Autumn 2015, CCC-INAOE Contents Signal and graph terminology Mean and standard deviation
Separating the Signals from the Noise
 Quality Digest Daily, October 3, 2013 Manuscript 260 Donald J. Wheeler The second principle for understanding data is that while some data contain signals, all data contain noise, therefore, before you
Lean Smart Parking. How to Collect High-Quality Data Cost-Effectively
 Lean Smart Parking How to Collect High-Quality Data Cost-Effectively Lean Smart Parking How to Collect High-Quality Data Cost-Effectively On-street sensors are now installed in cities from Los Angeles
Antennas and Propagation. Chapter 6b: Path Models Rayleigh, Rician Fading, MIMO
 Antennas and Propagation b: Path Models Rayleigh, Rician Fading, MIMO Introduction From last lecture How do we model H p? Discrete path model (physical, plane waves) Random matrix models (forget H p and
CHAPTER 6 PROBABILITY. Chapter 5 introduced the concepts of z scores and the normal curve. This chapter takes
 CHAPTER 6 PROBABILITY Chapter 5 introduced the concepts of z scores and the normal curve. This chapter takes these two concepts a step further and explains their relationship with another statistical concept
A1.1 Coverage levels in trial areas compared to coverage levels throughout UK
 Annex 1 A1.1 Coverage levels in trial areas compared to coverage levels throughout UK To determine how representative the coverage in the trial areas is of UK coverage as a whole, a dataset containing
Outlier-Robust Estimation of GPS Satellite Clock Offsets
 Outlier-Robust Estimation of GPS Satellite Clock Offsets Simo Martikainen, Robert Piche and Simo Ali-Löytty Tampere University of Technology. Tampere, Finland Email: simo.martikainen@tut.fi Abstract A
Service Appointment Scheduling with Walk-In, Short-term, and Traditional Scheduling
 Service Appointment Scheduling with Walk-In, Short-term, and Traditional Scheduling 1 Decision Sciences Institute Annual Meeting New Orleans November 16, 2009 Dr. Linda R. LaGanga Director of Quality Systems
Changyong Cao 1, Pubu Ciren 2, Mitch Goldberg 1, and Fuzhong Weng 1. Introduction
 Intersatellite Calibration of HIRS from 1980 to 2003 Using the Simultaneous Nadir Overpass (SNO) Method for Improved Consistency and Quality of Climate Data Changyong Cao 1, Pubu Ciren 2, Mitch Goldberg
Recent developments in Deep Blue satellite aerosol data products from NASA GSFC
 Recent developments in Deep Blue satellite aerosol data products from NASA GSFC Andrew M. Sayer, N. Christina Hsu (PI), Corey Bettenhausen, Myeong-Jae Jeong Climate & Radiation Laboratory, NASA Goddard
Application Notes on Direct Time-Domain Noise Analysis using Virtuoso Spectre
 Application Notes on Direct Time-Domain Noise Analysis using Virtuoso Spectre Purpose This document discusses the theoretical background on direct time-domain noise modeling, and presents a practical approach
Dynamic Ambulance Redeployment by Optimizing Coverage. Bachelor Thesis Econometrics & Operations Research Major Quantitative Logistics
 Dynamic Ambulance Redeployment by Optimizing Coverage Bachelor Thesis Econometrics & Operations Research Major Quantitative Logistics Author: Supervisor: Dave Chi Rutger Kerkkamp Erasmus School of Economics
WFC3 TV2 Testing: UVIS Shutter Stability and Accuracy
 Instrument Science Report WFC3 2007-17 WFC3 TV2 Testing: UVIS Shutter Stability and Accuracy B. Hilbert 15 August 2007 ABSTRACT Images taken during WFC3's Thermal Vacuum 2 (TV2) testing have been used
Determining Dimensional Capabilities From Short-Run Sample Casting Inspection
 Determining Dimensional Capabilities From Short-Run Sample Casting Inspection A.A. Karve M.J. Chandra R.C. Voigt Pennsylvania State University University Park, Pennsylvania ABSTRACT A method for determining
CellSpecks: A Software for Automated Detection and Analysis of Calcium
 Biophysical Journal, Volume 115 Supplemental Information CellSpecks: A Software for Automated Detection and Analysis of Calcium Channels in Live Cells Syed Islamuddin Shah, Martin Smith, Divya Swaminathan,
(i) Understanding the basic concepts of signal modeling, correlation, maximum likelihood estimation, least squares and iterative numerical methods
 Understanding the basic concepts of signal modeling, correlation, maximum likelihood estimation, least squares and iterative numerical methods") Tools and Applications Chapter Intended Learning Outcomes: (i) Understanding the basic concepts of signal modeling, correlation, maximum likelihood estimation, least squares and iterative numerical methods
Tools and Applications Chapter Intended Learning Outcomes: (i) Understanding the basic concepts of signal modeling, correlation, maximum likelihood estimation, least squares and iterative numerical methods
Randomized Channel Access Reduces Network Local Delay
 Randomized Channel Access Reduces Network Local Delay Wenyi Zhang USTC Joint work with Yi Zhong (Ph.D. student) and Martin Haenggi (Notre Dame) 2013 Joint HK/TW Workshop on ITC CUHK, January 19, 2013 Acknowledgement
!"#$%&'("&)*("*+,)-(#'.*/$'-0%$1$"&-!!!"#$%&'(!"!!"#$%"&&'()*+*!
*(*+,)-(#'.*/$'-0%$1$&-!!!#$%&'(!!!#$%&&'()*+*!") !"#$%&'("&)*("*+,)-(#'.*/$'-0%$1$"&-!!!"#$%&'(!"!!"#$%"&&'()*+*! In this Module, we will consider dice. Although people have been gambling with dice and related apparatus since at least 3500 BCE, amazingly
!"#$%&'("&)*("*+,)-(#'.*/$'-0%$1$"&-!!!"#$%&'(!"!!"#$%"&&'()*+*! In this Module, we will consider dice. Although people have been gambling with dice and related apparatus since at least 3500 BCE, amazingly
Enhancement of Speech Signal Based on Improved Minima Controlled Recursive Averaging and Independent Component Analysis
 Enhancement of Speech Signal Based on Improved Minima Controlled Recursive Averaging and Independent Component Analysis Mohini Avatade & S.L. Sahare Electronics & Telecommunication Department, Cummins
PROFILE BASED SUB-PIXEL-CLASSIFICATION OF HEMISPHERICAL IMAGES FOR SOLAR RADIATION ANALYSIS IN FOREST ECOSYSTEMS
 PROFILE BASED SUB-PIXEL-CLASSIFICATION OF HEMISPHERICAL IMAGES FOR SOLAR RADIATION ANALYSIS IN FOREST ECOSYSTEMS Ellen Schwalbe a, Hans-Gerd Maas a, Manuela Kenter b, Sven Wagner b a Institute of Photogrammetry
On Feature Selection, Bias-Variance, and Bagging
 On Feature Selection, Bias-Variance, and Bagging Art Munson 1 Rich Caruana 2 1 Department of Computer Science Cornell University 2 Microsoft Corporation ECML-PKDD 2009 Munson; Caruana (Cornell; Microsoft)
Energy Consumption Prediction for Optimum Storage Utilization
 Energy Consumption Prediction for Optimum Storage Utilization Eric Boucher, Robin Schucker, Jose Ignacio del Villar December 12, 2015 Introduction Continuous access to energy for commercial and industrial
Removal of Line Noise Component from EEG Signal
 1 Removal of Line Noise Component from EEG Signal Removal of Line Noise Component from EEG Signal When carrying out time-frequency analysis, if one is interested in analysing frequencies above 30Hz (i.e.
3432 IEEE TRANSACTIONS ON INFORMATION THEORY, VOL. 53, NO. 10, OCTOBER 2007
 3432 IEEE TRANSACTIONS ON INFORMATION THEORY, VOL 53, NO 10, OCTOBER 2007 Resource Allocation for Wireless Fading Relay Channels: Max-Min Solution Yingbin Liang, Member, IEEE, Venugopal V Veeravalli, Fellow,
Kalman filtering approach in the calibration of radar rainfall data
 Kalman filtering approach in the calibration of radar rainfall data Marco Costa 1, Magda Monteiro 2, A. Manuela Gonçalves 3 1 Escola Superior de Tecnologia e Gestão de Águeda - Universidade de Aveiro,
Organizing Gray Code States for Maximum Error Tolerance
 Organizing Gray Code States for Maximum Error Tolerance NICHOLAS HARKIOLAKIS School of Electrical and Computer Engineering National Technical University of Athens 9 Iroon Politechniou St., 57 8 Athens
CCMR Educational Programs
 CCMR Educational Programs Title: Date Created: August 6, 2006 Author(s): Appropriate Level: Abstract: Time Requirement: Joan Erickson Should We Count the Beans one at a time? Introductory statistics or
Nonuniform multi level crossing for signal reconstruction
 6 Nonuniform multi level crossing for signal reconstruction 6.1 Introduction In recent years, there has been considerable interest in level crossing algorithms for sampling continuous time signals. Driven
Paper presented at the Int. Lightning Detection Conference, Tucson, Nov. 1996
 Paper presented at the Int. Lightning Detection Conference, Tucson, Nov. 1996 Detection Efficiency and Site Errors of Lightning Location Systems Schulz W. Diendorfer G. Austrian Lightning Detection and
Matthew Fox CS229 Final Project Report Beating Daily Fantasy Football. Introduction
 Matthew Fox CS229 Final Project Report Beating Daily Fantasy Football Introduction In this project, I ve applied machine learning concepts that we ve covered in lecture to create a profitable strategy
A Steady State Decoupled Kalman Filter Technique for Multiuser Detection
 A Steady State Decoupled Kalman Filter Technique for Multiuser Detection Brian P. Flanagan and James Dunyak The MITRE Corporation 755 Colshire Dr. McLean, VA 2202, USA Telephone: (703)983-6447 Fax: (703)983-6708
Intercomparison of a WaveGuide radar and two Directional Waveriders
 Introduction T. van der Vlugt Radac Zomerluststraat LM Haarlem The Netherlands email: tom@radac.nl Down-looking FMCW radars for wave measurements are in use already for years. They have Intercomparison
High collection efficiency MCPs for photon counting detectors
 High collection efficiency MCPs for photon counting detectors D. A. Orlov, * T. Ruardij, S. Duarte Pinto, R. Glazenborg and E. Kernen PHOTONIS Netherlands BV, Dwazziewegen 2, 9301 ZR Roden, The Netherlands
UC Davis Recent Work. Title. Permalink. Author. Publication Date. Using Natural Gas Transmission Pipeline Costs to Estimate Hydrogen Pipeline Costs
 UC Davis Recent Work Title Using Natural Gas Transmission Pipeline Costs to Estimate Hydrogen Pipeline Costs Permalink https://escholarship.org/uc/item/2gkj8kq Author Parker, Nathan Publication Date 24-12-1
IEEE TRANSACTIONS ON SIGNAL PROCESSING, VOL. 58, NO. 3, MARCH
 IEEE TRANSACTIONS ON SIGNAL PROCESSING, VOL. 58, NO. 3, MARCH 2010 1401 Decomposition Principles and Online Learning in Cross-Layer Optimization for Delay-Sensitive Applications Fangwen Fu, Student Member,
May 10, 2016, NSF-Census Research Network, Census Bureau. Research supported by NSF grant SES
 A 2016 View of 2020 Census Quality, Costs, Benefits Bruce D. Spencer Department of Statistics and Institute for Policy Research Northwestern University May 10, 2016, NSF-Census Research Network, Census
Beyond 4G Cellular Networks: Is Density All We Need?
 Beyond 4G Cellular Networks: Is Density All We Need? Jeffrey G. Andrews Wireless Networking and Communications Group (WNCG) Dept. of Electrical and Computer Engineering The University of Texas at Austin
Violating Nyquist: Another Source of Significant Error in the Instrumental Temperature Record
 Violating Nyquist: Another Source of Significant Error in the Instrumental Temperature Record William Ward, January 12, 2019 The instrumental temperature record provides historical surface air temperatures
On the GNSS integer ambiguity success rate
 On the GNSS integer ambiguity success rate P.J.G. Teunissen Mathematical Geodesy and Positioning Faculty of Civil Engineering and Geosciences Introduction Global Navigation Satellite System (GNSS) ambiguity
Session 5 Variation About the Mean
 Session 5 Variation About the Mean Key Terms for This Session Previously Introduced line plot median variation New in This Session allocation deviation from the mean fair allocation (equal-shares allocation)
Some of the proposed GALILEO and modernized GPS frequencies.
 On the selection of frequencies for long baseline GALILEO ambiguity resolution P.J.G. Teunissen, P. Joosten, C.D. de Jong Department of Mathematical Geodesy and Positioning, Delft University of Technology,
Wintering Corn Buntings
 Wintering Corn Buntings Title Wintering Corn Bunting 1992/93 Description and Summary of Results The Corn Bunting Emberiza calandra is one of a number of farmland birds which showed a marked decline in
SHA532 Transcripts. Transcript: Forecasting Accuracy. Transcript: Meet The Booking Curve
 SHA532 Transcripts Transcript: Forecasting Accuracy Forecasting is probably the most important thing that goes into a revenue management system in particular, an accurate forecast. Just think what happens
User s guide to climatol
 User s guide to climatol An R contributed package for homogenization of climatological series (and functions for drawing wind-rose and Walter&Lieth diagrams) Version 2.2, distributed under the GPL license,
Bias estimation and correction for satellite data assimilation
 Bias estimation and correction for satellite data assimilation Tony McNally ECMWF T.Auligne, D.Dee, G.Kelly, R.Engelen, A. Dethof, G. Van der Grijn Outline of presentation Three basic questions. What biases
DETECTION OF CLIMATE CHANGE IN THE SLOVAK MOUNTAINS
 DETECTION OF CLIMATE CHANGE IN THE SLOVAK MOUNTAINS M. LAPIN,, P. ŠŤASTNÝ*, M. CHMELÍK* Div. of Meteorology and Climatology, Comenius University, Bratislava *Slovak Hydrometeorological Institute,, Bratislava
Chapter 3 Learning in Two-Player Matrix Games
 Chapter 3 Learning in Two-Player Matrix Games 3.1 Matrix Games In this chapter, we will examine the two-player stage game or the matrix game problem. Now, we have two players each learning how to play
Accuracy Assessment of GPS Slant-Path Determinations
 Accuracy Assessment of GPS Slant-Path Determinations Pedro ELOSEGUI * and James DAVIS Harvard-Smithsonian Center for Astrophysics, Cambridge, MA, USA Abtract We have assessed the accuracy of GPS for determining
Detiding DART R Buoy Data and Extraction of Source Coefficients: A Joint Method. Don Percival
 Detiding DART R Buoy Data and Extraction of Source Coefficients: A Joint Method Don Percival Applied Physics Laboratory Department of Statistics University of Washington, Seattle 1 Overview variability
Noise and Distortion in Microwave System
 Noise and Distortion in Microwave System Prof. Tzong-Lin Wu EMC Laboratory Department of Electrical Engineering National Taiwan University 1 Introduction Noise is a random process from many sources: thermal,
Frank Heymann 1.
 Plausibility analysis of navigation related AIS parameter based on time series Frank Heymann 1 1 Deutsches Zentrum für Luft und Raumfahrt ev, Neustrelitz, Germany email: frank.heymann@dlr.de In this paper
Welcome to the next lecture on mobile radio propagation. (Refer Slide Time: 00:01:23 min)
") Wireless Communications Dr. Ranjan Bose Department of Electrical Engineering Indian Institute of Technology, Delhi Lecture No # 20 Mobile Radio Propagation -11- Multipath and Small Scale Fading Welcome
Wireless Communications Dr. Ranjan Bose Department of Electrical Engineering Indian Institute of Technology, Delhi Lecture No # 20 Mobile Radio Propagation -11- Multipath and Small Scale Fading Welcome
An Introduction to Jitter Analysis. WAVECREST Feb 1,
 An Introduction to Jitter Analysis WAVECREST Feb 1, 2000 1 Traditional View Of Jitter WAVECREST Feb 1, 2000 2 Jitter - What is Jitter? The deviation from the ideal timing of an event. The reference event
2011, Stat-Ease, Inc.
 Practical Aspects of Algorithmic Design of Physical Experiments from an Engineer s perspective Pat Whitcomb Stat-Ease Ease, Inc. 612.746.2036 fax 612.746.2056 pat@statease.com www.statease.com Statistics
Understanding Apparent Increasing Random Jitter with Increasing PRBS Test Pattern Lengths
 JANUARY 28-31, 2013 SANTA CLARA CONVENTION CENTER Understanding Apparent Increasing Random Jitter with Increasing PRBS Test Pattern Lengths 9-WP6 Dr. Martin Miller The Trend and the Concern The demand
Some Parameter Estimators in the Generalized Pareto Model and their Inconsistency with Observed Data
 Some Parameter Estimators in the Generalized Pareto Model and their Inconsistency with Observed Data F. Ashkar, 1 and C. N. Tatsambon 2 1 Department of Mathematics and Statistics, Université de Moncton,
EasyChair Preprint. A User-Centric Cluster Resource Allocation Scheme for Ultra-Dense Network
 EasyChair Preprint 78 A User-Centric Cluster Resource Allocation Scheme for Ultra-Dense Network Yuzhou Liu and Wuwen Lai EasyChair preprints are intended for rapid dissemination of research results and
Bias correction of satellite data at ECMWF
 Bias correction of satellite data at ECMWF Thomas Auligne Tony McNally, Dick Dee, Graeme Kelly ECMWF/NWP-SAF Workshop on Bias estimation and correction in data assimilation 8-11 November 2005 Introduction
Ionospheric and cosmic ray monitoring: Recent developments at the RMI
 Solar Terrestrial Centre of Excellence Ionospheric and cosmic ray monitoring: Recent developments at the RMI Danislav Sapundjiev, Stan Stankov, Tobias Verhulst, Jean-Claude Jodogne Royal (RMI) Ringlaan
Using Administrative Records for Imputation in the Decennial Census 1
 Using Administrative Records for Imputation in the Decennial Census 1 James Farber, Deborah Wagner, and Dean Resnick U.S. Census Bureau James Farber, U.S. Census Bureau, Washington, DC 20233-9200 Keywords:
Expanding the Frontiers of Geotechnical Engineering
 Expanding the Frontiers of Geotechnical Engineering Software development is not an exact science. When a new version of a Rocscience program is being planned, what are the decisions that have to be made
124 IEEE TRANSACTIONS ON SIGNAL PROCESSING, VOL. 45, NO. 1, JANUARY 1997
 124 IEEE TRANSACTIONS ON SIGNAL PROCESSING, VOL. 45, NO. 1, JANUARY 1997 Blind Adaptive Interference Suppression for the Near-Far Resistant Acquisition and Demodulation of Direct-Sequence CDMA Signals
Project summary. Key findings, Winter: Key findings, Spring:
 Summary report: Assessing Rusty Blackbird habitat suitability on wintering grounds and during spring migration using a large citizen-science dataset Brian S. Evans Smithsonian Migratory Bird Center October
INVESTIGATING THE BENEFITS OF MESHING REAL UK LV NETWORKS
 INVESTIGATING THE BENEFITS OF MESHING REAL UK LV NETWORKS Muhammed S. AYDIN Alejandro NAVARRO Espinosa Luis F. OCHOA The University of Manchester UK The University of Manchester UK The University of Manchester
Spur Detection, Analysis and Removal Stable32 W.J. Riley Hamilton Technical Services
 Introduction Spur Detection, Analysis and Removal Stable32 W.J. Riley Hamilton Technical Services Stable32 Version 1.54 and higher has the capability to detect, analyze and remove discrete spectral components
BALLISTIC MISSILE PRECESSING FREQUENCY EXTRACTION BASED ON MAXIMUM LIKELIHOOD ESTIMATION
 8th European Signal Processing Conference (EUSIPCO-200) Aalborg, Denmark, August 23-27, 200 BALLISTIC MISSILE PRECESSING FREQUENCY EXTRACTION BASED ON MAXIMUM LIKELIHOOD ESTIMATION Lihua Liu,2, Mounir
Your Neighbors Affect Your Ratings: On Geographical Neighborhood Influence to Rating Prediction
 Your Neighbors Affect Your Ratings: On Geographical Neighborhood Influence to Rating Prediction Longke Hu Aixin Sun Yong Liu Nanyang Technological University Singapore Outline 1 Introduction 2 Data analysis
Extraction of tacho information from a vibration signal for improved synchronous averaging
 Proceedings of ACOUSTICS 2009 23-25 November 2009, Adelaide, Australia Extraction of tacho information from a vibration signal for improved synchronous averaging Michael D Coats, Nader Sawalhi and R.B.
Assessing the accuracy of directional real-time noise monitoring systems
 Proceedings of ACOUSTICS 2016 9-11 November 2016, Brisbane, Australia Assessing the accuracy of directional real-time noise monitoring systems Jesse Tribby 1 1 Global Acoustics Pty Ltd, Thornton, NSW,
Chaloemphon Meechai 1 1
 A Study of Factors Affecting to Public mind of The Eastern University of Management and Technology in Faculty Business Administration students Chaloemphon Meechai 1 1 Office of Business Administration,
DEVELOPMENT OF AN AUTOMATED DOBSON CONTROL SYSTEM FOR UNATTENDED OPERATION ABSTRACT
 DEVELOPMENT OF AN AUTOMATED DOBSON CONTROL SYSTEM FOR UNATTENDED OPERATION R. Stübi 1, W. Siegrist 1, H. Schill 1, S. Brönnimann 1 P.-A. Probst 2, D. Ruffieux 1, B. Calpini 1 1 Federal Office of Meteorology
Balancing Bandwidth and Bytes: Managing storage and transmission across a datacast network
 Balancing Bandwidth and Bytes: Managing storage and transmission across a datacast network Pete Ludé iblast, Inc. Dan Radke HD+ Associates 1. Introduction The conversion of the nation s broadcast television
To do this, the lens itself had to be set to viewing mode so light passed through just as it does when making the
 CHAPTER 4 - EXPOSURE In the last chapter, we mentioned fast shutter speeds and moderate apertures. Shutter speed and aperture are 2 of only 3 settings that are required to make a photographic exposure.
A Spectral Conversion Approach to Single- Channel Speech Enhancement
 University of Pennsylvania ScholarlyCommons Departmental Papers (ESE) Department of Electrical & Systems Engineering May 2007 A Spectral Conversion Approach to Single- Channel Speech Enhancement Athanasios
Global Business Cycle Deceleration and US Conundrum
 Global Business Cycle Deceleration and US Conundrum April 16, 2015 by Alexander Giryavets of Dynamika Capital L.L.C. Disclaimer The information, tools and material presented herein are provided for informational
CCD Characteristics Lab
 CCD Characteristics Lab Observational Astronomy 6/6/07 1 Introduction In this laboratory exercise, you will be using the Hirsch Observatory s CCD camera, a Santa Barbara Instruments Group (SBIG) ST-8E.
MATRIX SAMPLING DESIGNS FOR THE YEAR2000 CENSUS. Alfredo Navarro and Richard A. Griffin l Alfredo Navarro, Bureau of the Census, Washington DC 20233
 MATRIX SAMPLING DESIGNS FOR THE YEAR2000 CENSUS Alfredo Navarro and Richard A. Griffin l Alfredo Navarro, Bureau of the Census, Washington DC 20233 I. Introduction and Background Over the past fifty years,