Bode 100. User Manual. Smart Measurement Solutions
|
|
|
- Pamela Greene
- 5 years ago
- Views:
Transcription


1 Bode 100 User Manual Smart Measurement Solutions
2 Version: ENU Year: 2017 OMICRON Lab, OMICRON electronics. All rights reserved. This manual is a publication of OMICRON electronics. All rights including translation reserved. Reproduction of any kind, e.g., photocopying, microfilming, optical character recognition and/or storage in electronic data processing systems, requires the explicit consent of OMICRON electronics. Reprinting, wholly or in part, is not permitted. The product information, specifications, and technical data embodied in this manual represent the technical status at the time of writing and are subject to change without prior notice. Windows is a registered trademark of Microsoft Corporation. OMICRON Lab and Smart Measurement Solutions are registered trademarks of OMICRON electronics. 2 OMICRON Lab
3 Contents Contents 1 Safety instructions Operator qualifications Rules for use Designated use Disclaimer Cleaning Compliance statements and recycling Compliance statement Information for disposal and recycling Bode 100 and accessories Delivered items Optional accessories Technical data Absolute maximum ratings Bode 100 specifications Power requirements System requirements Environmental requirements Mechanical data Device overview Connectors Block diagram Functional description Hardware revisions Bode Analyzer Suite introduction Start screen Main window Measurement configuration Trace configuration Ribbon controls Status bar Chart context menu Options menu Hardware setup Measurement types and applications Gain measurement introduction Impedance measurement introduction Vector Network Analysis Transmission / Reflection Gain / Phase Reflection with external coupler Impedance analysis One-Port Impedance Adapter Shunt-Thru Shunt-Thru with series resistance Series-Thru Voltage/Current OMICRON Lab 3
4 7.4.7 External Bridge Calibration Internal device calibration Performing a Gain Calibration Calibrating a Transmission (S21) measurement Calibrating a Gain/Phase measurement Performing an Impedance Calibration Calibrating a Reflection or One-Port Impedance measurement Calibrating an External Coupler or External Bridge measurement Calibrating an Impedance Adapter measurement Calibrating a Shunt-Thru or Series-Thru measurement Calibrating a Voltage/Current measurement Further calibration information Difference between Full-Range and User-Range calibration Enabling and disabling a calibration Re-performing a calibration Full-Range calibration below 10 Hz Automatic deletion of calibration Saving calibration data Bode Analyzer Suite functions Exporting and saving measurement data or settings Loading and saving the equipment configuration Use the copy to clipboard functions to export data Exporting measurement data to CSV or Excel files Generating a Touchstone file Generate a PDF report Signal source settings Using the interactive chart Configure the diagrams Zooming the measurement curve Optimize the axis scaling Working with cursors and the cursor grid Using the memory traces Using the trace configuration Cursor calculations Non-Invasive Stability Measurement Fres-Q Calculation Averaging Using probes Unwrapped phase Check for updates Automation interface Troubleshooting 135 Support OMICRON Lab
5 Index Index.bode file bode3 file bodex file A Absolute maximum ratings Accessories Address (OMICRON address) API Applications Auto axis placement Auto optimize Automated measurements Automation Interface Auto-scale Average Averaging Axis Axis scaling B Block diagram B-SMC B-WIC C Calibration... 75, 96 Full-Range User-Range Calibration... 75, 84, 86, 88, 90, 92, 95, 96 Chart Context menu Chart Cleaning COM Compensation Compliance CE EMC RoHS Connectors Contact information (OMICRON address). 136 Context menu Continuous phase Copy chart image Copy measurement data Copy to clipboard CSV Cursor calculations Cursor grid Cursors D Data / Memory Deletion of calibration Delivered Items Disposal E (OMICRON Lab address) Examples Excel OMICRON Lab 5
6 External Bridge External coupler External probes F Factory calibration Features Fres-Q Full-Range Full-Range... 93, 95, 96 Function principle G Gain Calibration Gain/Phase Get from zoom H Hardware setup Hotline I Icons Impedance Adapter... 64, 88 Impedance Analysis Impedance Adapter Shunt-Thru with series resistance Impedance calibration Impedance Measurement Result formats... 40, 42 Impedance Analysis One-Port Shunt-Thru Internal device calibration Internal path compensation J Jump to Max Jump to Zero Jump to Min L LabVIEW Level unit Loop Gain M Matlab Measurement configuration Measurement modes External coupler External Bridge Gain/Phase Impedance Adapter One-Port Series-Thru Shunt-Thru Shunt-Thru with series resistance Transmission / Reflection Voltage/Current Measurement trace Memory curves Memory traces N NISM Noise reduction OMICRON Lab
7 Index Non-Invasive Stability Measurement O One axis per chart One-Port... 54, 84 Open/Short/Load Optimize Optimize Options Chart general Chart memory Clipboard Export General Report Options menu P PC Operating System System requirements PDF Phase jumps Print report Probe factor Probes Q Report templates Resonance-Frequency Result formats... 40, 42 S S21 calibration SAFETY Designated use Disclaimer Operator qualifications Rules for use Safety instructions Saving calibration data Saving measurement data Scaling Series-Thru... 72, 90 Shaped level Shunt-Thru... 69, 90 Shunt-Thru with series resistance Software introduction Software update Source Specifications Stability measurement Status bar Step-by-step examples Support System requirements Quality factor R Recycling Reflection OMICRON Lab 7
8 T Technical Data Absolute maximum ratings Bode 100 specifications Environmental Requirements Mechanical data Power Requirements System requirements Temperature range Z Zooming Technical support Thru calibration... 77, 79 Touchstone Trace configuration... 28, 121 Trace math Transmission / Reflection Troubleshooting U Unwrap phase Update informer User-Range User-Range... 93, 95 V Voltage/Current... 73, 92 W Web (OMICRON Lab website) Welcome screen Window OMICRON Lab
9 Contents Index 5 OMICRON Lab 9
10 1 Safety instructions Before operating Bode 100 and its accessories, read the following safety instructions carefully. If you do not understand some safety instructions, contact OMICRON Lab before proceeding. When working with Bode 100, observe all safety instructions in this document. You are responsible for every application that makes use of an OMICRON or OMICRON Lab product. Any miss-operation can result in damage to property or persons. Maintenance and repair of Bode 100 and its accessories is only permitted by qualified experts either at OMICRON Lab or at certified repair centers. Following these instructions will help you to prevent danger, repair costs and possible down time due to incorrect operation. Furthermore, it ensures the reliability and life-cycle of Bode 100. Use Bode 100 in observance of all existing safety requirements from national standards for accident prevention and environmental protection. Reading the Bode 100 manual alone does not release you from the duty of complying with all national and international safety regulations relevant for working with Bode 100, for example, the regulation EN50191 "Erection and Operation of Electrical Test Equipment. WARNING Bode 100 is a SELV device (SELV = Safety Extra Low Voltage according to IEC 60950). Do not apply hazardous voltage levels >50 VDC or >25 VAC to the inputs of Bode 100. Ensure that voltage and current probes used with Bode 100 are properly grounded in accordance with their manufacturer's guidelines. When working with voltage or current probes, always connect the Bode 100's ground terminal (available for HW Rev. 2 or higher) with a solid connection of at least 3.6 mm² cross-section and not longer than 10 m to the ground terminal in the laboratory. Be aware that no indication on Bode 100 shows that the output is active. This could be especially critical if amplifiers are connected to Bode Operator qualifications Testing with Bode 100 must only be carried out by qualified, skilled and authorized personnel. Personnel receiving training, instructions, directions, or education on Bode 100 must be under constant supervision of an experienced operator while working with the equipment. Testing with Bode 100 must comply with the internal safety instructions as well as additional relevant documents. 10 OMICRON Lab
11 Safety instructions 1.2 Rules for use Bode 100 is exclusively intended for the application area specified in this document. The manufacturer/distributors are not liable for damage resulting from a use other than the specified operation. The user alone assumes all responsibility and risk. Use Bode 100 only when it is in a technically sound condition. Do not open Bode 100 or remove any of its housing components. Do not carry out any modifications, extensions or adaptations to Bode 100. Use Bode 100 in observance of all existing safety requirements from national and international standards for accident prevention and environmental protection. Always keep the manual either printed or as PDF file at the site where Bode 100 is used. The manual must be read by all people working with Bode 100. In addition to the manual and the applicable regulations for accident prevention in the country and at the site of operation, heed the accepted technical procedures for safe and competent work. 1.3 Designated use Bode 100 and its accessories are especially designed for swept frequency measurements of electronic circuits in laboratory and manufacturing environments. Examples for typical applications are: Measurement of the complex transfer function of amplifiers, filters and attenuators S-Parameter measurement in the 50 Ohm domain Stability assessment of control loops Determination of resonance frequencies of piezo elements and quartz crystals Impedance measurement of inductors, capacitors and resistors 1.4 Disclaimer The advisory procedures and information contained within this document have been compiled as a guide to the safe and effective operation of Bode 100. It has been prepared in conjunction with application engineers and the collective experience of the manufacturer. The in-service conditions for the use of Bode 100 may vary between customers and end-users. Consequently, this document is offered as a guide only. It shall be used in conjunction with the customers own safety procedures, maintenance program, engineering judgment, and training qualifications. Using Bode 100 or its accessories in a manner not specified by the manufacturer may result in damage to property or persons. 1.5 Cleaning Use a cloth dampened with isopropanol alcohol to clean Bode 100 and its accessories. OMICRON Lab 11
 The equipment adheres to the guidelines of the council of the European Community for meeting the requirements of the member states regarding the")
12 2 Compliance statements and recycling 2.1 Compliance statement Declaration of Conformity (EU) The equipment adheres to the guidelines of the council of the European Community for meeting the requirements of the member states regarding the electromagnetic compatibility (EMC) directive and the RoHS directive. FCC compliance (USA) This equipment has been tested and found to comply with the limits for a Class A digital device, pursuant to part 15 of the FCC Rules. These limits are designed to provide reasonable protection against harmful interference when the equipment is operated in a commercial environment. This equipment generates, uses, and can radiate radio frequency energy and, if not installed and used in accordance with the instruction manual, may cause harmful interference to radio communications. Operation of this equipment in a residential area is likely to cause harmful interference, in which case the user will be required to correct the interference at his own expense. Changes or modifications not expressly approved by the party responsible for compliance could void the user's authority to operate the equipment. Declaration of compliance (Canada) This Class A digital apparatus complies with Canadian ICES-003. Cet appareil numérique de la classe A est conforme à la norme NMB-003 du Canada. 2.2 Information for disposal and recycling Bode 100 and all of its accessories are not intended for household use. At the end of its service life, do not dispose of the test set with household waste! For customers in EU countries (incl. European Economic Area) OMICRON test sets are subject to the EU Waste Electrical and Electronic Equipment Directive (WEEE directive). As part of our legal obligations under this legislation, OMICRON offers to take back the test set and to ensure that it is disposed of by an authorized recycling facility. For customers outside the European Economic Area Please contact the authorities in charge for the relevant environmental regulations in your country and dispose Bode 100 and all of its accessories only in accordance with your local legal requirements. 12 OMICRON Lab


 BNC T")
 BNC 50 Ω load (m)")


13 Bode 100 and accessories 3 Bode 100 and accessories 3.1 Delivered items Bode 100 multi functional test set Bode Analyzer Suite on DVD Wide-range AC power supply including mains input plugs for different national standards 4 pc. BNC 50 Ω cable (m-m) Test objects (Quartz filter and IF filter) on PCB USB Cable BNC straight adapter (f-f) BNC T adapter (f-f-f) BNC short circuit (m) BNC 50 Ω load (m) Bode 100 Quick Start Guide Multilingual safety instructions The delivered items may vary a bit from the look shown above. Please refer to the packing list received with the Bode 100 for further information OMICRON Lab 13


14 3.2 Optional accessories B-WIT 100 Wideband Injection Transformer The B-WIT 100 is used to inject signals into control loops. Its main application is in the stability analysis of switched mode power supplies and linear voltage regulators. B-SMC impedance adapter for surface mount components The B-SMC extends the impedance measurement range of Bode 100. It enables you to easily measure components for surface mounting such as ceramic capacitors or chip resistors. B-WIC impedance adapter for thru hole type components The B-WIC extends the impedance measurement range of Bode 100. It enables you to perform impedance measurements for thru hole type components such as inductors or crystal oscillators. B-AMP 12 amplifier 12 db amplifier to boost the output signal of Bode 100 for applications where more than 13 dbm are needed. B-RFID measurement adapters The B-RFID adapters allow standard compliant measurement of the resonance frequency and Q-factor of RFID antennas. For more information on the above mentioned Bode 100 accessories and recommended accessories manufactured by partner companies visit 14 OMICRON Lab
15 Technical data 4 Technical data In this section you can find the most important technical data for the Bode 100 Revision 2. Technical data can change without notice. You can download a detailed technical data sheet for Bode 100 from the OMICRON Lab website Bode 100 Technical Data 4.1 Absolute maximum ratings NOTICE Exceeding the absolute maximum ratings listed below might result in a permanent damage of the device. Table 4-1: Absolute maximum ratings Characteristic DC Power Input DC supply voltage Max. DC supply reverse voltage Absolute Maximum Rating +28 V -28 V INPUT CH 1, INPUT CH 2 connectors (high Z input impedance selected ) Maximum DC input signal Maximum AC input signal 50 V 1 Hz...10 MHz: 50 Vrms 1 MHz...2 MHz: 30 Vrms 2 MHz...5 MHz: 15 Vrms 5 MHz...10 MHz: 10 Vrms 10 MHz MHz: 7 Vrms INPUT CH 1, INPUT CH 2 connectors (50 Ω input impedance selected) Maximum input power Maximum input voltage OUTPUT connector Maximum reverse power Maximum reverse voltage 1 W 7 Vrms 0.5 W 3.5 Vrms OMICRON Lab 15
16 4.2 Bode 100 specifications In this section you can find the most important technical data for the Bode 100. This technical data is valid for Bode 100 R2 (Hardware revision 2). To find out what hardware revision you use, please check 5.4 Hardware revisions on page 22. Technical data can change without notice. You can download a detailed technical data sheet from the OMICRON Lab website Bode 100 Technical Data Table 4-2: Bode 100 specifications Characteristic OUTPUT Voltage range Frequency range Wave form Source impedance Connector INPUT CH 1, INPUT CH 2 AC measurement range Frequency range Input impedance Connectors Input attenuators Receiver bandwidth Dynamic Range Gain Error Phase Error PC interface Universal serial bus Connector Rating -30 dbm...13 dbm 7 mvrms...1 Vrms at 50 Ω load 14 mvrms...2 Vrms at high impedance load 1 Hz...50 MHz sinusoidal 50 Ω BNC 100 mvrms full scale with 0 db input attenuation 10 Vrms full scale with 40 db input attenuation 1 Hz...50 MHz Selectable via software: 50 Ω 1 MΩ ±2% pf BNC Selectable via software: 0 db, 10 db, 20 db, 30 db, 40 db Selectable via software: 1 Hz, 3 Hz, 10 Hz, 30 Hz, 100 Hz, 300 Hz, 1 khz, 3 khz, 5 khz* *only Bode 100 R2 > 100 db (10 Hz receiver bandwidth) < 0.1 db (calibrated) < 0.5 (calibrated) USB 2.0 or higher USB type B socket 16 OMICRON Lab
17 Technical data 4.3 Power requirements Table 4-3: Power requirements Characteristic DC input Supply voltage range Minimum DC supply power Connector Polarity Rating V 10 W Coaxial power socket Inner Diameter: 2.5 mm Outer Diameter: 5.5 mm Inner conductor: Positive voltage Outer conductor: Ground We strongly recommend you to use the power supply delivered with Bode System requirements Table 4-4: System requirements Characteristic Processor Memory (RAM) Graphics resolution Graphics card USB interface USB 2.0 Operating System Minimum PC Configuration Intel Core-I Dual-Core (or similar) 2 GB, 4 GB recommended Super VGA (1024x768) higher resolution recommended DirectX 11 with Direct2D support Microsoft Windows 7 SP1 or higher OMICRON Lab 17
18 4.5 Environmental requirements Table 4-5: Environmental requirements Characteristic Condition Rating Temperature Storage C / F Operating C / F For specification 23 C ±5 C / 73 F ±18 F Relative humidity Storage %, non-condensing Operating %, non condensing 4.6 Mechanical data Table 4-6: Mechanical data Characteristic Rating Dimensions (w x h x d) without connectors 26 cm x 5 cm x 26.5 cm / " x 2 " x 10.5 " Weight < 2 kg / 4.4 lbs 18 OMICRON Lab


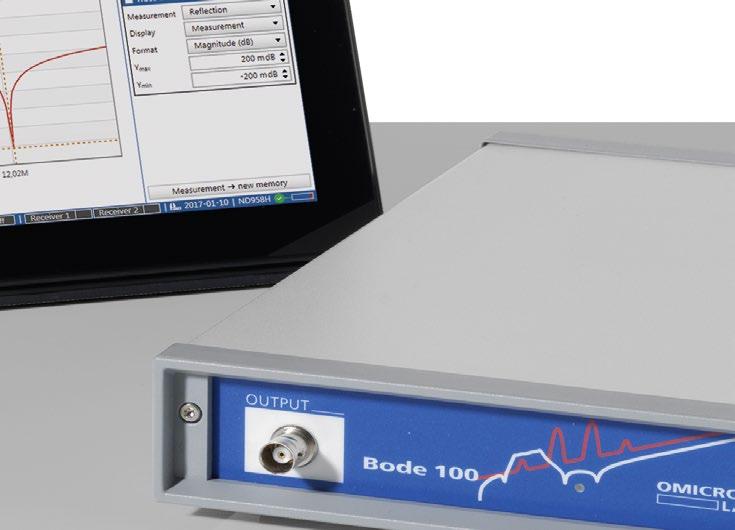
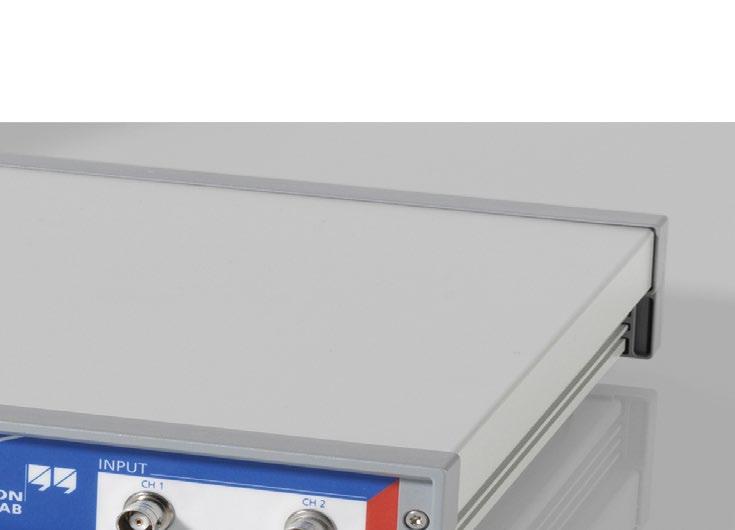
19 Device overview 5 Device overview Bode 100 is a USB controlled vector network analyzer. The system consists of the Bode 100 hardware and the Bode Analyzer Suite software. In the following the Bode 100 hardware is described in detail. To learn more about the Bode Analyzer Suite, please check out 6.1 Start screen on page 23 ff. 5.1 Connectors CAUTION To ensure save operation and to prevent injuries it is recommended to connect Bode 100 to ground using the ground connector at the rear panel at all times. NOTICE To avoid damage of Bode 100 make sure that the absolute maximum ratings defined in chapter 4.1 Absolute maximum ratings on page 15 are not exceeded at any time. For save operation it is strongly recommended only to use the power supply delivered with Bode 100. Bode 100 provides the following three connectors at the front panel: OUTPUT: signal output (BNC socket) CH 1: channel 1 signal input (BNC socket) CH 2: channel 2 signal input (BNC socket) Figure 5-1: Bode 100 front view OMICRON Lab 19
 USB: data interface (USB type B port) : Equipotential ground connector for external ground connection (4 mm banana-socket) Figure 5-2: Bode 100 rear view 20")
20 Bode 100 provides the following three connectors at the rear panel: DC power input: input for DC voltages from 10 V to 24 V (5.0 mm power supply plug with 2.5 mm pin) USB: data interface (USB type B port) : Equipotential ground connector for external ground connection (4 mm banana-socket) Figure 5-2: Bode 100 rear view 20 OMICRON Lab

21 Device overview 5.2 Block diagram Bode 100 is a flexible device that features the following mayor building blocks: Figure 5-3: Bode 100 block diagram Signal source: The signal source of Bode 100 consists of an adjustable DDS sine-wave generator and adjustable amplifiers. The output impedance of Bode 100 is 50 Ω. Internal reference connections allow to directly connect the source signal to the receivers. Channel inputs: Each of the Bode 100 input features adjustable attenuators for best signal / noise ratio and software-switchable termination. Channel termination can be either 50 Ω or 1 MΩ. Without 50 Ω terminations the inputs are AC coupled. Down conversion & sampling: The input signal is down-converted to an intermediate frequency and sampled by a 24bit ADC. The sampled data is sent to the PC and evaluated by the Bode Analyzer Suite. More details on the hardware configuration can be found in 6.5 Hardware setup on page 37. OMICRON Lab 21

.")
22 5.3 Functional description The flexible hardware concept of Bode 100 allows to use it for several applications such as: Transmission / Reflection measurements Gain / Phase (transfer function) measurements Impedance measurements The device operates in a wide frequency range from 1 Hz to 50 MHz. Bode 100 creates a sine-wave at a frequency and measures two voltages. The creation of the sine wave and both voltage measurements are synchronized such that magnitude and phase relation of the two measured voltages can be derived. From the magnitude and phase ratio of the two voltages, the Bode Analyzer Suite calculates Impedance, Reflection, Admittance, Transmission or complex Gain values of the DUT (Device Under Test). For a complete list of all possible measurements that you can perform with Bode 100 see 7 Measurement types and applications on page Hardware revisions Currently there are two mayor hardware revisions of Bode 100 available. Revision 1 and Revision 2. To find out if you are using a Bode 100 R1 or a Bode 100 R2, check the identification plate on the bottom of the device. Below typical identification plates for a Bode 100 R1 and a Bode 100 R2 are shown. Bode 100 R1 Bode 100 R2 Your identification plate might look slightly different. The important information is visible in the Option field. If Option is Rev. 2, you are using a Bode 100 R2. If Option is empty, you are using a Bode 100 R1. 22 OMICRON Lab

23 Bode Analyzer Suite introduction 6 Bode Analyzer Suite introduction In this section you will learn the basics of the Bode Analyzer Suite. The window structure and the main functionality is explained. Step-by-step examples Hint: Get a quick introduction to the Bode Analyzer Suite and how to use Bode 100 by following the step-by-step examples. The following examples are available in this manual: Perform a Transmission / Reflection measurement on the IF filter DUT, see Transmission / Reflection measurement example on page 47. Perform a one-port impedance measurement on the Quartz filter DUT, see One-Port measurement example on page 56 Measure impedance of an inductor using the impedance adapter, see Impedance Adapter example on page Start screen When starting the Bode Analyzer Suite, the Start screen is shown. Figure 6-1: Bode Analyzer Suite Start screen. OMICRON Lab 23
. On your first start-up the demo-files are listed here. Check out the examples that explain the content of the demo-files.")
24 The Start screen allows the following user interactions: Choose the device to use (1.). This field is only visible if you have a Bode 100 device connected to your PC. Open a recent file or other file (2.). On your first start-up the demo-files are listed here. Check out the examples that explain the content of the demo-files. Select one of the available measurement modes (3.) and start a measurement. Hint: If you prefer to automatically start a measurement instead of entering the Start screen, choose your default startup measurement mode by clicking on Set default startup and choosing your preferred startup mode. You can also choose a.bode3 file to be your default startup configuration. 6.2 Main window After starting a measurement the Main window of the Bode Analyzer Suite is opened. Figure 6-2: Bode Analyzer Suite Main window. 24 OMICRON Lab
25 Bode Analyzer Suite introduction The Main window is structured into six main regions: 1. Measurement configuration The measurement configuration allows to configure the measurement frequencies and some hardware setup elements such as the source level, the attenuators and the receiver bandwidth. 2. Chart region In the chart region the measurement results are displayed. You can use the Trace settings on the right hand side to choose the result that shall be displayed. Different formats such as Magnitude or Phase as well as different diagrams such as Polar, Nyquist or Smith can be selected. To learn more about the result diagrams, have a look at 9.3 Using the interactive chart on page Trace settings Choose what measurement and which result format is displayed in a trace. Additional memory traces or math traces are also controlled in this region. Lear more about how to configure traces and memories in 9.5 Using the memory traces on page 117 and 9.6 Using the trace configuration on page Ribbon bar The ribbon bar contains the file operation commands as well as the buttons to start and stop a measurement. Further possibilities are the hardware setup, calibration, view settings, memory operations and cursor commands. 5. Cursor grid The cursor grid displays the values of the movable cursors that are attached to the traces shown in the result diagrams. To learn more about how to use the cursors, check out 9.4 Working with cursors and the cursor grid on page Status bar The status bar shows the connection state of the hardware and the receiver levels. Further possibilities are signal source control and internal device calibration control. OMICRON Lab 25

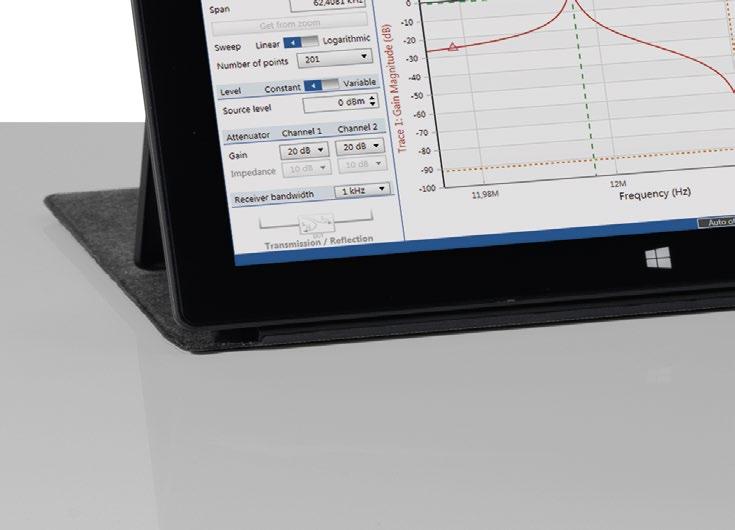
26 6.2.1 Measurement configuration Frequency In Frequency sweep mode you can change either Start frequency and Stop frequency or Center and Span. Get from zoom updates Start frequency and Stop frequency with the current zoom window range. Furthermore, the sweep mode can be Linear or Logarithmic and the number of points in the sweep can be chosen. In Fixed Frequency mode only the Source frequency can be adjusted. In this case the Bode 100 will display a vector chart instead of a frequency dependent chart. Source level Choose between a constant or variable output level (shaped level) and set the source level. The variable output level feature is only available in Frequency sweep mode. It allows to define different source levels for different frequency points. To learn more about the source control, refer to 9.2 Signal source settings on page 104. Attenuators Set the input attenuators for Receiver 1 (Channel 1) and Receiver 2 (Channel 2). If the measurement mode supports two measurements (Transmission and Reflection) you can set the attenuators for each measurement. Possible attenuator values are 0 db, 10 db, 30 db and 40 db. Increase the attenuators when you experience an overload, reduce the attenuators to improve signal to noise ratio. Receiver bandwidth Set the maximum Receiver bandwidth used for the measurement. Receiver bandwidth will be reduced internally if the measurement frequency is smaller than the Receiver bandwidth setting. Select a high Receiver bandwidth to increase measurement speed. Reduce Receiver bandwidth to reduce noise and to catch narrow-band resonances. 26 OMICRON Lab

27 Bode Analyzer Suite introduction Nominal impedance The nominal impedance or characteristic impedance value is used to calculate the Reflection factor. See also 7.2 Impedance measurement introduction on page 42. Note that this field is only visible if a reflection measurement is performed. Measurement mode Shows what measurement mode is currently used. All available measurement modes are explained in 7 Measurement types and applications on page 39. OMICRON Lab 27
28 6.2.2 Trace configuration In a Frequency Sweep measurement, the right hand side of the Bode Analyzer Suite shows the Trace configuration. The Trace configuration allows to choose what measurement (Gain, Impedance, Reflection, Admittance) is performed and how it is displayed in the chart. Trace configuration box: The Trace configuration box displays the trace-name and contains the following trace-display settings: Measurement: Impedance, defines that Trace 1 measures impedance. Display: Measurement, indicates that the chart shows the measured trace. Note that memory curves are displayed as well. Format: Magnitude, defines that Trace 1 displays the Magnitude of Impedance. Ymax: 100 Ω, The upper limit of the y-axis displayed in the diagram. Ymin: 1 mω, The lower limit of the y-axis displayed in the diagram. Y-axis scale : Log(Y), Currently the y-axis is set to a logarithmic scaling. Learn more about the trace configuration box in 9.6 Using the trace configuration on page 121. Memory configuration box: The memory configuration box allows to control the memory curves: Click to copy the current measurement data to Memory 1. Click to delete the Memory 1 trace. Click to link the cursors to Memory 1. Furthermore it can be selected with which trace (in which diagram) the memory is shown. Learn more about the memory curves in 9.5 Using the memory traces on page 117. Hint: By clicking the inner border of the Measurement configuration or Trace configuration you can collapse these configuration areas to create a bigger chart area. You can fold out the configurations anytime by clicking the respective areas at the side of the chart area. For more details refer to the figure below. 28 OMICRON Lab

29 Bode Analyzer Suite introduction Figure 6-3: Collapsing the measurement and trace configuration areas OMICRON Lab 29
30 6.2.3 Ribbon controls The Bode Analyzer Suite ribbons feature the following commands: Home ribbon New: Create a new measurement Open: Open a different measurement file Save: Save the current file Save as: Choose a different file name to save file Export: Export measurement data Report: Create a PDF print-report A detailed explanation on the single file operations can be found in 9.1 Exporting and saving measurement data or settings on page 98. Continuous: Starts a continuous measurement Single: Performs one single measurement Stop: Stops a running measurement Transmission/Gain: Open the hardware setup used for the gain measurement Impedance/Reflection: Open the hardware setup used for the impedance measurement For more information regarding the hardware setup, please check out Hardware setup. Full-Range: Perform a Full-Range calibration User-Range: Perform a User-Range calibration For more information regarding the calibration, please check out 8 Calibration on page 75 Memory ribbon Copy the current measurement data to a new or existing memory trace. Show all available memory traces in the diagram. 30 OMICRON Lab
31 Bode Analyzer Suite introduction Hide all available memory traces. They will not be shown in the diagram. Delete all memory traces. You can find more information about the use of the memory traces in 9.5 Using the memory traces on page 117. View ribbon Auto axis placement attempts to show two axes (traces) in one diagram. One axis per chart shows a separate diagram for each trace. You can find more information in Configure the diagrams on page 107. Arrange multiple diagrams side by side. Arrange multiple diagrams from top to bottom other. Activate averaging. More details can be found in 9.8 Averaging on page 127. Open a text field to add text notes to the current measurement. Cursor ribbon Activate a cursor calculation. For more details please check out cursor calculations. Activate cursor linking. Cursor linking maintains a constant distance between two cursors. By moving one cursor, the second one will follow automatically. Use this feature to e.g. measure the slope at crossover frequency in a bode plot. You can select either decade (x10) or octave (x2) or constant linear distance which will maintain the current frequency delta value. OMICRON Lab 31
32 6.2.4 Status bar The Status bar has several displays and interactive control elements. These are: Source indicator The source indicator shows if the signal source of Bode 100 is switched on. By moving the mouse over the indicator, a pop-up allows to change between Auto off and Always on setting. More details regarding the source setting can be found in 9.2 Signal source settings on page 104. Overload indicators The overload indicators show the signal level at the receivers of Bode 100. Red color indicates an overload of the receiver. An overload warning will be shown in the chart in such a case. Internal device calibration indicator Shows the date of the last performed internal device calibration. Move the mouse over the indicator in order to perform a new internal device calibration. Device connection indicator Displays the serial number of the connected device. If no device is connected, "No device" is shown. Move the mouse over the indicator in order to search or re-connect to a Bode 100 device. 32 OMICRON Lab
33 Bode Analyzer Suite introduction 6.3 Chart context menu By right clicking into the chart you get access to a context menu that allows quick access to several functions: Reset Zoom: Resets the x-axis to the start and stop frequency and the y-axes to the predefined Ymin and Ymax values. See Zooming the measurement curve on page 109 for details. Optimize: Optimizes the Ymin and Ymax values once to ensure that the current measurement curve fills the chart area in an optimum way. Auto Optimize: Optimizes the Ymin and Ymax values continuously to ensure that the measurement curve always fills the chart area in an optimum way. Reset Axes: Resets the Y-axes to their predefined startup values. See Optimize the axis scaling on page 112 for detail on these functions. Copy image to clipboard: Copies a image of the current chart to the clipboard. Copy data to clipboard: Copies all measurement points of Trace 1 or Trace 2 to the clipboard for further processing in a spread sheet software. Copy settings to clipboard: Copies all measurement settings to the clipboard in text format. See Use the copy to clipboard functions to export data on page 98 for details on these functions. Cursor 1 & Cursor 2: Allows to access several cursor functions to position the cursors to the maximum, minimum or zero crossing of the measurement traces. See 9.4 Working with cursors and the cursor grid on page 115 for details on these functions. OMICRON Lab 33

34 6.4 Options menu The Options menu allows you to modify several functions of the Bode Analyzer Suite. You can access the Options menu by either clicking the icon in the top right corner of the Bode Analyzer Suite's main window or by clicking File Options. Figure 6-4: Bode 100 Options menu In the Common section of the Options Menu you can change the following settings: General: Default level unit: allows you to change the unit for Bode 100's source level setting. You can choose dbm, Vpp or Vrms. dbm defines the power dissipated into 50 Ω load. Vpp and Vrms are the voltage output levels present when a 50 Ω load is connected at the output. Due to the source's output impedance the output voltage will change depending on the impedance of the connected load. See more in 9.2 Signal source settings on page 104. Cursor resolution: Defines the number of digits behind the decimal separator for all values shown in the cursor grid. 34 OMICRON Lab
35 Bode Analyzer Suite introduction Logging: Log Level:This function allows you to define the severity level of the events stored in the log-file. Default is Warning. Do not use the log-levels Verbose or Debug, except if told by the OMICRON Lab support team. UDP Logging: allows you to enable event logging via UDP and to define the used UDP port. Logging to a file: allows you to enable the logging of events to a log file and to define the location of the log file on your computer's hard drive. Common: Allows you to enable the device selection in the start up screen and to change your preference in relation to the Customer Experience Improvement Program. Chart: In this section you can optimize the size of the text fonts and the thickness of the measurement traces in the exported chart. Further on, you can enable the inclusion of the chart legend and the cursor grid. In addition the position of the cursor grid in the exported chart and the image file format can be defined. Data: In this section you can choose the decimal separator and the field separator for the clipboard export. Find more information in Use the copy to clipboard functions to export data on page 98. In this section you can define several parameters for the CSV- Export, Excel-Export and Touchstone-Export of the measured data. These parameters are the default values that will be used for all future exports you perform. Find out more in Exporting measurement data to CSV or Excel files on page 100. Here you can choose if comments, the cursor table, the chart legend or shaped level are included in the report or not. Additionally, you can choose if you want to use a custom report or the standard report. Finally you can select if the report should be opened after its generation and the program that should be used to display the report. Detailed information is available in Generate a PDF report on page 103. OMICRON Lab 35

36 In the Chart section of the Options Menu you can change the following settings: The sections in this unit allow you to optimize the quality and appearance of the charts displayed in the Bode Analyzer Suite. Further on, you can select if the axis labels are displayed in scientific or engineering format. General: Here you can select the maximum number of memory traces, the default memory line pattern (e.g. solid or dashed) as well as if the deletion of a memory trace needs to be confirmed or not. Alternating memory trace color mode: By enabling this mode you can make it easier to find out to which trace a memory belongs. If activated each memory alternates the memory color and the color of the trace it belongs to as shown below: Hint: Click time. to switch back to the default settings of all options at any 36 OMICRON Lab
37 Bode Analyzer Suite introduction 6.5 Hardware setup By clicking on the Hardware setup icon, the hardware setup dialog is opened. The hardware setup dialog shows the internal connections of Bode 100 as well as the external connection to the DUT. Depending on the selected measurement mode, hardware settings such as Channel termination, Receiver connection or an external Probe factor can be changed by clicking on the icons shown in the Hardware setup dialog. Figure 6-5: Hardware setup dialog in Gain/Phase measurement mode. Depending on the measurement mode, some of the following settings can be changed by the user: Source mode: Choose between Auto off or Always on. More details on the source behavior of Bode 100 can be found in 9.2 Signal source settings on page 104. Source level: Set the constant source level or the reference level when the shaped level function is used. Receiver bandwidth: Select the receiver bandwidth used for the measurement. OMICRON Lab 37
38 DUT settling time: Time between applying the measurement signal and starting to measure at the receiver. A DUT settling time is needed if the DUT introduces a significant time delay before the output reaches its final reaction to the input stimulus. Attenuator 1 and Attenuator 2: Select the input attenuators. Reference switch: Receiver 1 and Receiver 2 can be connected either internally or externally depending on the measurement mode. Termination switch: When switched on, the Channel 1 and Channel 2 inputs are terminated with 50 Ω. If the switch is open, the input impedance is 1 MΩ. Probe 1 and Probe 2: Some measurement modes allow you to manually enter a probe factor. For more details on using probes see 9.9 Using probes on page OMICRON Lab
39 Measurement types and applications 7 Measurement types and applications Bode 100 allows measuring Gain as well as Impedance, Reflection and Admittance. The following chapters introduce you to the basics of the Gain and Impedance / Reflection / Admittance measurements. For an easy use, the Bode Analyzer Suite supports different measurement types / modes for different applications. The available measurements are listed in the start screen of the Bode Analyzer Suite (see 6.1 Start screen on page 23). The available measurement modes are grouped in the Vector Network Analysis Tab and the Impedance Analysis Tab: Vector Network Analysis The Vector Network Analysis Tab contains the following measurement types: 1. Transmission / Reflection 2. Gain / Phase 3. Reflection with external coupler Impedance Analysis The Impedance Analysis Tab contains the following measurement types: 1. One-Port 2. Impedance Adapter 3. Shunt-Thru 4. Shunt-Thru with series resistance 5. Series-Thru 6. Voltage / Current 7. External Bridge In the following chapters all measurement types are explained in detail. OMICRON Lab 39
40 7.1 Gain measurement introduction Bode 100 offers two different ways of measuring Gain. Either with the internal reference or the external reference. Internal reference means that Receiver 1 is internally connected to the Bode 100 signal source picking up the source voltage. External reference means that Receiver 1 is routed to the front panel input Channel 1. Depending on the Receiver 1 connection, Gain is measured as shown in the following table: Receiver 1 is set to internal reference Bode 100 measures Receiver 1 is set to external reference Bode 100 measures Where V 0 is the internal source voltage. If Channel 2 is terminated with 50 Ω (default), Gain equals the scattering parameter S21 of a two-port DUT (Port 1 is connected to Bode 100 output and port 2 is connected to Bode 100 Channel 2). Gain therefore equals the transfer function of a 2- port DUT if Channel 1 is connected to the DUT input port and Channel 2 is connected to the DUT output port. If Channel 2 is set to high-impedance, a Thru-connection from Output to Channel 2 will result in +6 db. To normalize to 0 db you can use Thrucalibration. The following two measurement modes can be used to perform a Gain measurement: 1. Transmission / Reflection: This mode allows both, measurements with internal and external reference connection. 2. Gain / Phase: Is used to measure Gain from Channel 1 to Channel 2 (Frequency Response Measurement). Since the gain result is a complex number you can choose how gain shall be displayed. You can select the result formats by clicking the drop down Format in the trace configuration box. 40 OMICRON Lab
: Displays the magnitude of the measured Gain in db Phase ( ): Displays the phase of the measured Gain in degrees. Phase (rad): Displays the phase of the measured Gain in radians.")
41 Measurement types and applications In a gain measurement the following result formats are available: Gain Result Formats Magnitude: Displays the magnitude of the measured Gain. Magnitude (db): Displays the magnitude of the measured Gain in db Phase ( ): Displays the phase of the measured Gain in degrees. Phase (rad): Displays the phase of the measured Gain in radians. Tg: Displays the group delay of the measured Gain in seconds (see Gain result format equations for details). Polar: Displays the measured Gain in a polar chart. Real: Displays the real part of the measured Gain. Imaginary: Displays the imaginary part of the measured Gain. Nyquist: Displays the measured Gain in a Nyquist chart. Q(Tg): Displays the Q-factor derived from group delay. This value is used for NISM (see cursor calculations on page 123 for details). Gain result format equations The Gain results are calculated based on the following equations: Gain H: where h is the magnitude of gain H and φ the phase of H. ω is the angular frequency with the frequency f. Group delay Tg is calculated by symmetric difference quotient Q(Tg) is the quality factor derived from the group delay OMICRON Lab 41

42 7.2 Impedance measurement introduction Bode 100 offers several ways of measuring Impedance, Reflection or Admittance. Impedance, Reflection and Admittance are directly related to each other by the following equations: Admittance Y is the reciprocal of the impedance Z. The reflection coefficient Γ is calculated from the measured impedance Z and the nominal impedance Z 0. Z 0 can be changed by the user in the measurement configuration. The nominal impedance Z 0 field is only visible if a measurement trace is set to Reflection. The Impedance Analysis modes allow you to display the measurement results in various formats. You can select the result formats by clicking the drop down Format in the trace configuration box. Depending on the chosen measurement the following result formats are available: Impedance Result Formats Magnitude: Displays the magnitude of the measured impedance in Ohms. Magnitude (db): Displays the magnitude of the measured impedance in dbω. Phase ( ): Displays the phase of the measured impedance in degrees. Phase (rad): Displays the phase of the measured impedance in radians. Tg: Displays the group delay of the measured impedance in seconds (see Gain result equations for details). Polar: Displays the measured impedance in a polar chart. Real: Displays the resistance of the measured impedance in Ohms. Imaginary: Displays the reactance of the measured impedance in Ohms. Rs: Displays the equivalent series resistance (ESR) of the measured impedance in Ω. This value equals the Real part of impedance. Ls: Displays the equivalent series inductance (ESL) of the measured impedance in Henry. 42 OMICRON Lab
.")
43 Measurement types and applications Cs: Displays the equivalent series capacitance (ESC) of the measured impedance in Farad. Q: Displays the Q-factor of the measured impedance (see Impedance result equations for details). Nyquist: Displays the measured impedance in a Nyquist chart Q(Tg): Displays the Q-factor derived from group delay. This value is used for NISM (see Cursor calculations for details). tan(δ): Displays the tan(δ) of the measured admittance. (see Impedance result equations for details). Admittance Result Formats Magnitude: Displays the magnitude of the measured admittance in Siemens. Magnitude (db): Displays the magnitude of the measured admittance in dbs. Phase ( ): Displays the phase of the measured admittance in degrees Phase (rad): Displays the phase of the measured admittance in radians Tg: Displays the group delay of the measured admittance in seconds (see Gain result equations for details). Polar: Displays the measured admittance in a polar chart. Real: Displays the conductance of the measured admittance in Siemens. Imaginary: Displays the susceptance of the measured admittance in Siemens Rp: Displays the equivalent parallel resistance of the measured admittance in Ohms. Lp: Displays the equivalent parallel inductance of the measured admittance in Henry. Cs: Displays the equivalent parallel capacitance of the measured admittance in Farad. Q: Displays the Q-factor of the measured admittance (see Impedance result equations for details). Nyquist: Displays the measured admittance in a Nyquist chart. Q(Tg): Displays the Q-factor derived from group delay (see Cursor calculations for details). tan(δ): Displays the tan(δ) of the measured admittance. (see Impedance result equations for details) OMICRON Lab 43
: Displays the magnitude of the measured reflection coefficient in db Phase ( ): Displays the phase of the measured reflection coefficient in degrees.")
44 Reflection Coefficient Result Formats Magnitude: Displays the magnitude of the measured reflection coefficient. Magnitude (db): Displays the magnitude of the measured reflection coefficient in db Phase ( ): Displays the phase of the measured reflection coefficient in degrees. Phase (rad): Displays the phase of the measured reflection coefficient in radians. Tg: Displays the group delay of the measured reflection coefficient in seconds (see Gain result equations for details). Polar: Displays the measured reflection coefficient in a polar chart. Smith: Displays the measured reflection coefficient respectively impedance in a Smith chart. VSWR: Displays the voltage standing wave ratio of the measured reflection coefficient. Real: Displays the real part of the measured reflection coefficient. Imaginary: Displays the imaginary part of the measured reflection coefficient. Nyquist: Displays the reflection coefficient in a Nyquist chart. Q: Displays the Q-factor of the measured reflection (see Impedance result equations for details). Nyquist: Displays the measured reflection in a Nyquist chart. Q(Tg): Displays the Q-factor derived from the group delay (see Cursor calculations for details). 44 OMICRON Lab
45 Measurement types and applications Result format equations The Impedance / Admittance / Reflection results are calculated based on the following equations: ImpedanceZ: where R is the real part of the impedance (resistance) and X the imaginary part of the impedance (reactance). ω is the angular frequency with the frequency f. Series equivalent resistance Rs equals the real part of impedance Series equivalent capacitance Cs Series equivalent inductance Ls Series circuit quality factor Q tan(d) of impedance Admittance Y: where G is the real part of the admittance (conductance) and B the imaginary part of the admittance (susceptance). ω is the angular frequency with the frequency f. Parallel equivalent resistance Rp Parallel equivalent capacitance Cp Parallel equivalent inductance Lp Parallel circuit quality factor Q tan(d) of admittance OMICRON Lab 45

46 Reflection Coefficient Γ: Voltage Standing Wave Ratio VSWR Tg as well as Q(Tg) are calculated in the same way as for the gain measurement (see 7.1 Gain measurement introduction on page 40). 7.3 Vector Network Analysis Transmission / Reflection The Transmission / Reflection measurement mode is designed to measure the S-parameters S21 and S11 in the 50 Ω domain. The Transmission / Reflection measurement mode allows to measure both, Transmission (Gain) and Reflection (Impedance). It is possible to select e.g. a Gain measurement in Trace 1 and an Impedance measurement in Trace 2. Bode 100 will then sequentially measure Gain and Impedance. Therefore some hardware settings are available twice. Once for the Gain measurement and once for the Impedance measurement. Also the hardware setup dialog is available twice. Once for the Gain measurement and once for the impedance measurement. For details on how the Gain is calculated, please check 7.1 Gain measurement introduction on page 40. Calibration in the Transmission / Reflection measurement mode The Transmission / Reflection measurement mode does not require calibration to perform a measurement. However, to remove the influence of your connection cables the measurement mode offers Gain (Thru) as well as Impedance (Open, Short, Load) calibration. Gain calibration applies to a Gain measurement and Impedance calibration applies to a Impedance/Reflection/Admittance measurement. When measuring at high frequency or with long cables it is strongly recommended to perform a calibration. For more details regarding the Gain calibration please refer to 8 Calibration on page OMICRON Lab

47 Measurement types and applications Typical applications Typical applications for the Transmission / Reflection measurement mode are: Measuring Transmission and Reflection of filters such as IF filters or EMI filters. Comparing results from measurements with internal and external reference connection (the Transmission / Reflection measurement mode is the only measurement mode that allows changing the Receiver 1 connection). Measuring Gain of RF amplifiers in the 50 Ω domain. Transmission / Reflection measurement example Follow the steps described below to perform a Transmission / Reflection measurement: Connect the test object "IF Filter" to Bode 100 using two BNC cables as shown in the figure below. Figure 7-1: Connecting the test object IF Filter to Bode 100 OMICRON Lab 47

48 Now start the Bode Analyzer Suite and enter the Transmission / Reflection measurement mode by clicking on. Before starting the measurement set the Start and Stop frequency to the values shown below: After setting the Start and Stop frequency the Center frequency as well as the frequency Span are set automatically. Alternatively you can enter the Span and Center and the Start and Stop frequency are updated accordingly Now you are ready to start your first measurement. Simply click in the home ribbon. As a result you will see a first measurement comparable to the one shown in the figure below. 48 OMICRON Lab
49 Measurement types and applications Figure 7-2: S-Parameter measurement of a 10.7 MHz IF filter Trace 1 (red curve) shows the Magnitude of the Gain (= Magnitude of S21) while Trace 2 (blue curve) shows the Magnitude of Reflection (= Magnitude of S11). You can change Format for both traces to display other results such as Phase or Real and Imaginary components To optimize the chart you can right click onto the chart and select Optimize as shown below. For more information on the chart's context menu check out 6.3 Chart context menu on page 33. OMICRON Lab 49
50 Figure 7-3: Context menu of chart 50 OMICRON Lab
 and check out the results in the cursor grid (2.) as shown in 7-4 on page 51. For more cursor functions visit 9.4 Working with cursors and the cursor grid on page 115.")
51 Measurement types and applications Further on you can use the cursors to perform measurements. To do so simply drag the cursors to the point you want to measure (1.) and check out the results in the cursor grid (2.) as shown in 7-4 on page 51. For more cursor functions visit 9.4 Working with cursors and the cursor grid on page 115. Figure 7-4: Use of cursors and cursor grid Congratulations you have performed your first measurement with the Bode 100. You can load the settings for the measurement by clicking File Open and then navigating to: "%APPDATA% \OMICRON Lab\Bode Analyzer Suite\Demo Files\". The file you will need is: TransRefl_IF- Filter.bode3 Hint: The Transmission / Reflection is the most flexible measurement setup for the Bode 100. By selecting this setup you can switch between internal and external reference. Further on, you can switch the input impedance of input CH1 and input CH2 between 50 Ω and high impedance. OMICRON Lab 51

52 7.3.2 Gain / Phase The Gain / Phase measurement mode is designed to measure the transfer function of a DUT using the external reference connection. This means that both Channel 1 and Channel 2 are active. The Gain Measurement Bode 100 measures Gain therefore equals the transfer function of a 2-port DUT if Channel 1 is connected to the DUT input port and Channel 2 is connected to the DUT output port. The inputs Channel 1 and Channel 2 are set to 1 MΩ by default. Details on the gain measurement can be found in 7.1 Gain measurement introduction on page 40. Calibration The Gain / Phase measurement mode does not require calibration to perform a measurement. However, to remove the influence of probes and cables Gain (Thru) calibration is recommended. For more details regarding the Gain calibration please refer to 8 Calibration on page 75. Typical applications Typical applications for the Gain / Phase measurement mode are: Measuring the transfer function of filters or other circuits. Measuring in-circuit transfer functions using high-impedance probes. Measuring the transfer function of amplifiers etc. Measuring loop stability of power supplies. 52 OMICRON Lab

53 Measurement types and applications Measurement example For detailed measurement examples using the Gain / Phase measurement mode, please check out the application notes at The following application notes use the Gain / Phase measurement mode: DC/DC Converter Stability Measurements Bipolar Transistor AC Current Gain Measurement Op-Amp measurements PSRR Measurement And many more Reflection with external coupler The External coupler measurement mode is designed to measure reflection using an external coupler. This offers the possibility to use an external amplifier and protect the inputs of Bode 100 by using an external directional coupler. Calibration Please note that the external coupler measurement mode requires an impedance calibration (Open, Short, Load). For more details on how to perform an impedance calibration see Calibrating an External Coupler or External Bridge measurement on page 86. Typical applications Typical applications for the external coupler measurement mode are: Measuring medium-wave antennas. Measuring impedance with high-power amplifiers. Measurement example For a detailed measurement example using the external coupler measurement mode, please check out the medium wave antenna measurement application note at OMICRON Lab 53

54 7.4 Impedance analysis One-Port The One-Port measurement mode is designed to perform quick impedance, admittance and reflection measurements. One advantage of the One-Port impedance measurement mode is that no external calibration is required. Bode 100 can measure impedance directly at the output port. Measurement information Bode 100 derives the impedance by evaluating the internal source voltage and the output voltage. Receiver 1 as well as Receiver 2 are internally connected. General details on impedance measurements with Bode 100 can be found in 7.2 Impedance measurement introduction on page OMICRON Lab

55 Measurement types and applications Figure 7-5: Hardware setup of the One-Port measurement mode. Since the output impedance of Bode 100 is 50 Ω, the one-port measurement provides highest sensitivity for a DUT having an impedance close to 50 Ω. The method is generally suitable to measure impedance values between roughly 500 mω and 10 kω. For measurements close to the limits of this method it is highly recommended to perform a careful User-Range calibration to achieve best results. Calibration The One-Port impedance measurement mode does not require calibration to perform a measurement. However, to achieve highest accuracy a calibration is recommended. Furthermore a calibration allows to move the reference plane from the output port of Bode 100 to the end of a connection cable. This compensates the effect of the connection cable. For more details on how to perform an Impedance calibration please refer to Calibrating a Reflection or One-Port Impedance measurement on page 84. Typical applications Typical applications for the One-Port impedance measurement mode are: Measuring impedance of passive components. Measuring impedance of cables, piezo-elements or any one-port DUT. OMICRON Lab 55


56 One-Port measurement example In this measurement example we will determine the series ans parallel resonance frequency of a 12 MHz quartz filter. Further on, we will display the quartz filter's reflection curve in a Smith chart. Connect the input IN 2 of the test object "Quartz Filter" to the OUTPUT of Bode 100 using a BNC cable. Further on, connect the BNC short delivered with Bode 100 to the corresponding output OUT 2. The complete setup is shown in the figure below. Figure 7-6: Connecting the test object Quartz Filter to Bode 100 Now start the Bode Analyzer Suite and enter the One-Port measurement mode by clicking Impedance Analysis and then. 56 OMICRON Lab

57 Measurement types and applications Before starting the measurement set the Center frequency, frequency Span and the Number of points to the values shown below. Further on, select sweep linear: Now click in the home ribbon. As a result you will see a first measurement comparable to the one shown in the figure below. OMICRON Lab 57

58 Figure 7-7: Impedance measurement of the test object Quartz Filter Trace 1 (red curve) shows the Magnitude of the Quartz Filter's impedance while Trace 2 (blue curve) shows the Phase of the Quartz Filter's impedance. Before continuing the measurement please switch of Trace 2 by unchecking the corresponding check box. To determine the parallel and series resonance of the Quartz filter we need to zoom in. You can do this by clicking into the chart on the top left corner of the intended zoom area, keep the mouse button pressed and pull it to the lower right corner of the intended zoom area as shown. 58 OMICRON Lab
59 Measurement types and applications In the zoomed window you will see that you are not having enough frequency points. By pressing you can set the start and stop frequency of the measurement to match the zoomed window. Right Click into the chart and select Optimize. Repeat these steps until you achieve a chart as shown in 7-8 on page 59 Figure 7-8: Optimizing the frequency resolution with Get from zoom For more information on the zoom functions and optimizing check out Zooming the measurement curve on page 109 and 6.3 Chart context menu on page 33. OMICRON Lab 59
60 After you have optimized the chart you can measure the series resonance and parallel resonance using the cursors. To do so right-click into the chart area close to the red curve and choose Cursor 1 and then Jump to Min (Trace 1). Then right-click into the chart area once more and choose Cursor 2 and then Jump to Max (Trace 1) Figure 7-9: Using the cursor jump functions For more information on cursor functions visit 9.4 Working with cursors and the cursor grid on page OMICRON Lab
: 11.996768 MHz Parallel resonance frequency (Cursor 2 - orange): 11.")
61 Measurement types and applications Now let's have a look at the measurement result: Figure 7-10: Series and parallel resonance frequency of the quartz filter To determine the series and parallel resonance frequencies check out the cursor grid as shown in 7-8 on page 59: Series resonance frequency (Cursor 1 - green): MHz Parallel resonance frequency (Cursor 2 - orange): MHz Offset between the series and parallel resonance frequency (Delta C2-C1): 1.8 khz Your measurement results can be slightly different since each quartz filter behaves a little bit different. One characteristic of resonance frequencies is that the inductances and capacitances compensate each other. This means that at the series and parallel resonance the impedance of our quartz filter should be purely resistive. An elegant way to check this is to display the quartz filters reflection curve as a Smith chart. OMICRON Lab 61

62 Smith charts were developed at a time when it was still difficult to directly measure the frequency swept impedance of measurement objects. The Smith chart is used to determine the impedance at a certain point of the reflection curve. To display the Smith chart of our quartz filter's impedance apply the settings shown below to Trace 1: After applying the settings a smith chart like the one shown below will be displayed: 62 OMICRON Lab

63 Measurement types and applications Figure 7-11: Smith chart of the 12 MHz Quartz Filter As you can see both cursors are very close to the horizontal (=resistive) axis of the Smith chart. However, you can also see that the imaginary part for both measurements is not exactly 0 Ω. The reason for this is the chosen number of frequency points and the frequency resolution resulting from it. Fell free to use more points and zooming to determine the exact frequencies at which the imaginary part of the impedance becomes 0 Ω Congratulations you have performed your impedance measurement with the Bode 100. You can load the settings for the measurement by clicking File Open and then navigating to: "%APPDATA%\OMICRON Lab\Bode Analyzer Suite\Demo Files\". The file you will need is: OnePort_Quartz-Filter.bode3. OMICRON Lab 63

64 7.4.2 Impedance Adapter The impedance adapter measurement mode is especially designed for measurements with the OMICRON Lab impedance test fixtures B-WIC and B-SMC. The impedance adapter measurement mode ensures that Bode 100 is configured correctly to achieve best results when measuring with both B-WIC and B-SMC. Calibration The impedance adapter measurement mode requires impedance (open, short, load) calibration. For more details on how to calibrate the B-WIC or B-SMC impedance adapter, please refer to Calibrating an Impedance Adapter measurement on page 88. Measurement information With B-WIC and B-SMC, the dynamic range of both input channels is used. This widens the usable impedance measurement range to 20 mω to 600 kω. It is recommended to use the 0.5 m BNC cables delivered with Bode 100 to connect B-WIC or B-SMC to the Bode 100. B-WIC and B-SMC are designed to measure physically small DUTs. Stray-fields between the DUT and the grounded housing of the impedance adapters might introduce a systematic measurement error. The error is negligible when measuring physically small objects. To measure physically big DUTs it is recommended to use a grounded measurement configuration such as shown in One-Port on page 54. Typical applications Typical applications for the impedance adapter measurement mode are: Measuring impedance of capacitors, inductors and other passives (THT and SMC). Measuring impedance piezo-elements or quartz elements. Impedance Adapter measurement example In this measurement example we will determine the inductance (Ls) and the equivalent series resistance (Rs) of an inductance with the B-WIC impedance measurement adapter for through-holetype components. Connect the B-WIC to Bode 100 using three BNC cables as shown below. 64 OMICRON Lab


65 Measurement types and applications Figure 7-12: Connecting the B-WIC to Bode 100 Now start the Bode Analyzer Suite and enter the Impedance Adapter measurement mode by clicking Impedance Analysis and then. Before you can start a measurement you have to perform a Full range calibration. To do so please follow the steps described in Impedance Adapter Calibration on page 88. After having performed the calibration please put the inductor you want to measure into the impedance measurement adapter as shown in 7-12 on page 65. Since it is not known in what frequence range the examined inductor is working please change the stop frequency to 50 MHz. OMICRON Lab 65


66 Now click in the home ribbon. As a result you will see a first measurement comparable to the one shown in the figure below. For sure your result will look different since you are using a different inductor. Figure 7-13: Impedance measurement of an Inductor 66 OMICRON Lab

67 Measurement types and applications Trace 1 (red curve) shows the Magnitude of the inductor's impedance while Trace 2 (blue curve) shows the phase of the inductor's impedance. The magnitude curve is rising with 20 db per decade, this indicates that we are really measuring an inductor. To measure the resistance Rs and inductance Ls of the inductor simply change the format for Trace 1 and Trace 2 as shown. To get a better view on the Ls and Rs it is recommended to switch to two diagrams. To do so follow the instructions described in Configure the diagrams on page 107. OMICRON Lab 67

68 Well, and now we have our result: Figure 7-14: Measurement of a 15µH inductor with the B-WIC impedance adapter By using the cursors we can gather the following information on the measured inductor: The inductor has an inductance of 15 µh up to 220 khz The resistance of the inductor starts around 20 mω and rises up to 2 Ω at 220 khz Above 220 khz the inductance starts to drop and slightly above 50 MHz the inductor will have its resonance frequency and become capacitive. 68 OMICRON Lab

69 Measurement types and applications Congratulations you have successfully used the B-WIC impedance measurement adapter with the Bode 100. You can load the settings for the measurement by clicking File Open and then navigating to: "%APPDATA%\OMICRON Lab\Bode Analyzer Suite\Demo Files\". The file you will need is: ImpAdapt_Inductor.bode3. Attention: Since your setup will be different the file should only be used to explore the different measurement formats offered by Bode 100. Before you execute an own measurement you will have toperform a new calibration. For a detailed measurement example using the impedance adapter measurement mode to measure capacitors, please check out the ESR measurement application note at Shunt-Thru The Shunt-Thru measurement mode is especially suitable to measure very small impedance values. It is basically an S21 transmission measurement in a special configuration. The impedance is calculated from the measured S21 parameter. Measurement information Bode 100 measures S21 gain and calculates impedance Z using the equation: The Shunt-Thru measurement configuration emulates a 4-wire kelvin connection. The output drives a current thru the device under test that is shunted between the output signal and GND. Channel 2 measures the voltage drop that occurs at the DUT. This measurement mode offers highest sensitivity for low-impedance value DUT. The recommended impedance measurement range starts at roughly 1 mω. With amplifiers or pre-amplifiers also µω measurements can be performed. Shunt-Thru measurement configuration offers low sensitivity for high impedance DUTs. It is not recommended to measure impedance values much higher than 100 Ω. The Shunt-Thru configuration inherently suffers a ground-loop error at low frequencies. The current flowing thru the cable shield of the connection to Channel 2 ground introduces a measurement error that can become significant at frequencies below 10 khz to 100 khz when measuring very low impedance values. To suppress respectively reduce the ground- OMICRON Lab 69
70 loop error at low frequencies, use a common-mode choke or common-mode transformer or an active isolation device. Note that the Shunt-Thru transformation from S21 to impedance assumes 50 Ω as source impedance and input impedance. To improve signal to noise ratio for very low impedance measurements, you can use a 50 Ω amplifier at the Output of Bode 100 as shown in the image below. Use calibration to remove the amplifier gain and phase shift. Calibration The Shunt-Thru measurement is basically a Gain measurement that is transformed to an impedance. Therefore two calibrations are possible. Either a Thru-calibration or an Open, Short, Load calibration. Thru calibration calibrates the underlying S21 measurement and removes the gain/phase shift of the cable connection, common mode choke or amplifier. Open, Short, Load calibration shifts the reference plane directly to the calibration plane. For more details on calibrating a Shunt-Thru measurement, please refer to Calibrating a Shunt- Thru or Series-Thru measurement on page 90. Typical applications A typical application for the Shunt-Thru measurement mode is the ESR measurement of ultra-low ESR decoupling caps. 70 OMICRON Lab

71 Measurement types and applications Shunt-Thru with series resistance Shunt-Thru with series resistance is very similar to the normal Shunt-Thru measurement mode. For more details regarding the normal Shunt-Thru measurement mode, please see Shunt-Thru on page 69. Measurement information Bode 100 measures S21 gain and calculates impedance Z using the equation: Compared to the normal Shunt-Thru measurement mode, the series resistors increase the maximum measurable impedance. This is of advantage when one needs to measure from roughly 10 mω to some kωs. The higher the series Resistors Rs are chosen, the higher the maximum recommended impedance is. However, at the same time the lower impedance limit rises. OMICRON Lab 71
72 The following table shows some Rs values and their influence on the impedance measurement range: Series Resistor Rs Lower Z Limit Upper Z Limit 200 Ω 5 mω 1125 Ω 450 Ω 10 mω 2250 Ω 499 Ω 11 mω 2480 Ω 950 Ω 20 mω 4500 Ω The Shunt-Thru with series resistor configuration suffers from the same systematic error as the normal Shunt-Thru configuration. Please refer to Shunt-Thru on page 69 for more details about the cable-braid-error. Calibration The Shunt-Thru with series resistor measurement requires at least one Thru calibration. Thru calibration must be performed with the series resistors included. For more details on calibrating a Shunt-Thru measurement, please refer to Calibrating a Shunt- Thru or Series-Thru measurement on page Series-Thru The Series-Thru measurement configuration is especially suitable to measure very high impedance values. It is basically an S21 transmission measurement in a special configuration. The impedance is calculated from the measured S21 parameter. Measurement information Bode 100 measures S21 gain and calculates impedance Z using the equation: The Series-Thru configuration offers high sensitivity for high-impedance DUTs. Impedance values in the MΩ region can be measured. Using an output amplifier further increases the upper impedance measurement limit. Shunt-Thru measurement configuration is not suitable for low-impedance DUTs. It is not recommended to measure impedance values below roughly 1 kω. One advantage of the series-thru connection is that a shielded test-setup can easily be constructed. 72 OMICRON Lab

73 Measurement types and applications Calibration The Series-Thru measurement is basically a Gain measurement that is transformed to an impedance. Therefore two calibrations are possible. Either a Thru-calibration or an Open, Short, Load calibration. Thru calibration calibrates the underlying S21 measurement and removes the effect of the cable connection to the DUT. Open, Short, Load calibration shifts the reference plane directly to the calibration plane. For more details on calibrating a Series-Thru measurement, please refer to Calibrating a Shunt- Thru or Series-Thru measurement on page 90. Typical applications A typical application for the Series-Thru measurement is the measurement of DUTs with low conductivity (high impedance) Voltage/Current The Voltage/Current measurement mode is basically a Gain measurement with external reference similar to the Gain/Phase measurement mode. However, the fact that the Gain is treated as an impedance result offers all impedance result formats such as L, C and Q calculations. Measurement information Bode 100 measures Gain and transforms it directly to impedance Z using: The voltage/current measurement is very flexible. The usable impedance measurement range cannot be generalized since it strongly depends on the used probes and connections. Using highly sensitive current sensing, very high impedance values can be measured. Using very sensitive voltage measurements, very low impedance values can be measured. Calibration The Voltage/Current measurement is basically a Gain measurement that is transformed to an impedance. Therefore two calibrations are possible. Either a Thru-calibration or an Open, Short, Load calibration. Thru calibration calibrates the underlying gain measurement and removes gain and phase shifts of the probes. A 1 Ω resistor is needed to perform a Thru calibration in the Voltage/Current measurement mode. Open, Short, Load calibration shifts the reference plane directly to the calibration plane. OMICRON Lab 73

74 For more details on calibrating a Voltage/Current measurement, please refer to Calibrating a Voltage/Current measurement on page 92. Typical applications The Voltage/Current measurement is suitable for a high variety of measurement applications. It is the mode of choice for every impedance measurement that measures voltage and current separately. Typical measurements are: Input impedance measurement of active circuits such as power supplies. Output impedance measurement of active circuits such as power supplies. Measurement example For detailed measurement examples using the voltage/current measurement mode, please check out the Non-Invasive stability application note at External Bridge The external bridge measurement mode offers you the possibility to use an arbitrarily designed impedance measurement bridge specifically designed for your special purpose. Calibration The external bridge measurement mode requires impedance (open, short, load) calibration. For more details on how to calibrate the an external bridge, please refer to Calibrating an External Coupler or External Bridge measurement on page 86. Measurement information The external bridge measurement mode is similar to the Impedance Adapter measurement mode but allows you to change the channel termination and input attenuators to adjust them according to your needs. Measurement example For a detailed measurement example using the external bridge measurement mode, please check out the High-impedance measurement application note at 74 OMICRON Lab
75 Calibration 8 Calibration This section explains how to compensate unwanted effects of the measurement setup and how to improve the accuracy of your measurement results. Bode 100 offers the following possibilities to calibrate a test setup or the device itself: Factory calibration / adjustment Bode 100 can be adjusted / re-calibrated at OMICRON. For details regarding this factory calibration, please contact the OMICRON Lab support or your local OMICRON Lab contact. Internal device calibration In addition to the external software calibration Bode 100 features an internal device calibration that compensates the device-internal signal path drift by performing internal measurements. External calibration External calibration can be used to compensate e.g. the frequency response of probes, cables or the test setup. Depending on the used measurement mode Bode 100 offers Gain calibration as well as Impedance calibration. Hint: To achieve maximum accuracy, do not change the attenuators after having performed an external calibration. 8.1 Internal device calibration Internal device calibration is required by the system and is automatically performed at the first use of a Bode 100 on a computer. Bode 100 performs an internal path compensation based on stable reference elements in the device. The correction data is evaluated and stored on the PC for future measurements. In the Bode Analyzer Suite the date of the last internal device calibration is shown in the status bar. It is recommended to re-perform the internal device calibration on a regular basis to improve measurement accuracy especially when no external calibration is performed. Furthermore it is necessary to start a new internal device calibration whenever the environmental conditions, such as temperature, change. Manually starting a new internal device calibration To perform a new internal device calibration, move the mouse over the calibration indicator in the status bar. A pop-up with a button appears: Press the button Click here to perform a new internal device calibration and the device will start a new internal calibration. The calibration takes roughly 1 min. During the calibration you cannot perform any measurements with Bode 100. OMICRON Lab 75
76 8.2 Performing a Gain Calibration Gain calibration (also called Thru calibration) is used to remove the gain and phase error introduced by the connections between the measurement instrument and the DUT in a gain or transmission measurement. To achieve maximum accuracy, do not change the attenuators after having performed an external calibration. Hint: Thru calibration can also be used in impedance measurements that are based on a gain measurement. These measurement modes are e.g. Shunt-Thru, Series-Thru or Voltage/ Current. When performing a Thru calibration in such a mode, the underlying gain measurement is calibrated and afterwards the calibrated gain result is transformed to impedance. Performing the calibration In order to calibrate a gain measurement, please proceed as follows: 1. Build up the calibration setup. For details on the calibration setup, please see Calibrating a Transmission (S21) measurement on page 77 or Calibrating a Gain/Phase measurement on page In the Bode Analyzer Suite, click on the Gain calibration icon (either User-Range or Full-Range). To learn more about the difference between User-Range and Full-Range calibration please check Difference between Full-Range and User-Range calibration on page The calibration dialog opens and the calibration state shows Not Performed. 4. Ensure that the calibration setup is connected properly and press Start. 5. Wait until the calibration has completed and the calibration state shows Performed. 6. Close the calibration dialog. 76 OMICRON Lab
77 Calibration 7. The calibration icon now shows a green background fill. This means calibration is activated. 8. You can now connect your DUT and perform a calibrated measurement Calibrating a Transmission (S21) measurement This section shows how to calibrate a Gain, Transmission or S21 measurement performed in the Transmission / Reflection measurement mode. The Transmission / Reflection mode offers the possibility to measure Transmission and Reflection sequentially. Note: The gain or Thru calibration is only applied to the gain measurement. If you want to calibrate the Impedance, Reflection or Admittance measurement, refer to Calibrating a Reflection or One-Port measurement (see page 84). In the Transmission / Reflection measurement mode Channel 1 is not in use by default. Receiver 1 is connected internally to the signal source through the internal reference. The Channel 2 termination is set to 50 Ω, therefore by default the Gain result equals the transmission S-parameter S21 from the OUTPUT port to the CH2 port. If you choose to measure with the External reference connection, please refer to Calibrating a Gain/Phase measurement on page 79. OMICRON Lab 77

78 The following picture shows a typical transmission calibration setup. The DUT is replaced by a Thruconnector. Figure 8-1: Gain, respectively Thru calibration setup in a transmission measurement. The factory calibration of Bode 100 moves the reference plane exactly between two cables of 0.5 m length. So you can measure S21 using the delivered cables having a well calibrated test-setup. 78 OMICRON Lab

79 Calibration Calibrating a Gain/Phase measurement In this section you learn how to calibrate a gain measurement in the Gain/Phase measurement mode. The Gain/Phase measurement mode uses Channel 1 and Channel 2 of Bode 100 to measure the transfer function of a DUT. Channel 1 must be connected to the input of the DUT and Channel 2 to the output of the DUT. The transfer function of the DUT (complex gain) is then measured by dividing the voltage at Channel 2 by the voltage at Channel 1. The cables or probes that connect Channel 1 and Channel 2 to the DUT introduce a gain and phase shift to the measurement signal. The connection introduces a measurement error if the gain and phase shift of the two probes or cables is not identical. A gain respectively Thru calibration removes the gain and phase error that is caused by non-similar probes or connections. The following pictures show a typical gain calibration setup with BNC cables. Both channels are connected to the same signal. Figure 8-2: Thru calibration setup for gain/phase measurement with BNC cables. The following picture shows a typical gain calibration setup using external voltage probes. Both probes must be connected to the same signal during Thru calibration. OMICRON Lab 79

80 Figure 8-3: Thru calibration setup for gain/phase measurement using scope probes. Hint: If you use external scope probes, you can also adjust the probes manually using the compensation screw at the probe tip. To do so, perform a continuous gain/phase sweep over the frequency range of interest and adjust the probe compensation until you receive a flat 0 db and 0 line. Mark the probes with Channel 1 and Channel 2 such that you can re-use the similarly adjusted probes. Hint: When measuring a transfer function directly in a circuit you can always check your calibration by connecting both probes to the same point in the circuit. The result must show 0 db and 0. Please note that this measurement might be influenced by additional noise from the circuit. 80 OMICRON Lab
81 Calibration 8.3 Performing an Impedance Calibration Impedance calibration (also called Open/Short/Load calibration or OSL calibration) can be used to compensate the parasitics of a measurement setup such as an external directional coupler or a measurement bridge. Furthermore it can be used to shift the reference plane of a one-port reflection measurement from the Bode 100 output port to the end of a cable of arbitrary length. This is achieved by measuring known Open, Short and Load elements. To achieve maximum accuracy, do not change the attenuators after having performed an external calibration. Performing a Open/Short/Load calibration In order to perform an Open/Short/Load calibration please proceed as follows: 1. Build up the calibration setup. For details on the correct calibration setup, please check the following chapters. 2. In the Bode Analyzer Suite, click on an Impedance calibration icon (either User-Range or Full- Range). To learn more about the difference between Full-Range and User-Range calibration please see Difference between Full-Range and User-Range calibration on page In the calibration dialog, the calibration state shows Not Performed for all three calibration points. Connect the Open calibrator and press Start. Wait until the Open calibration has completed and the calibration state shows Performed. 4. Connect the Short calibrator and press Start. 5. Connect the Load calibrator and press Start. OMICRON Lab 81

82 6. Close the calibration dialog after Open, Short and Load have been performed. 7. The calibration icon now shows a green background fill. This means that the calibration is active now. You can connect your DUT and perform a calibrated measurement. Advanced Settings in Open/Short/Load calibration The calibration dialog offers an Advanced Settings region that can be unfolded by clicking on the arrow. 82 OMICRON Lab
83 Calibration In the Advanced Settings region you can change the following values: 1. The Load Resistor value represents the value of the resistor used for Load calibration. 2. Short Delay Time is the time delay of the Short element used for Short calibration. The default settings for Load Resistor and Short Delay Time depend on the measurement mode. If you change a value from its default a warning sign will be shown Changing Load Resistor or Short Delay Time will delete the corresponding calibration! OMICRON Lab 83

84 8.3.1 Calibrating a Reflection or One-Port Impedance measurement In this section you learn how to calibrate an Impedance, Reflection or Admittance measurement in the Transmission / Reflection measurement mode or in the One-Port impedance measurement mode. The Transmission / Reflection mode offers the possibility to measure Transmission and Reflection sequentially. Please note that the Impedance (Open/Short/Load) calibration is only applied to a Impedance, Reflection or Admittance measurement. If you want to calibrate a Gain measurement please refer to Calibrating a Transmission (S21) measurement (see page 77). In the Transmission / Reflection measurement mode or in the One-Port impedance measurement mode both receivers are internally connected to the 50 Ω source resistance. Bode 100 is internally calibrated such that it measures the Impedance/Reflection directly at the OUTPUT port of the device. The reference plane is directly at the OUTPUT port (BNC connector). When connecting a DUT with a coaxial cable, the cable introduces additional impedance and timedelay. To compensate these effects, the reference plane can be moved to the end of the cable by performing an Open/Short/Load calibration at the end of the cable. Figure 8-4: Shifting the reference plane by performing Open, Short and Load Calibration 84 OMICRON Lab
. Connect Short and press Start. Wait until the Short calibration has performed.")

85 Calibration To do so, perform Open, Short and Load calibration as shown in the pictures below: Connect Open and press Start. Wait until the Open calibration has performed. Check if your Short element fits to the Short Delay Time Setting (50 ps default). Connect Short and press Start. Wait until the Short calibration has performed. Check if your Load element fits the Load Resistance Setting (50 Ω default). Connect Load and press Start. Wait until the Load calibration has performed. Hint: The load delivered with the Bode 100 is marked with its exact impedance. You can improve the calibration accuracy by entering this value in the Advanced Settings area. The Short Delay Time in the Advanced Settings area has been chosen to match the Short elements delivered with Bode 100. If your short is marked with Rosenberger you can set the Short Delay Time to 40 ps, if it is marked with Radiall to 60 ps. OMICRON Lab 85

86 8.3.2 Calibrating an External Coupler or External Bridge measurement In this section you learn how to calibrate an Impedance, Reflection or Admittance measurement in the External Coupler measurement mode or in the External Bridge impedance measurement mode. In the External Coupler measurement mode and the External Bridge impedance measurement mode both receivers are connected to the input Channel 1 and Channel 2. Therefore all three ports of Bode 100 must be used in these measurement modes. A directional coupler or a resistive measurement bridge is never ideal and therefore introduces errors caused by e.g. the frequency response of the coupler or bridge. By using Open, Short and Load calibration, a Reference plane at the output of the coupler or bridge can be established such that all frequency dependencies of the coupler or bridge are compensated. In the following example we show how to remove an external measurement bridge by performing Open, Short and Load calibration at the measurement port of the bridge. The same method can be applied to a directional coupler having forward and reflected ports. The External Coupler measurement mode as well as the External Bridge measurement mode require an impedance calibration. You cannot start a measurement without having performed Open, Short and Load calibration. Figure 8-5: Removing a coupler / bridge by performing Open, Short and Load Calibration 86 OMICRON Lab

. Connect Short and press Start.")

87 Calibration Connect Open and press Start. Wait until the Open calibration has performed. Check if your Short element fits to the Short Delay Time Setting (50 ps default). Connect Short and press Start. Wait until the Short calibration has performed. Check if your Load element fits the Load Resistance Setting (50 Ω default). Connect Load and press Start. Wait until the Load calibration has performed. OMICRON Lab 87

88 8.3.3 Calibrating an Impedance Adapter measurement In this section you learn how to calibrate an Impedance, Reflection or Admittance measurement in the Impedance Adapter measurement mode. In the External Coupler measurement mode and the External Bridge impedance measurement mode both receivers are connected to the input Channel 1 and Channel 2 at the front panel of Bode 100. The Impedance Adapter measurement mode is designed for component impedance measurements performed with the B-WIC and B-SMC impedance test-fixtures from OMICRON Lab. B-WIC and B-SMC contain a resistive measurement bridge, which is specifically optimized for Bode 100. The Impedance Adapter measurement mode requires impedance calibration. You cannot start a measurement without having Open, Short and Load calibration performed. Figure 8-6: Calibrating the B-WIC impedance test fixture by performing Open, Short and Load Calibration The following pictures show how to perform Open, Short and Load calibration steps for the B-WIC and B-SMC impedance test fixtures. Note that in the Impedance Adapter measurement mode the default value for Load Resistor is 100 Ω and the default value for Short Delay Time is 0 ps. 88 OMICRON Lab
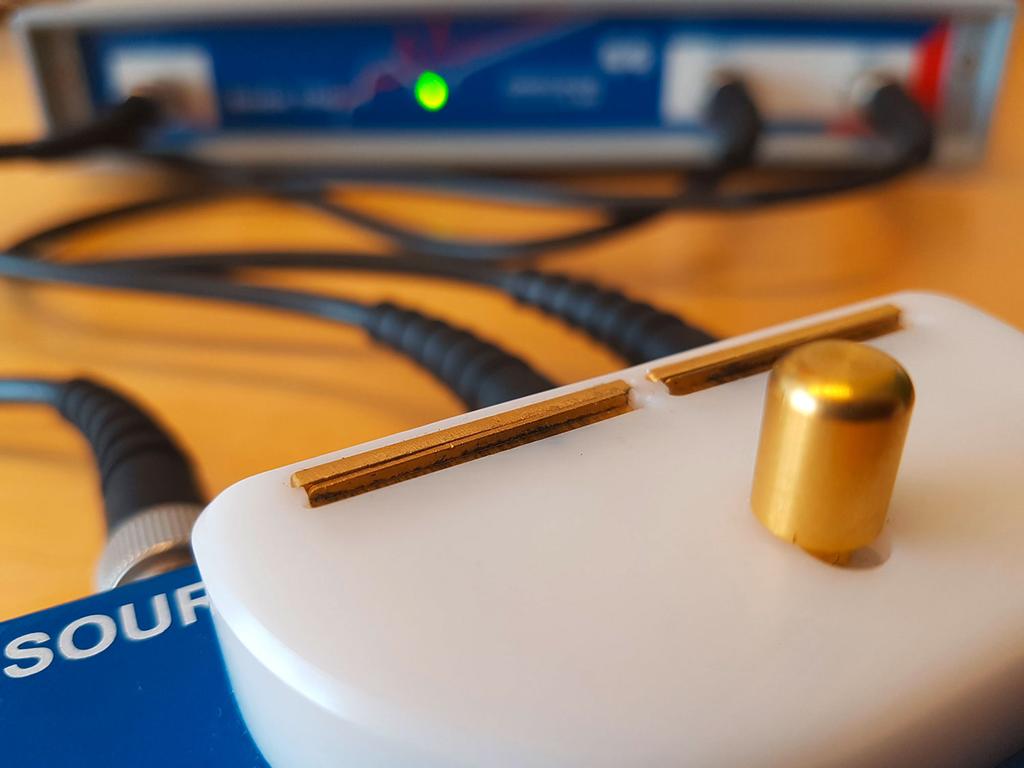
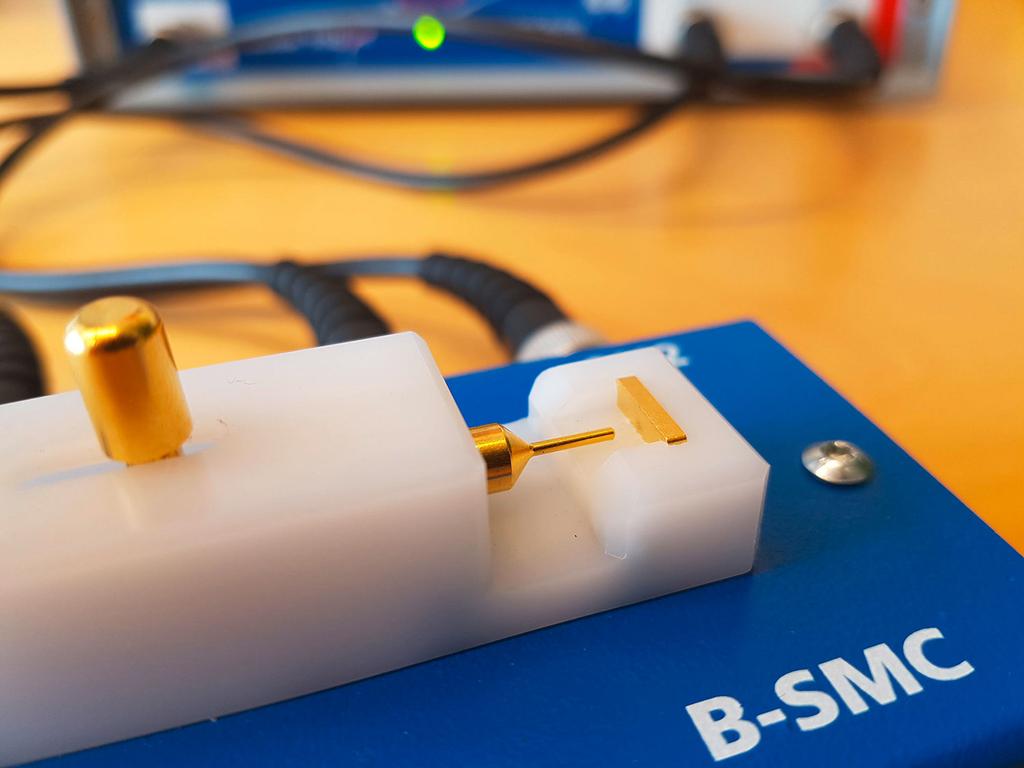
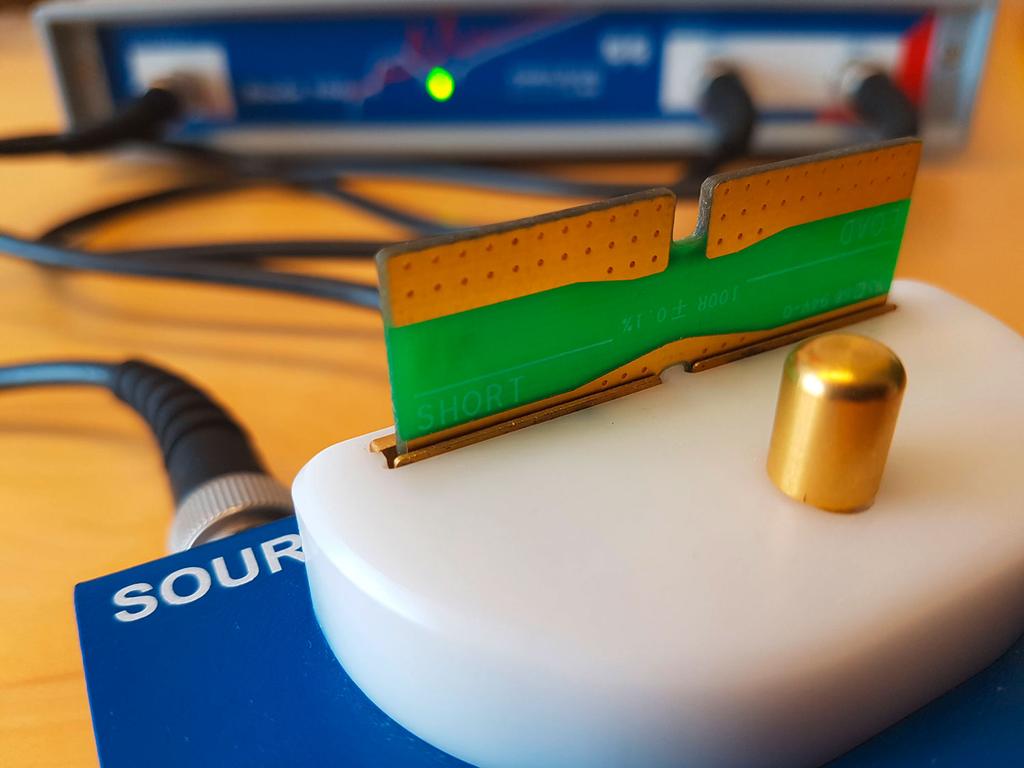
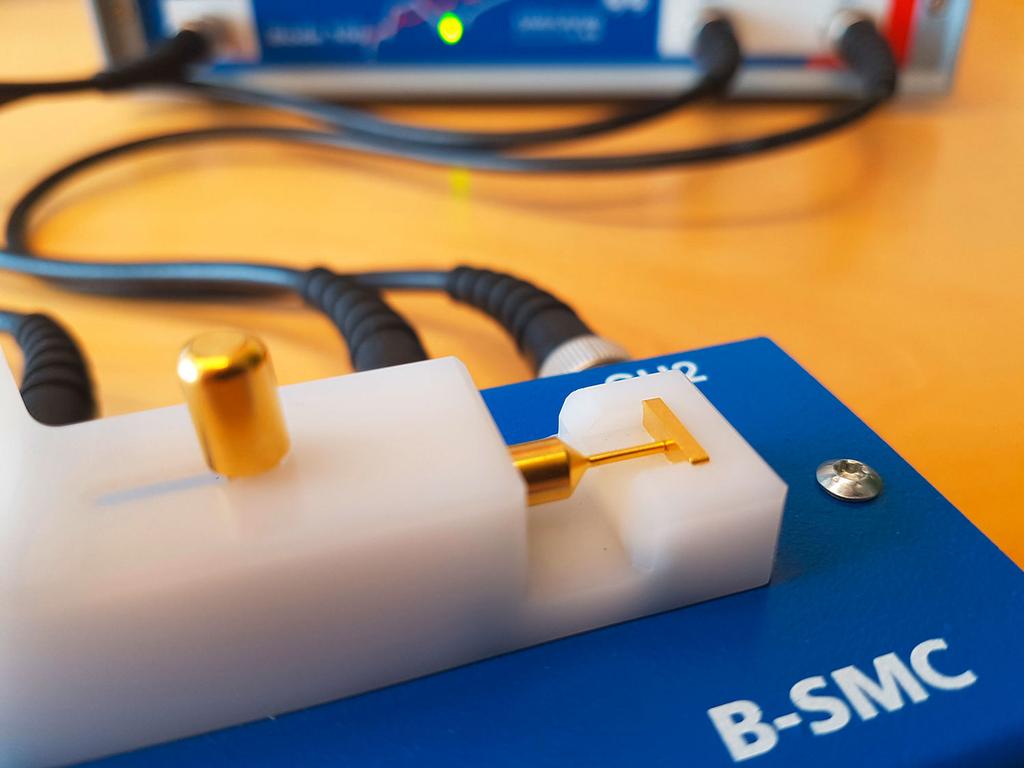
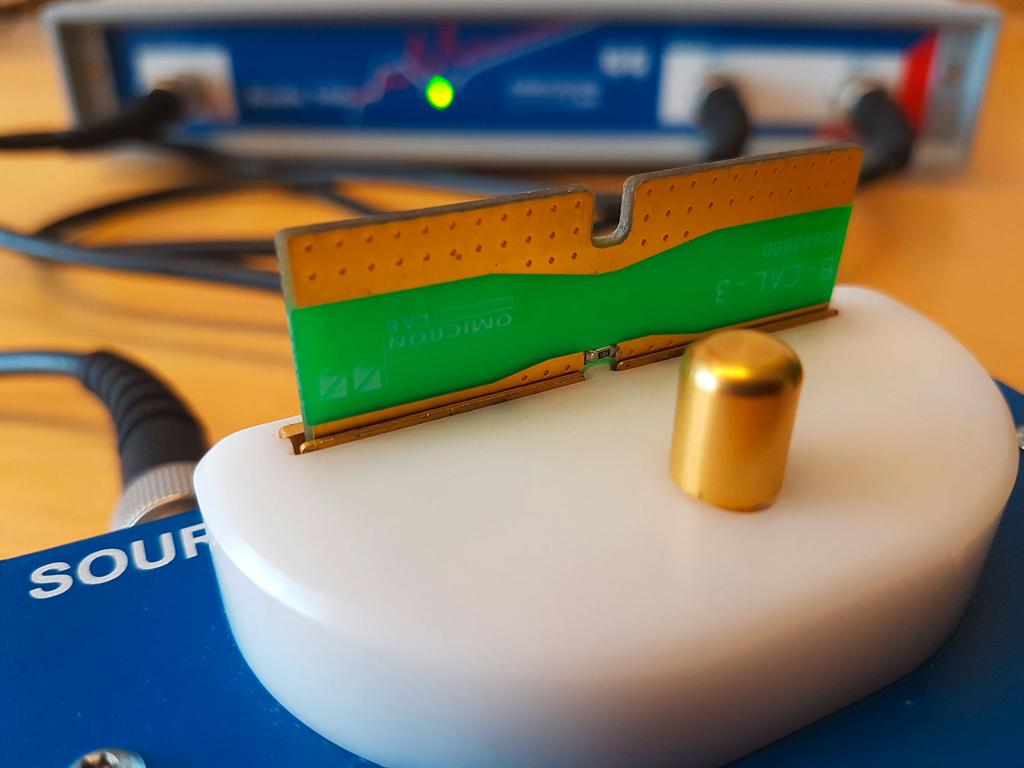
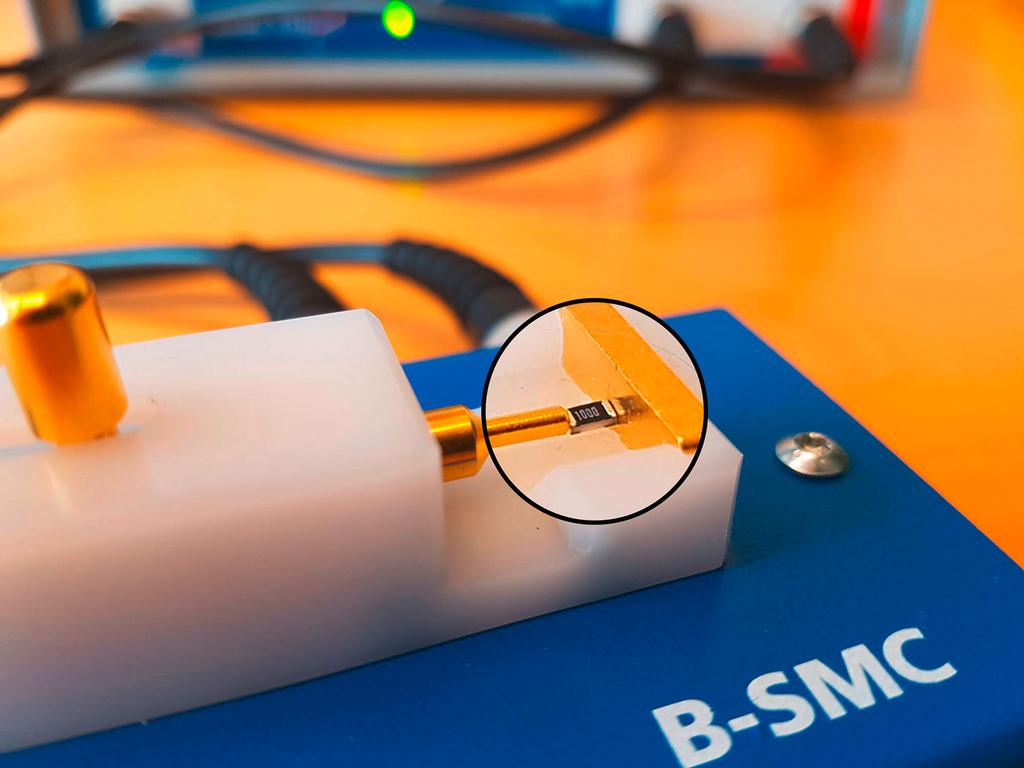
89 Calibration Open (B-WIC) Open (B-SMC) Short (B-WIC) Short (B-SMC) Load (B-WIC) Load (B-SMC) OMICRON Lab 89


90 8.3.4 Calibrating a Shunt-Thru or Series-Thru measurement In this section you learn how to calibrate an Impedance, Reflection or Admittance measurement in the Shunt-Thru or Series-Thru measurement mode. Shunt-Thru and Series-Thru are based on a S21 Transmission measurement. Bode 100 measures S21 and the Bode Analyzer Suite calculates impedance from the S21 measurement. Details on the calculation can be found in Shunt-Thru on page 69 and Series-Thru on page 72. You can either calibrate the underlying S21 measurement using Thru calibration or you can use Open/ Short/Load calibration to move the reference plane directly to the DUT. Shunt-Thru and Series-Thru allow both, Thru or Open/Short/Load calibration. However, only one calibration can be active at a time! Even if both calibrations have been performed only one calibration is applied. You must select the calibration you want to apply using the slider in the calibration dialog. If the arrow points to the left, Thru calibration is applied. If the arrow points to the right, Open/Short/Load calibration is applied (see example below). Shunt-Thru calibration connections Calibrating Thru: Thru calibration can e.g. remove the gain and phase error introduced by the connection cables including a coaxial common mode transformer that is generally used in this measurement to suppress the cable-braid error. Calibrating Open/Short/Load: Open calibration. 90 OMICRON Lab

91 Calibration Short calibration. Note that the inductance of the short connection is assumed to be zero. Short Delay Time is 0 s by default. This means that inductance of the short connection will be subtracted from the measurement result. This might be important to consider when you try measuring several nh of parasitic inductance. Load calibration. Default Load Resistor value is 50 Ω. Series-Thru calibration connections Calibrating Thru: Thru calibration can e.g. remove the gain and phase error introduced by the connection cables. Calibrating Open/Short/Load: Open calibration. Note that the capacitance of the Open is assumed to be zero. If you try to measure very low capacitance, the parasitic capacitance of the Open can introduce an error. Try keeping it as small as possible. Short calibration. Note that the inductance of the short connection is assumed to be zero. Short Delay Time is 0 s by default. OMICRON Lab 91


92 Load calibration. Default Load Resistor value is 50 Ω. For more details and practical examples on how to perform calibration in the Shunt-Thru or Series- Thru measurement mode, please refer to the corresponding application notes on Calibrating a Voltage/Current measurement In this section you learn how to calibrate an Impedance, Reflection or Admittance measurement in the Voltage/Current measurement mode. The Voltage/Current measurement mode is based on an Gain measurement. Bode 100 measures Gain from Channel 1 to Channel 2. Impedance equals Gain if Channel 1 receives a current signal and Channel 2 receives a voltage signal. The Bode Analyzer Suite allows to either calibrate the underlying Gain measurement using Thru calibration or to use Open/Short/Load compensation to move the reference plane directly to the DUT. The Voltage/Current measurement allows both, Thru or Open/Short/Load calibration. However, only one calibration can be active at a time! Even if both calibrations have been performed only one calibration is applied. You must select the calibration you want to apply using the slider in the calibration dialog. If the arrow points to the left, Thru calibration is applied. If the arrow points to the right, Open/Short/Load calibration is applied (see example below). Voltage/Current calibration connections Calibrating Thru: Use a 1 Ω resistor for Thru calibration. 1 Ω results in 1 V/A. Thru calibration can e.g. remove the gain and phase error introduced by the probes. However, it does not correct for systematic measurement errors in the measurement setup such as a voltage drop on the current probe or the current flowing through the voltage probe. These errors cannot be removed by one calibration measurement. In such a case you can use Open/Short/Load calibration to reduce these errors. 92 OMICRON Lab

93 Calibration Calibrating Open/Short/Load: Open calibration. Short calibration. Note that the inductance of the short connection is assumed to be zero. Short Delay Time is 0 s by default. Load calibration. Default Load Resistor value setting is 50 Ω. For more details and practical examples on how to perform calibration in the Voltage/Current measurement mode, please refer to the corresponding application notes on Further calibration information Difference between Full-Range and User-Range calibration Full-Range calibration and User-Range calibration differ only in the frequencies that are used to measure the correction factors. Full-Range calibration measures the correction factors over the "full" frequency range of the instrument at factory-predefined frequencies. User-Range calibration measures the correction factors at exactly the same frequency range and frequency points that are used in the measurement currently configured by the user. OMICRON Lab 93
94 Figure 8-7: User-Range calibration; measurement frequencies and calibration frequencies are congruent. Figure 8-8: Full-Range calibration; correction factors are interpolated at measurement frequencies. If Full-Range calibration is applied, the correction factors are available at the pre-defined frequencies only. Correction factors for the measurement frequencies are calculated by interpolating between the measured points. Full-Range calibration is by default performed from 10 Hz to 50 MHz. If you need to calibrate below 10 Hz, check out Full-Range calibration below 10 Hz on page 96 In a single-frequency measurement the User-Range calibration will contain only one frequency. In a frequency sweep measurement the User-Range calibration contains exactly the same amount of points as the sweep measurement. Advantage of the Full-Range calibration Full-Range calibration allows you to change the measurement frequencies without losing the calibration. Since the correction values are interpolated, they can be interpolated for all frequencies chosen in the measurement. Advantage of the User-Range calibration User-Range calibration does not use interpolation. The correction values are measured at exactly the same frequencies as used in the measurement. This results in highest accuracy especially when using long cables or narrow-band probes that show significant gain/phase shift in the measurement range. User-Range calibration is deleted immediately when the measurement frequencies are changed! 94 OMICRON Lab
95 Calibration Enabling and disabling a calibration After a calibration has been performed, the calibration is automatically activated by the Bode Analyzer Suite. Since a calibration can be manually enabled or disabled, the calibration icons indicate the current state of a calibration. In the following table the calibration states are explained based on the Gain calibration. The same rules apply to impedance calibration: Full-Range Gain calibration is not performed (not available) and not active. The icon has no background fill and no border. Full-Range Gain calibration has been performed and is active. The green border indicates that the calibration is available (has been performed). The green background fill indicates that the calibration is activated. Full-Range Gain calibration is enabled but not active. The green border indicates that the calibration is available (has been performed) and was enabled by the user. Since there is no background fill, the calibration is not active. This can happen if a User-Calibration overrules the Full-Range calibration. Both calibrations have been enabled but the software decides to use the User-Range calibration (see information below). Full-Range Gain calibration is available but not enabled and not active. The gray border indicates that the calibration is available (has been performed) but it is currently not enabled and therefore also not activated. User-Range calibration and Full-Range calibration can be performed and activated at the same time. However, if a valid User-Range calibration has been performed, the Bode Analyzer Suite will automatically choose the User-Range calibration to be active. Example: Both, Full-Range and User-Range Gain calibration have been performed. Therefore both calibration icons have a green border. The software however chooses User-Range calibration to be active. This is indicated by the green fill of the User-Range icon. By clicking on the Full-Range calibration icon, the user could force the Full-Range calibration to be active. OMICRON Lab 95
96 8.4.3 Re-performing a calibration A calibration can be performed by clicking on the corresponding calibration icon in the Home ribbon. Clicking on a calibration icon (e.g. Full-Range Gain calibration ) opens the calibration dialog The calibration measurement can be started by clicking the start button. After the calibration is the calibration dialog can be closed The calibration icon turns green indicating that the calibration is now active. From now on, this calibration is used for the measurement. A calibration can be disabled and enabled by clicking on its calibration icon. To re-performed a calibration, open the calibration dialog by clicking on the arrow on the bottom of the calibration icon. Then select. Calibration can then be re-performed by pressing the Start button Full-Range calibration below 10 Hz Full-Range calibration measures between 10 Hz and 50 MHz at factory pre-defined frequencies. Full- Range calibration normally starts at 10 Hz to reduce calibration time. If you decide that frequencies between 1 Hz and 10 Hz must be included in the Full-Range calibration, you must set the Start Frequency to a value <10 Hz before executing the Full- Range calibration. Alternatively User-Range calibration might be more applicable in that case. Full-Range calibration frequency range: If Start Frequency is set 10 Hz, then Full-Range calibration will run from 10 Hz to 50 MHz If Start Frequency is set <10 Hz, then Full-Range calibration will run from 1 Hz to 50 MHz If a Full-Range calibration has been performed at a Start Frequency >10 Hz and Start Frequency is changed to a value <10 Hz after calibration, the correction value at 10 Hz will be extrapolated to 1 Hz. This is indicated by an orange Full-Range calibration icon. Re-performing calibration will run the calibration from 1 Hz and the icon will turn green again. Note that the calibration takes significantly longer when it starts at 1 Hz. 96 OMICRON Lab
97 Calibration Automatic deletion of calibration In order to avoid false measurements or an invalid calibration, the Bode Analyzer Suite automatically deletes calibration as soon as a setting makes the calibration invalid. The following lists show which settings will delete a calibration when they are changed. Deleting User-Range calibration User-Range calibration is automatically deleted when one of the following settings is changed: Measurement frequencies (Start Frequency, Stop Frequency, Center Frequency, Span) Sweep Mode (Linear or Logarithmic) Number of Points (in the frequency sweep) Channel termination (1 MΩ or 50 Ω) Reference / receiver connection (Internal or External) External probe factor Deleting Full-Range calibration Full-Range calibration is automatically deleted when one of the following settings is changed: Channel termination (1 MΩ or 50 Ω) Reference / receiver connection (Internal or External) External probe factor Saving calibration data User-Range and Full-Range calibration data is saved to the.bode3 file. The calibration data (correction values) as well as the calibration states (activated or not) are stored to the file. When opening a bode-file the Bode Analyzer Suite attempts to load the external calibration data and calibration states from the file. The Bode Analyzer Suite attempts to load the calibration from the bode-file even when the calibration has been performed with a different Bode 100 device. Hardware incompatibilities between Bode 100 R1 and Bode 100 R2 Full-Range calibration from Bode 100 R1 is not compatible to Full-Range calibration of Bode 100 R2. Full-Range calibration will be deleted automatically when opening a bode-file created with a different hardware revision. User-Range calibration is not compatible in the frequency range from 3 khz to 30 khz. A User- Range calibration that contains frequencies in that range will be deleted automatically when opening a bode-file created with a different hardware revision. OMICRON Lab 97
98 9 Bode Analyzer Suite functions The following chapters contain information about important features of the Bode Analyzer Suite. Read through these chapters to learn how to use Bode 100 efficiently. 9.1 Exporting and saving measurement data or settings The Bode Analyzer Suite supports a variety of possibilities to save measurement configurations and measurement data. In the following these are explained in detail Loading and saving the equipment configuration You can store all settings of Bode 100 including the device configuration, measurement settings, calibration and measurement data and the graphical display settings by clicking the Save toolbar button. This functionality allows you to store multiple equipment configurations for repetitive measurement tasks. With the equipment configurations stored, you can load the respective files for each measurement instead of setting the Bode 100 manually. A file saved by the Bode Analyzer Suite 3 has the file extension.bode3. The Bode Analyzer Suite 3 supports loading files with the following file extensions:.bode3 files created with Bode Analyzer Suite 3.bodex files created with Bode Analyzer Suite 2.42 or 2.43.bodz files created with Bode Analyzer Suite 2.41.bode files created with Bode Analyzer Suite 2.41 or older You can save and load.bode3 files on different Bode 100 devices. Note, however, that calibration data might be deleted when opening the.bode3 file with a different hardware revision. More details can be found in Hardware incompatibilities between Bode 100 R1 and Bode 100 R2 on page Use the copy to clipboard functions to export data The Bode Analyzer Suite offers several possibilities to quickly export data via the clipboard. The following information can be copied to the clipboard to ease your documentation work: An image file of the result diagram The measured trace data The equipment settings in form of text Copy a chart image to the clipboard Right-click the chart or diagram you want to copy and select. 98 OMICRON Lab


99 Bode Analyzer Suite functions This will place an image file of the clicked diagram to the Microsoft Windows clipboard that can be pasted to e.g. Microsoft Word. All frequency sweep charts, fixed frequency charts and the shaped level chart can be copied as an image to the clipboard. Hint: You can configure how the chart image looks like by using the Clipboard. Options Font scaling factor: Use this number to increase the font size of axis labels in the copied diagram. Trace thickness factor: Use this number to increase the weight of the trace line in the copied diagram. Image format: Bode Analyzer Suite will use the vector graphics format EMF for the diagram image if possible. In case you experience issues with the EMF files, you can also change the image format to PNG. Include legend: Activate the checkbox to include a legend. This is of advantage when multiple traces are present in the diagram. Include cursor table: Activate the checkbox to include the cursor table in the copied image. In addition you can specify the position of the cursor table in the interactive picture below the checkbox. OMICRON Lab 99
100 Copy trace data to the clipboard Right-click either in the chart or directly on the trace name to copy the measured data to the clipboard. Copied data can directly be pasted in a spreadsheet program for further data processing. Hint: You can configure the decimal separator and the field separator under Clipboard. Options Copy settings to the clipboard Right-click in the chart and select. This will copy a text block to the clipboard that contains the current equipment settings. The text block is similar to the settings header included in the CSV or Excel file export Exporting measurement data to CSV or Excel files If you need to further process the measurement data the Bode Analyzer Suite offers to save the measurement data either as a CSV file or in form of an Microsoft Excel compatible spreadsheet file. To save your measurement data as a.csv or.xlsx file, click on the Export Icon in the Home ribbon. Exporting a CSV file In the CSV export pane you can choose the following options: Include settings header Include active memory traces Include output level Include real & imaginary values Decimal separator Field separator Open file after saving Include a header in the csv file that contains device settings. Note: The height of the header is not constant. Please take care when parsing the csv file automatically. All memories that are currently visible in the Bode Analyzer Suite will be exported to the csv file. Includes the output level as the second column (after frequency) of the csv file. Might be important for shaped level measurements. Real and Imaginary are included independently of the currently chosen display format in the GUI. Choose your decimal separator of choice. Configure the separator between two values / fields. Activate this function to open the exported file with an external program. When activated a text box appears that allows you to choose your program file. Leave the text box empty to use the default Windows program. Press this button to store your settings for future exports. You can find the default settings also in the options dialog accessible in the main window via. Press the Save as button to specify a file name and save your export file. 100 OMICRON Lab
101 Bode Analyzer Suite functions Exporting an Excel file In the Excel export pane you can choose the following options: Include settings header Include active memory traces Include output level Include real & imaginary values Open file after saving Include a header in the csv file that contains device settings. Note: The height of the header is not constant. Please take care when parsing the csv file automatically. All memories that are currently visible in the Bode Analyzer Suite will be exported to the csv file. Includes the output level as the first column of the csv file. Might be important for shaped level measurements. Real and Imaginary are included independently of the currently chosen display format in the GUI. Activate this function to open the exported file with an external program. When activated a text box appears that allows you to choose your program file. Leave the text box empty to use the default windows program. Press this button to store your settings for future exports. You can find the default settings also in the options dialog accessible in the main window via. Press the Save as button to specify a file name and save your export file. OMICRON Lab 101
102 9.1.4 Generating a Touchstone file Bode Analyzer Suite 3.0 offers the possibility to create Touchstone files from the measured data. This offers you the possibility to use measured data directly in simulators that provide Touchstone import. You can find the Touchstone export using the The Touchstone export pane offers the following options: icon in the Home ribbon. Network parameter Number of ports Network data Choose between S, Y and Z parameters. Either 1-Port or 2-Port touchstone file can be created. Select the measurement trace or memory trace data that corresponds to the network parameter. Bode Analyzer Suite does not check if the data is valid. Please take care that you choose the correct measurement for your network parameters. If the frequencies of the traces or memories are not equally spaced, they cannot be selected since Touchstone only allows one frequency column for all network parameters. Network data format Frequency unit Touchstone version Number format Open file after saving MA...Magnitude and Angle (Default) DB...Magnitude in db and Angle RI...Real and imaginary Select Hz, khz, MHz or GHz. Hz is default. Default is Touchstone V2. A Touchstone V2 file can be saved under the extension.ts,.s1p or.s2p depending on the number of ports. The file extension.ts is default. A Touchstone V1 file has either the.s1p or.s2 extension. Choose SixDigitsFixed or SixDigitsScientific Activate this function to open the exported file with an external program. When activated a text box appears that allows you to choose your program file. Leave the text box empty to use the default Windows program. Press this button to store your settings for future exports. You can find the default settings also in the options dialog accessible in the main window via. Press the Save as button to specify a file name and save your export file. 102 OMICRON Lab
103 Bode Analyzer Suite functions Generate a PDF report If you need to print a measurement report or save it as a PDF document, you can use the PDF export. To do so, click the icon in the Home ribbon. The PDF report pane offers the following options: Include legend Include cursor table Include shaped level Include comments Use the CUSTOM template Open file after saving Activates a chart legend in the diagrams. This is of advantage if you have many curves in the diagrams. However it can reduce the diagram size slightly. Activates an additional cursor table in the diagram. Include information about the output level in the report. Includes the text notes from the main window in the report. Note: Only plain text is included in the report. No: Bode Analyzer Suite automatically selects the optimal report template for your measurement. Yes: Bode Analyzer Suite uses the custom template that can be modified. Note: In this case the custom template will be used no matter what type of measurement you perform and how many charts are displayed in the main screen. You can find the custom template file at: %appdata%\omicron Lab\Bode Analyzer Suite \ReportTemplates\template_sweep_custom_1.xlsx Is activated by default. If you don't enter a program path in the text field below, the default Windows program for PDF files will be used to open your saved PDF report. Press this button to store your settings for future exports. You can find the default settings also in the options dialog accessible in the main window via. Press the Save as button to specify a file name and save your report. OMICRON Lab 103
104 9.2 Signal source settings Signal source mode The signal source of Bode 100 can be set two to different operation modes: 1. Auto off (default) 2. Always on In Auto off mode, the source will be automatically turned off whenever it is not used, respectively when a measurement is stopped. In Always on mode the signal source stays on after a measurement has finished. This means that e.g. the last frequency point in a sweep measurement defines the signal source frequency and level. You can change the source mode either in the hardware setup source indicator in the status bar. or by moving the mouse over the The source indicator shows both, the current setting and if the source is on or off. A gray background indicates that the source is switched off. A green background color indicates that the signal source is running. The following states are possible: Output level unit Source mode is Auto off and source is currently off Source mode is Auto off and source is currently on Source mode is Always on and source is on Source mode is Always on but source is still in off-state. Source will be switched on as soon as the next measurement has been executed. Bode 100 by default uses dbm as the output level unit. 1 dbm equals 1 mw at 50 Ω load. You can also choose Vrms or Vpp as output unit however, please don't forget that the real output voltage of Bode 100 depends on the impedance connected to the output. The inner 50 Ω source impedance of Bode 100 introduces a voltage drop that depends on the impedance connected at the output port. The output level unit can be changed in the options. Click on and select the default level unit of your choice:. You can choose Vrms which is the root mean square of the output voltage at 50 Ω load. Again the real output voltage depends on the load you connect to the output. The internal source voltage is 2 times higher than the displayed value. Choose Vpp to display the output voltage in peak-to-peak voltage. Again, the value is valid when a 50 Ω load connected to the output. Changing the level unit only affects new files / measurements that are created after changing the unit. The level unit is part of the settings stored in the.bode3 file. 104 OMICRON Lab

105 Bode Analyzer Suite functions Shaped level The shaped level feature of Bode 100 allows changing the output level over frequency. To use the shaped level feature, click on the slider selector to switch between constant and variable level. After switching to variable, the Output level text field changes its name to Reference level and the Shape level button appears:. Click on the Shape level button to enter the shaped level dialog shown in the figure below: Figure 9-1: Shaped level dialog In the shaped level dialog you can perform the following actions: 1. Interactive shaped level diagram Shows the shaped level curve. Use your mouse to enter new shaped level points by doubleclicking or right-clicking into the diagram. Shaped level points can be moved by drag-and-drop in the diagram. The blue line in the diagram shows the reference level line which allows you to shift the entire shaped level curve up and down. 2. Shaped level points table The table contains all shaped level points. Points added via mouse click into the diagram will show up in the table. You can also use the table to enter new points manually. 3. Reference level The reference level allows you to shift the entire shaped level curve up and down by either entering a different reference level value or by moving the blue reference level line in the diagram. OMICRON Lab 105

106 The output level is calculated by the equation: Output level = Reference level + Delta When changing the reference level it might happen that the calculated Output level is higher than the maximum output level of Bode 100 or lower than the minimum output level of Bode 100. In such a case the level is automatically limited to the device limits. This is indicated by an orange limit line and an orange cell color in the shaped level dialog as shown in the following figure: Figure 9-2: Output level limited to the minimum output level of the device 106 OMICRON Lab

107 Bode Analyzer Suite functions 9.3 Using the interactive chart The interactive chart region of the Bode Analyzer Suite offers many useful functions to analyze measurement results and how to display them in an optimum way. In the following sections the most important features are presented Configure the diagrams A normal diagram with frequency on the x-axis can have up to two y-axes. This allows to display two measurement traces in one diagram as shown in the figure below: Figure 9-3: Two measurement traces in one diagram It is not always possible to display two traces in one diagram. If one of the two traces is set to a Polar, Smith or Nyquist diagram, automatically two diagrams will be displayed. OMICRON Lab 107

108 You can also choose to show the two curves in two separate diagrams. To do so, click on the ribbon and select One axis per chart as shown below. This results in two separate diagrams as shown below. Figure 9-4: Displaying two traces in a separate diagram setting the chart setup to One axis per chart 108 OMICRON Lab

109 Bode Analyzer Suite functions Zooming the measurement curve Zoom into a measurement curve To zoom into an interesting part of your measurement curve, click into the chart and hold the mouse clicked to drag a zoom window from top-left to bottom-right as shown in the following figure: Figure 9-5: Zooming in by click and drag from top-left to bottom right Whenever you have zoomed in the diagram, the axis label shows additional arrows to indicate that a zoom is active. OMICRON Lab 109


110 Zoom out To zoom out, click into the chart and drag from bottom-right to top-left as shown in the figure below: Figure 9-6: Zooming out by click and drag from bottom-right to top-left Alternatively you can right-click into the chart and use the menu of the chart as shown below. function in the context 110 OMICRON Lab
111 Bode Analyzer Suite functions Get from zoom Zooming helps to check an interesting part of a measurement curve. However, zooming into the curve does not increase the number of measured points which can lead to insufficient frequency resolution. To achieve a better frequency resolution you can either increase the number of points in the sweep or press the button. By clicking Get from zoom, the start and stop frequency fields are updated with the maximum and minimum frequency of the current zoom window. After clicking on Get from zoom you can start a new sweep with the full number of points in the current zoom window. The following figure shows the effect in case of a narrow resonance. The green memory trace shows the measurement result before clicking Get from zoom. After clicking Get from zoom, the resonance is captured nicely. After pressing Get from zoom, the zoom is not active anymore and the button is disabled. Figure 9-7: Increasing the frequency resolution in a zoom window using Get from zoom OMICRON Lab 111
112 9.3.3 Optimize the axis scaling Manually configuring the chart axes Every measurement trace of the Bode Analyzer Suite has axis settings. A normal diagram with frequency on the x-axis has two y-axis settings (Ymax and Ymin) as shown below: Figure 9-8: Manually configuring the axis limits via the trace configuration Diagrams such as Polar, Nyquist or Smith have more axis settings to allow to choose the visible range in the diagram. 112 OMICRON Lab
113 Bode Analyzer Suite functions Use Optimize to automatically optimize the axis scaling To automatically optimize the axes of your measurement curve, right-click into the chart and click. After clicking optimize the axis settings are automatically adjusted as shown below: Figure 9-9: Use Optimize to automatically adjust the axis settings OMICRON Lab 113
114 Use Auto-Optimize If you don't want to click every time the measurement curve changes, you can use the function available in the context menu of the chart. When activated, automatically adjusts the axis limits whenever the measurement results change. To display that the Auto Optimize is activated, the Ymax and Ymin text color is changed to green : Each of the following user interactions will deactivate the Auto-Optimize: Zooming in the diagram Clicking Reset Zoom Clicking Optimize Manually adjusting the axis in the trace configuration Using Reset axes Reset axes If you want to reset the chart axes to the default values, right-click into the chart and use. 114 OMICRON Lab

115 Bode Analyzer Suite functions 9.4 Working with cursors and the cursor grid The cursor grid The cursor grid shows the values of two cursors and the delta between the two cursors. The cursor grid offers the following interactive functions: Switch cursors on and off by clicking on the checkbox besides the cursor name. Set the cursor frequency by clicking into the frequency field and manually entering a frequency. Move the cursor to a specific measurement result by entering the desired value in the Trace column. You can also enter a delta value and the second cursor will try to find a frequency where the delta value can be achieved. If an entered value cannot be found, the following information is shown.. If multiple solutions are present (e.g. more than one zero-crossing and you entered 0 into the cursor grid), you can right click into the cursor grid and click the current frequency to right (higher frequency). Changing the cursor line style to search the next solution from You can modify the cursor line style by right-clicking the colored cursor field and using the context menu as shown in the following figure. OMICRON Lab 115

116 Moving cursors via mouse drag You can move the cursors in the chart via the mouse. Simply move the mouse cursor close to the cursor you would like to move until the mouse cursor changes to, then click and drag the cursor to the position you like. Alternatively you can use the left and right arrow keys of your keyboard to move the cursors. Note, this will always move the cursor that was last moved using the mouse. Jump to Max, Min or Zero To find a maximum, minimum or zero crossing of a curve, you can use the functions in the context menu. Right-click a curve in the diagram. Then select e.g. Cursor 1, Jump to Max to position Cursor 1 to the maximum of the clicked curve. Figure 9-10: Use cursor function Jump to Max Hint: Jump to max or min always searches the global max or min in the visible chart region. To find a local max or min, you can zoom into that region and re-perform Jump to Max. 116 OMICRON Lab

117 Bode Analyzer Suite functions 9.5 Using the memory traces The Bode Analyzer Suite offers you the possibility to compare multiple measurements with each other. To copy a current measurement result to a memory trace, use either the button or click the This will lead to a new curve in the diagram as shown in the figure below. icon in the Memory ribbon. Figure 9-11: Using memory curves to see changes in the measurement and to compare different curves OMICRON Lab 117

118 When you use averaging, a second button is available that allows you to copy the averaged value or the measured value to a memory trace. You can use multiple memories to determine the change of your DUT depending on a parameter. The following figure shows an example of how the parallel resonance frequency of the quartz filter changes when touching it. Figure 9-12: Using the memories to compare different measurements 118 OMICRON Lab
119 Bode Analyzer Suite functions Hints: Double-clicking the Memory name allows you to change the name of the memory. When you hover over the memory name on the memory configuration box, the corresponding memory curve will be highlighted in the diagram. The memory configuration box gives you information on when the memory was stored and allows you to control the memory curves. OMICRON Lab 119
120 The following actions can be taken: Click the checkbox next to the name to switch the memory curve on or off. Right-click the green area and use the context menu to change the memory style or color. Rename the memory by double-clicking on its name. Update the memory data with the current measurement data by clicking. Delete the memory trace by clicking on. Attach the cursors to the memory trace by clicking on. Use the Show with check-boxes to decide if the memory data shall be shown only with one trace or on both. Options The following options can be configured in the memory options. Go to the options dialog and select the memory options : Maximum number of memory traces: The maximum number of memory traces is by default limited to 10. If you need more memory curves increase this number. Increasing the number of memory traces might impact your software performance. Especially when you use a high number of points and many memory traces. Confirm the deletion of memory traces: When this checkbox is checked, the software will ask for confirmation when deleting a memory trace. Default memory line pattern: Change the memory line styles according to your preference. Alternating memory trace color mode: Activate this option to color-code the memory curves with the corresponding trace color. With this mode it is easier to distinguish between multiple memories when more than one trace is shown in a diagram. 120 OMICRON Lab

121 Bode Analyzer Suite functions 9.6 Using the trace configuration Please also refer to Trace configuration on page 28. The trace configuration box allows you to configure what Bode 100 measures and how the measurement results are displayed. The Trace configuration box allows you to perform the following settings: Measurement: Configure what measurement the trace performs. Depending on the measurement mode you can select between Gain, Impedance, Reflection and Admittance. Display: Choose if you want to see the measurement result, a math result or only the memory curves. Format: Choose the desired result format how to display the measurement or math result. For more details on the possible result formats, please refer to Gain Result Formats on page 41 and Impedance Result Formats on page 42. Axis limits: Configure the axis limits of the diagrams. Please check out: Optimize the axis scaling on page 112. Y-axis scale: Choose either a linear Y-axis or a logarithmic Y-axis. In addition you can set it to Log( Y ) to avoid the logarithms of negative numbers. Disable or enable the measurement trace by clicking on the check-box besides the trace name. Rename the trace by double-clicking on the trace name. Change the trace style (color, line style, trace markers) by right-clicking on the trace header area. Collapse the configuration box by clicking on the arrow in the header. OMICRON Lab 121

122 Use the trace math To calculate e.g. the difference between two measurements you can use the Display: Math feature of the Bode Analyzer Suite. Changing Display to Math, leads to new fields in the trace configuration box as shown below: You can choose the two operands and the operator. The measurement data as well as memory data is available as operand. The available operators are: +, -, *, /. Notes: The operation is always performed on the complex measurement or memory value. The display format is later on derived from the outcome of the math result. Please note that a division equals a subtraction in logarithmic domain. So if you choose Measurement / Memory 1, in the Magnitude(dB) plot you will see the difference between Measurement and Memory 1 in db. A multiplication equals an summation in logarithmic domain. So if you choose Measurement * Memory 1, in the Magnitude(dB) plot you will see the sum of Measurement and Memory 1 in db. If the frequency points of the two operands don't match, an info icon will be shown in the trace header. Either linear interpolation will be used to find the needed operand values or the values will be skipped. 122 OMICRON Lab

123 Bode Analyzer Suite functions 9.7 Cursor calculations Bode Analyzer Suite allows you to perform the following extended calculations based on cursors: Non-Invasive Stability Measurement based on output impedance Resonance-Frequency and Q measurement based on a resonance peak Non-Invasive Stability Measurement Non-Invasive-Stability-Measurement (NISM) is a method to determine the phase margin of a voltage regulator via the closed-loop output impedance. The advantage of this method is that only the output of the power supply needs to be accessed and no control loop needs to be broken. Bode Analyzer Suite offers the following two NISM calculations: 1. Basic phase margin calculation (one-cursor) 2. Advanced phase margin calculation (two-cursors) NISM is based on the fact that the phase response is very sensitive to the quality factor of a resonator. Assuming a second-order closed loop feedback system, the quality factor of the output impedance resonance peak is directly related to the phase margin of the control loop according to equation (9.25) in "Fundamentals of Power Electronics" by Robert W. Erickson and Dragan Maksimovic. Basic phase margin calculation (one-cursor) To measure the phase margin of a voltage regulator, you first need to measure the output impedance over frequency. Then go to the cursor ribbon and select the Basic phase margin calculation method as shown below: As a next step, follow the instruction in the GUI and place Cursor 1 to the peak in the Q(Tg) result. The phase margin calculation method shows the phase margin result in the cursor ribbon as shown in the following figure: OMICRON Lab 123
 The advanced phase margin calculation uses a proprietary method developed by Steven Sandler (Picotest.com).")
124 Figure 9-13: Basic phase margin calculation on output impedance of a linear regulator The result shows a phase margin of nearly 37 (yellow) after placing cursor 1 to the peak in Q(Tg). Advanced phase margin calculation (two cursors) The advanced phase margin calculation uses a proprietary method developed by Steven Sandler (Picotest.com). The advantage of the advanced phase margin measurement method is that it includes the output filter damping factor and therefore generates more accurate results for highly damped systems. If you measure output impedance of a regulator with low Q respectively high phase margin, the peak of Q(Tg) and the peak in impedance are not at the same frequency anymore. The higher the phase margin, the higher the distance between the impedance peak and the Q(Tg) peak. The advanced phase margin calculation uses two cursors that need to be placed on both peaks in order to give a more accurate result for high phase margin values. To do so, select Advanced Phase margin calculation and place Cursor 1 at the peak in the Q(Tg) curve and Cursor 2 at the peak of the impedance magnitude curve. To learn more about the non-invasive-stability measurement, please refer to the corresponding application note available at OMICRON Lab
 and quality factor (Q) of RFID and NFC transponders Bode Analyzer Suite includes the Fres-Q cursor")

125 Bode Analyzer Suite functions Fres-Q Calculation For a fast and easy contactless measurement of the resonance frequency (Fres) and quality factor (Q) of RFID and NFC transponders Bode Analyzer Suite includes the Fres-Q cursor calculation. By automatically placing three cursors to the resonance peak, Bode Analyzer Suite automatically calculates the resonance frequency and quality factor based on the shape of the resonance curve. Fres-Q calculation works as follows: Cursor 2 is placed to the maximum y-value the curve which must correspond to the resonance peak. Cursor 1 is placed to half the y-value at a lower frequency. Cursor 3 is placed to half the y-value at higher frequency. The Cursor 2 frequency then equals the resonance frequency f res. The distance between Cursor 1 and Cursor 3 equals the bandwidth B. The quality factor Q is then calculated by: To measure the resonance frequency and Q-factor of a resonance curve, go to the cursor ribbon and select the Fres-Q calculation method as shown below: As a next step, select the format and trace you want to use for the cursor calculation from the ribbon interface as shown in the example below: In this example we want to calculate the resonance frequency and Q-factor based on the Real part of the values in Trace 1. As an alternative also the Magnitude can be used. If multiple traces contain values or if a memory is linked to the cursor table, then the calculation can also be applied to these curves. OMICRON Lab 125

126 To start the calculation, click either on the button or activate the checkbox. Track peak will automatically evaluate the calculation and search the peak after each completed sweep. As a result you should see the three cursor positioned correctly at the resonance curve and the result in the cursor bar: Figure 9-14: Contactless resonance frequency and q-factor measurement of a 125 khz RFID tag The result in this example indicates a resonance frequency of khz and a Q-factor of To learn more about contactless resonance frequency and Q-factor measurements of RFID transponders, please refer to the corresponding application note available at OMICRON Lab
127 Bode Analyzer Suite functions 9.8 Averaging Bode Analyzer Suite offers averaging to reduce measurement noise. Averaging can be activated by clicking on the Average measurement icon in the View ribbon. When averaging is active, the icon turns green. The average factor influences the averaging method. A higher average factor offers a higher noise reduction but requires more sweeps to complete. The following figure shows an example where a Gain measurement is averaged (Green icon) and 4 sweeps have already been completed. The average factor is set to 10. Six more sweeps should be completed to achieve the full noise reduction in this case. You can increase or decrease the average factor during averaging without losing previous measurements. The following equation shows the implemented averaging algorithm: The new averaged result is calculated using the new measured value and the previous averaged result. N is the average factor that must be 2. The influence of an old measurement will become lower and lower but will never completely disappear (exponentially decaying moving average). If your measurement result has changed, you can use Reset averaging averaging and remove the influence of previous measurement results. to restart the Averaging is performed sweep to sweep. This means that at least 2 sweeps are necessary to calculate an averaged result. Averaging is calculated using the complex measurement result. Memory traces Whenever you activate averaging, two memory buttons are available to copy data to the memory traces. Measurement new memory will copy the measured result to a new memory trace. Average new memory will copy the averaged result to a new memory trace. OMICRON Lab 127
128 9.9 Using probes You can use any probe with Bode 100 that offers a standard BNC connector. The use of probes can have the following advantages: Reduction of the capacitive loading added by connecting Bode 100 to your circuit. Easier probing possibilities when no BNC connectors are available on the DUT. Protection of Bode 100 from hazardous voltages if safety isolation probes are used. WARNING Check safety instructions before measuring circuits connected to or producing hazardous voltages >50 VDC or >25 VAC. NOTICE Bode 100 inputs are AC coupled with a maximum allowed DC voltage of 50 VDC. A standard, passive, 10:1 probe with 9 MΩ tip-resistor cannot be used to connect Bode 100 to higher DC voltages! The DC-voltage will not be divided by 10 can destroy the AC coupling capacitor and damage the input circuitry! 1 MΩ 10:1 probes are recommended. 1 MΩ probes feature a divider in the probe that lowers DC voltage as well. Furthermore 1 MΩ probes provide a lower impedance path that reduces channel-channel crosstalk and noise. If a probe has a different probe factor than 1:1, you can configure the probe factor in the hardware setup dialog for each channel separately. To do so, enter the hardware setup dialog by clicking on the hardware setup icon in the home ribbon. The following figure shows the hardware setup dialog for a Gain / Phase measurement where two external probes (Probe 1 and Probe 2) can be configured. 128 OMICRON Lab


129 Bode Analyzer Suite functions Figure 9-15: Probe configuration in the hardware setup dialog To configure the probe factor, you can use the combo-box. Click on the arrow and select one of the pre-defined probe factors: Alternatively you can enter an arbitrary probe factor by marking the text and entering your probe ratio as shown in the examples below: OMICRON Lab 129
130 The probe factor is directly influencing the measurement result. However, as soon as you perform a User-Range calibration or a Full-Range calibration, the probe factor has no direct effect on the measurement result anymore. An external calibration compensates the gain and phase response of the probes and therefore overrules the probe factor setting. 130 OMICRON Lab
131 Bode Analyzer Suite functions 9.10 Unwrapped phase The Phase shift between two sine-waves can only be measured between -180 and +180 respectively -π and +π in radians. If the phase shift of a DUT exceeds -180 or +180, this fact causes a strange-looking phase jump in the diagram. The following figure shows the Gain and Phase curve of the IF filter DUT delivered with Bode 100: Figure 9-16: Phase-wrap effect caused by the fact that phase can only be measured between -180 and +180 OMICRON Lab 131

132 In some applications, such as the measurement of the total phase shift of a filter, it is useful to continuously display the phase. To do so, activate the Unwrap phase function by clicking the Unwrap phase checkbox in the Trace configuration box display as shown below:. This leads to an continuos phase Figure 9-17: Unwrapped phase result shows the total phase shift of the IF filter DUT Hint: Optionally you can limit the unwrapping to a specific frequency range. Use the Begin and End check boxes and corresponding entry fields to define a frequency range in that the phase shall be unwrapped. This is especially useful when the phase result contains a lot of noise in a specific frequency range. 132 OMICRON Lab

133 Bode Analyzer Suite functions 9.11 Check for updates In order to check if your Bode Analyzer Suite is up to date, click on the info icon. This will enter the info pane and check for available updates. If your version is up to date, this will be indicated as shown below: If a newer version is available, the Bode Analyzer Suite will inform you by showing an information screen. OMICRON Lab 133
134 10 Automation interface Besides the Bode Analyzer Suite, Bode 100 can also be controlled via the Automation Interface, a software command interface. The Automation Interface can either be accessed via the COM interface or directly from.net. Furthermore, a LabVIEW instrument driver is available to control Bode 100. Automation Interface (COM) Bode 100 features an Automation Interface or API (Application Programmer Interface) that allows to control Bode 100 from many programming languages and applications such as C#,.NET, Python, Matlab, Excel,... The Automation Interface 3.00 or newer offers most of the possibilities offered by the Bode Analyzer Suite The most important features of the Automation Interface are: COM Interface accessible from any COM supporting programming language Ability to measure with more than one Bode 100 device on a single PC Fast repetitive measurements including sweep and single point measurements Pre-configured measurement modes similar to Bode Analyzer Suite Supports events to program real-time applications Fully compatible with 32 bit and 64 bit Windows systems NuGet package If you are a.net developer, you might be interested in using the Automation Interface in form of the NuGet package OmicronLab.VectorNetworkAnalysis.AutomationInterface. LabVIEW Instrument Driver In addition to the COM based Automation Interface a LabVIEW instrument driver is available for the Bode 100. Please use the latest driver 3.00 or higher. In any case the installation of the Bode Analyzer Suite or the Bode Automation Interface is required! The installation will install the USB driver that is needed to access Bode 100. For more information regarding automating the Bode 100, check out our web page: or have a look at the Automation Interface reference available online at: OMICRON Lab
135 Troubleshooting 11 Troubleshooting Connection issues In case you are not able to start a measurement with Bode 100, please check the following points: 1. Check if the green power LED at the front panel is on. In case that the LED is not lit execute the following steps: a. Check if the Wide-range AC power supply is plugged correctly into the mains socket. b. Check if the DC connector of the power supply is properly plugged into the Bode 100. c. Check the output voltage of the DC connector with a volt-meter. 2. Check if the communication between the Bode Analyzer Suite and the Bode 100 has been successfully established. To do so, check if the serial number of your Bode 100 is displayed in the start screen (see figure6-1 on page 23, or the right bottom corner of the main window (see figure6-2 on page 24). In case you cannot see any Bode 100 serial number, please execute the steps below: a. Check if the USB cable is properly plugged into the computer and the Bode 100. b. Try disconnecting and re-connecting the USB cable. c. If this does not help, avoid USB hubs and plug Bode 100 directly into an USB port of your computer. d. Try to connect Bode 100 to a different USB port of your computer. Some USB 3 ports are known to have problems with Revision 1 of Bode 100. e. Move the mouse over the icon in the status bar and then click. Software problems In case you run into software issues such as crashes or unexpected behavior, please contact the OMICRON Lab Support. To help the support team, you can include the log file of the Bode Analyzer Suite in your support request. The log file is normally located at: C:\ProgramData\OMICRON Lab\Bode Analyzer\Logs\Bode Analyzer Suite.log. In case you are still experiencing problems do not hesitate to contact us. We are looking forward to support you. Check out the following Support section for further information on how to contact us. OMICRON Lab 135

136 Support When you are working with our products we want to provide you with the greatest possible benefits. If you need any support, we are here to assist you! Technical Support - Get Support support@omicron-lab.com At our technical support hotline, you can reach well-educated technicians for all of your questions. Competent and free of charge. Make use of our technical support hotlines: Americas: Asia-Pacific: Europe / Middle East / Africa: or OMICRON Additionally, you can find the OMICRON Lab Service Center or Sales Partner closest to you at Contact. OMICRON Lab OMICRON electronics GmbH, Oberes Ried 1, 6833 Klaus, Austria OMICRON Lab
Bode 100. User Manual. Smart Measurement Solutions
 Bode 100 User Manual Smart Measurement Solutions Version: ENU1006 05 04 Year: 2018 OMICRON Lab, OMICRON electronics. All rights reserved. This manual is a publication of OMICRON electronics. All rights
Smart Measurement Solutions. Bode 100. User Manual
 Smart Measurement Solutions Bode 100 User Manual Bode 100 User Manual Bode 100 User Manual Article Number VESD0661 - Manual Version: Bode100.AE.4 OMICRON Lab 2010. All rights reserved. This User Manual
Bode 100. User Manual
 Bode 100 User Manual Bode 100 User Manual Article Number VESD0661 - Manual Version: Bode100.AE.3 OMICRON Lab 2008. All rights reserved. This User Manual is a publication of OMICRON electronics GmbH. This
Equivalent Circuit Determination of Quartz Crystals
 Page 1 of 11 Equivalent Circuit Determination of Quartz Crystals By Stephan Synkule & Florian Hämmerle 2010 Omicron Lab V1.1 Visit www.omicron-lab.com for more information. Contact support@omicron-lab.com
Measure Low Value Impedance Current Shunt Impedance
 Measure Low Value Impedance Current Shunt Impedance By Florian Hämmerle 2017 Omicron Lab V2.0 Visit www.omicron-lab.com for more information. Contact support@omicron-lab.com for technical support. Page
Equivalent Circuit Determination of Quartz Crystals
 Equivalent Circuit Determination of Quartz Crystals By Stephan Synkule & Florian Hämmerle 2017 by OMICRON Lab V2.1 Visit www.omicron-lab.com for more information. Contact support@omicron-lab.com for technical
Low Value Impedance Measurement using the Voltage / Current Method
 Low Value Impedance Measurement using the Voltage / Current Method By Florian Hämmerle & Tobias Schuster 2017 Omicron Lab V2.2 Visit www.omicron-lab.com for more information. Contact support@omicron-lab.com
DC/DC Converter Stability Measurement
 Strongly supported by By Stephan Synkule, Lukas Heinzle & Florian Hämmerle 2018 by OMICRON Lab V3.3 Visit www.omicron-lab.com for more information. Contact support@omicron-lab.com for technical support.
Measurement of the equivalent circuit of quartz crystals
 Measurement of the equivalent circuit of quartz crystals This application note shows how to measure the equivalent circuit of a quartz crystal with Bode 100. A.) Basics: An equivalent describtion of a
Instruction Manual Model Upconverter
 Instruction Manual Model 2006-01 Upconverter October 2013, Rev. B IF IN RF OUT Data, drawings, and other material contained herein are proprietary to Cross Technologies, Inc., but may be reproduced or
Instruction Manual Model Upconverter
 Instruction Manual Model 2006-02 Upconverter October 2013, Rev. B IF IN RF OUT Data, drawings, and other material contained herein are proprietary to Cross Technologies, Inc., but may be reproduced or
Measuring Impedance with the Bode 100. OMICRON Lab Webinar Nov. 2014
 Measuring Impedance with the Bode 100 OMICRON Lab Webinar Nov. 2014 Let s start with a question Why do the presenters wear moustaches? http://moteam.co/omimobros Page 4 Agenda Direct Impedance measurement
DC/DC Converter Stability Measurement
 Bode 1 - Application Note Page 1 of 15 DC/DC Converter Stability Measurement Strongly supported by By Stephan Synkule, Lukas Heinzle & Florian Hämmerle 213 Omicron Lab V2. Visit www.omicron-lab.com for
Making Invasive and Non-Invasive Stability Measurements
 Making Invasive and Non-Invasive s Using the Bode 1 and the PICOTEST J2111A Current Injector By Florian Hämmerle & Steve Sandler 21 Picotest.com Visit www.picotest.com for more information. Contact support@picotest.com
Invasive and Non-Invasive Stability Measurements
 Bode 1 - Application Note Page 1 of 22 Invasive and Non-Invasive Stability Measurements Using the Bode 1 and the Picotest J2111A Current Injector By Florian Hämmerle & Steve Sandler 211 Omicron Lab V1.1
Compact Series: S5065 & S5085 Vector Network Analyzers KEY FEATURES
 Compact Series: S5065 & S5085 Vector Network Analyzers KEY FEATURES Frequency range: 9 khz - 6.5 or 8.5 GHz Measured parameters: S11, S12, S21, S22 Wide output power adjustment range: -50 dbm to +5 dbm
RMO500 M I C R O O H M M E T E R
 M I C R O O H M M E T E R Reference Manual IBEKO POWER AB Sweden 2 IBEKO POWER AB Manual Version:. MV.01 IBEKO POWER AB 2003 This Reference Manual is a publication of IBEKO POWER AB, 18 125 Lidingö, Sweden.
Measuring Power Line Impedance
 By Florian Hämmerle & Tobias Schuster 2017 by OMICRON Lab V1.1 Visit www.omicron-lab.com for more information. Contact support@omicron-lab.com for technical support. Page 2 of 13 Table of Contents 1 MEASUREMENT
DC/DC Converter Stability Measurement
 Strongly supported by By Stephan Synkule, Lukas Heinzle & Florian Hämmerle 214 by OMICRON Lab V2.1 Visit www.omicron-lab.com for more information. Contact support@omicron-lab.com for technical support.
Impedance 50 (75 connectors via adapters)
") VECTOR NETWORK ANALYZER PLANAR 304/1 DATA SHEET Frequency range: 300 khz to 3.2 GHz Measured parameters: S11, S21, S12, S22 Dynamic range of transmission measurement magnitude: 135 db Measurement time
VECTOR NETWORK ANALYZER PLANAR 304/1 DATA SHEET Frequency range: 300 khz to 3.2 GHz Measured parameters: S11, S21, S12, S22 Dynamic range of transmission measurement magnitude: 135 db Measurement time
Contactless RFID Tag Measurements
 By Florian Hämmerle & Martin Bitschnau 2017 by OMICRON Lab V3.1 Visit www.omicron-lab.com for more information. Contact support@omicron-lab.com for technical support. Page 2 of 13 Table of Contents 1 Executive
Power Supply Rejection Ratio Measurement
 Power Supply Rejection Ratio Measurement Using the Bode 100 and the Picotest J2120A Line Injector www.telesplicing.com.tw +886-2-27053146 sales@telesplicing.com.tw Page 2 of 10 Table of Contents 1 EXECUTIVE
Antenna Splitter ASA 1. Instruction manual
 Antenna Splitter ASA 1 Instruction manual Contents Contents Important safety instructions... 2 The ASA 1 active antenna splitter... 4 Combination possibilities of ASA 1/ASA 1-1G8... 5 Delivery includes...
MPR kHz Reader
 MPR-5005 Page 1 Doc# 041326 MPR-5005 125kHz Reader Installation & Operation Manual - 041326 MPR-5005 Page 2 Doc# 041326 COPYRIGHT ACKNOWLEDGEMENTS The contents of this document are the property of Applied
Digital Function Generator
 Digital Function Generator 13654-99 PHYWE Systeme GmbH & Co. KG Robert-Bosch-Breite 10 37079 Göttingen Germany Tel. +49 (0) 551 604-0 Fax +49 (0) 551 604-107 E-mail info@phywe.de Operating Instructions
Input Impedance Measurements for Stable Input-Filter Design
 for Stable Input-Filter Design 1000 Converter Input Impedance 100 10 1 0,1 Filter Output Impedance 0,01 10 100 1000 10000 100000 By Florian Hämmerle 2017 by OMICRON Lab V1.0 Visit www.omicron-lab.com for
PLANAR 814/1. Vector Network Analyzer
 PLANAR 814/1 Vector Network Analyzer Frequency range: 100 khz 8 GHz Measured parameters: S11, S12, S21, S22 Wide output power range: -60 dbm to +10 dbm >150 db dynamic range (1 Hz IF bandwidth) Direct
Migrating 4195A to E5061B LF-RF Network Analyzer. April 2010 Agilent Technologies
 Migrating 4195A to E61B LF-RF Network Analyzer April 2010 Agilent Technologies Page 1 Contents Overview of 4195A to E61B migration Migrating 4195A to E61B in network measurements Migrating 4195A to E61B
PLANAR R54. Vector Reflectometer KEY FEATURES
 PLANAR R54 Vector Reflectometer KEY FEATURES Frequency range: 85 MHz 5.4 GHz Reflection coefficient magnitude and phase, cable loss, DTF Transmission coefficient magnitude when using two reflectometers
SMART TWEEZERS Model ST-1 User s Manual Version 1.0
 SMART TWEEZERS Model ST-1 User s Manual Version 1.0 Patent Pending TABLE OF CONTENTS Notice The contents of this document is believed to be accurate, but is not guaranteed by Excelta Corporation. The information
Power Supply Rejection Ratio Measurement
 Power Supply Rejection Ratio Measurement Using the Bode 100 and the Picotest J2120A Line Injector By Florian Hämmerle & Steve Sandler 2017 by OMICRON Lab V2.0 Visit www.omicron-lab.com for more information.
Audio Amplifier Frequency Response
 By Tobias Schuster 2017 by OMICRON Lab V2.0 Visit www.omicron-lab.com for more information. Contact support@omicron-lab.com for technical support. Page 2 of 20 Table of Contents 1 EXECUTIVE SUMMARY...
P603-1 / P750 set. RF conducted measurement IEC
 User manual Probe set set RF conducted measurement IEC 61967-4 Copyright July 2016 LANGER GmbH 2016.07.28 User manual P603-1+P750 GM CS Kö.doc Table of contents: Page 1 General description 3 2 P603-1 probe
3M Model 1230 Disk Media Unlocker. Owner's Manual
 3M Model 1230 Disk Media Unlocker Owner's Manual 3M, 2013. All rights reserved. 3M Model 1230 Disk Media Unlocker Owner's Manual, 3M is a trademark of 3M. All other trademarks are property of their respective
Transformer modelling
 By Martin Bitschnau 2017 by OMICRON Lab V2.0 Visit www.omicron-lab.com for more information. Contact support@omicron-lab.com for technical support. Page 2 of 21 Table of Contents 1 EXECUTIVE SUMMARY...
EXPERIMENT NUMBER 10 TRANSIENT ANALYSIS USING PSPICE
 EXPERIMENT NUMBER 10 TRANSIENT ANALYSIS USING PSPICE Objective: To learn to use a circuit simulator package for plotting the response of a circuit in the time domain. Preliminary: Revise laboratory 8 to
Compact Series: S5048 & TR5048 Vector Network Analyzers KEY FEATURES
 Compact Series: S5048 & TR5048 Vector Network Analyzers KEY FEATURES Frequency range: 20 khz - 4.8 GHz Measured parameters: S11, S12, S21, S22 (S5048) S11, S21 (TR5048) Wide output power adjustment range:
Lab 3: AC Low pass filters (version 1.3)
") Lab 3: AC Low pass filters (version 1.3) WARNING: Use electrical test equipment with care! Always double-check connections before applying power. Look for short circuits, which can quickly destroy expensive
Lab 3: AC Low pass filters (version 1.3) WARNING: Use electrical test equipment with care! Always double-check connections before applying power. Look for short circuits, which can quickly destroy expensive
AC 3. Active Antenna Combiner. Instruction manual
 AC 3 Active Antenna Combiner Instruction manual Contents Contents Important safety instructions... 2 The AC 3 active transmitter combiner... 4 Delivery includes... 4 Operating controls... 5 Block diagram...
TETRIS 1000 High Impedance Active Probe. Instruction Manual
 TETRIS 1000 High Impedance Active Probe Instruction Manual Copyright 2015 PMK GmbH All rights reserved. Information in this publication supersedes that in all previously published material. Specifications
Reflectometer Series:
 Reflectometer Series: R54, R60 & R140 Vector Network Analyzers Clarke & Severn Electronics Ph +612 9482 1944 Email sales@clarke.com.au BUY NOW - www.cseonline.com.au KEY FEATURES Patent: US 9,291,657 No
Solar Cell Impedance Measurement using the Bode 100
 Page 1 of 9 Measurement using the Bode 100 By Florian Hämmerle 2011 Omicron Lab V1.0 Visit www.omicron-lab.com for more information. Contact support@omicron-lab.com for technical support. Page 2 of 9 Table
SAFETY WARNINGS AND GUIDELINES INTRODUCTION
 SAFETY WARNINGS AND GUIDELINES Turn off and unplug all equipment prior to making electrical connections, including speaker wire connections. Reduce the volume level prior to making any change to the audio
USER MANUAL 600A AC Clamp Meter + NCV Model MA610
 USER MANUAL 600A AC Clamp Meter + NCV Model MA610 Additional User Manual Translations available at www.extech.com Introduction Thank you for selecting the Extech MA610 Clamp Meter. This meter measures
FinishLynx Interface. Includes: Power requirements: 9 VDC Power Adapter (included) Size: Approximately 5 x 3 x 2 Approximate weight: 5.57oz.
 Size: Approximately 5 x 3 x 2 Approximate weight: 5.57oz.") FinishLynx Interface Includes: FinishLynx Wired Interface Or 1 ea. FinishLynx Wireless Interface & MPCX Receiver FinishLynx CAPTION PLATE SET w/layout Diagram Power requirements: 9 VDC Power Adapter (included)
FinishLynx Interface Includes: FinishLynx Wired Interface Or 1 ea. FinishLynx Wireless Interface & MPCX Receiver FinishLynx CAPTION PLATE SET w/layout Diagram Power requirements: 9 VDC Power Adapter (included)
PLANAR S5048 and TR5048
 PLANAR S5048 and TR5048 Vector Network Analyzers KEY FEATURES Frequency range: 20 khz 4.8 GHz COM/DCOM compatible for LabView Measured parameters: and automation programming S11, S12, S21, S22 (S5048)
NI PXIe-5630 Specifications
 NI PXIe-5630 Specifications RF Vector Network Analyzer This document lists specifications for the NI PXIe-5630 RF vector network analyzer (NI 5630). Specifications are warranted under the following conditions:
500 khz / 1 MHz Precision LCR Meter Models 894 & 895
 Data Sheet 500 khz / 1 MHz Precision LCR Meter 99 Washington Street Melrose, MA 02176 Phone 781-665-1400 Toll Free 1-800-517-8431 Visit us at www.testequipmentdepot.com Industry-Leading Performance The
500 khz / 1 MHz Precision LCR Meter Models 894 & 895
 Data Sheet 500 khz / 1 MHz Precision LCR Meter Industry-Leading Performance The 894 and 895 are high accuracy LCR meters capable of measuring inductance, capacitance, and resistance of components and materials
NI PXI-2530 Specifications
 NI PXI-2530 Specifications 128-Channel Reed Relay Multiplexer/Matrix This document lists specifications for the National Instruments PXI-2530 128-channel multiplexer/matrix module. All specifications are
400 MHz Passive High-Voltage Probe R&S RT-ZH
 Manual 400 MHz Passive High-Voltage Probe R&S RT-ZH11 1409.7737.02 Printed in Germany Test and Measurment Manufacturer ROHDE & SCHWARZ For comprehensive information about Rohde and Schwarz, please visit
Connevans.info. DeafEquipment.co.uk. This product may be purchased from Connevans Limited secure online store at
 Connevans.info Solutions to improve the quality of life Offering you choice Helping you choose This product may be purchased from Connevans Limited secure online store at www.deafequipment.co.uk DeafEquipment.co.uk
PSM Soft. Features and Functions January PC Software Guide. Getting connected and Communication
 PSM Soft PC Software Guide Features and Functions January 2010 The PSM series Phase Sensitive Multimeters provide a wide range of exceptionally accurate and versatile instrumentation in one unique package.
EMC Near-field Probes + Wideband Amplifier
 1 Introduction The H20, H10, H5 and E5 are magnetic field (H) and electric field (E) probes for radiated emissions EMC precompliance measurements. The probes are used in the near field of sources of electromagnetic
GRX Online Retroreflectivity Sensor User Manual
 GRX Online Retroreflectivity Sensor User Manual Online sensor for production line control of the retroreflection properties of traffic sign sheeting materials. Manual August 2018 ver. 1.2 - English DELTA
WHALETEQ. ESU Neutral Electrodes Impedance Tester. Model: HFPA150. User Manual
 WHALETEQ ESU Neutral Electrodes Impedance Tester Model: HFPA150 User Manual Version2014-10-30 Hardware Version1.3.x 1. Introduction HFPA150 is a unique tester specifically designed for the testing of neutral
DC Biased Impedance Measurement
 DC Biased Impedance Measurement Using the Bode 100 and the Picotest J2130A DC Bias Injector By Florian Hämmerle & Steve Sandler 2011 Picotest.com Visit www.picotest.com for more information. Contact support@picotest.com
Technical Documentation
 Technical Documentation for metratec QuasarMX HF RFID Reader Date: April 2015 Version: 1.4 Technical Documentation metratec QuasarMX Page 1 of 13 Table of Contents 1 General Information / Security Advice...3
TEST & MEASURING INSTRUMENTS. Analyzer. (4 Ports) 4 Ports
 4 Ports") TEST & MEASURING INSTRUMENTS Analyzer (4 Ports) 4 Ports Key Features Frequrncy Range : 100kHz ~ 8GHz, 16 Parameters support (S11 ~ S44) Measurement time per point : 100us per point Wide Output Power Range
TEST & MEASURING INSTRUMENTS Analyzer (4 Ports) 4 Ports Key Features Frequrncy Range : 100kHz ~ 8GHz, 16 Parameters support (S11 ~ S44) Measurement time per point : 100us per point Wide Output Power Range
Digital Clamp Meter Model: &
 Digital Clamp Meter Model: 72-7224 & 72-7226 1 SAFETY INFORMATION Please read these instructions carefully before use and retain for future reference. This meter is designed to meet IEC61010-1, 61010-2-032,
USER MANUAL. DC 13kHz High Voltage Amplifier WMA V to +175V output. Stable with all capacitive loads, generates no overshoot
 DC 13kHz High Voltage Amplifier WMA-02 www.falco falco-systems systems.com USER MANUAL -175V to +175V output DC to 13kHz at -3dB full power bandwidth single power supply 24V 30V DC, battery power possible
RLC Software User s Manual
 RLC Software User s Manual Venable Instruments 4201 S. Congress, Suite 201 Austin, TX 78745 512-837-2888 www.venable.biz Introduction The RLC software allows you to measure the frequency response of RLC
Testing Power Sources for Stability
 Keywords Venable, frequency response analyzer, oscillator, power source, stability testing, feedback loop, error amplifier compensation, impedance, output voltage, transfer function, gain crossover, bode
ECE 4670 Spring 2014 Lab 1 Linear System Characteristics
 ECE 4670 Spring 2014 Lab 1 Linear System Characteristics 1 Linear System Characteristics The first part of this experiment will serve as an introduction to the use of the spectrum analyzer in making absolute
LCR METER Model:
 LCR METER Model: 72-3520 1 CONTENTS Page Number Details 2 What s Included 3 Important Safety Information 3 Ambient Conditions 3 Features 3 Impedance Explanation 4 Measurement Mode 4 LCD Description 5 Product
AA-35 ZOOM. RigExpert. User s manual. Antenna and cable analyzer
 AA-35 ZOOM Antenna and cable analyzer RigExpert User s manual . Table of contents Introduction Operating the AA-35 ZOOM First time use Main menu Multifunctional keys Connecting to your antenna SWR chart
RIGOL. User s Guide. RP1000D Series High Voltage Differential Probe. Feb RIGOL Technologies, Inc
 User s Guide RP1000D Series High Voltage Differential Probe Feb. 2013 RIGOL Technologies, Inc Guaranty and Declaration Copyright 2012 RIGOL Technologies, Inc. All Rights Reserved. Trademark Information
Agilent N6700 Modular Power System Family
 Agilent N67 Modular Power System Family N6731B-N6784A DC Power Modules Specifications Guide Legal Notices Agilent Technologies, Inc. 21, 211 No part of this document may be photocopied, reproduced, or
An Introductory Guide to Circuit Simulation using NI Multisim 12
 School of Engineering and Technology An Introductory Guide to Circuit Simulation using NI Multisim 12 This booklet belongs to: This document provides a brief overview and introductory tutorial for circuit
IDEAL INDUSTRIES, INC. TECHNICAL MANUAL MODEL: MODEL: Multimeter Service Information
 IDEAL INDUSTRIES, INC. TECHNICAL MANUAL MODEL: 61-340 MODEL: 61-342 Multimeter Service Information The Service Information provides the following information: Precautions and safety information Specifications
DM-45 Digital Multimeter
 INSTRUCTION MANUAL DM-45 Digital Multimeter Read and understand all of the instructions and safety information in this manual before operating or servicing this tool. Description The Greenlee DM-45 Digital
User s Manual. Miniature Passive Probe. IM EN 3rd Edition
 User s Manual Miniature Passive Probe IM 701946-01EN 3rd Edition Thank you for purchasing the miniature passive probe. This miniature passive probe is designed for user s safety and excellent easyto-use
MGA Magnetic field system. DC khz
 MGA 1030 Magnetic field system DC - 250 khz EN 55103-1 + 2, EN 61000-4-8, Automotive, MIL-STD a.o. Generation and measurement of magnetic fields from DC up to 250 khz Field strengths up to 1000 A/m Additional
Lab 4. Crystal Oscillator
 Lab 4. Crystal Oscillator Modeling the Piezo Electric Quartz Crystal Most oscillators employed for RF and microwave applications use a resonator to set the frequency of oscillation. It is desirable to
Bench LCR Meter Model 891
 Data Sheet Bench LCR Meter The 891 is a compact, precise, and versatile LCR meter capable of measuring inductors, capacitors, and resistors at DC or from 20 Hz to 300 khz. The instrument s 2U half-rack
Do not expose this device to water or moisture of any kind. Do not mix new and old batteries or batteries of different types.
 1 SAFETY WARNINGS AND GUIDELINES This device is intended for indoor use only. Do not expose this device to water or moisture of any kind. Do not mix new and old batteries or batteries of different types.
RigExpert AA-170 Antenna Analyzer (0.1 to 170 MHz) User s manual
 User s manual") RigExpert AA-170 Antenna Analyzer (0.1 to 170 MHz) User s manual Table of contents 1. Description... 3 2. Specifications... 4 3. Precautions... 5 4. Operation... 6 4.1. Preparation for use... 6 4.2. Turning
RigExpert AA-170 Antenna Analyzer (0.1 to 170 MHz) User s manual Table of contents 1. Description... 3 2. Specifications... 4 3. Precautions... 5 4. Operation... 6 4.1. Preparation for use... 6 4.2. Turning
PI-10 Broadband Power Indicator
 PI-10 Broadband Power Indicator HIGH RF VOLTAGES MAY BE PRESENT AT THE PORTS OF THIS UNIT. All operating personnel should use extreme caution in handling these voltages and be thoroughly familiar with
FRAX Series Sweep Frequency Response Analyzers
 FRAX Series Highest dynamic range and accuracy in the industry Fulfills international standards for SFRA measurements Advanced analysis and decision support built into the software. FRAX 150 with built
RLC-circuits with Cobra4 Xpert-Link
 Student's Sheet RLC-circuits with Cobra4 Xpert-Link (Item No.: P2440664) Curricular Relevance Area of Expertise: Physics Subtopic: Inductance, Electromagnetic Oscillations, AC Circuits Topic: Electricity
Agilent N6700 Modular Power System Family
 Agilent N67 Modular Power System Family N6731B-N6784A DC Power Modules Specifications Guide Legal Notices Agilent Technologies, Inc. 21-212 No part of this document may be photocopied, reproduced, or translated
Warning: Electrical Hazard... 3 Safety Instruction Sheet for STG Product Overview What s in the box?... 4
 STG-2412 User Guide Warning: Electrical Hazard... 3 Safety Instruction Sheet for STG-2412... 3 Product Overview... 4 What s in the box?... 4 Using STG-2412 for Mixing, Processing, and Recording... 5 Software
Bulk Current Injection Probe Test Procedure
 Bulk Current Injection Probe Test Procedure 1 TABLE OF CONTENTS INTRODUCTION 3 GENERAL INFORMATION 4 TEST METHODS 6 SAFETY 8 FIGURES 9 FORMULAS 12 MAINTENANCE 13 WARRANTY 14 2 INTRODUCTION CURRENT PROBE
Operator s Manual. PP016 Passive Probe
 Operator s Manual PP016 Passive Probe 2017 Teledyne LeCroy, Inc. All rights reserved. Unauthorized duplication of Teledyne LeCroy documentation materials is strictly prohibited. Customers are permitted
CD-Pxx-00-0 Series Duct Mount CO 2 Transmitter
 Installation Instructions CD-Pxx-00-0 Issue Date February 4, 006 CD-Pxx-00-0 Series Duct Mount CO Transmitter Application Requirements FCC Compliance Statement This equipment has been tested and found
USER. manual. Falco Systems WMA-100. High Voltage Amplifier DC - 500kHz
 USER manual Falco Systems WMA-100 High Voltage Amplifier DC - 500kHz Falco Systems WMA-100, High Voltage Amplifier DC - 500kHz High voltage: 20x amplification up to +175V and -175V output voltage with
Model and
 Function Generator Model 72-14110 and 72-14111 0 Contents Function Generator... 0 Model 72-14110 and 72-14111... 0 Chapter 1 Safety Information... 3 1.1 Safety Terms and Symbols... 3 1.2 General Safety
QUICK REFERENCE OVERVIEW. Display Area
 SMART TWEEZERS M o del S T-1 User s M anual Version 10 Patent Pending N o t i ce The contents of this document is believed to be accurate, but is not guaranteed by Excelta C orporation The inf ormation
Sense. 3D Scanner. User Guide. See inside for use and safety information.
 Sense 3D Scanner User Guide See inside for use and safety information. 1 CONTENTS INTRODUCTION.... 3 IMPORTANT SAFETY INFORMATION... 4 Safety Guidelines....4 SENSE 3D SCANNER FEATURES AND PROPERTIES....
INSTRUCTION MANUAL For LINE IMPEDANCE STABILIZATION NETWORK. Model LI khz to 10 MHz
 Page 1 of 10 INSTRUCTION MANUAL For LINE IMPEDANCE STABILIZATION NETWORK Model LI-4100 10 khz to 10 MHz Page 2 of 10 Table of Contents 1.0 Introduction... 3 2.0 Product Description... 4 3.0 Product Specifications...
Installation guide M B. RSU10 USB interface
 Installation guide M-9904-8092-03-B RSU10 USB interface 2008-2011 Renishaw plc. All rights reserved. This document may not be copied or reproduced in whole or in part, or transferred to any other media
NI PXI-2555 Specifications
 NI PXI-2555 Specifications 2.5 GHz Terminated 4 x 1 Multiplexer (SP4T) This document lists specifications for the NI PXI-2555 multiplexer module. All specifications are subject to change without notice.
MODEL 3810/2 Line Impedance Stabilization Network
 EMC TEST SYSTEMS FEBRUARY 1996 REV C PN 399197 MODEL 3810/2 Line Impedance Stabilization Network OPERATION MANUAL USA P.O. Box 80589 Austin, Texas 78708-0589 2205 Kramer Lane, Austin, Texas 78758-4047
OPEN TEM CELLS FOR EMC PRE-COMPLIANCE TESTING
 1 Introduction Radiated emission tests are typically carried out in anechoic chambers, using antennas to pick up the radiated signals. Due to bandwidth limitations, several antennas are required to cover
Opamp stability using non-invasive methods
 Opamp stability using non-invasive methods Opamps are frequently use in instrumentation systems as unity gain analog buffers, voltage reference buffers and ADC input buffers as well as low gain preamplifiers.
GF 467F FUNCTION GENERATOR. PROTECTED RS232 + (USB OR LAN)* LabVIEW 0,01 Hz to 5 MHz CMos. Specifications. Other specifications
* LabVIEW 0,01 Hz to 5 MHz CMos. Specifications. Other specifications") FUNCTION GENERATOR EAN CODE : 3760244880468 5 MHZ+RS232++(USB or LAN)* GF 467F COMPLETE : Reciprocal frequency counter 50 MHz. - Internal linear or logarithmic sweep, and external VCF or FM modulation.
FUNCTION GENERATOR EAN CODE : 3760244880468 5 MHZ+RS232++(USB or LAN)* GF 467F COMPLETE : Reciprocal frequency counter 50 MHz. - Internal linear or logarithmic sweep, and external VCF or FM modulation.
SCXI MHz Quad 8x1 50 Ω Multiplexer
 SPECIFICATIONS SCXI -1193 500 MHz Quad 50 Ω Multiplexer This document lists specifications for the SCXI-1193 multiplexer module. All specifications are subject to change without notice. Visit ni.com/manuals
DSi dual readhead rotary encoder system
 Installation guide M-9653-9298-01-A RSLM high accuracy linear encoder DSi dual readhead rotary encoder system Renishaw plc declares that TONiC encoder system complies with the applicable standards and
ECE3204 D2015 Lab 1. See suggested breadboard configuration on following page!
 ECE3204 D2015 Lab 1 The Operational Amplifier: Inverting and Non-inverting Gain Configurations Gain-Bandwidth Product Relationship Frequency Response Limitation Transfer Function Measurement DC Errors
DA216S DISTRIBUTION AMPLIFIER
 DISTRIBUTION AMPLIFIER IMPORTANT SAFETY INSTRUCTIONS 1. Read these instructions. 2. Keep these instructions. 3. Heed all warnings. 4. Follow all instructions. 5. Do not use this apparatus near water. 6.