CrossLoopPatterner User Guide
|
|
|
- Eleanor Hancock
- 6 years ago
- Views:
Transcription
 files and AIS measurements into SeaSonde antenna patterns which are used to obtain more accurate current bearings.")


1 CrossLoopPatterner User Guide UG Sep 23, 2016 CrossLoopPatterner converts antenna pattern measurements (LOOP) files and AIS measurements into SeaSonde antenna patterns which are used to obtain more accurate current bearings. The general method for creating an antenna pattern is: 1. Walk or Cruise a Transponder & GPS in front of the antennas on a arc during which the GPS track is recorded and the SeaSonde Radial Site records Time series data. 2. Download the GPS track info into the computer and use utility GPSTracker to convert the GPS lat, lon, time into bearing, time from the SeaSonde Radial Site. The output file is a TRAK_XXXX_YYYY_MM_DD_HHMM.trak file. 3. Use SeaSonde Acquisition to import the Time Series data in the diagnostics mode to record the measured transponder peak and the associative bearing from the GPS track. The Output file is an antenna measurement and bearing over time called a LOOP LOOP_XXXX_YYYY_MM_DD_HHMM.loop file. 4. Use CrossLoopPatterner to filter bad measurement points, adjust for time discrepancies, smooth, interpolate and output the final Pattern file to be used by SeaSonde Radial processing software. This document first covers the steps needed to create a measured pattern, followed by detail on the graph plots.

2 When you launch CrossLoopPatterner you ll see the follow window. CrossLoopPatterner divides the processing tasks into different sections or steps which are indicated by the button bar. If an AIS LOOP is used, an extra AIS Filter section is available and Timing is not needed. Creating a new pattern always starts with Source step. You can jump to any step by clicking on the button or by using arrow button which jump to the next or previous step. Source Timing Filter AISFilter Pattern Finish Select the source Loop File(s) Adjust timing between Loop and Track files. Filter measurements. Filter AIS measurements. Reduce, Smooth, and/or Interpolate. Save the Pattern File Clicking the ->Ideal button jumps to a Ideal pattern creation mode. The Graphs buttons select which plots to show.

3 Source Section The first section Source is where you enter the LOOP file(s), Pattern file(s), or select 'Ideal' to start with. Select the radio button 'Ideal' if you want to switch to the ideal generator section. To select a source file, use the Open button or drag a LOOP file to the window, or application's icon. Note, dragging a LOOP file to the application s icon will always take you back to the source section. CrossLoopPatterner will automatically load and identify the source file as a Measurement (LOOP) or Pattern file. If not a valid file, you will see '0 Loop Entries'. CrossLoopPatterner will show the first three lines of the file to help you identify the file. CrossLoopPatterner will then open several plots of the source data. When you drop multiple files onto CrossLoopPatterner, it will use them all. Use the command key in the open dialog or in the Finder to select more than one file at a time. The following graphs will open automatically when you drop the source and plot your source loops. Note that AIS loops are so large you might see a spin cursor while it loads them. The blue text is the first three lines of the file and should indicate that it s a loop file. These are followed by green text which shows the number of loop measurements read and the time span of the measurements.
4 Limit from entries are an optional time filter which is typically only used for AIS Loops Change Reference entries enables a swap the antennas if you think somehow they were assembled incorrectly. If swapping, appears to create a valid antenna pattern, it cannot be used because it won t represent the swapped antennas; you ll need to correct the antenna connections on the SeaSonde. Click on the right arrow button to proceed to the Timing section.
5 Timing Section The timing section is to adjust for possibly timing misalignment between the GPS time and the computer time. If the computer time was correct, then likely no adjustment is necessary. If the run was done with both CW and CCW arcs, then the two runs should line up. If they don t line up then likely the timing needs to be adjusted. Drag the TRAK file onto the window or use the Open button to select the TRAK file. TRAK files are created with GPSTracker which calculates the bearing relative to the site for the measurement times. If you know the timing error, enter it into Adjust loop bearings; otherwise, if you have a CW/CCW run then use the up/down arrow next to the Adjust loop bearings entry to change the timing until the two runs have maximum overlap like above example. If you don t have a TRAK file, you can still adjust the bearings by setting the check box Adjust Bearings and adjust the indices entry, until the pattern runs have maximum overlap. This is not as accurate as a TRAK file, but will usually suffice.
6 Filter Section The Filter section is for removing undesired measurement points. Near each edit field is an up/down spin control allowing you to change the value and see real time graph updates. Filtered out points will disappear from the graphs and the control dialog shows how many points are still valid (above example shows 95 out of 96 points). Each filter is enabled by setting the check box before the filter's name. Antenna Bearing field sets where the main lobe of loop 1 is pointing relative to True North. (Note that all bearings in CrossLoopPatterner are handled as True North). In the Pattern Magnitudes polar graph, the antenna bearing is plotted as an orange line. Note, changing the Antenna Bearing does not rotate the pattern loop data. Radial Velocity filter, if enabled, keeps all points, which have less than the entered velocity. The radial velocity is zero, if the Transponder kept a perfect arc relative to the SeaSonde Radial Site. Doppler Velocity filter keeps all points, which are less than plus/minus entered cells from average doppler velocity cell. The doppler velocity cell is the cell of the transponder peak measured in SeaSonde Acquisition. If the transponder momentarily dropped out, another signal might be accidentally recorded into the loop. You would want to filter these points out. Note that if the transponder velocity exceeds the max / min doppler cells it will wrap to the negative/
7 positive doppler cell. In this case, CrossLoopPatterner will still calculate the average doppler cell making it a very poor filter. Signal Level filter will keep all points, which have a signal to noise ratio greater than the entered db. It will remove any point in the vertical (orange in signal to noise graph) is less than this value. It will only remove points in which both loop 1 (red) and loop 2 (blue), which are less than this value. Each loop can be expected to drop in signal to noise near its null region, which happens at a +/-180 deg. from its main lobe (strongest signal). Signal Level filter is the most dominate filter for undesirable measurements. Ratio filter will keep all points where loop1 and loop2 have magnitude ratios less than this entry. When processing AIS loops and even APM loops, be sure to set this to reasonable value to filter out a lot of undesirable results. Cut Left Side filter removes the entered number of points from the beginning of the loop file. Typically when start a transponder run the transponder may have been sitting still for while or setting up for the arc and you may not want to include the points. If you look at the Pattern Measurement graphs you can pick out the horizontal index you want to cut. Cut Right Side filter removes the entered number of points from the end of the loop file. If you look at the Pattern Measurement graphs you can pick out the horizontal index you want to cut. Filter Loop File Flags check box, if check marked, will remove any points whose Flag column value is not zero. SeaSondeAcquisition currently always sets this value to zero. It is still possible to hand edit the loop file to flag extra points you may wish to remove. Export Button will output a Loop file of the filtered data. The point of this is if you want to further process the Loop file on your own and then import your filtered Loop file back into CrossLoopPatterner. AIS Filter Section If the source is an AIS LOOP file, then this section comes after Filter. The AIS Filter is describe later in this document after the graph descriptions. Standard APM loop measurement does not use AIS filtering.
8 Pattern Section The Pattern section is for reducing, smoothing, and interpolation before saving the pattern. The Antenna Bearing entry allows you to still change the bearing reference here. It is important to have the right antenna bearing at the time of the Transponder measurement. The pattern is stored relative to the antenna bearing. CrossLoopPatterner applies, in order, first a reduction of 0.01 deg, then Smoothing, then the Reduction entry, then Interpolation, and lastly Idealize Pattern, if enabled. The green text in the middle of the window are calculation on how the measured pattern varies from ideal. Amplitude Scalars are how much the measure pattern loop1 and loop2 magnitudes would need to be divided by to reach unity. Amplitude Factors are one would multiply the cross spectra by to match an ideal pattern. These factors are one over the scalar squared.
9 Phase Adjustments are how much the measured pattern loop1 and loop2 phases are off from ideal. Distortion is (1 - correlation of ideal) * 100. which is a measurement of how far off from ideal the pattern is where 0% is ideal and 100% is not very ideal at all. The L1 and L2 are distortion of the individual loops. Loop Align is the bearing where the distortion is at a minimum. This is a possible indication of how the antenna might be rotated. Reduction entry averages and reduces the loop to the entered precision. The Reduction entry causes all bearings within +/- the reduction/2 to be averaged into one point. Without Interpolation enabled this will be the output degree resolution of the pattern. Typically SeaSonde uses 5 degrees. This step is always required so that duplicate points at the same bearing are always averaged down to a single point. Smoothing entry if enabled smoothes (averages) bearings over +/- the smoothing/2. It does not reduce the number of points like Reduction does. Interpolation entry if enabled, it will fill in all points at the entered resolution. It is currently set to only interpolate between bearings at 30 deg or less apart. The interpolation is done using a cubic Bezier curve using the previous bearing and post bearing plus the two points be interpolated across (4 points). This is much the same as the Draw Smooth check box except that it is done on the real and imaginary parts of the pattern separately. (You should always turn on interpolation at the output resolution of your pattern; otherwise any missing bearings in the pattern will show up as missing radial spokes in the output.) Idealize Pattern entry uses the calculated amplitudes and phases with antenna bearing to create an ideal pattern at the Reduction resolution. This is typically only used as a visualization tool to see how far the actual pattern is from ideal. Draw Smooth check box toggles drawing the graphs with a Bezier curve or straight line. Draw Lines check box toggles drawing lines (straight or curved) between the points on and off for the Pattern Magnitudes polar plot. Draw Points check box toggles drawing markers at the data points for the Pattern Magnitudes polar plot. (X s for Loop 1. O s for Loop 2).
10 Limit Sector entries allows you to cut off a portion of the pattern. You would only do this if you thought that part of the pattern was not good. The kept part of the pattern will be clockwise from the Start Angle to the Stop Angle. Gain Loop 1 and Loop 2 entries allow you to scale the loop magnitudes up or down. There is no reason to do this for normal patterns. Phase Loop1 and Loop 2 entries allow you to adjust the phases. There is no reason to do this for normal patterns.

11 Finish Section The Finish section allows you to enter site info and a user comment before saving the pattern file. Site Code entry is the four-character site name. Location entry is the latitude,longitude of the site. This is typically already set by from Loop file. Alternately, drop a RadialConfig/Header.txt file onto this window to automatically update the Site Code, Lat and Lon entries. Comment entry is whatever you want as a note about the pattern. It s common to put your Initials here. Save button will create a folder that contains the pattern, png images and source loops and trak files. The folder default name is PATT_XXXX_YYYY_MM_DD HHMM.xlp. The file MeasPattern.txt is the one to copy to RadialConfigs folder for future radial processing. Phases.txt can also be copied to RadialConfigs folder which is used for ideal pattern processing as a backup when measured pattern no longer fits the actual pattern because something changed at the site.


12 Graphs The buttons following Graphs: toggle each graph on and off. The button is a dark gray when graph is enabled. CrossLoopPatterner automatically adjusts the size of the graphs to fill the window. To save any graph image in png format, first select the graph by clicking on it, then use menu File -> Save Image Meas. Graph Measurement graph is composed of four different graphs of signal to noise, bearing, signal range and doppler bins, and radial velocity versus measurement index. For Signal to Noise Loop1 is red, Loop2 is blue and Vertical is orange. Loop1 and Loop2 are expected to drop in power in the null of the loop. For range and doppler bins, range is red (different scale of 0 to max range) and doppler bin is blue. This indicate how stable the transponder signal is. Phase/Mag Graph Shows phase and magnitude of loop1(red) and loop2(blue) relative to the vertical element.
13 Tangent Graph Tangent graph is a plot of loop1/loop2. This is an indication of how balanced the loops are to each other. Real&Imag Graph Real and Imaginary components of loop1 and loop2 ratios. Red is Loop1 real part. Yellow is Loop1 imaginary part. Blue is Loop2 real part. Teal is Loop2 is imaginary part. Vel Graph Velocity graph is a plot of the rate of change of the real and imaginary parts of Loop1 and Loop2. Spikes or large jumps here indicate an improbably rate of change in the pattern measurement.
 and Loop2(blue) versus bearing.")
14 Spread Graph Distribution of number of measurements for each 5 degrees. This is most useful for AIS Loops to see bearing coverage. Pattern Graph Magnitude plots of Loop1(red) and Loop2(blue) versus bearing. This illustrates how well the pattern matches the ideal cross loop pattern.
15 Power Graph Plot of vertical antenna power versus bearing. Where this drops, it shows possible coverage issue or something happened to the transponder signal in that sector.

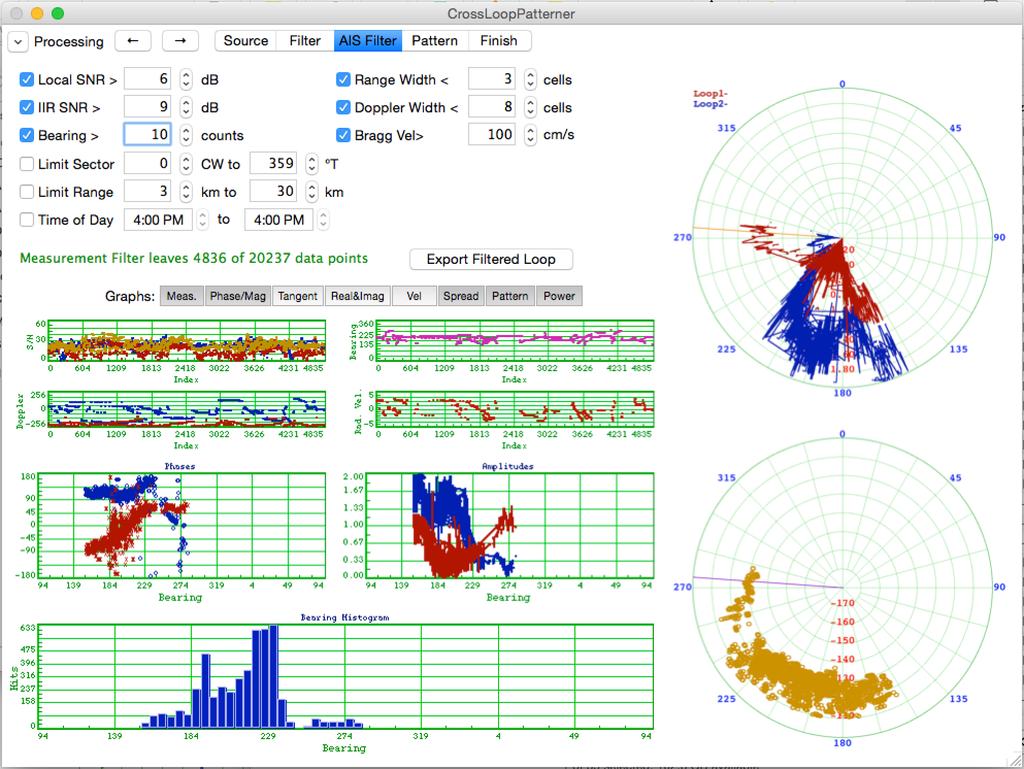
16 AIS Filter Section AIS Loop measurements contain a lot more noisy measurements which need to be filtered out. Local SNR filters low S/N where noise floor was calculated using near by doppler and range. IIR SNR filters low S/N where S/N is calculated based on using a background IIR average of past cross spectra. Bearing filters out bearings where there were less than this entry counts per 5 degree bin. Range Width filters out where the signal power spans more than entered range cells. Doppler Width filters out where the signal power span more than entered doppler bins. Bragg Vel filters out measurements that closer in doppler bins to the Bragg Index than this specified current velocity. Limit Sector entries limit the field of view from the site for starting bearing True going clockwise to stop bearing True. Limit Range entries limit the range of AIS measurements detected from the site in kilometers.

17 Time of Day entries limit the AIS measurements to specific part of the day. Some SeaSonde have a high diurnal noise variation, so filter out the high times can help. AIS Loop Example
18

19 Ideal Mode The Ideal mode allows you to create/explore an ideal antenna pattern. ->Source button will take you back to the main "Source" section. Resolution entry sets the bearing degree resolution of the pattern. SeaSonde uses 1 degree. Rotation entry will rotate the pattern. Although typically zero, this entry will not matter as the antenna pattern is always references to the SeaSonde Radial Site's bearing. Warning: Changing the following from the typical / default will create a nonstandard ideal pattern. These are available for experimentation use only. Coverage entries sets the starting bearing angle clockwise to non-inclusive stopping bearing angle of the pattern. Typically, start and stop would be 0,360. Phase entries adjust the Loop1 and Loop2 Phases. (Graphs shows Loop1 as red and Loop2 as blue.) Gain entries are multiplication factor on the magnitude of Loop1 and Loop2. Default value is one for an ideal pattern. Flatten entries apply a power factor on the magnitude of Loop1 and Loop2. Typical value is one. Values >1 apply a pow(mag,squish) causing the circular lobe to narrow. Values <0 apply a pow(mag,1/(-squish)) cause the circular lobe to widen. This adjustment is for trying out an artificial distortion.

20 Interpolation. Pattern interpolation is done using a cubic spline applied to real and imaginary parts separately. You should typically avoid trying to interpolate across a missing expected null in the cross loop pattern. The following illustrates how well interpolation works by using the ideal pattern with very coarse resolution and interpolating across.
21 Revision History First Draft Sep 23, 2016 Copyright and Disclaimer This document is copyrighted(c) by CODAR Ocean Sensors, Ltd and cannot be copied or reproduced in all or partial without expressed written consent by CODAR Ocean Sensors, Ltd.
SeaSonde Radial Site Release 6 CrossLoopPatterner Application Guide Apr 21, 2009 Copyright CODAR Ocean Sensors, Ltd
 CODAR O C E A N S E N S O R S SeaSonde Radial Site Release 6 CrossLoopPatterner Application Guide Apr 21, 2009 Copyright CODAR Ocean Sensors, Ltd CrossLoopPatterner is an utility for converting LOOP files
Spectra Point Extractor Diagnostic File Format
 Spectra Point Extractor Diagnostic File Format 124.00.1610.FF Oct 28, 2016 Spectra Point Extractor Diagnostic File Format SpectraPointExtractor produces analysis files of one or group of spectra range,doppler
HF-Radar Network Near-Real Time Ocean Surface Current Mapping
 HF-Radar Network Near-Real Time Ocean Surface Current Mapping The HF-Radar Network (HFRNet) acquires surface ocean radial velocities measured by HF-Radar through a distributed network and processes the
BIM - ARCHITECTUAL IMPORTING A SCANNED PLAN
 BIM - ARCHITECTUAL IMPORTING A SCANNED PLAN INTRODUCTION In this section, we will demonstrate importing a plan created in another application. One of the most common starting points for a project is from
 Page 1 of 9 Tutorial Modeling a Pawn In this lesson, you will model a pawn for a set of chessmen. In a wooden chess set of standard design, pawns are turned on a lathe. You will use 3ds max to do something
Introduction to Autodesk Inventor for F1 in Schools (Australian Version)
") Introduction to Autodesk Inventor for F1 in Schools (Australian Version) F1 in Schools race car In this course you will be introduced to Autodesk Inventor, which is the centerpiece of Autodesk s Digital
Introduction to Autodesk Inventor for F1 in Schools (Australian Version) F1 in Schools race car In this course you will be introduced to Autodesk Inventor, which is the centerpiece of Autodesk s Digital
Getting Started. with Easy Blue Print
 Getting Started with Easy Blue Print User Interface Overview Easy Blue Print is a simple drawing program that will allow you to create professional-looking 2D floor plan drawings. This guide covers the
User s Guide for: What is a SeaSonde?
 User s Guide for: SeaSonde Radial Site What is a SeaSonde? CODAR OCEAN SENSORS, LTD. 1000 Fremont Ave., Suite 145, Los Altos, CA 94024-6057 USA Tel. (408) 773-8240 FAX (408) 773-0514 www.codaros.com e-mail:
Chapter 11 Coloring Observations. Chapter Table of Contents
 Chapter 11 Coloring Observations Chapter Table of Contents COLORING INDIVIDUAL OBSERVATIONS...166 COLORING BY NOMINAL VARIABLE...168 COLORING BY INTERVAL VARIABLE...169 MULTIPLE COLOR BLENDS...170 163
SeaSonde Radial Suite Release 7 Configuration File Formats Jan 23, 2012 Copyright CODAR Ocean Sensors, Ltd.
 CODAR O C E A N S E N S O R S SeaSonde Radial Suite Release 7 Configuration File Formats Jan 23, 2012 Copyright CODAR Ocean Sensors, Ltd. AnalysisOptions.txt! Radial Suite Processing Controls Header.txt!!!
Autodesk Inventor Module 17 Angles
 Inventor Self-paced ecourse Autodesk Inventor Module 17 Angles Learning Outcomes When you have completed this module, you will be able to: 1 Describe drawing inclined lines, aligned and angular dimensions,
Module 1E: Parallel-Line Flat Pattern Development of Sheet- Metal Folded Model Wrapping the 3D Space of An Oblique Circular Cylinder
 Inventor (10) Module 1E: 1E- 1 Module 1E: Parallel-Line Flat Pattern Development of Sheet- Metal Folded Model Wrapping the 3D Space of An Oblique Circular Cylinder In this Module, we will explore the topic
CAD Tutorial. CAD Detail Windows. In this tutorial you ll learn about: CAD Detail Windows Exploding and Modifying a CAD Block
 CAD Tutorial In this tutorial you ll learn about: CAD Detail Windows Exploding and Modifying a CAD Block Creating a New CAD Block CAD Detail from View Creating a Plot Plan CAD Detail Windows CAD Details
Module 2: Radial-Line Sheet-Metal 3D Modeling and 2D Pattern Development: Right Cone (Regular, Frustum, and Truncated)
") Inventor (5) Module 2: 2-1 Module 2: Radial-Line Sheet-Metal 3D Modeling and 2D Pattern Development: Right Cone (Regular, Frustum, and Truncated) In this tutorial, we will learn how to build a 3D model
Inventor (5) Module 2: 2-1 Module 2: Radial-Line Sheet-Metal 3D Modeling and 2D Pattern Development: Right Cone (Regular, Frustum, and Truncated) In this tutorial, we will learn how to build a 3D model
Blab Gallery Uploads: How to Reduce and/or Rotate Your Photo Last edited 11/20/2016
 Blab Gallery Uploads: How to Reduce and/or Rotate Your Photo Contents & Links QUICK LINK-JUMPS to information in this PDF document Photo Editors General Information Includes finding pre-installed editors
How to define Graph in HDSME
 How to define Graph in HDSME HDSME provides several chart/graph options to let you analyze your business in a visual format (2D and 3D). A chart/graph can display a summary of sales, profit, or current
CONTENT INTRODUCTION BASIC CONCEPTS Creating an element of a black-and white line drawing DRAWING STROKES...
 USER MANUAL CONTENT INTRODUCTION... 3 1 BASIC CONCEPTS... 3 2 QUICK START... 7 2.1 Creating an element of a black-and white line drawing... 7 3 DRAWING STROKES... 15 3.1 Creating a group of strokes...
Editing Polylines. Sacramento City College Engineering Design Technology. Editing Polylines 1
 Editing Polylines Sacramento City College Engineering Design Technology Editing Polylines 1 Objectives Use the PLINE command to draw polylines and polyarcs. Edit existing polylines with the PEDIT command.
Reference Manual SPECTRUM. Signal Processing for Experimental Chemistry Teaching and Research / University of Maryland
 Reference Manual SPECTRUM Signal Processing for Experimental Chemistry Teaching and Research / University of Maryland Version 1.1, Dec, 1990. 1988, 1989 T. C. O Haver The File Menu New Generates synthetic
Architecture 2012 Fundamentals
 Autodesk Revit Architecture 2012 Fundamentals Supplemental Files SDC PUBLICATIONS Schroff Development Corporation Better Textbooks. Lower Prices. www.sdcpublications.com Tutorial files on enclosed CD Visit
SolidWorks 95 User s Guide
 SolidWorks 95 User s Guide Disclaimer: The following User Guide was extracted from SolidWorks 95 Help files and was not originally distributed in this format. All content 1995, SolidWorks Corporation Contents
Alternatively, the solid section can be made with open line sketch and adding thickness by Thicken Sketch.
 Sketcher All feature creation begins with two-dimensional drawing in the sketcher and then adding the third dimension in some way. The sketcher has many menus to help create various types of sketches.
Principles and Applications of Microfluidic Devices AutoCAD Design Lab - COMSOL import ready
 Principles and Applications of Microfluidic Devices AutoCAD Design Lab - COMSOL import ready Part I. Introduction AutoCAD is a computer drawing package that can allow you to define physical structures
Autocad Basics 7/28/2009. Chapter 14 - Learning Objectives
 Chapter 14 - Learning Objectives Autocad Basics Chapter 14 July 28, 2009 Use grips to stretch, copy, move, rotate, scale, and mirror objects. Edit objects using the Quick Properties panel and the Properties
File Formats Used for CODAR Radial Data
 File Formats Used for CODAR Radial Data Mark Otero April 8, 2005 Scripps Institution of Oceanography 8861 Shellback Way Keck Center, #233 La Jolla, CA 92093-0213 Phone (858) 822 3537 Fax (858) 822 1903
Physics 253 Fundamental Physics Mechanic, September 9, Lab #2 Plotting with Excel: The Air Slide
 1 NORTHERN ILLINOIS UNIVERSITY PHYSICS DEPARTMENT Physics 253 Fundamental Physics Mechanic, September 9, 2010 Lab #2 Plotting with Excel: The Air Slide Lab Write-up Due: Thurs., September 16, 2010 Place
Welcome to Corel DESIGNER, a comprehensive vector-based package for technical graphic users and technical illustrators.
 Workspace tour Welcome to Corel DESIGNER, a comprehensive vector-based package for technical graphic users and technical illustrators. This tutorial will help you become familiar with the terminology and
Chapter 9 Organization Charts, Flow Diagrams, and More
 Draw Guide Chapter 9 Organization Charts, Flow Diagrams, and More This PDF is designed to be read onscreen, two pages at a time. If you want to print a copy, your PDF viewer should have an option for printing
Module 1C: Adding Dovetail Seams to Curved Edges on A Flat Sheet-Metal Piece
 1 Module 1C: Adding Dovetail Seams to Curved Edges on A Flat Sheet-Metal Piece In this Module, we will explore the method of adding dovetail seams to curved edges such as the circumferential edge of a
Organizing artwork on layers
 3 Layer Basics Both Adobe Photoshop and Adobe ImageReady let you isolate different parts of an image on layers. Each layer can then be edited as discrete artwork, allowing unlimited flexibility in composing
Modeling Basic Mechanical Components #1 Tie-Wrap Clip
 Modeling Basic Mechanical Components #1 Tie-Wrap Clip This tutorial is about modeling simple and basic mechanical components with 3D Mechanical CAD programs, specifically one called Alibre Xpress, a freely
EXERCISE 1: CREATE LINE SPARKLINES
 EXERCISE 1: CREATE LINE SPARKLINES In this exercise you ll create line sparklines. Then you ll convert the line type to the column type. Part 1: Create the sparklines Before you start, notice that the
We recommend downloading the latest core installer for our software from our website. This can be found at:
 Dusk Getting Started Installing the Software We recommend downloading the latest core installer for our software from our website. This can be found at: https://www.atik-cameras.com/downloads/ Locate and
Tutorial 2: Setting up the Drawing Environment
 Drawing size With AutoCAD all drawings are done to FULL SCALE. The drawing limits will depend on the size of the items being drawn. For example if our drawing is the plan of a floor 23.8m X 15m then we
Table of Contents. Lesson 1 Getting Started
 NX Lesson 1 Getting Started Pre-reqs/Technical Skills Basic computer use Expectations Read lesson material Implement steps in software while reading through lesson material Complete quiz on Blackboard
6/20/2012 ACORN ACORN ACORN ACORN ACORN ACORN. Arnstein Prytz. Australian Coastal Ocean Radar Network (ACORN)
") The Australian Coastal Ocean Radar Network WERA Processing and Quality Control Arnstein Prytz Australian Coastal Ocean Radar Network Marine Geophysical Laboratory School of Earth and Environmental Sciences
The Australian Coastal Ocean Radar Network WERA Processing and Quality Control Arnstein Prytz Australian Coastal Ocean Radar Network Marine Geophysical Laboratory School of Earth and Environmental Sciences
SigCal32 User s Guide Version 3.0
 SigCal User s Guide . . SigCal32 User s Guide Version 3.0 Copyright 1999 TDT. All rights reserved. No part of this manual may be reproduced or transmitted in any form or by any means, electronic or mechanical,
MEASUREMENT CAMERA USER GUIDE
 How to use your Aven camera s imaging and measurement tools Part 1 of this guide identifies software icons for on-screen functions, camera settings and measurement tools. Part 2 provides step-by-step operating
LLS - Introduction to Equipment
 Published on Advanced Lab (http://experimentationlab.berkeley.edu) Home > LLS - Introduction to Equipment LLS - Introduction to Equipment All pages in this lab 1. Low Light Signal Measurements [1] 2. Introduction
12. Creating a Product Mockup in Perspective
 12. Creating a Product Mockup in Perspective Lesson overview In this lesson, you ll learn how to do the following: Understand perspective drawing. Use grid presets. Adjust the perspective grid. Draw and
Lesson 6 2D Sketch Panel Tools
 Lesson 6 2D Sketch Panel Tools Inventor s Sketch Tool Bar contains tools for creating the basic geometry to create features and parts. On the surface, the Geometry tools look fairly standard: line, circle,
Universal Scale 4.0 Instruction Manual
 Universal Scale 4.0 Instruction Manual Field Precision LLC 2D/3D finite-element software for electrostatics magnet design, microwave and pulsed-power systems, charged particle devices, thermal transport
Datum Tutorial Part: Cutter
 Datum Tutorial Part: Cutter Objective: Learn to apply Datums in different ways Directions 1. Datum Axis Creation a. First we need to create a center axis for the cutter b. Model Tab > Datum > Select Axis
1.6.7 Add Arc Length Dimension Modify Dimension Value Check the Sketch Curve Connectivity
 Contents 2D Sketch... 1 1.1 2D Sketch Introduction... 1 1.1.1 2D Sketch... 1 1.1.2 Basic Setting of 2D Sketch... 2 1.1.3 Exit 2D Sketch... 4 1.2 Draw Common Geometry... 5 2.2.1 Points... 5 2.2.2 Lines
Chapter 6: TVA MR and Cardiac Function
 Chapter 6 Cardiac MR Introduction Chapter 6: TVA MR and Cardiac Function The Time-Volume Analysis (TVA) optional module calculates time-dependent behavior of volumes in multi-phase studies from MR. An
Unit. Drawing Accurately OVERVIEW OBJECTIVES INTRODUCTION 8-1
 8-1 Unit 8 Drawing Accurately OVERVIEW When you attempt to pick points on the screen, you may have difficulty locating an exact position without some type of help. Typing the point coordinates is one method.
AutoCAD Tutorial First Level. 2D Fundamentals. Randy H. Shih SDC. Better Textbooks. Lower Prices.
 AutoCAD 2018 Tutorial First Level 2D Fundamentals Randy H. Shih SDC PUBLICATIONS Better Textbooks. Lower Prices. www.sdcpublications.com Powered by TCPDF (www.tcpdf.org) Visit the following websites to
Lesson 4 Holes and Rounds
 Lesson 4 Holes and Rounds 111 Figure 4.1 Breaker OBJECTIVES Sketch arcs in sections Create a straight hole through a part Complete a Sketched hole Understand the Hole Tool Use Info to extract information
Object Snap, Geometric Constructions and Multiview Drawings
 Object Snap, Geometric Constructions and Multiview Drawings Sacramento City College EDT 310 EDT 310 - Chapter 6 Object Snap, Geometric Constructions and Multiview Drawings 1 Objectives Use OSNAP to create
Geometric Functions. The color channel toolbar buttons are disabled.
 Introduction to Geometric Transformations Geometric Functions The geometric transformation commands are used to shift, rotate, scale, and align images. For quick rotation by 90 or mirroring of an image,
Introduction - How to Use This Book...vi. Setting Up the Drawing Board Exercise One: Ensure You are Working in the Landmark Workspace...
 Table of Contents Introduction - How to Use This Book...vi Setting Up the Drawing Board... 1 Exercise One: Ensure You are Working in the Landmark Workspace...2 Exercise Two: Set Up Your Vectorworks Preferences...3
Lettering Fabric Preparation deco 340 aurora 430E & 440QEE NAME artista 630E, 635LE & 640E
 Lettering Fabric Preparation Deco 340 Hoop a piece of firm woven fabric backed with tear-away stabilizer in the Large hoop. aurora, artista, and 8 Series Hoop a piece of firm woven fabric backed with tear-away
Using Dynamic Views. Module Overview. Module Prerequisites. Module Objectives
 Using Dynamic Views Module Overview The term dynamic views refers to a method of composing drawings that is a new approach to managing projects. Dynamic views can help you to: automate sheet creation;
Using Curves and Histograms
 Written by Jonathan Sachs Copyright 1996-2003 Digital Light & Color Introduction Although many of the operations, tools, and terms used in digital image manipulation have direct equivalents in conventional
AutoCAD LT 2012 Tutorial. Randy H. Shih Oregon Institute of Technology SDC PUBLICATIONS. Schroff Development Corporation
 AutoCAD LT 2012 Tutorial Randy H. Shih Oregon Institute of Technology SDC PUBLICATIONS www.sdcpublications.com Schroff Development Corporation AutoCAD LT 2012 Tutorial 1-1 Lesson 1 Geometric Construction
DAMs Universal Link Commander
 Application Note #0428 May 2012 Revised: DAMs Universal Link Commander Application Note The Link Commander enables link analysis with or without DAMs measured data. It also enables range and Bit Error
The Toolbars submenu selects or deselects the following toolbars, below shows you how to display the Measuring Toolbar: Scale X in Y
 The Measurement Toolbars Menu The Toolbars submenu selects or deselects the following toolbars, below shows you how to display the Measuring Toolbar: As it looks on the tool bar, below Arrow End Style
SDC. AutoCAD LT 2007 Tutorial. Randy H. Shih. Schroff Development Corporation Oregon Institute of Technology
 AutoCAD LT 2007 Tutorial Randy H. Shih Oregon Institute of Technology SDC PUBLICATIONS Schroff Development Corporation www.schroff.com www.schroff-europe.com AutoCAD LT 2007 Tutorial 1-1 Lesson 1 Geometric
Lesson 4 Extrusions OBJECTIVES. Extrusions
 Lesson 4 Extrusions Figure 4.1 Clamp OBJECTIVES Create a feature using an Extruded protrusion Understand Setup and Environment settings Define and set a Material type Create and use Datum features Sketch
Agility Course Designer Users Guide. Agility Course designer program for Windows PC
 Agility Course Designer Users Guide Agility Course designer program for Windows PC 1 Introduction...3 General notes...4 Design Modes...4 Obstacle Design...4 Path Design...5 The buttons on the left hand
Laboratory 1: Motion in One Dimension
 Phys 131L Spring 2018 Laboratory 1: Motion in One Dimension Classical physics describes the motion of objects with the fundamental goal of tracking the position of an object as time passes. The simplest
Using the Ruler Tool to Keep Your Tracks Straight Revised November 2008
 Using the Ruler Tool to Keep Your Tracks Straight Revised November 2008 Suppose you had to lay a section of track 8000 feet (2424m) long. The track will include a station and several industrial sidings.
Getting Started. Right click on Lateral Workplane. Left Click on New Sketch
 Getting Started 1. Open up PTC Pro/Desktop by either double clicking the icon or through the Start button and in Programs. 2. Once Pro/Desktop is open select File > New > Design 3. Close the Pallet window
Try what you learned (and some new things too)
") Training Try what you learned (and some new things too) PART ONE: DO SOME MATH Exercise 1: Type some simple formulas to add, subtract, multiply, and divide. 1. Click in cell A1. First you ll add two numbers.
Training Try what you learned (and some new things too) PART ONE: DO SOME MATH Exercise 1: Type some simple formulas to add, subtract, multiply, and divide. 1. Click in cell A1. First you ll add two numbers.
Color and More. Color basics
 Color and More In this lesson, you'll evaluate an image in terms of its overall tonal range (lightness, darkness, and contrast), its overall balance of color, and its overall appearance for areas that
1 Placing particles on the slide
 Aerosols Transport Particle Removal Experiment E.S. Kenney, J.A. Taylor, and G. Ahmadi 1 Placing particles on the slide 1.1 Swing the light beneath the test section down and to the left. Figure 1: Light
Working With Drawing Views-I
 Chapter 12 Working With Drawing Views-I Learning Objectives After completing this chapter you will be able to: Generate standard three views. Generate Named Views. Generate Relative Views. Generate Predefined
Ornamental Pro 2004 Instruction Manual (Drawing Basics)
") Ornamental Pro 2004 Instruction Manual (Drawing Basics) http://www.ornametalpro.com/support/techsupport.htm Introduction Ornamental Pro has hundreds of functions that you can use to create your drawings.
Ornamental Pro 2004 Instruction Manual (Drawing Basics) http://www.ornametalpro.com/support/techsupport.htm Introduction Ornamental Pro has hundreds of functions that you can use to create your drawings.
Experiment 2: Electronic Enhancement of S/N and Boxcar Filtering
 Experiment 2: Electronic Enhancement of S/N and Boxcar Filtering Synopsis: A simple waveform generator will apply a triangular voltage ramp through an R/C circuit. A storage digital oscilloscope, or an
with MultiMedia CD Randy H. Shih Jack Zecher SDC PUBLICATIONS Schroff Development Corporation
 with MultiMedia CD Randy H. Shih Jack Zecher SDC PUBLICATIONS Schroff Development Corporation WWW.SCHROFF.COM Lesson 1 Geometric Construction Basics AutoCAD LT 2002 Tutorial 1-1 1-2 AutoCAD LT 2002 Tutorial
Alibre Design Tutorial: Loft, Extrude, & Revolve Cut Loft-Tube-1
 Alibre Design Tutorial: Loft, Extrude, & Revolve Cut Loft-Tube-1 Part Tutorial Exercise 5: Loft-Tube-1 [Complete] In this Exercise, We will set System Parameters first, then part options. Then, in sketch
Diagnostic Ultrasound System. Operation Note
 M5 Diagnostic Ultrasound System Table of Contents System Introduction...3 Control Panel...4 Control Panel...5 Control Panel...6 Control Panel...7 Control Panel...8 Control Panel...9 Power ON / OFF the
Profiling River Surface Velocities and Volume Flow Estmation with Bistatic UHF RiverSonde Radar
 Profiling River Surface Velocities and Volume Flow Estmation with Bistatic UHF RiverSonde Radar Don Barrick Ralph Cheng Cal Teague Jeff Gartner Pete Lilleboe U.S. Geological Survey CODAR Ocean Sensors,
Filter1D Time Series Analysis Tool
 Filter1D Time Series Analysis Tool Introduction Preprocessing and quality control of input time series for surface water flow and sediment transport numerical models are key steps in setting up the simulations
EKA Laboratory Muon Lifetime Experiment Instructions. October 2006
 EKA Laboratory Muon Lifetime Experiment Instructions October 2006 0 Lab setup and singles rate. When high-energy cosmic rays encounter the earth's atmosphere, they decay into a shower of elementary particles.
Stitching MetroPro Application
 OMP-0375F Stitching MetroPro Application Stitch.app This booklet is a quick reference; it assumes that you are familiar with MetroPro and the instrument. Information on MetroPro is provided in Getting
Creo Parametric 2.0: Introduction to Solid Modeling. Creo Parametric 2.0: Introduction to Solid Modeling
 Creo Parametric 2.0: Introduction to Solid Modeling 1 2 Part 1 Class Files... xiii Chapter 1 Introduction to Creo Parametric... 1-1 1.1 Solid Modeling... 1-4 1.2 Creo Parametric Fundamentals... 1-6 Feature-Based...
Experiment P55: Light Intensity vs. Position (Light Sensor, Motion Sensor)
") PASCO scientific Vol. 2 Physics Lab Manual: P55-1 Experiment P55: (Light Sensor, Motion Sensor) Concept Time SW Interface Macintosh file Windows file illuminance 30 m 500/700 P55 Light vs. Position P55_LTVM.SWS
PASCO scientific Vol. 2 Physics Lab Manual: P55-1 Experiment P55: (Light Sensor, Motion Sensor) Concept Time SW Interface Macintosh file Windows file illuminance 30 m 500/700 P55 Light vs. Position P55_LTVM.SWS
Learning Guide. ASR Automated Systems Research Inc. # Douglas Crescent, Langley, BC. V3A 4B6. Fax:
 Learning Guide ASR Automated Systems Research Inc. #1 20461 Douglas Crescent, Langley, BC. V3A 4B6 Toll free: 1-800-818-2051 e-mail: support@asrsoft.com Fax: 604-539-1334 www.asrsoft.com Copyright 1991-2013
Create a Happy Sun Character. Below is the final illustration we will be working towards.
 Create a Happy Sun Character Below is the final illustration we will be working towards. 1 Step 1 Create a new document and with the Ellipse tool (L), create an ellipse. 2 Step 2 Fill the ellipse with
Page 21 GRAPHING OBJECTIVES:
 Page 21 GRAPHING OBJECTIVES: 1. To learn how to present data in graphical form manually (paper-and-pencil) and using computer software. 2. To learn how to interpret graphical data by, a. determining the
AutoCAD LT 2009 Tutorial
 AutoCAD LT 2009 Tutorial Randy H. Shih Oregon Institute of Technology SDC PUBLICATIONS Schroff Development Corporation www.schroff.com Better Textbooks. Lower Prices. AutoCAD LT 2009 Tutorial 1-1 Lesson
Ms. Cavo Graphic Art & Design Illustrator CS3 Notes
 Ms. Cavo Graphic Art & Design Illustrator CS3 Notes 1. Selection tool - Lets you select objects and groups by clicking or dragging over them. You can also select groups within groups and objects within
Android User manual. Intel Education Lab Camera by Intellisense CONTENTS
 Intel Education Lab Camera by Intellisense Android User manual CONTENTS Introduction General Information Common Features Time Lapse Kinematics Motion Cam Microscope Universal Logger Pathfinder Graph Challenge
c) Save the document as taller3p1_tunombre
 Save the document as taller3p1_tunombre") WORKSHOP# 3 DRAW WITH INKSCAPE Preparing the page 1. Enter Inkscape and from the File menu, go to Document Properties. 2. Prepare a page with the following characteristics: a) Format A4 (millimeters as
WORKSHOP# 3 DRAW WITH INKSCAPE Preparing the page 1. Enter Inkscape and from the File menu, go to Document Properties. 2. Prepare a page with the following characteristics: a) Format A4 (millimeters as
Excel Tool: Plots of Data Sets
 Excel Tool: Plots of Data Sets Excel makes it very easy for the scientist to visualize a data set. In this assignment, we learn how to produce various plots of data sets. Open a new Excel workbook, and
Submittals Quick Reference Guide
 This topic provides a reference for the Project Center Submittals activity center. Purpose The Submittals activity center in Newforma Contract Management enables you to effectively log submittals and track
Appendix B: Autocad Booklet YR 9 REFERENCE BOOKLET ORTHOGRAPHIC PROJECTION
 Appendix B: Autocad Booklet YR 9 REFERENCE BOOKLET ORTHOGRAPHIC PROJECTION To load Autocad: AUTOCAD 2000 S DRAWING SCREEN Click the start button Click on Programs Click on technology Click Autocad 2000
Chief Architect X3 Training Series. Layers and Layer Sets
 Chief Architect X3 Training Series Layers and Layer Sets Save time while creating more detailed plans Why do you need Layers? Setting up Layer Lets Adding items to layers Layers and Layout Pages Layer
User Manual for HoloStudio M4 2.5 with HoloMonitor M4. Phase Holographic Imaging
 User Manual for HoloStudio M4 2.5 with HoloMonitor M4 Phase Holographic Imaging 1 2 HoloStudio M4 2.5 Software instruction manual 2013 Phase Holographic Imaging AB 3 Contact us: Phase Holographic Imaging
Quick Start Guide for the PULSE PROFILING APPLICATION
 Quick Start Guide for the PULSE PROFILING APPLICATION MODEL LB480A Revision: Preliminary 02/05/09 1 1. Introduction This document provides information to install and quickly start using your PowerSensor+.
SCRIVENER TUTOR SCRIVENER 102 Customizing Scrivener for the Advanced Writer
 SCRIVENER TUTOR SCRIVENER 102 Customizing Scrivener for the Advanced Writer Introduction I don t have to tell you that Scrivener is an amazing writing program--you know that because you re taking this
Creating Photo Borders With Photoshop Brushes
 Creating Photo Borders With Photoshop Brushes Written by Steve Patterson. In this Photoshop photo effects tutorial, we ll learn how to create interesting photo border effects using Photoshop s brushes.
Photoshop: a Beginner s course. by: Charina Ong Centre for Development of Teaching and Learning National University of Singapore
 Photoshop: a Beginner s course by: Charina Ong Centre for Development of Teaching and Learning National University of Singapore Table of Contents About the Workshop... 1 Prerequisites... 1 Workshop Objectives...
SolidWorks Part I - Basic Tools SDC. Includes. Parts, Assemblies and Drawings. Paul Tran CSWE, CSWI
 SolidWorks 2015 Part I - Basic Tools Includes CSWA Preparation Material Parts, Assemblies and Drawings Paul Tran CSWE, CSWI SDC PUBLICATIONS Better Textbooks. Lower Prices. www.sdcpublications.com Powered
FLAMING HOT FIRE TEXT
 FLAMING HOT FIRE TEXT In this Photoshop text effects tutorial, we re going to learn how to create a fire text effect, engulfing our letters in burning hot flames. We ll be using Photoshop s powerful Liquify
Importing and processing gel images
 BioNumerics Tutorial: Importing and processing gel images 1 Aim Comprehensive tools for the processing of electrophoresis fingerprints, both from slab gels and capillary sequencers are incorporated into
Hexagons for Art and Illusion Part II Get ready Start a new project FILE New Open Faced Cube Import the hexagon block LIBRARIES
 Hexagons for Art and Illusion Part II In our last lesson, we constructed the perfect hexagon using EasyDraw. We built a six pointed star, a solid faced cube, and put the cube inside the star. This lesson
Experiment 1 Introduction to MATLAB and Simulink
 Experiment 1 Introduction to MATLAB and Simulink INTRODUCTION MATLAB s Simulink is a powerful modeling tool capable of simulating complex digital communications systems under realistic conditions. It includes
The Revolve Feature and Assembly Modeling
 The Revolve Feature and Assembly Modeling PTC Clock Page 52 PTC Contents Introduction... 54 The Revolve Feature... 55 Creating a revolved feature...57 Creating face details... 58 Using Text... 61 Assembling