Catalogue 2018 Issue January POWER SIMPLY SAVE. Energy management, Power quality monitoring and analysis, Residual current monitoring (RCM)
|
|
|
- Hortense Short
- 6 years ago
- Views:
Transcription


1 Smart Energy & Power Quality Solutions Catalogue 2018 Issue January POWER SIMPLY SAVE Energy management, Power quality monitoring and analysis, Residual current monitoring (RCM)
2 Catalogue General information Janitza electronics Company profile 04 Communication: UMG selection schematic 18 Energy and power quality measurement products Energy management Software and IT solutions Industrial data communication Current / voltage transformers and sensors Accessories Power factor correction (PFC) and harmonics filters Services Technical annex Logistics information and T&Cs Page 04 Page 21 Measurement devices for DIN rail installation: UMG 103-CBM 25 I UMG I UMG 20CM 37 I UMG 604-PRO 45 I UMG 605-PRO 53 Measurement devices for front panel installation: UMG 96L / UMG I UMG 96RM 67 I UMG 96RM-E 75 I UMG 96-PA 83 UMG I UMG 509-PRO 97 I UMG I UMG 512-PRO 113 Mobile power quality analysers: MRG 96RM-E RCM Flex / MRG 512 PQ Flex 123 Page 129 MID energy meters 129 I Emax APP peak demand management 138 I ProData data logger 139 I Field bus modules series FBM 145 Janitza software and IT solutions 149 I System software GridVis 151 I Programming language Jasic 175 I APPs expansion with know -how 179 I Device homepage 190 Cloud solution for energy management I OPC server 195 I Database server 199 Industrial data communication 205 Current transformers 225 I Residual current transformer for RCM Monitoring 249 I Accessories 257 Accessories Integration and installation aids 265 Prophi power factor controller 271 I Universal capacitor monitoring system 287 I PFC power capacitors 289 I Automatic PFC systems without reactors 295 I Automatic de-tuned PFC systems 301 I Dynamic PFC systems (real time PFC) 309 I PFC spare parts and accessories 317 Services 323 Technical annex 337 Logistics information and T&Cs 421 Page 149 Page 205 Page 225 Page 265 Page 269 Page 323 Page 337 Page 421 2
3 Catalogue UMG 103-CBM UMG 104 UMG 20CM UMG 604-PRO/ UMG 605-PRO UMG 96L/ UMG 96 UMG 96RM/ UMG 96RM-E UMG 96-PA UMG 508 UMG 509-PRO UMG 511 UMG 512-PRO MRG 96RM-E RCMFlex / MRG 512 PQ Flex MID energy meters ProData FBM module EasyGateway EG400 GPS radio receiver Gateway MBUS-GEM PowerToStore DIN rail Ethernet switch D-SUB bus connector SMPS type power supply Industrial power supply TCL Isolating transformer JPC35 Multi Touch Moulded case current transformers Calibratable moulded case CTs Cable type split core current transformers Split core CT Flexible current transformer Differential current transformer Feedthrough residual CT Residual current Split-core current transformer type B+ transformers SC-CT-21 Voltage tap ZK4S, ZK4B Fused voltage tap ZK4/M6, ZK4/M8 Current transformer terminal block Prophi PFC power capacitors Automatic PFC without reactors Automatic de-tuned PFC Dynamic PFC 3

4 Janitza electronics William Thomson, Baron Kelvin known as Lord Kelvin, * 26th June 1824, 17th December 1907 IF YOU CAN T MEASURE IT, YOU CAN T IMPROVE IT 4


5 Janitza electronics MEASURE VISUALISE OPTIMISE TAKE THE FIRST STEP MEASURE YOUR ENERGY DATA CONTINUOUSLY AND RELIABLY WITH JANITZA ENERGY MEASUREMENT TECHNOLOGY. The advantages of qualified measurement: Increased safety Increase system availability Reduce the risk of fire Sustainable environmental relief Protect the environment through lower CO 2 emissions Enhance the company s image Greater efficiency Uncover potential cost savings Establish preconditions for tax savings Sustainably optimise processes Reduce energy costs Increase productivity Perform load curve analyses to reduce costs through the avoidance of load peaks Compliance with legal standards Energy management system: In accordance with DIN EN ISO Power quality: In order to ensure a reliable energy supply, various different standards around the world define different aspects of the "Power quality". MEASURE ON FIVE LEVELS Measure with system Measure from the supply right to the sub-distribution. Measure continuously! Only in this way are your values transparent and traceable. 1 Supply (PCC) LVDS Low voltage main distribution system Machine, building, cost centre Subdistribution Submeasurement UMG 512-PRO UMG 509-PRO UMG 96-PA UMG 604-PRO UMG 103-CBM Maximum transparency with Janitza energy measurement devices from the energy supplier to the sub-measurement. 5


6 Janitza electronics JANITZA ENERGY MEASUREMENT TECHNOLOGY LOG ENERGY DATA DISPLAY ENERGY CONSUMPTION REDUCE COSTS Nowadays, energy management is not only relevant for the environment and for society but is also a critical competitive factor. Only those who can keep a close eye on their energy consumption can reduce costs and increase energy efficiency. To ensure optimum use of the measurement devices, Janitza offers the corresponding accessories and tailored software solutions and services an optimally tailored portfolio for efficient energy management. Company based in Lahnau. Made in Germany FUTURE WITH TRADITION The company We develop and manufacture in the Hessian city of Lahnau, between Wetzlar and Gießen. Our hardware and software products are always ahead of their time - and have been for more than half a century now. We introduce new technologies and combine existing applications to form convincing, intelligent products. Eugen Janitza GmbH, founded in 1961, went on to produce an independent subsidiary company in 1986: Janitza electronics GmbH. Under the management of Markus Janitza. Just two years after its establishment, Janitza presented the world's first electronic reactive consumption controller with harmonic limit values and automatic step switching. Managing director Markus Janitza. 6
7 Janitza electronics Our portfolio Your secure, sustainable and efficient handling of electrical energy is our top priority. The comprehensive Janitza product portfolio ranges from the current transformer and measurement device, from the communications devices and the IT environment, right through to software solutions and databases including data analyses. After formulating the technical solution, on request Janitza provides support throughout the entire product life cycle. This includes commissioning, instructing personnel, delivering regular training, as well as the maintenance and support of the systems. GLOBAL PROJECTS LOCAL SUPPORT With reference projects spread across all continents, we cover all important market segments such as building management, energy suppliers, industry and infrastructure. Our markets 60 countries various market segments With local sales partners, Janitza carries out projects around the world in the areas of energy management, power quality and residual current monitoring. In doing so, it is particularly important to us to be able to provide direct local support to the customer. Alongside sophisticated logistics, our customers also benefit from comprehensive services, such as technical consultancy and development of customer-specific monitoring solutions, commissioning, employee training, analyses of the measurement data and regular maintenance of the systems. For more information visit 7
8 Janitza electronics ENERGY MEASUREMENT TECHNOLOGY WITH VISION ONE SYSTEM THREEFOLD BENEFITS Energy management, power quality monitoring and residual current monitoring in a single system environment. That is what the comprehensive Janitza product range stands for. The software and hardware components are optimally tailored to one another. Profit from our total competence and comprehensive services across the entire product life cycle. Further information on our products, software solutions and services, as well as interesting practical examples, can be found on our website We look forward to hearing from you! Janitza GridVis Network visualisation software MADE IN GERMANY Janitza energy measurement devices 1. Energy management (per DIN EN ISO 50001) 2. Power quality monitoring 3. Residual current monitoring / fault current monitoring (RCM) Reduces CO 2 emissions High-availability power supply Minimum effort for DGUV V3 Reduces energy costs Reduces downtimes Improves supply reliability Improves energy efficiency Optimises maintenance Identifies insulation faults faster Improves fire protection Energy management DIN EN ISO Power quality DIN EN Residual current monitoring (RCM) 8

9 Janitza electronics Energy management DIN EN ISO ENERGY MANAGEMENT SYSTEMS The reduction in energy costs can be a significant competitive factor, because in many industry sectors the energy costs constitute a relevant item on the company results. In this regard, the ISO standard aims to establish the framework conditions for an operational energy management system. Energy flows must be made transparent and they must be analysed, in order to sustainably save costs and decisively reduce energy consumptions and CO 2 emissions. It is also possible to identify problems in the energy supply with an energy management system. In response to these requirements, Janitza has developed the ISO certified GridVis software. The software offers the user the tool required for establishing an efficient, manageable and consistent energy management system. In this way, measures can be developed for the improvement of the energy efficiency of processes, systems and devices with the help of the measured data provided. The effect of the implemented measures is continuously monitored by the energy monitoring system, the results are verified for example with the help of key figures (KPIs) and quantity flow diagrams (Sankey). Energy management systems increase the (energy) efficiency of processes, systems and devices (ISO 50001, VDE ): Continuous energy monitoring helps with the rapid identification of significant deviations in the power supply. Furthermore, this monitoring also supports fulfilment of the taxation and regulatory aspects (German law on renewable energy sources, peak balancing per German electricity tax law, etc.). Through transparent energy flows it is possible to reduce the costs, minimise maintenance outlay and identify energy-intensive consumer devices: The visible reduction of energy consumptions and CO 2 emissions makes a contribution to environmental protection: MID-compliant devices from Janitza can be used in combination with GridVis software for cause-related cost centre management. MID is a measuring instruments directive of the European Parliament, which includes such requirements as manipulation security and therefore provides legal certainty. GridVis KPI example key figures are an important instrument for the energy manager 9

10 Janitza electronics Power quality DIN EN POWER QUALITY System assurance and highly-availability power supply Continuous monitoring of the power quality in all technical systems per IEC is essential, in order to avoid unnecessary repair costs and production downtimes. The voltage in the grid nowadays is far removed from the ideal sinusoidal waveform. Voltage interruptions, transients, harmonics, flickers or start-up currents: Various different "grid feedback effects" change the sinusoidal character of the currents and thus also the power quality. Impermissible electrical loading and increased thermal losses are then a daily occurrence. This can result in the equipment operating in a restricted manner or its service life being adversely affected. This risks a production failure. Detect grid feedback effects promptly Solid power quality management measures the power quality continuously, analyses the acquired data and highlights the central starting points for optimisation. In doing so, it also pursues the objective of reducing maintenance costs. For example, the class A power quality analyser UMG 512-PRO enables the power quality to be monitored in accordance with the established standards, such as EN 50160, IEEE 519 or EN In addition, the device also measures flicker and harmonics up to the 63rd harmonic. The UMG 509-PRO also continuously monitors the power quality and provides analysis of electrical disturbances in the event of network problems. On the lower network levels, the UMG 96RM serves to record energy consumers and standard variables, as well as further basic power quality parameters. PQ reports with the GridVis monitoring software With the aid of meaningful reports, Janitza s TÜV-approved software GridVis delivers sound and comprehensible information on the power quality. The GridVis reporting system is the heart of the network analysis. The PQ reports provide a rapid overview of any standard and threshold value infringements that arise. Furthermore, they show whether the power quality is adequate or not within the time period in question. The traceability and tracking of the measured values is assured with the GridVis software. Legal certainty is provided. Secure, highly-availability power supply Assured quality of the electrical energy through continuous monitoring and analysis. Avoidance of overload situations Avoidance of production stoppages Maximisation of operating times Ensuring product quality/stable processes Production-related quality assurance by monitoring the local power quality. Optimisation of the maintenance costs GridVis PQ Heatmap 10


11 Janitza electronics Residual current monitoring (RCM) RESIDUAL CURRENT MONITORING (RCM) Safe modular future-oriented Residual current monitoring (RCM) plays a decisive role in high-availability power supply systems. Constant measurement and early warnings can enable the rapid and direct localisation of faults and insulation problems. This applies in particular to quietly rising residual currents (e.g. triggered by an insulation fault), overly high operating currents and any other overloading of system parts and consumers. This not only protects against risks of fire but also increases the system availability. In this way, it is frequently possible to avoid costly shutdowns through residual current circuit breakers (RCD) and minimise servicing costs. With an electrical system or static operating equipment, complex insulation measurements within the framework of DGUV V3 are superfluous and this results in a significant reduction in testing outlay. Early alerts in the event of a possible overload Increased system and operational certainty Reduction in servicing costs Avoiding the risk of fire Significant outlay reduction with DGUV V3 testing GridVis RCM report L3 L2 L1 N Energy, operating current, PQ Total current measurement (RCM) of residual current Measurement of the central ground point TN-S system (5-conductor network) Basic precondition for the safe operation of IT equipment, machinery and networked systems including residual current monitoring 11


12 Janitza electronics MAXIMUM TRANSPARENCY JANITZA SOFTWARE SOLUTIONS Janitza GridVis software, the Janitza APPs and the Janitza energy portal make energy data transparent and therefore form a decision-making basis for implementing measures for the optimisation of energy efficiency and power quality. Energy data can be called up any time and anywhere, online through the GridVis network visualisation software and the energy portal. The APPs simplify the devices in terms of reading out, processing and visualising the energy data. These can be interrogated via a browser. The Janitza Cloud solution The cloud-based energy portal saves the customer acquisition and operating costs for software, database, server, and maintenance. It guarantees the highest levels of data security and more than anything else, is simple to use. The system architecture is flexible, scalable and can be individually configured. This enables the optimising of energy efficiency in the company, on the basis of key figures and their progressions but also the current, gas and water consumption. APPs Network visualisation software for energy management systems and power quality monitoring Cloud solution for energy management (SaaS) Software expansions with know-how 12
13 Janitza electronics GridVis NETWORK VISUALISATION Janitza GridVis version 7.2 is a powerful, user-friendly software solution for the development of energy, RCM and power quality monitoring systems. Alongside the programming and configuration of the Janitza measurement devices, the software can also be used for the documentation (reporting), as well as read-out, saving, display, processing and analysis of the measured data. With this, the comprehensive and scalable GridVis is a software solution for energy suppliers, industrial applications, facility management applications, the building market and infrastructure projects. Energy saving potentials can be highlighted, energy costs reduced, production downtimes avoided and the utilisation of production resources optimised. GridVis highlights Configuration of the measurement system and the UMG measurement devices Time planning with time period definition for time-controlled alarms, tariff formation and key figures formation Generic modbus devices, virtual meters Dashboards (individual web page customisation with widgets) Dashboard standard templates for GridVis Energy Various widget and dashboard functional expansions for GridVis Energy Automatic read-out of the measuring data from the device memory, alternatively cyclical querying possible through online recording (polling) Automatic CSV data import (e.g. for unit quantities, sales figures, energy meters without interface, etc.), e.g. for KPI calculations Minimum, average and maximum values can be displayed in a graph Real-time data and indicator function Manual or time-controlled reports PQ reports for freely configurable threshold values, annual assessments per EN50160, Heatmap and assessment functions RCM report, designed for the assessment of residual current infringements Saving the data in a central database including database management (e.g. MySQL / MS SQL / Janitza DB) Key figure evaluation (KPI) Sankey diagram (graphical representation of quantity flows) 13

14 ENERGY MONITO Janitza electronics MADE IN Digital integrated measurement devices Individual, tailored solutions for RCM, energy and power quality measurement technology to meet every requirement Energy measurement devices GridVis network visualisation software Software for the development of an RCM, energy and power quality monitoring system. Both PC and web-based solutions are available. GridVis Energy-Portal (SaaS) The Cloud solution for your energy management Energy portal APPs Software-based developments with 'know-how' APPs 14

15 Janitza electronics RING SYSTEMS GERMANY MADE IN GERMANY Log energy data, display energy consumption, reduce costs Nowadays, energy management is not only relevant for the environment and for society but is also a critical competitive factor. Only those who can keep a close eye on their energy consumption can reduce costs and increase efficiency. To ensure optimum use of the measurement devices, Janitza offers the corresponding accessories and tailored software a complete package that guarantees efficient energy management. For more information visit our website at Current transformer Current transformers The link between heavy current and digital technology Service Commissioning Service Janitza provides support with the selection, maintenance and support of the systems. Our website offers comprehensive information on products, software solutions and services with many practical examples and background information. Commissioning Commissioning of the monitoring systems Training Training Training of the personnel 15
16 Janitza electronics STANDARDISED SPECIFICATIONS DIN EN Energy audit Defines the requirements for an energy audit One-off acquisition/analysis of the energy consumption Obligation for all non SMEs since 2015 DIN EN ISO Energy management systems Specifications for systematic energy management Precondition for the partial release of energy-intensive companies from the German law on renewable energy sources DIN VDE Energy efficiency in low voltage systems Directive for planning energy distribution, also applies for retrofits to older systems Prescribes the use of energy measurement technology in all energy distribution systems DGUV V3 Operating equipment testing Insulation testing: Can be minimised with continuous documentation of the residual currents EN Power quality standard for energy suppliers Incoming goods inspection - current Enforceable product liability standard EN Power quality standard within companies Threshold values for the loads of electronic components, caused by grid feedback Key phrase: Warranty claims DIN VDE Energy efficiency in low voltage distribution systems Valid and binding since December 2015 Electrical and practical supplement to ISO Valid for new systems and the updating of older systems Measurement, monitoring and control of: Consumptions, load management, power quality, harmonics, voltage drop, optimum load utilisation of transformers (25-50%), reactive power load Recording the measured values = Basis for planning expansions 16


17 WE MAKE ENERGY VISIBLE 17

18 Chapter 01 UMG selection schematic UMG selection assistance Which measurement device for my task? PQ Class A IEC No RCM Residual current monitoring No Yes Class 0.2 Yes 6 current channels 6 current channels 20 current channels 6 current channels 6 current channels 6 current channels Ethernet Modbus Profibus Jasic Homepage Ethernet Modbus Profibus Jasic Homepage Ethernet Modbus Profibus Jasic Homepage Modbus Ethernet Modbus Homepage Ethernet Modbus Profinet Jasic Homepage Ethernet Modbus UMG 511 UMG 512-PRO UMG 509-PRO UMG 20CM UMG 96RM-E UMG 96RM-PN UMG 96-PA with module Yes MID for billing purpose No Events, Ethernet, Jasic, Homepage & Gateway No With Measured data memory Ja No Yes 1-phase or 3-phase Waveform, Flicker & Klasse S, IEC Modbus Modbus Profibus 1-phase 3-phase 3-phase Yes No 20 channels MID energy meter 1-phase MID energy meter 3-phase UMG 96-PA (MID) Ethernet Ethernet Modbus Modbus Profibus Profibus Jasic Jasic Homepage Homepage UMG 605-PRO UMG 604-PRO UMG 20CM UMG 103-CBM UMG
19 Chapter 01 UMG selection schematic DIN rail mounting or front panel installation Front panel Measured data memory No Yes DIN rail Ethernet Yes Events, Homepage & Gateway No Yes Class 0,2S Ethernet Profibus Modbus Jasic Class 0,5S Ethernet Modbus Class 0,5S Ethernet Modbus Profibus Modbus USB Modbus USB Modbus UMG 508 UMG 96RM-E UMG 96-PA UMG 96RM-P UMG 96RM-CBM UMG 96-PA with module without module Ethernet TCP/IP M-Bus Modbus Profinet UMG 96RM-EL UMG 96RM-M UMG 96RM UMG 96RM-PN 19
20 02 Energy and power quality measurement products UMG 103-CBM / UMG 104 Compact universal measurement device for DIN rail mounting without display Communication via RS485 Modbus RTU Continuous sampling of the voltage and current measurement inputs Page 25 UMG 20CM (Branch Circuit Monitoring Device) Operating current and residual current monitoring device (RCM Residual Current Monitor) 20 current and 3 voltage measurement channels RS485 interface and Modbus protocol Page 37 UMG 604-PRO / UMG 605-PRO Power analyser for DIN rail mounting with Ethernet, Profibus and integrated homepage Master device for energy management systems, extensive Power Quality measurements Flicker measurement in accordance with DIN EN (UMG 605-PRO) Page 45 UMG 96L / UMG 96 Integrated universal measurement devices without interface Compact construction with low installation depth (96 x 96 x 42 mm) Replaces up to 13 analogue measurement devices Page 61 UMG 96RM / UMG 96RM-E Compact multifunction measurement device for energy measurement with various interfaces and protocols Powerful microprocessor and high sampling rate for maximum measurement accuracy Recording of energy data and load profiles for energy management systems (e.g. ISO 50001) Page 67 UMG 96-PA Modular energy measurement device Four functions one solution: Energy management, MID, Power Quality and RCM monitoring Each 3 digital inputs and outputs as well as an analogue output Measurement of current and voltage parameters and RCM measurement UMG 508 Multifunctional power analyser with Ethernet and BACnet (optional) Colour graphical display with intuitive user guidance Large measured data memory of 256 MB Page 83 Page 91 UMG 509-PRO High-performance power quality analyser with RCM Residual Current Monitor Fourier analysis 1st to 63rd harmonic Continuous measurement with an energy accuracy class of 0,2S Page 97 UMG 511 Class A power quality monitoring device (certified per IEC ) Acquisition of all power quality parameters, e.g. harmonics up to 63rd, flicker, short-term interruptions, etc. Ethernet, integrated homepage, Modbus, Jasic programing, PQ reporting, BACnet (optional) Page 103 UMG 512-PRO Class A power quality monitoring device (certified per IEC ) Application as residual current monitoring device (RCM Residual Current Monitoring) Registration of all power quality parameters, e.g. harmonics up to the 63rd, flicker, short interruptions and so on Ethernet, integrated Homepage, Modbus, Jasic programming, PQ reporting, BACnet (optional) MRG 96RM-E RCM Flex / MRG 512-PRO PQ Flex Mobile energy measurement devices / power quality analysers Acquisition and long-term recording of load profiles as well as power quality measured values Analyzing of power supplies in accordance with EN as well as internal networks per EN Page 113 Page


21 Chapter 02 Energy and power quality measurement products ENERGY AND POWER QUALITY MEASUREMENT PRODUCTS 21
22 Chapter 02 Overview of UMG measurement devices UMG 104 UMG 20CM UMG 604-PRO Type UMG 103-CBM UMG 605-PRO UMG 96L P E EP Item number Network voltages Rated voltage L-N, AC 277 V 277 V 277 V 277 V 277 V 255 V* 2 Rated voltage L-L, AC 480 V 480 V 480 V 480 V 480 V 442 V* 2 Overvoltage category 300 V CAT III 300 V CAT III 300 V CAT III 300 V CAT III 300 V CAT III 300 V CAT III Operating voltage L-N, AC V V* 4 Power supply voltage V AC; V AC; V AC; V AC; - (measuring voltage) V DC * V DC V DC * V DC *1 - Three wire / four wire (L-N, L-L) - / / - / / / - / Quadrants * 3 Sampling frequency 50/60 Hz Measurement points per second 5,4 khz khz khz khz khz ,5 / 3 khz 50 Uninterrupted measurement - Measurement results per second Effective value from periods (50 / 60 Hz) 10 / / / / / 12 1 / 1 Residual current measurement Harmonics V/A Distortion factor THD-U in % - Distortion factor THD-I in % - Unbalance Positive / negative / zero sequence component - - Present flicker strength Short-/long-term flicker Transients µs 50 µs - Short-term interruptions, events Accuracy V / A 0.2 % 0.2 % / 0.25 % 1 % 0.2 % / 0.25 % 0.2 % / 0.25 % 1 % Effective power class 0,5S (.../5 A) 0,5S (.../5 A) 1 0,5S (.../5 A) / 1 (.../1 A) 0,5S (.../5 A) 2 Operating hours counter - Weekly timer Jasic Jasic - Digital inputs Digital / pulse output Current measurement channel Temperature input Integrated logic - Vergleicher - Jasic (7 Prg.) Jasic (7 Prg.) - Minimum and maximum values for memory Memory size for onboard recording 4 MB Flash 4 MB Flash 768 kb 128 MB Flash 128 MB Flash - Number of memory values 160 k 156 k 250 k k k - Clock - Bi-metallic function - Error / event recorder function Peak demand management * 2 * 2 - Software for energy management & GridVis power quality analysis -Basic GridVis -Basic GridVis -Basic GridVis -Basic GridVis -Basic - Interfaces RS RS485 - USB Profibus DP M-Bus Ethernet Webserver / / / - Protocols Modbus RTU - Modbus-Gateway Profibus DP V Modbus TCP/IP, Modbus RTU over Ethernet, SNMP BACnet (optional) *2 * Profinet Catalogue page Comment: For detailed technical information please refer to the respective operation manual and the Modbus address list. : Included - : Not included * 1 Other voltages are also available as options * 2 Option * 3 Not for effective energy and reactive energy * 4 In the 230 V version
23 Chapter 02 Overview of UMG measurement devices UMG UMG 96RM P M E CBM EL UMG 96-PA UMG 96RM-PN UMG 508 UMG 509-PRO UMG 511 UMG 512-PRO V* V 417 V 277 V 417 V 417 V 417 V 347 V 476 V* V 720 V 480 V 720 V 720 V (3-Leiter 600 V) 720 V 600 V 300 V CAT III 300 V CAT III 600 V CAT III 300 V CAT III 600 V CAT III 600 V CAT III 600 V CAT III 600 V CAT III V* V AC; V AC; V AC; V AC; V AC; V AC; V AC; V DC V DC V DC V DC * V DC * V DC * V DC *1 - / / - / / / / / / 4* ,5 / 3 khz 50 21,33 / 25,6 khz / ,33 khz ,33 / 25,6 khz / khz khz khz ,6 khz / 1 10 / / / / / / / µs 50 µs 50 µs 39 µs % 0.2 % / 0.2 % 0,2 % 0.2 % / 0.2 % 0.1 % / 0.2 % 0.1 % / 0.2 % 0.1 % / 0.2 % 0.1 % / 0.1 % 2 0,5S (.../5 A) 0,5S (.../5 A) 0,5S (.../5 A) / 1 (.../1 A) 0,2S (.../5 A) 0,2S (.../5 A) 0,2S (.../5 A) 0,2S (.../5 A) (3)* (3)* (5)* (5)* 5 * * * Vergleicher Vergleicher Vergleicher Vergleicher Jasic Jasic Jasic Jasic - 4 MB Flash 256 MB 256 MB 256 MB 256 MB MB k MB k 256 MB k k k k k k * 2 - * GridVis -Basic GridVis -Basic GridVis -Basic GridVis -Basic GridVis -Basic GridVis -Basic GridVis -Basic / / - / / / / * 7 - * * * 2 * 2 * 2 * * 5 Combination options for the inputs and outputs: a) 5 Digital outputs; b) 2 Digital outputs and 3 Digital inputs * 6 Combined function: Selectable analogue / temperature / residual current input * 7 No SNMP protocol * 8 2 pulse outputs * 9 SNMP only for internal Profinet communication 23


24 Chapter 02 Energy and power quality measurement products Ethernet level (TCP/IP) Server SQL database Client 1 to... Mobile Web server Network analysis software ProData UMG 511 / 512-PRO UMG 508 / 509-PRO UMG 96-PA with module UMG 96RM-E UMG 604-PRO UMG 605-PRO Fieldbus level (e.g. Modbus RTU) UMG 20CM ProData UMG 104 UMG 96RM UMG 96-PA UMG 103-CBM Analogue / status / pulse input level Water meter Status message Gas meter Alarm lamp Temperature measurement UMG 508 / UMG 509-PRO / UMG 604-PRO = Janitza power analyser UMG 511 / UMG 512-PRO / UMG 605-PRO = Janitza power quality analyser UMG 96RM / UMG 96RM-E / UMG 96-PA / UMG 103-CBM / UMG 104 = Janitza multifunction energy meters UMG 20CM = Janitza 20 channel branch circuit monitoring device, for residual current monitoring (RCM) and energy data acquisition 24
 Current: 0.5 % Voltage: 0.")
25 Chapter 02 UMG 103-CBM UMG 103-CBM Universal measurement device for DIN rails Harmonics GridVis Analysis software Modbus interface Measurement accuracy 0.5 Communication Protocols: Modbus RTU / Slave Interface RS485 Accuracy of measurement Energy: Class 0.5S ( / 5 A) Current: 0.5 % Voltage: 0.2 % Power quality Harmonics up to 25th order, odd harmonics Distortion factor THD-U Distortion factor THD-I Memory 4 MB Networks TN, TT networks Network visualisation software Free GridVis -Basic 25


26 Chapter 02 UMG 103-CBM Areas of application Measurement and checking of electrical characteristics and energy consumption in energy distribution systems Cost centre management Threshold value monitoring, measured value transducer for building management systems or PLC Monitoring of harmonics Main features Power quality Harmonics analysis up to 25th harmonic, odd harmonics Distortion factor THD-U / THD-I Minimum and maximum values Measurement of positive, negative and zero sequence component Fig.: GridVis Harmonics analysis (FFT) Features 3 Voltage measurement inputs (300 V CATIII) 3 Current measurement inputs Continuous sampling of voltage and current measurement inputs Measurement of the reactive distortion power Sampling frequency 5.4 khz Transfer of the measured values via a serial interface Supply voltage via measurement voltage L1-N, L2-N and L3-N Fig.: GridVis Device dashboard with energy analysis Dimension diagrams All dimensions in mm C A B Front view Side view 26
27 Chapter 02 UMG 103-CBM Typical connection Data GND A B A B RS485 UMG 103-CBM Mess- und Versorgungsspannung Measuring and supply voltage Strommessung Current measurement Verbraucher Load Device overview and technical data UMG 103-CBM Item number Measured voltage (L-N/L-L) Operating voltage (from 3-phase network) General Use in low and medium voltage networks 277 / 480 V AC V AC Accuracy voltage measurement 0.2 % Accuracy current measurement 0.5 % Accuracy active energy (kwh, /5 A) Class 0.5S Number of measurement points per period 108 Uninterrupted measurement RMS - momentary value Current, voltage, frequency Active, reactive and apparent power / total and per phase Power factor / total and per phase Energy measurement Active, reactive and apparent energy [L1,L2,L3, L1-L3] Number of tariffs 4 Recording of the mean values Voltage, current / actual and maximum Active, reactive and apparent power / actual and maximum Frequency / actual and maximum Demand calculation mode (bi-metallic function) / thermal Comment: For detailed technical information please refer to the operation manual and the Modbus address list. = included - = not included 27
28 Chapter 02 UMG 103-CBM UMG 103-CBM Ethernet Ethernet Switch UMG 604-PRO RS485 Fig.: Connection of multiple UMG 103-CBMs to a PC via a UMG 604-PRO (with Ethernet option) UMG 103-CBM Other measurements Operating hours measurement Power quality measurements Harmonics per order / current 1st 25th Harmonics per order / voltage 1st 25th Distortion factor THD-U in % Distortion factor THD-I in % Current and voltage, positive, zero and negative sequence component Measured data recording Current measurement channels 3 Recording time up to 144 days Memory (Flash) 4 MB Battery BR1632 A Clock Average, minimum, maximum values Communication Interfaces RS485: Autobaud, kbps (Screw-type terminal) Protocols Modbus RTU Software GridVis -Basic *2 Online graphs Databases (Janitza DB, Derby DB) Manual reports (energy, power quality) Topology views Manual read-out of the measuring devices Graph sets Programming / threshold values / alarm management Comparator (2 Groups with 3 comparators each) Technical data Type of measurement Constant true RMS up to 25th harmonic Nominal voltage, three-phase, 4-conductor (L-N, L-L) 277 / 480 V AC (+ 10%) Measurement in quadrants 4 Networks TN, TT Measured voltage input Overvoltage category 300 V CAT III Measured range, voltage L-N, AC (without potential transformer) Vrms (± 10%) Measured range, voltage L-L, AC (without potential transformer) Vrms (± 10%) Resolution 0,01 V Frequency measuring range Hz Leistungsaufnahme 1,5 VA Power consumption 4 kv Sampling frequency 5,4 khz / Phase Measured current input Rated current 1 / 5 A Resolution 0,1 ma Measurement range 0,005 6 Arms Overvoltage category 300 V CAT III Measurement surge voltage 2 kv Power consumption ca. 0,2 VA (Ri = 5 mohm) Overload for 1 sec. 60 A (sinusoidal) Sampling frequency 5,4 khz / Phase Mechanical properties Weight 200 g Device dimensions in mm (H x W x D) approx. 98 x 71,5 x 46 Protection class per EN IP20 Assembly per IEC EN / DIN EN mm-DIN rail Connecting phase (U / I), Single core, multi-core, fine-stranded Terminal pins, core end sheath 0,08 bis 2,5 mm² 1,5 mm² 28
29 Chapter 02 UMG 103-CBM NSHV UMG 604-PRO Modbus / RS485 UMG 103-CBM UMG 103-CBM Kitchen Office Lift Fig.: Topology example UMG 604-PRO (Master) UMG 103-CBM (Slave) Interface converter RS232 / RS485 or USB / RS485 UMG 103-CBM Environmental conditions Temperature range Operation: K55 ( C) Relative humidity Operation: 5 to 95 % (at 25 C) Operating height ,000 m above sea level Degree of pollution 2 Installation position user-defined Electromagnetic compatibility Electromagnetic compatibility of electrical equipment Directive 2004/108/EC Electrical appliances for application within particular voltage limits Directive 2006/95/EC Equipment safety Safety requirements for electrical equipment for measurement, regulation, control and laboratory use IEC/EN Part 1: General requirements Part 2-030: Particular requirements for testing and measuring circuits IEC/EN Noise immunity Industrial environment IEC/EN Electrostatic discharge IEC/EN Voltage dips IEC/EN Emissions Class A: Residential environment IEC/EN RFI Field Strength 30 1,000 MHz IEC/CISPR11/EN Radiated interference voltage MHz IEC/CISPR11/EN Safety Europe CE labelling USA and Canada UL variants available Firmware Update via GridVis software. Firmware update Firmware download (free of charge) from the website: * 1 Optional additional functions with the packages GridVis -Professional, GridVis -Service and GridVis -Ultimate. * 2 UMG 103-CBM UL certification requested Comment: For detailed technical information please refer to the operation manual and the Modbus address list. = included - = not included Fig.: Connection of a UMG 103-CBM to a PC via an interface converter 29

30 Chapter 02 UMG 103-CBM Typical application illustration with 2 supplies GridVis -Software 13,8 kv Ethernet 13,8 kv Ethernet Switch T kva T kva Ethernet UMG 604E-PRO UMG 604E-PRO 380 V / 50 Hz RS485 Modbus UMG 103-CBM 1 UMG 103-CBM 2 UMG 103-CBM 3 UMG 103-CBM V / 50 Hz RS485 Modbus UMG 103-CBM 1 UMG 103-CBM 2 UMG 103-CBM 3 UMG 103-CBM Fig.: Typical application illustration with 2 supplies, UMG 604-PRO as master measurement device in the main power supply and UMG 103-CBM for measuring the low voltage feeder. 30
31 Chapter 02 UMG 104 UMG 104 Energy measurement device for DIN rails Harmonics Temperature input Measurement accuracy 0.5 Memory 4 MByte Communication Profibus (DP / V0 optional) Modbus RTU Power quality Harmonics up to 40th harmonic Unbalance, rotary field indication Distortion factor THD-U / THD-I 2 digital inputs Pulse input Signalling input logic State monitoring Interfaces RS232 RS485 Accuracy of measurement Energy: Class 0.5S ( / 5 A) Current: 0.2 % Voltage: 0.2 % Networks IT, TN, TT networks 3 and 4-phase networks Up to 4 single-phase networks Temperature measurement PT100, PT1000, KTY83, KTY84 2 digital outputs Pulse output kwh / kvarh Switch output Threshold value output Logic output Measured data memory 4 MByte Flash (156,000 measured values) Network visualisation software Free GridVis -Basic 31


32 Chapter 02 UMG 104 Areas of application Consumption data acquisition and evaluation (load profiles, load curves) Continuous power quality monitoring Cost centre accounting of energy costs Network protection Measured value transducer for building management systems or PLC Main features Power quality Harmonics analysis up to 40th harmonic Unbalance Rotary field indication Distortion factor THD-U / THD-I Measurement of positive, negative and zero sequence component High-speed Modbus Fig.: GridVis Phasor diagram Fast and reliable data exchange via RS485 interface Speed up to kb/s Secure and rapid communication via Modbus and Profibus Rapid, cost-optimised and reliable communication in existing Fieldbus architectures Integration in PLC systems and building management systems High flexibility due to the use of open standards High-speed Modbus Large measurement data memory 4 MByte 156,000 saved values Recording range dependent on the user-defined measurement data memory configuration over a few months Recording freely configurable Fig.: High-speed Modbus 32
33 Chapter 02 UMG 104 Added value through additional functions The UMG 104 goes far beyond the limits of digital multifunction measurement devices thanks to the integration of additional functions: Multifunction measurement device State monitoring Data logger Meters (kwh, kvarh) Temperature monitoring Harmonics analyser UMG 104 Fig.: Large measurement data memory Due to the four current and voltage inputs there are also particular advantages with the monitoring of up to four singlephase outputs, e.g. in data centres, offices or single-phase motor outputs. Dimension diagrams All dimensions in mm 73 mm 10 mm 44 mm 35 mm 90 mm 90 mm 107,5 mm 50 mm 76 mm 82 mm Front view Side view 33
34 Chapter 02 UMG 104 Typical connection UMG104 Profibus connector Terminating resistors D-sub, 9 pin, socket D-sub, 9 pin, connector Load Screw-type terminals Other profibus sations Device overview and technical data UMG 104 UMG 104P Item number Item number (UL) Supply voltage AC V AC V AC V AC V AC Supply voltage DC V DC V DC V DC V DC Communication Interfaces RS485: kbps (Screw-type terminal) RS232: kbps (Screw-type terminal) Profibus DP: Up to 12 Mbps (DSUB-9-socket) General Use in low and medium voltage networks Accuracy voltage measurement 0.2 % Accuracy current measurement 0.25 % Accuracy active energy (kwh, /5 A) Class 0.5S Number of measurement points per period 400 Uninterrupted measurement RMS - momentary value Current, voltage, frequency Active, reactive and apparent power / total and per phase Power factor / total and per phase Comment: For detailed technical information please refer to the operation manual and the Modbus address list. = included - = not included An RS232 connecting cable is not included in the delivery and must be ordered separately as item no
35 Chapter 02 UMG 104 UMG104 D-sub, 9 pin, socket D-sub, 9 pin, connector Profibus connector Terminating resistors Screw-type terminals Fig.: Profibus connector, contact allocation kwh, C, kw UMG 104 Modbus Other profibus sations Fig.: Word-wide remote monitoring of the energy consumption and temperature for various different locations Comment: For detailed technical information please refer to the operation manual and the Modbus address list. = included - = not included UMG 511 Internet * 1 Optional additional functions with the packages GridVis -Professional, GridVis -Service and GridVis -Ultimate. Ethernet Energy measurement Active, reactive and apparent energy [L1,L2,L3, L4, L1 L3, L1 L4] Recording of the mean values Voltage, current / actual and maximum Active, reactive and apparent power / actual and maximum Frequency / actual and maximum Demand calculation mode (bi-metallic function) / thermal Other measurements Clock Power quality measurements Harmonics per order / current and voltage 1st 40th Harmonics per order / active and reactive power 1st 40th Distortion factor THD-U in % Distortion factor THD-I in % Voltage unbalance Rotary field indication Current and voltage, positive, zero and negative sequence component Measured data recording Memory (Flash) 4 MB Average, minimum, maximum values Measured data channels 4 Alarm messages Time stamp Time basis average value freely user-defined RMS averaging, arithmetic Displays and inputs / outputs LCD display Digital inputs 2 Digital outputs (as switch or pulse output) 2 Thermistor input (PT100, PT1000, KTY83, KTY84) Voltage and current inputs every 4 Password protection Communication Protocols Modbus RTU / Profibus DP V0 - / Software GridVis -Basic *1 Online graphs Databases (Janitza DB, Derby DB); MySQL, MS SQL with higher GridVis versions) Manual reports (energy, power quality) Topology views Manual read-out of the measuring devices Graph sets Programming / threshold values / alarm management Comparator (2 Groups with 4 comparators each) Technical data Type of measurement Constant true RMS Up to 40th harmonic Nominal voltage, three-phase, 4-conductor (L-N, L-L) 277 / 480 V AC Nominal voltage, three-phase, 3-conductor (L-L) 480 V AC Measurement in quadrants 4 Networks TN, TT, IT Measurement in single-phase / multi-phase networks 1 ph, 2 ph, 3 ph, 4 ph and up to 4 times 1 ph Measured voltage input Overvoltage category 300 V CAT III Measured range, voltage L-N, AC (without potential transformer) Vrms Measured range, voltage L-L, AC (without potential transformer) 18 1,000 Vrms Resolution 0.01 V Impedance 4 MOhm / phase Frequency measuring range Hz Power consumption approx. 0.1 VA Sampling frequency 20 khz / phase 35
36 Chapter 02 UMG 104 Measured current input Rated current 1 / 5 A Resolution 1 ma Measurement range Amps Overvoltage category 300 V CAT III Measurement surge voltage 4 kv Power consumption approx. 0.2 VA (Ri = 5 MOhm) Overload for 1 sec. 100 A (sinusoidal) Sampling frequency 20 khz Digital inputs and outputs Number of digital inputs 2 Maximum counting frequency 20 Hz Input signal present V DC (typical 4 ma) Input signal not present V DC, current < 0.5 ma Number of digital outputs 2 Switching voltage max. 60 V DC, 30 V AC Switching current max. 50 ma Eff AC / DC Pulse output (energy pulse) max. 20 Hz Maximum cable length up to 30 m unscreened, from 30 m screened Mechanical properties Weight 350 g Device dimensions in mm (H x W x D) 90 x x approx. 82 Battery Type Lithium CR2032, 3 V Protection class per EN IP20 Assembly per IEC EN / DIN EN mm DIN rail Connecting phase (U / I), Single core, multi-core, fine-stranded Terminal pins, core end sheath Environmental conditions Temperature range Relative humidity Operating height 0.08 to 2.5 mm² 1.5 mm² Operation: K55 ( C) Operation: 5 to 95 % (at 25 C) ,000 m above sea level Degree of pollution 2 Installation position user-defined Electromagnetic compatibility Electromagnetic compatibility of electrical equipment Directive 2004/108/EC Electrical appliances for application within particular voltage limits Directive 2006/95/EC Equipment safety Safety requirements for electrical equipment for measurement, regulation, control and laboratory use IEC/EN Part 1: General requirements Part 2-030: Particular requirements for testing and measuring circuits IEC/EN Noise immunity Industrial environment IEC/EN Electrostatic discharge IEC/EN Voltage dips IEC/EN Emissions Class B: Residential environment IEC/EN Radio disturbanc voltage strength MHz IEC/CISPR11/EN Radiated interference voltage MHz IEC/CISPR11/EN Safety Europe CE labelling USA and Canada UL variants available Firmware Firmware update Update via GridVis software. Firmware download (free of charge) from the website: Comment: For detailed technical information please refer to the operation manual and the Modbus address list. = included - = not included 36

37 Chapter 02 UMG 20CM UMG 20CM 20 Channel Branch Circuit Monitoring Device with RCM RCM Harmonics via analysis channel Modbus Alarm management GridVis Analysis software 20 current channels Interfaces / communication RS485 Modbus RTU Accuracy of measurement Active energy Class 1 Current: 1 % Voltage: 1 % NEW: Now available with memory 768 kb Power quality Harmonics up to 63rd harmonic (analysis channel) Crest factor / total harmonic distortion Minimum and maximum values for currents with time stamp Threshold value for each current channel / limit value bit 20 Current measurement channels True RMS measurement High sampling rate at 20 khz Operating current and residual current monitoring (RCM) 2 digital outputs (open collector) Pulse output kwh / kvarh Relay / PLC inputs Network visualisation software Free GridVis -Basic 37

 20 LEDs One LED for each current channel (Green = o.k.")
38 Chapter 02 UMG 20CM Areas of application Continuous acquisition of the operating currents Permanent residual current monitoring Messages in the event of the nominal current being exceeded Energy acquisition for complete current distribution Cost centre accounting Transparency of energy costs More effective use of IT infrastructure PDUs in data centres Increase of high availability power supply Main features RCM and energy measurement device in a single unit 20 current measurement channels +/- 0.5 % 3 voltage measurement channels +/- 0.5 % Internal RS485 interface (Modbus as Slave) 20 LEDs One LED for each current channel (Green = o.k., Yellow = Warning; Red = Nominal current exceed) Measurement range of operation current with burden up to 63 A with closed or split core current transformers (standard measured values: V, A, kw, kva, kvar, kwh) The system for smart people Fig.: Operating current and RCM fault current monitoring Compact nature of the system Can be retrofitted to existing systems Modbus RTU directly on board State indication per channel (LEDs) Name stored per channel in the measurement device Polarity reversal for the current channels Memory function for the messages of the threshold monitoring Wide range power adapter ( V... AC / DC) Integration in the GridVis software Diverse current transformer variants for the individual application Measurement variants: - Three-phase and single-phase energy measurement - RCM measurement three-phase and single-phase High sampling rate 20,000 Hz Current transformer connection monitoring (i.e. wire break will be detected) Harmonics analysis up to 63rd harmonic via analysis channel Saving of minimum and maximum values with time stamp Standard measured values: V, A, kw, kva, kvar, kwh (variable list) Scalability of the system 38

39 Chapter 02 UMG 20CM The system Power supply without drop-outs Permanent monitoring and logging of processes in TN-S or TN-C-S systems Simple parameterisation and operation of the RCM measurement Automatic reporting in the event of problems enables a rapid initiation of countermeasures Comprehensive diagnostics increase safety and efficiency of a company ma Residual current Personnel protection System protection Fire protection Message from RCM t Switch-off Information advantage Time Alarms before failures (preventative residual current analysis) Faults arising will be detected in good time Monitoring, evaluation and reporting of creeping increases in residual currents (e.g. triggered by insulation faults and operating currents for system parts or loads being too high) Reduction of downtimes Fig.: Message before shut-down - an objective of residual current monitoring Sensors for energy management Energy data of a large number of loads can be acquired and passed to a database with ease Automatic reading out and saving of the measured values and data saved in the measurement devices as well as the exceedance of parameterised threshold values Channel-specific measured values of the current monitoring devices can be displayed via the GridVis software - The progression of measured values is visualised graphically - Display of warnings or fault messages possible, e.g. via the topology views. - Associated message texts can be freely configured for this - Automatic sending of an in the event of operational or fault messages - Remote monitoring of the entire system is possible via internet - Residual current and operational current monitoring devices can be parameterised via GridVis (Modbus) The evaluation and saving of data in central databases is implemented via the GridVis software The greater the scope of information, the more accurate the determination of savings potentials Energy optimisation offers a higher, more economical savings potential (ISO 50001) Operating current A Residual current ma Database connection Fig.: Read-out, analysis and saving of energy data 39


40 Chapter 02 UMG 20CM Feed-in L1 L2 L3 N N PE CGP PAS Ethernet (TCP/IP) Ethernet (TCP/IP) UMG 96RM-E Modbus RTU UMG 20CM... Fig.: The 20 channels of the UMG 20CM can be optionally used for residual current or operational current monitoring by utilising the corresponding current measurement transformer. In the case of residual current monitoring, the residual currents flowing to ground or any other path are acquired. Your benefits The intelligent system solution Early warning with system failures Avoidance of costly and hazardous system downtimes; the availability of systems is increased Localisation of individual faulty feeders, reduced work when troubleshooting Early detection of an overloading of the N conductor and critical residual currents, resulting in increased fire safety Through parameterisation of the system in new condition and constant monitoring, all changes to the system state after the point of commissioning can be detected Fulfilment of the safety criteria "RCM residual current monitoring" in data centres Convenient monitoring and parameterisation solution with GridVis software Operating current acquisition of all relevant consumers as a basis for an energy management system (EnMS) Fig.: Constant processes and highly sensitive applications such as data centres, are based on RCM monitoring. 40
41 Chapter 02 UMG 20CM Feed-in L1 L2 L3 N Modbus RTU Modbus RTU UMG 20CM UMG 20CM UMG 96RM-E UMG 20CM f1 f2 UMG 96RM-E e. g. computer Residual current Operating current Residual currents type A per IEC PE Dimension diagrams All dimensions in mm Front view Side view 41
42 Chapter 02 UMG 20CM Typical connection 3Ph/N/PE AC 50 Hz 230/400 V L1 L2 L3 N PE Imax 1000 ma... L1... Imax 1000 ma L2 L3 Ch1 Ch UMG 96RM-E UMG 508 UMG 511 UMG 604-PRO UMG 605-PRO ModbusRTU 24 V _ UC ~ Modbus Supply voltage V 50/60 Hz AC / DC Further devices Recommendation: The bus should not contain more than 10 devices, type UMG 20CM if several UMG 20CM measuring channels are used. If the APP 20CM-Webmonitor is used, the number is limited to 5 devices due to the APP management). Device overview and technical data UMG 20CM Item number Power supply voltage V AC / V DC General Use in low and medium voltage networks Accuracy voltage measurement 1 % Accuracy current measurement 1 % Accuracy active energy (kwh) Class 1 Number of measurement points per period 400 Uninterrupted measurement RMS - momentary value Current, voltage, frequency Active, reactive and apparent power for each of the 20 current inputs Power factor for each of the 20 current inputs Energy measurement Active energy (for each of the 20 current inputs, + 7 aggregating channels) Recording of the mean values Current / present, minimum and maximum Active power / present, minimum and maximum Frequency / present Aggregating channels phase measurements Fig.: 10 single-phase operational current measurements, 10 single-phase residual current measurements, Comment: For detailed technical information please refer to the operation manual and the Modbus address list. = included - = not included Residual current measurements 42
43 Chapter 02 UMG 20CM Fig.: 20 single-phase operating current or RCM measurements phase measurements phase measurements phase measurements 7 12 Residual current measurements PEmeasurements Fig.: 3 single-phase operational current measurements, 1 three-phase operational current measurement, 6 single-phase residual current measurements, 8 single-phase PE measurements RCM measurement Residual current monitoring for all 20 channels (selectable) Current transformer connection monitoring (i.e. wire break will be detected) Power quality measurements Harmonics per order / current and voltage (absolute and in %) 1st 63rd Distortion factor THD-I in % Under and overcurrent recording Crest factor Measured data recording Memory (Flash) 768 kb Minimum, maximum values Measured data channels 24 Alarm messages Time stamp Displays and inputs / outputs LCD display - LEDs (3 states each) 27 Digital outputs (as switch or pulse output) 2 Voltage measurement inputs L1, L2, L3 + N Current measurement inputs 20 Communication Interfaces RS485: kbps (Screw-type terminal) Protocols Modbus RTU (Slave) Software GridVis -Basic* 1 Online and historic graphs Databases (Janitza DB, Derby DB); MySQL, MS SQL with higher GridVis versions) Manual reports (energy, power quality) Graphical programming Topology views Manual read-out of the measuring devices Graph sets Technical data Type of measurement Constant true RMS up to the 63rd harmonic Nominal voltage, three-phase, 4-conductor (L-N, L-L) 230 / 400 V AC Measurement in quadrants 4 Networks TN, TT, IT Measurement in single-phase / multi-phase networks 1 ph, 2 ph, 3 ph, 4 ph and up to 20 times 1 ph Measured voltage input Overvoltage category 300 V CAT III Measured range, voltage L-N, AC (without potential transformer) Vrms Measured range, voltage L-L, AC (without potential transformer) Vrms Resolution 0.1 V Impedance 1.3 MOhm / phase Frequency measuring range Hz Sampling frequency 20 khz / phase Measured current input Evaluation range of the operating current A Evaluation range of the residual current 10 ma 15 A Resolution 1 ma Digital inputs and outputs Number of digital outputs 2 Switching voltage max. 60 V DC, 30 V AC Maximum current 350 ma Switch-on resistance 2 Ohm Maximum cable length up to 30 m unscreened, from 30 m screened Comment: For detailed technical information please refer to the operation manual and the Modbus address list. = included - = not included * 1 Optional additional functions with the packages GridVis -Professional, GridVis -Service and GridVis -Ultimate. 43


44 Chapter 02 UMG 20CM Mechanical properties Weight 270 g Device dimensions in mm (H x W x D) 90 x 105 x approx. 73 Protection class per EN Assembly per IEC EN / DIN EN Environmental conditions Temperature range Relative humidity Operating height Degree of pollution 3 Installation position Electromagnetic compatibility IP20 35-mm DIN rail Operation: K55 ( C) Operation: 5 to 95 % (at 25 C) ,000 m above sea level user-defined Electromagnetic compatibility of electrical equipment Directive 2004/108/EC Electrical appliances for application within particular voltage limits Directive 2006/95/EC Equipment safety Safety requirements for electrical equipment for measurement, regulation, control and laboratory use IEC/EN Part 1: General requirements Part 2-030: Particular requirements for testing and measuring circuits IEC/EN Noise immunity Class A: Industrial environment IEC/EN Electrostatic discharge IEC/EN Voltage dips IEC/EN Emissions Class B: Residential environment IEC/EN RFI Field Strength 30 1,000 MHz IEC/CISPR11/EN Radiated interference voltage MHz IEC/CISPR11/EN Safety Europe CE labelling Firmware Fig.: Residual current transformer for the acquisition of residual currents. Different configurations and sizes allow use in almost all applications (see chapter 06, current / voltage transformers and sensors). Firmware update Update via GridVis software. Firmware download (free of charge) from the website: Comment: For detailed technical information please refer to the operation manual and the Modbus address list. Recommendation: The bus should not contain more than 10 devices, type UMG 20CM if several UMG 20CM measuring channels are used. If the APP 20CM-Webmonitor is used, the number is limited to 5 devices due to the APP management). Ethernet UMG 508 Measurement of the main feed-in with event analysis 3 Main distribution Modbus UMG 96RM-E Operating & RCM measurement of the main feeder to the sub-distribution 60 current measurements Sub distribution UMG 20CM 20 x 1-phase measurements 20 x 1-phase measurements 20 x 1-phase measurements Fig.: Extremely compact solution for complete monitoring via three levels with leading-edge master-slave communication architecture 44
45 Chapter 02 UMG 604-PRO UMG 604-PRO Power analyser Harmonics Modbus master, Ethernet gateway Memory 128 MByte Homepage Events Graphic programming Communication Profibus (DP/ V0) Modbus (RTU, UDP, TCP, Gateway) TCP/IP BACnet (optional) HTTP (configurable homepage) FTP (file transfer) SNMP TFTP NTP (time synchronisation) SMTP ( function) DHCP Interfaces Ethernet RS232 RS485 Accuracy of measurement Energy: Class 0.5S ( / 5 A) Current: 0.2 % Voltage: 0.2 % Power quality Harmonics up to 40th harmonic Short-term interruptions (> 20 ms) Transient recorder (> 50 μs) Starting currents (> 20 ms) Unbalance Full wave effective value recording (up to 4.5 min.) Networks IT, TN, TT networks 3 and 4-phase networks Up to 4 single-phase networks Measured data memory 128 MByte Flash Programming language Jasic 2 digital inputs Pulse input Logic input State monitoring HT / LT switching 2 digital outputs Pulse output kwh / kvarh Switch output Threshold value output Logic output (expandable via external I/O modules, see FBM modules in chapter 05) Temperature measurement PT100, PT1000, KTY83, KTY84 Network visualisation software Free GridVis -Basic Peak demand management (optional) Up to 64 switch-off stages 45

 Measurement, monitoring and checking of electrical characteristics in energy distribution systems Consumption data acquisition Monitoring of the power quality (harmonics, short-term")
46 Chapter 02 UMG 604-PRO Areas of application Master device for energy management systems, (e.g. ISO 50001) Measurement, monitoring and checking of electrical characteristics in energy distribution systems Consumption data acquisition Monitoring of the power quality (harmonics, short-term interruptions, transients, starting currents, etc.) Measured value transducer for building management systems or PLC Control tasks e.g. depending on measured value or limit values being reached Peak demand management Ethernet gateway for subordinate measurement points Remote monitoring Main features Power quality Harmonics analysis up to 40th harmonic Unbalance Distortion factor THD-U / THD-I Measurement of positive, negative and zero sequence component Short-term interruptions (> 20 ms) Logging and storage of transients (> 50 µs) Start-up processes Fault recorder function Rotary field indication Fig.: DIN rail mounting (6 TE) DIN mounting rail (6TE): Simple and cost-optimised installation Mounting on a 35 mm DIN rail Clear cost advantages in the switch cabinet construction through lower installation and connection effort Simple integration into the LVDB, in machinery construction, in installation subdistribution panel for building management systems, in IT and in data centres Server Database Modern communications architecture via Ethernet Rapid, cost-optimised and reliable communication through integration into an existing Ethernet architecture Integration in PLC systems and building management systems High flexibility due to the use of open standards Simultaneous polling of interfaces possible UMG 604-PRO Fieldbus UMG 96RM Fig.: Modern communication architecture 46

47 Chapter 02 UMG 604-PRO Ethernet-Modbus gateway Simple integration of Modbus-RTU devices into an Ethernet architecture through the Modbus gateway function Integration of devices with identical file formats and matching function codes possible via Modbus RTU interface High-speed Modbus Fast and reliable data exchange via RS485 interface Speed up to kb/s Graphical programming Comprehensive programming options on the device, 7 programs simultaneously (PLC functionality) Jasic source code programming Functional expansions far beyond pure measurement Complete APPs from the Janitza library Convenient home page and functions Fig.: Graphical programming Information can be received conveniently by and via the device homepage Access to powerful device homepage via web browser Online data, historical data, graphs, events and much more, is available direct from the homepage Large measurement data memory 128 MByte 5,000,000 saved values Recording range up to 2 years Recording freely configurable Fig.: Illustration of the online data via the device s own homepage UMG 604-PRO Fig.: Large measurement data memory 47
48 Chapter 02 UMG 604-PRO Dimension diagrams All dimensions in mm 73 mm 10 mm 35 mm 44 mm 90 mm 90 mm 107,5 mm 50 mm 76 mm 82 mm Front view Side view Typical connection An. In RS232 RS485 Dig. I/O Versorgungsspannung Auxiliary Supply RS485 Ethernet Option Option Strommessung Current measurement I1 I2 I3 I Power Analyser UMG 604-PRO Spannungsmessung Voltage measurement L1 L2 L3 L4 N A (UL listed) PE N L1 L2 L3 S1 S2 S1 S2 S1 S2 S1 S2 Verbraucher Load 48
49 Chapter 02 UMG 604-PRO Device overview and technical data UMG 604E-PRO Item number UMG 604EP-PRO Item number (UL) Supply voltage AC V AC V AC V AC V AC V AC Supply voltage DC V DC V DC V DC V DC V DC Communication Interfaces RS485: kbps (Screw-type terminal) RS232: kbps (Screw-type terminal) Profibus DP: Up to 12 Mbps (DSUB-9 plug) Ethernet 10/100 Base-TX (RJ-45 socket) Protocols Modbus RTU, Modbus TCP, Modbus RTU over Ethernet Modbus Gateway for Master-Slave configuration Profibus DP V HTTP (homepage configurable) SMTP ( ) NTP (time synchronisation) TFTP FTP (File-Transfer) SNMP DHCP TCP/IP BACnet (optional) ICMP (Ping) Device options Emax function (peak demand management) BACnet communication L1 L2 L3 N S1 S2 S1 S2 S1 S2 S1 S2 Loads Fig.: Current measurement via current transformers General Use in low and medium voltage networks Accuracy voltage measurement 0.2 % Accuracy current measurement 0.25 % Accuracy active energy (kwh, /5 A) Class 0.5S Number of measurement points per period 400 Uninterrupted measurement RMS - momentary value Current, voltage, frequency Active, reactive and apparent power / total and per phase Power factor / total and per phase Energy measurement Active, reactive and apparent energy [L1,L2,L3, L4, L1 L3, L1 L4] Number of tariffs 8 Recording of the mean values Voltage, current / actual and maximum Active, reactive and apparent power / actual and maximum Frequency / actual and maximum Demand calculation mode (bi-metallic function) / thermal Other measurements Clock Weekly timer Jasic Comment: For detailed technical information please refer to the operation manual and the Modbus address list. = included - = not included 49

50 Chapter 02 UMG 604-PRO Power quality measurements Harmonics per order / current and voltage 1st 40th Harmonics per order / active and reactive power 1st 40th Distortion factor THD-U in % Distortion factor THD-I in % Voltage unbalance Current and voltage, positive, zero and negative sequence component Transients 50 µs Error / event recorder function Short-term interruptions 20 ms Oscillogram function (waveform U and I) Full wave effective values (U, I, P, Q) Under and overvoltage recording Measured data recording Memory (Flash) 128 MB Average, minimum, maximum values Measured data channels 8 Alarm messages Time stamp Time basis average value freely user-defined RMS averaging, arithmetic Displays and inputs / outputs LCD display Digital inputs 2 Digital outputs (as switch or pulse output) 2 Thermistor input (PT100, PT1000, KTY83, KTY84) Voltage and current inputs each 4 Password protection Peak load management (optionally 64 channels) Software GridVis -Basic *1 Online and historic graphs Databases (Janitza DB, Derby DB); MySQL, MS SQL with higher GridVis versions) Manual reports (energy, power quality) Graphical programming Topology views Manual read-out of the measuring devices Graph sets Programming / threshold values / alarm management Application programs freely programmable 7 Graphical programming Programming via source code Jasic Technical data Type of measurement Constant true RMS Up to 40th harmonic Nominal voltage, three-phase, 4-conductor (L-N, L-L) 277 / 480 V AC Nominal voltage, three-phase, 3-conductor (L-L) 480 V AC Measurement in quadrants 4 Networks TN, TT, IT Measurement in single-phase/multi-phase networks 1 ph, 2 ph, 3 ph, 4 ph and up to 4 times 1 ph Measured voltage input Overvoltage category 300 V CAT III Measured range, voltage L-N, AC (without potential transformer) Vrms Measured range, voltage L-L, AC (without potential transformer) 18 1,000 Vrms Resolution 0.01 V Impedance 4 MOhm / phase Frequency measuring range Hz Power consumption approx. 0.1 VA Sampling frequency 20 khz / phase Transients > 50 µs KTY83 24V DC - + S0 pulse generator 1,5k Fig.: Example temperature input (KTY83) and S0 pulse transducer Comment: For detailed technical information please refer to the operation manual and the Modbus address list. = included - = not included * 1 Optional additional functions with the packages GridVis -Professional, GridVis -Service and GridVis -Ultimate. 50
51 Chapter 02 UMG 604-PRO A RS485 Bus B A B Fig.: RS485 interface, 2 pin plug contact A B Measured current input Rated current 1 / 5 A Resolution 1 ma Measurement range Amps Overvoltage category 300 V CAT III Measurement surge voltage 4 kv Power consumption approx. 0.2 VA (Ri = 5 MOhm) Overload for 1 sec. 100 A (sinusoidal) Sampling frequency 20 khz Digital inputs and outputs Number of digital inputs 2 Maximum counting frequency 20 Hz Input signal present V DC (typical 4 ma) Input signal not present V DC, current < 0.5 ma Number of digital outputs 2 Switching voltage max. 60 V DC, 30 V AC Switching current max. 50 ma Eff AC / DC Output of voltage dips 20 ms Output of voltage exceedance events 20 ms Pulse output (energy pulse) max. 20 Hz Maximum cable length up to 30 m unscreened, from 30 m screened Mechanical properties Weight 350 g Device dimensions in mm (H x W x D) 90 x x approx. 82 Battery Type Lithium CR2032, 3 V Protection class per EN IP20 Assembly per IEC EN / DIN EN mm DIN rail Connecting phase (U / I), Single core, multi-core, fine-stranded Terminal pins, core end sheath Environmental conditions Temperature range Relative humidity Operating height 0.08 to 2.5 mm² 1.5 mm² Operation: K55 ( C) Operation: 5 to 95 % (at 25 C) ,000 m above sea level Degree of pollution 2 Installation position user-defined Electromagnetic compatibility Electromagnetic compatibility of Directive 2004/108/EC electrical equipment Electrical appliances for application within Directive 2006/95/EC particular voltage limits Equipment safety Safety requirements for electrical equipment for measurement, regulation, control IEC/EN and laboratory use Part 1: General requirements Part 2-030: Particular requirements for IEC/EN testing and measuring circuits Noise immunity Industrial environment IEC/EN Electrostatic discharge IEC/EN Voltage dips IEC/EN Emissions Class B: Residential environment IEC/EN RFI Field Strength 30 1,000 MHz IEC/CISPR11/EN Radiated interference voltage MHz IEC/CISPR11/EN Safety Europe CE labelling USA and Canada UL variants available Firmware Update via GridVis software. Firmware download (free of charge) Firmware update from the website: Comment: For detailed technical information please refer to the operation manual and the Modbus address list. = included - = not included 51
52 Chapter 02 UMG 604-PRO Switch Communication using TCP/IP Internet UMG 511 Class A power quality analyser Report generator according to standard EN etc. Power quality monitoring Harmonic analysis UMG 508 Multifunctional quality analyser Monitoring of power supplies Monitoring of short-therm interruption Computer environment Programming and assessment software GridVis Cost centre data collection Power quality Analysis tools Database management Alarm management User administration Ethernet UMG 604-PRO / UMG 96RM-E Multifunctional power analysers Cost centre analysis Energy data collection and reporting UMG 509-PRO Multifunction power analyser with RCM Prophi Power factor correction UMG 96RM Multifunctional power analyser Measurement, monitoring and control of electrical data Energy data collection Modbus UMG 104 Energy meter Monitoring of power quality Energy data collection and reporting Modbus UMG 103-CBM Universal measuring instrument Cost centre data collection Limit value monitoring UMG 20CM RCM and energy meter Operating and residual current monitoring Energy data collection ProData Data logger Data collector for media consumption Energy data collection 52
 TCP/IP BACnet (optional) HTTP (configurable homepage) FTP (file transfer) TFTP NTP (time synchronisation) SMTP (email function) DHCP SNMP Interfaces Ethernet RS232 RS485 (Modbus) RS485")
53 Chapter 02 UMG 605-PRO UMG 605-PRO Power quality analysers for DIN rails Harmonics Alarm management Flicker Reporting Memory 128 MByte Communication Profibus (DP / V0) Modbus (RTU, UDP, TCP, Gateway) TCP/IP BACnet (optional) HTTP (configurable homepage) FTP (file transfer) TFTP NTP (time synchronisation) SMTP ( function) DHCP SNMP Interfaces Ethernet RS232 RS485 (Modbus) RS485 (DSUB9) for Profibus Accuracy of measurement Energy: Class 0.5S ( / 5 A) Current: 0.2 % Voltage: 0.2 % Power quality Harmonics up to the 63rd harmonic, direct / indirect Flicker measurement Short-term interruptions (> 20 ms) Transient recorder (> 50 μs) Starting currents Unbalance Half wave RMS recordings (up to 4.5 min.) Networks IT, TN, TT networks 3 and 4-phase networks Up to 4 single-phase networks Measured data memory 128 MByte Flash Programming language Jasic 2 digital inputs Pulse input Logic input State monitoring HT / LT switching 2 digital outputs Pulse output kwh / kvarh Switch output Threshold value output Logic output* *(expandable via external I/O modules) Temperature measurement PT100, PT1000, KTY83, KTY84 Network visualisation software Free GridVis -Basic Peak demand management (optional) Up to 64 switch-off stages 53

 Recording of short-term interruptions (> 20 ms) Monitoring start-up processes Recorder for limit value events Fig.")
54 Chapter 02 UMG 605-PRO Areas of application Power quality monitoring Ethernet gateway for subordinate measurement points Analysis of electrical disturbances in the event of network problems Report generator for various power quality standards Control tasks e.g. depending on measured value or limit values being reached Measured value transducer for building management systems or PLC Main features Power quality Continuous power quality monitoring (e.g. EN 50160) Harmonics analysis up to the 63rd harmonic, even and odd Interharmonics Distortion factor THD-U / THD-I Measurement of positive, negative and zero sequence component Flicker measurement in accordance with DIN EN Logging and storage of transients (> 50 µs) Recording of short-term interruptions (> 20 ms) Monitoring start-up processes Recorder for limit value events Fig.: GridVis Flicker Monitoring Power 4 voltage and 4 current measurement inputs Logging and digitalisation of effective values (true RMS) of currents and voltages ( Hz) Continuous sampling of the voltage and current measurement inputs at 20 khz Recording of over 2,000 measured values per measurement cycle (200 ms) Stipulation of nominal current possible for measuring current events Fourth current measurement input is suitable for measuring the current in the neutral or PE conductor or for measuring any potential difference between N and PE. Large measured data memory (memory range = measured values) Simple remote polling of measured data via the device's own homepage All interfaces can be used simultaneously Up to 4 ports can be accessed simultaneously 54
 curve Freely definable time planning for the generation of reports Modern communications architecture via Ethernet Rapid, cost-optimised and reliable communication through integration")

55 Chapter 02 UMG 605-PRO Impressive reporting with GridVis Automatic generation and sending of power quality reports Power quality reports per EN 50160, EN , IEEE519 Illustration of the ITI-(CBEMA) curve Freely definable time planning for the generation of reports Modern communications architecture via Ethernet Rapid, cost-optimised and reliable communication through integration into an existing Ethernet architecture Integration in PLC systems and building management systems High flexibility due to the use of open standards Simultaneous polling of interfaces possible Fig.: Automatic reporting Ethernet-Modbus gateway Simple integration of Modbus-RTU devices into an Ethernet architecture through the Modbus gateway function Integration of devices with identical file formats and matching function codes possible via Modbus RTU interface Powerful alarm management Can be programmed via the graphic programming or Jasic source code All measured values can be used Can be arbitrarily, mathematically processed Individual forwarding via sending, switching of digital outputs, writing to Modbus addresses etc. Watchdog APP Further alarm management functions via GridVis -Service alarm management Fig.: Alarm management, alarm list (logbook) 55
 Jasic source code programming Functional expansions far beyond pure")

56 Chapter 02 UMG 605-PRO High-speed Modbus Fast and reliable data exchange via RS485 interface Speed up to kb/s Graphical programming Comprehensive programming options on the device, 7 programs simultaneously (PLC functionality) Jasic source code programming Functional expansions far beyond pure measurement Complete APPs from the Janitza library Fig.: Graphical programming Convenient home page and functions Information can be received conveniently by and via the device homepage Access to powerful device homepage via web browser Online data, historical data, graphs, events and much more, is available direct from the homepage Fig.: Illustration of the online data via the device s own homepage Large measurement data memory UMG 605-PRO 128 MByte 5,000,000 saved values Recording range up to 2 years Recording freely configurable by the user Fig.: Large measurement data memory Fig.: GridVis Graphset with THD-U, voltage, phasor diagram and load profile (kw) 56
57 Chapter 02 UMG 605-PRO Dimension diagrams All dimensions in mm 73 mm 10 mm 35 mm 44 mm 90 mm 90 mm 107,5 mm 50 mm 76 mm 82 mm Front view Side view Typical connection An. In RS232 RS485 Dig. I/O Versorgungsspannung Auxiliary Supply RS485 Ethernet Option Option Strommessung Current measurement Spannungsmessung Voltage measurement Power Analyser UMG 605-PRO I1 I2 I3 I4 L1 L2 L3 L4 N A (UL listed) PE N L1 S1 L2 L3 S2 S1 S2 S1 S2 S1 S2 Verbraucher Load 57
58 Chapter 02 UMG 605-PRO Device overview and technical data UMG 605-PRO Item number Item number (UL) Supply voltage AC V AC V AC V AC Supply voltage DC V DC V DC V DC Device options Emax function (peak demand management) BACnet communication L1 L2 L3 N General Use in low and medium voltage networks Accuracy voltage measurement 0.2 % Accuracy current measurement 0.25 % Accuracy active energy (kwh, /5 A) Class 0.5S Number of measurement points per period 400 Uninterrupted measurement RMS - momentary value Current, voltage, frequency Active, reactive and apparent power / total and per phase Power factor / total and per phase Energy measurement Active, reactive and apparent energy [L1,L2,L3, L4, L1 L3, L1 L4] Number of tariffs 8 Recording of the mean values Voltage, current / actual and maximum Active, reactive and apparent power / actual and maximum Frequency / actual and maximum Demand calculation mode (bi-metallic function) / thermal Other measurements Operating hours measurement Clock Weekly timer Jasic Power quality measurements Harmonics per order / current and voltage 1st 63rd Harmonics per order / active and reactive power 1st 63rd Interharmonics - current / voltage Distortion factor THD-U in % Distortion factor THD-I in % Voltage unbalance Current and voltage, positive, zero and negative sequence component Flicker: Short-term, long-term, present Transients 50 µs Error / event recorder function Short-term interruptions > 20 ms Oscillogram function (waveform U and I) Under and overvoltage recording Measured data recording Memory (Flash) 128 MB Average, minimum, maximum values Measured data channels 8 Alarm messages Time stamp Time basis average value freely user-defined RMS averaging, arithmetic Comment: For detailed technical information please refer to the operation manual and the Modbus address list. S1 S2 S1 S2 S1 S2 L1 L2 L3 N I1 I2 I3 Fig.: Measurement via 3 voltage transformers in a three-phase 4-wire network with asymmetric loading = included - = not included 58
59 Chapter 02 UMG 605-PRO Local substation UMG 605-PRO Modbus UMG 96RM UMG 96RM Fig.: Example of a master - slave combination Displays and inputs / outputs LCD display Digital inputs 2 Digital outputs (as switch or pulse output) 2 Thermistor input (PT100, PT1000, KTY83, KTY84) Voltage and current inputs each 4 Password protection Peak load management (optionally 64 channels) Communication Interfaces RS485: kbps (Screw-type terminal) RS232: kbps (Screw-type terminal) Profibus DP: Up to 12 Mbps (DSUB-9 connector) Ethernet 10/100 Base-TX (RJ-45 socket) Protocols Modbus RTU, Modbus TCP, Modbus RTU over Ethernet Modbus Gateway for Master-Slave configuration Profibus DP V0 HTTP (homepage configurable) SMTP ( ) NTP (time synchronisation) TFTP FTP (File-Transfer) SNMP DHCP TCP/IP BACnet (optional) ICMP (Ping) Software GridVis -Basic *1 Online and historic graphs Databases (Janitza DB, Derby DB); MySQL, MS SQL with higher GridVis versions) Manual reports (energy, power quality) Graphical programming Topology views Manual read-out of the measuring devices Graph sets Programming / threshold values / alarm management Application programs freely programmable 7 Graphical programming Programming via source code Jasic Technical data Type of measurement Constant true RMS up to the 63rd harmonic Nominal voltage, three-phase, 4-conductor (L-N, L-L) 277 / 480 V AC Nominal voltage, three-phase, 3-conductor (L-L) 480 V AC Measurement in quadrants 4 Networks TN, TT, IT Measurement in single-phase/multi-phase networks 1 ph, 2 ph, 3 ph, 4 ph and up to 4 times 1 ph Measured voltage input Overvoltage category 300 V CAT III Measured range, voltage L-N, AC (without potential transformer) Vrms Measured range, voltage L-L, AC (without potential transformer) Vrms Resolution 0.01 V Impedance 4 MOhm / phase Frequency measuring range Hz Power consumption approx. 0.1 VA Sampling frequency 20 khz / phase Transients > 50 µs Comment: For detailed technical information please refer to the operation manual and the Modbus address list. = included - = not included * 1 Optional additional functions with the packages GridVis -Professional, GridVis -Service and GridVis -Ultimate. 59
60 Chapter 02 UMG 605-PRO Measured current input Rated current 1 / 5 A Resolution 1 ma Measurement range Arms Overvoltage category 300 V CAT III Measurement surge voltage 4 kv Power consumption approx. 0.2 VA (Ri = 5 MOhm) Overload for 1 sec. 100 A (sinusoidal) Sampling frequency 20 khz Digital inputs and outputs Number of digital inputs 2 Maximum counting frequency 20 Hz Reaction time (Jasic program) 200 ms Input signal present V DC (typical 4 ma) Input signal not present V DC, current < 0.5 ma Number of digital outputs 2 Switching voltage max. 60 V DC, 30 V AC Switching current max. 50 ma Eff AC / DC Reaction time (Jasic program) 200 ms Output of voltage dips 20 ms Pulse output (energy pulse) max. 20 Hz Maximum cable length up to 30 m unscreened, from 30 m screened Mechanical properties Weight 350 g Device dimensions in mm (H x W x D) 90 x x approx. 82 Battery Type Lithium CR2032, 3 V Protection class per EN IP20 Assembly per IEC EN / DIN EN mm DIN mounting rails Connecting phase (U / I), Single core, multi-core, fine-stranded Terminal pins, core end sheath Environmental conditions Temperature range Relative humidity Operating height 0.08 to 2.5 mm² 1.5 mm² Operation: K55 ( C) Operation: 5 to 95 % (at 25 C) ,000 m above sea level Degree of pollution 2 Installation position user-defined Electromagnetic compatibility Electromagnetic compatibility of electrical equipment Directive 2004/108/EC Electrical appliances for application within particular voltage limits Directive 2006/95/EC Equipment safety Safety requirements for electrical equipment for measurement, regulation, control and laboratory use IEC/EN Part 1: General requirements Part 2-030: Particular requirements for testing and measuring circuits IEC/EN Noise immunity Industrial environment IEC/EN Electrostatic discharge IEC/EN Voltage dips IEC/EN Emissions Class A: Industrial environment IEC/EN RFI Field Strength 30 1,000 MHz IEC/CISPR11/EN Radiated interference voltage MHz IEC/CISPR11/EN Safety Europe CE labelling USA and Canada UL variants available Firmware S0 pulse generator + 24V 1,5k = - UMG 605-PRO Digital inputs 1-2 Digital Input 1 19 Digital Input ,9V 4k 3,9V 4k Fig.: Example for the connection of an S0 pulse transducer to digital input 2 Firmware update Update via GridVis software. Firmware download (free of charge) from the website: Comment: For detailed technical information please refer to the operation manual and the Modbus address list. = included - = not included 60
61 Chapter 02 UMG 96L / UMG 96 UMG 96L / UMG 96 Universal measurement device Threshold value monitoring Pulse outputs Measuring accuracy Energy: Class 2 Current.../1 A,.../5 A Voltage L - N: ± 1 % Networks TN-, TT-Networks 2 digital outputs (UMG 96) Pulse output kwh / kvarh Switch output 61


62 Chapter 02 UMG 96L / UMG 96 Areas of application Replaces analogue measurement devices Display and checking of electrical characteristics in energy distribution systems Limit value monitoring Main features Display selection and automatic display rotation Generous LCD display All measured values can be called up in factory setting Measured values that are not required can be hidden and displayed again Operating hours counter The operating hours counter is active as soon as the device is switched on The time is measured with a resolution of 15 minutes Display in hours mode Fig.: Effective power, all three phases at a glance Digital outputs for reactive or active energy Transmission of the reactive and active energy via digital outputs The active energy should be assigned to output 1 and the reactive energy to output 2 62
 per switch output The associated output reacts in response to the value exceeding or dropping below the threshold value Transistor")
63 Chapter 02 UMG 96L / UMG 96 Digital outputs for threshold values (UMG 96) Digital outputs also suitable for use as switch outputs Programming the digital outputs for threshold monitoring of measurement data Assignment of a measured value (threshold value) per switch output The associated output reacts in response to the value exceeding or dropping below the threshold value Transistor outputs Fig.: Digital output for threshold value monitoring Password 3-digit password protects against unauthorised changing of the programming and configurations Changes in the following program menus can only be implemented after entering the correct user password Password is not factory-programmed Fig.: Password protection 63
64 Chapter 02 UMG 96L / UMG 96 Dimension diagrams All dimensions in mm Typical connection Digital outputs Loads Loads Side view UMG 96L / UMG 96 Rear view UMG 96L Rear view UMG 96 Cut out: 92 +0,8 x 92 +0,8 mm UMG 96L UMG 96 with 2 digital outputs 64
65 Chapter 02 UMG 96L / UMG 96 Device overview and technical data UMG 96L UMG 96 Item number Measured voltage 230 / 400 V AC 275 / 476 V AC Operating voltage V AC V AC Measured voltage input Overvoltage category 300 V CAT III 300 V CAT III Measured range, voltage L-N, AC (without potential transformer) V AC V AC Measured range, voltage L-L, AC (without potential transformer) V AC V AC Digital outputs Number of digital outputs - 2 General Accuracy voltage measurement 1 % 1 % Fig.: Example connection via three current transformers (UMG 96L) Comment: For detailed technical information please refer to the operation manual and the Modbus address list. = included - = not included * 1 Refers exclusively to the UMG 96. General Use in low and medium voltage networks Accuracy current measurement 1 % Accuracy active energy (kwh, /5 A) Class 2 Number of measurement points per period 50 RMS - momentary value Current, voltage, frequency Active, reactive and apparent power / total and per phase Power factor / total and per phase Energy measurement Active, reactive energy [ L1 L3] Recording of the mean values Voltage, current / actual and maximum Active, reactive and apparent power / actual and maximum Frequency / actual and maximum Other measurements Operating hours measurement Technical data Measurement in quadrants 4 Networks TN, TT Measured voltage input Frequency measuring range Hz Power consumption approx. 0.1 VA / approx. 0.2 VA Sampling frequency (50 Hz) 2.5 khz / phase Measured current input Rated current 1 / 5 A Measurement range Arms Overvoltage category CAT III Measurement surge voltage 4 kv Power consumption approx. 0.2 VA Overload for 2 sec. 180 A (sinusoidal) Sampling frequency (50/60 Hz) 2.5 / 3 khz / Phase Digital outputs *1 Switching voltage max. 60 V DC, 5 24 V DC Switching current max. 50 ma Eff AC / DC Pulse output (energy pulse) max. 10 Hz Maximum cable length up to 30 m unscreened, from 30 m screened Mechanical properties Weight 250 g Device dimensions in mm (H x W x D) 96 x 96 x 48 Protection class per EN Front: IP40, Rear: IP20 Assembly per IEC EN / DIN EN Front panel installation Connecting phase (U / I), Single core, multi-core, fine-stranded Terminal pins, core end sheath 0.08 to 2.5 mm² 1.5 mm² 65
66 Chapter 02 UMG 96L / UMG 96 Environmental conditions Temperature range Operation: K55 ( C) Relative humidity Operation: 15 to 95 % (at 25 C) Operating height ,000 m above sea level Degree of pollution 2 Installation position user-defined Electromagnetic compatibility Electromagnetic compatibility of equipment Directive 89/336/EEC Electrical equipment for use within certain voltage limits Directive 73/23/EEC Equipment safety Safety requirements for electrical equipment for measurement, regulation, control and laboratory use IEC/EN Part 1: General requirements Part 2-030: Particular requirements for testing and measuring circuits IEC/EN Noise immunity Industrial environment IEC/EN Electrostatic discharge IEC/EN Voltage dips IEC/EN Emissions Class B: Residential environment IEC/EN Radio disturbanc voltage strength MHz IEC/CISPR11/EN Radiated interference voltage MHz IEC/CISPR11/EN Safety Europe CE labelling Comment: For detailed technical information please refer to the operation manual and the Modbus address list. = included - = not included 66
67 Chapter 02 UMG 96RM UMG 96RM Multifunction power analyser Memory 256 MB 8 Tariffs Harmonics Pulse inputs and outputs Measurement accuracy 0.5 Communication (device-specific) Modbus (RTU) Profibus DP V0 Profinet TCP/IP M-Bus Power quality Harmonics up to 40th harmonic Rotary field components Distortion factor THD-U / THD-I Waveform display (UMG 96RM-EL) via GridVis -Basic software Up to 4 digital inputs Pulse input Logic input State monitoring Interfaces RS485 (UMG 96RM, UMG 96RM-P, UMG 96RM-CBM) Profibus (UMG 96RM-P) Profinet (UMG 96RM-PN) M-Bus (UMG 96RM-M) Ethernet (UMG 96RM-EL) USB (UMG 96RM-P, UMG 96RM-CBM) Accuracy of measurement Energy: Class 0.5S ( / 5 A) Current: 0.2 % Voltage: 0.2 % Networks TN, TT, IT networks 3 and 4-phase networks Up to 4 single-phase networks Measured data memory (UMG 96RM-CBM, UMG 96RM-P) (UMG 96RM, UMG 96RM-M und UMG 96RM-EL without measurement data memory, energy, minimum and maximum values will be saved in the EEPROM) 256 MB Flash Up to 6 digital outputs Pulse output kwh / kvarh Switch output Threshold value output Logic output Remote via Modbus / Profibus Network visualisation software Free GridVis -Basic 67
 Acquisition of the energy consumption for cost centre analysis Measured value transducer for building management systems or PLC (Modbus) Main features Particular advantages Compact")
68 Chapter 02 UMG 96RM Areas of application Measurement, monitoring and checking of electrical characteristics in energy distribution systems Recording of load profiles for energy management systems (e.g. ISO 50001) Acquisition of the energy consumption for cost centre analysis Measured value transducer for building management systems or PLC (Modbus) Main features Particular advantages Compact construction saves space and costs during installation Seamless and sustained recording thanks to large measured data memory or via the online data acquisition (e.g. GridVis -Service) High data security and redundancy Comprehensive communications options and protocols Multifaceted, pre-defined reports for power quality and energy consumption analysis (via GridVis -Service) Simple report generation at the press of a button or automatically in accordance with defined time plans Precision measurement results provide an effective infrastructure as well as high production availability Generic Modbus profile: Arbitrary Modbus-capable devices and systems from other manufacturers can be incorporated and visualised in the monitoring solutions Long-term availability of the measurement devices guarantees simple retrofitting with system expansions Energy data acquisition & load profile Detailed acquisition of the energy data and the load profile More transparency in energy supply through energy analyses Safer design of the power distribution systems Fig.: Load profiles are the basis for energy management 68
69 Chapter 02 UMG 96RM Cost centre analysis Determination of energy costs Breakdown and allocation of energy consumers Energy management systems (ISO 50001) Continuous increase in energy efficiency Cost reduction UMG 96RM series multifunctional power analysers are an important part of energy management systems Fig.: Cost centre analysis Transparency of energy supply More transparency through a multi-stage, scalable measurement system Acquisition of individual events through continuous measurement with high resolution Fig.: Transparency of energy supply Power quality monitoring Notification of inadequate power quality Introduction of measures to address network problems Prevention of production downtimes Significantly longer service life for equipment Improved sustainability Measurement accuracy of 0.2 % (V), kwh class = 0.5S High sampling rate at 21.3 khz Reliable measurement accuracy of 0.2 % (V) Effective energy class (kwh): 0.5S Fig.: Power quality monitoring (Harmonics analysis for the current up to 40th order harmonics) Energy meter with 8 tariffs, effective and reactive energy Energy measurement in 4 quadrants, each with 8 tariffs for effective and reactive energy Safe and precise acquisition of operational values for individual electrical loads Communications options: Ethernet, Profibus, Modbus, M-Bus, Numerous interfaces and protocols, guaranteeing an easy system connection (energy management system, PLC, SCADA, BMS) 69


70 Chapter 02 UMG 96RM Large measurement data memory Saving of measurement data possible over very long periods of time Recording freely user configurable Harmonics analyser Harmonics analysis up to 40th harmonic Information about power quality, grid disturbances and possible "network polluters" Fig.: GridVis software: Harmonics analysis Pluggable screw terminals Convenient installation even where spaces are tight Backlight Large, high-contrast LCD display with backlighting Very good readability and intuitive operation, even in poor lighting conditions Fig.: Pluggable screw terminals for easy connection Basic device RS485 interface with Modbus protocol and 2 digital outputs enable quick and low-cost monitoring of power quality and energy consumption Profibus and digital IOs Fig.: LCD Display backlight The Profibus connection is used in systems where the UMG 96RM-P is to be incorporated into the automation environment (PLC controllers) M-Bus The UMG 96RM-M can be simply and cost-effectively integrated into consumption data acquisition systems via the M-Bus connection. The M-Bus is primarily used for the acquisition of consumption data collection from various different consumption meters, such as water, gas, heat or electrical current. 70
 network Fast and reliable")


 Rear view UMG 96RM-PN Profinet")


71 Chapter 02 UMG 96RM Ethernet (TCP/IP) with the UMG 96RM-EL Simple integration into the Ethernet (LAN) network Fast and reliable data communication 4th current transformer input Continuous monitoring of the N-conductor by means of the 4th current input Available with variants UMG 96RM-P and UMG 96RM-CBM Dimension diagrams All dimensions in mm max , Side view UMG 96RM Cut out: 92 +0,8 x 92 +0,8 mm Rear view UMG 96RM (basic device) Rear view UMG 96RM-PN Profinet variant Rear view 96RM-M M-Bus variant Rear view 96RM-EL Ethernet light variant Rear view 96RM-CBM Modbus variant Rear view 96RM-P Profibus variant The illustrations shown here are examples. Further dimensional drawings and connection diagrams are available on request or can be viewed on our homepage. 71
72 Chapter 02 UMG 96RM Typical connection 24V DC ~ K1 K2 B A Digital outputs B A RS485 UMG 96RM Basic device Power supply voltage N/- L/+ 1 2 Measuring voltage V1 V2 V3 VN Current measurement S2 S1 S2 S1 S2 S1 Loads 230V/400V 50Hz Connection variant UMG 96RM S2 S1 S2 S1 S2 S1 L1 L2 L3 N The illustration shown here is an example. Further connection diagrams are available on request or can be viewed on our homepage. Device overview and technical data UMG 96RM *1 UMG 96RM-M *1 UMG 96RM-EL *1 UMG 96RM-CBM *1 UMG 96RM-P *1 UMG 96RM-PN *1 Item no. ( V AC/ V DC) Item no. (24 90 V AC/24 90 V DC) Interfaces RS485 M-Bus Ethernet RS485, USB Comment: For detailed technical information please refer to the operation manual and the Modbus address list. = included - = not included * 1 Inclusive UL certification. * 2 Accurate device dimensions can be found in the operation manual. *3 Optionally 3 digital inputs or outputs (no pulse output) RS485, Profibus, USB RS485, Ethernet, Profinet Protocols Modbus RTU - - Modbus TCP Profibus DP V Profinet M-Bus DHCP oder DCP ICMP (Ping) Measured data recording Current measurement channel (+2) Memory (Flash) MB 256 MB - Battery Type CR V, Li-Mn Type CR V, Li-Mn Clock Digital inputs and outputs Digital inputs *3 Digital outputs (as switch or pulse output) (+3) *3 Mechanical properties Device dimensions in mm (H x W x D) *2 96 x 96 x approx x 96 x approx x 96 x approx x 96 x approx x 96 x approx x 96 x approx
 Fig.: UMG 96RM-PN with Profinet interface Fig.")
 Class 0.")
73 Chapter 02 UMG 96RM Digital input 1 Digital input 2 Digital input 3 Digital input 4 Digital output 3 Digital output 4 Digital output 5 Digital output 6 Profibus (only -P model) LED staus bar- Fig.: LED status bar for the inputs and outputs (UMG 96RM-CBM and UMG 96RM-P) Fig.: UMG 96RM-PN with Profinet interface Fig.: Battery insertion on the rear (UMG 96RM-CBM and UMG 96RM-P) General Use in low and medium voltage networks Accuracy voltage measurement 0.2 % Accuracy current measurement 0.2 % Accuracy active energy (kwh, /5 A) Class 0.5S Number of measurement points per period 426 Uninterrupted measurement RMS - momentary value Current, voltage, frequency Active, reactive and apparent power / total and per phase Power factor / total and per phase Energy measurement Active, reactive and apparent energy [L1,L2,L3, L1 L3] Number of tariffs 14 Recording of the mean values Voltage, current / actual and maximum Active, reactive and apparent power / actual and maximum Frequency / actual and maximum Demand calculation mode (bi-metallic function) / thermal Other measurements Operating hours measurement Power quality measurements Harmonics per order / current and voltage 1st 40th Distortion factor THD-U in % Distortion factor THD-I in % Rotary field indication Current and voltage, positive, zero and negative sequence component Measured data recording Average, minimum, maximum values Alarm messages Time stamp Time basis average value freely user-defined RMS averaging, arithmetic Displays and inputs / outputs LCD display (with backlighting), 2 buttons Voltage inputs L1, L2, L3 + N Password protection Software GridVis -Basic *4 Online and historic graphs Databases (Janitza DB, Derby DB); MySQL, MS SQL with higher GridVis versions) Manual reports (energy, power quality) Topology views Manual read-out of the measuring devices Graph sets Programming / threshold values / alarm management Comparator (2 Groups with 3 comparators each) Technical data Type of measurement Constant true RMS Up to 40th harmonic Nominal voltage, three-phase, 4-conductor (L-N, L-L) 277 / 480 V AC Nominal voltage, three-phase, 3-conductor (L-L) 480 V AC Measurement in quadrants 4 Networks TN, TT, IT Comment: For detailed technical information please refer to the operation manual and the Modbus address list. = included - = not included * 4 Optional additional functions with the packages GridVis -Professional, GridVis -Service and GridVis -Ultimate. 73
 18 520 Vrms Resolution 0.01 V Impedance 3 MOhm / phase Frequency measuring range 45... 65 Hz Power consumption approx. 0.1 VA Sampling frequency per channel (50 / 60 Hz) 21.")
 Overload for 1 sec. 120 A (sinusoidal) Sampling frequency per channel (50 / 60 Hz) 21.33 / 25.")
74 Chapter 02 UMG 96RM Measured voltage input Overvoltage category 300 V CAT III Measured range, voltage L-N, AC (without potential transformer) Vrms Measured range, voltage L-L, AC (without potential transformer) Vrms Resolution 0.01 V Impedance 3 MOhm / phase Frequency measuring range Hz Power consumption approx. 0.1 VA Sampling frequency per channel (50 / 60 Hz) / 25.6 khz Measured current input Rated current 1 / 5 A Resolution 0.1 ma Measurement range Amps Overvoltage category 300 V CAT II Measurement surge voltage 2 kv Power consumption approx. 0.2 VA (Ri = 5 mohm) Overload for 1 sec. 120 A (sinusoidal) Sampling frequency per channel (50 / 60 Hz) / 25.6 khz Digital inputs and outputs Digital inputs *5 Maximum counting frequency 20 Hz Input signal present V DC (typical 4 ma) Input signal not present V DC, current < 0.5 ma Digital outputs *6 Switching voltage max. 60 V DC, 33 V AC Switching current max. 50 ma Eff AC / DC Response time 10 / 12 periods + 10 ms Pulse output (energy pulse) max. 50 Hz Maximum cable length up to 30 m unscreened, from 30 m screened Mechanical properties Weight approx. 0.3 kg Protection class per EN Front: IP40; Front with seal: IP54; Back: IP20 Assembly per IEC EN / DIN EN Front panel installation Cable cross section Supply voltage 0.2 to 2.5 mm² Current measurement 0.2 to 2.5 mm² Voltage measurement 0.08 to 4.0 mm² Environmental conditions Temperature range Operation: K55 ( C) Relative humidity Operation: 0 to 90 % RH Operating height m above sea level Degree of pollution 2 Installation position user-defined Electromagnetic compatibility Electromagnetic compatibility of electrical equipment Directive 2004/108/EC Electrical equipment for use within certain voltage limits Directive 2006/95/EC Equipment safety Safety requirements for electrical equipment for measurement, regulation, control and laboratory use IEC/EN Part 1: General requirements Part 2-030: Particular requirements for testing and measuring circuits IEC/EN Noise immunity Class A: Industrial environment *7 IEC/EN Electrostatic discharge IEC/EN Voltage dips IEC/EN Emissions Class B: Residential environment IEC/EN Radio disturbanc voltage strength MHz IEC/CISPR11/EN Radiated interference voltage MHz IEC/CISPR11/EN Firmware Update via GridVis software. Firmware update Firmware download (free of charge) from the website: Mounting plate Mounting clips Fig.: The fastening into a switchboard is implemented via the side-mounted fastening clamps (UMG 96RM-P / UMG 96RM-CBM) Fig.: M-Bus interface with 2-pole plug contact Fig.: 2-pole plug contact with cable connection (cable type: 2 x 0.75 mm 2 ) via twin core end sheathes Fixing screw M+ M- Comment: For detailed technical information please refer to the operation manual and the Modbus address list = included - = not included * 5 The information relates exclusively to the measurement devices UMG 96RM-CBM, UMG 96RM-P and UMG 96RM-PN. * 6 The information relates exclusively to the measurement devices UMG 96RM, UMG 96RM-M, UMG 96RM- CBM, UMG 96RM-P and UMG 96RM-PN. * 7 UMG 96RM-PN exclusive Class A: Industrial environment 74
 TCP/IP HTTP (configurable homepage) FTP (file transfer) SNMP NTP (time synchronisation) SMTP (email function) DHCP SNTP TFTP BACnet (optional) Power quality Harmonics up to")
75 Chapter 02 UMG 96RM-E UMG 96 RM-E Power analyser with Ethernet and RCM Memory 256 MB Alarm management Residual current measurement Homepage Ethernet-Modbus gateway BACnet (optional) Communication Modbus (RTU, TCP, Gateway) TCP/IP HTTP (configurable homepage) FTP (file transfer) SNMP NTP (time synchronisation) SMTP ( function) DHCP SNTP TFTP BACnet (optional) Power quality Harmonics up to 40th harmonic Rotary field components Distortion factor THD-U / THD-I Networks TN, TT, IT networks 3 and 4-phase networks Up to 4 single-phase networks 2 digital outputs Pulse output kwh / kvarh Switch output Threshold value output Logic output Remote via Modbus / Profibus 3 digital inputs/outputs Usable as either inputs or outputs Interfaces RS485 Ethernet Measured data memory 256 MB Flash 2 analogue inputs Analogue, temperature or residual current input (RCM) Accuracy of measurement Energy: Class 0.5S ( / 5 A) Current: 0.2 % Voltage: 0.2 % Temperature measurement PT100, PT1000, KTY83, KTY84 Network visualisation software Free GridVis -Basic 75
 Acquisition of the energy consumption for cost centre analysis Measured value transducer for building management systems or PLC (Modbus) Monitoring of power quality characteristics,")

76 Chapter 02 UMG 96RM-E Areas of application Measurement, monitoring and checking of electrical characteristics in energy distribution systems Recording of load profiles in energy management systems (e.g. ISO 50001) Acquisition of the energy consumption for cost centre analysis Measured value transducer for building management systems or PLC (Modbus) Monitoring of power quality characteristics, e.g. harmonics up to 40th harmonic Residual current monitoring (RCM) Main features Universal meter Operating current monitoring for general electrical parameters High transparency through a multi-stage and scalable measurement system in the field of energy measurement Acquisition of events through continuous measurement with 200 ms high resolution RCM device Continuous monitoring of residual currents (Residual Current Monitor, RCM) Alarming in case a preset threshold fault current reached Near-realtime reactions for triggering countermeasures Permanent RCM measurement for systems in permanent operation without the opportunity to switch off Energy measurement device Fig.: UMG 96RM-E with residual current monitoring via measuring inputs I5 / I6 Continuous acquisition of the energy data and load profiles Essential both in relation to energy efficiency and for the safe design of power distribution systems Harmonics analyser / event recorder Analysis of individual harmonics for current and voltage Prevention of production downtimes Significantly longer service life for equipment Rapid identification and analysis of power quality fluctuations by means of user-friendly tools (GridVis ) Fig.: Event logger: Voltage dip in the low voltage distribution system 76
 7 tariffs for apparent energy L1, L2 and L3, for each phase Highest possible degree of reliability Continuous leakage current measurement Historical data: Long-term monitoring of")


77 Chapter 02 UMG 96RM-E Extensive selection of tariffs 7 tariffs each for effective energy (consumption, delivery and without backstop) 7 tariffs each for reactive energy (inductive, capacitive and without backstop) 7 tariffs for apparent energy L1, L2 and L3, for each phase Highest possible degree of reliability Continuous leakage current measurement Historical data: Long-term monitoring of the residual current allows changes to be identified in good time, e.g. insulation faults Time characteristics: Recognition of time relationships Prevention of neutral conductor carryover RCM threshold values can be optimized for each individual case: Fixed, dynamic and stepped RCM threshold value Monitoring of the CGP (central ground point) and the subdistribution panels Fig.: Continuous leakage current measurement Analysis of fault current events Event list with time stamp and values Presentation of fault currents with characteristic and duration Reproduction of phase currents during the fault current surge Presentation of the phase voltages during the fault current surge Analysis of the harmonic fault current components Fig.: Analysis of fault current events Frequencies of the fault currents (fault type) Current peaks of the individual frequency components in A and % Harmonics analysis up to 40th harmonic Maximum values with real-time bar display Digital IOs Extensive configuration of IOs for intelligent integration, alarm and control tasks Fig.: Analysis of the harmonic fault current components 77


78 Chapter 02 UMG 96RM-E Ethernet (TCP/IP)- / Homepage- / Ethernet-Modbus gateway functionality Simple integration into the network More rapid and reliable data transfer Modern homepage World-wide access to measured values by means of standard web browsers via the device's inbuilt homepage Access to measurement data via various channels Reliable saving of measurement data possible over a very long periods of time in the 256 MByte measurement data memory Connection of Modbus slave devices via Ethernet-Modbus gateway Fig.: Ethernet-Modbus gateway functionality Measuring device homepage Webserver on the measuring device, i.e. device's own homepage Remote operation of the device display via the homepage Comprehensive measurement data incl. PQ Online data directly available via the homepage, historic data optional via the APP measured value monitor, Fig.: Illustration of the online data via the device's inbuilt homepage Dimension diagrams All dimensions in mm 72 ca , Side view Rear view Cut out: 92 +0,8 x 92 +0,8 mm 78

79 Chapter 02 UMG 96RM-E Typical connection + = - S1 S2 S3-24V = DC + K1 K2 - = + K3 K4 K5 PT ma IDIFF B A Gruppe Group 1 Gruppe Group 2 I5 I6 Digital-Eingänge/Ausgänge inputs/outputs Analog-Eingänge inputs B A RS485 Power Versorgungsspannung voltage supply N/- L/+ 1 2 Measuring Spannungsmessung voltage V1 V2 V3 VN UMG 96RM-E (RCM) Current Strommessung measurement Ethernet 10/100Base-T RJ45 I4 S2 S1 S2 S1 S2 S1 S2 S PC 1) 2) 2) 2) 3) 3) 3) 3) Verbraucher Loads 230V/400V 50Hz S2 S2 S1 S2 S1 S1 S2 S1 L1 L2 L3 N Fig.: Connection example with temperature and residual current measurement Device overview and technical data UMG 96RM-E *1 Item number ( V AC / V DC) Item number (24 90 V AC / V DC) BACnet communication General Use in low and medium voltage networks Accuracy voltage measurement 0.2 % Accuracy current measurement 0.2 % Accuracy active energy (kwh, /5 A) Class 0.5S Number of measurement points per period 426 Uninterrupted measurement RMS - momentary value Current, voltage, frequency Active, reactive and apparent power / total and per phase Power factor / total and per phase Energy measurement Active, reactive and apparent energy [L1, L2, L3, L1 L3] Number of tariffs 14 Recording of the mean values Voltage, current / actual and maximum Active, reactive and apparent power / actual and maximum Frequency / actual and maximum Demand calculation mode (bi-metallic function) / thermal Fig.: Connection example residual current measurement and PE monitoring Comment: For detailed technical information please refer to the operation manual and the Modbus address list. = included - = not included * 1 Inclusive UL certification. 79

80 Chapter 02 UMG 96RM-E Other measurements Operating hours measurement Clock Power quality measurements Harmonics per order / current and voltage 1st 40th Distortion factor THD-U in % Distortion factor THD-I in % Rotary field indication Current and voltage, positive, zero and negative sequence component Error / event recorder function Under and overvoltage recording Measured data recording Memory (Flash) 256 MB Average, minimum, maximum values Current measurement channel 4 (+2) Alarm messages Time stamp Time basis average value freely user-defined RMS averaging, arithmetic Displays and inputs / outputs LCD display (with backlighting), 2 buttons Digital outputs (as switch or pulse output) 2 Digital inputs and outputs (selectable) 3 Analogue inputs (RCM, temperature, analogue) 2 Voltage inputs L1, L2, L3 + N Password protection Communication Interfaces RS485: kbps (Screw-type terminal) Ethernet 10/100 Base-TX (RJ-45 socket) Protocols Modbus RTU Modbus TCP/IP Modbus RTU over Ethernet Modbus Gateway for Master-Slave configuration HTTP (homepage configurable) SMTP ( ) NTP (time synchronisation) TFTP FTP (File-Transfer) SNMP DHCP BACnet (optional) ICMP (Ping) Software GridVis -Basic *2 Online and historic graphs Databases (Janitza DB, Derby DB); MySQL, MS SQL with higher GridVis versions) Manual reports (energy, power quality) Topology views Manual read-out of the measuring devices Graph sets Programming / threshold values / alarm management Comparator (5 Groups with 10 comparators each) Comprehensive adjustment options for RCM Fig.: GridVis software, configuration menu Comment: For detailed technical information please refer to the operation manual and the Modbus address list. = included - = not included * 2 Optional additional functions with the packages GridVis -Professional, GridVis -Service and GridVis -Ultimate. 80

 277 / 480 V AC Nominal voltage, three-phase, 3-conductor (L-L) 480 V AC Measurement in quadrants 4 Networks TN, TT, IT Measured voltage input Overvoltage category 300 V CAT III")
81 Chapter 02 UMG 96RM-E Fig.: RCM configuration, e.g. dynamic threshold value formation, for load-dependent threshold value adaptation Fig.: Residual current transformer for the acquisition of residual currents. Wide range with different configurations and sizes allow use in almost all applications Technical data Type of measurement Constant true RMS Up to 40th harmonic Nominal voltage, three-phase, 4-conductor (L-N, L-L) 277 / 480 V AC Nominal voltage, three-phase, 3-conductor (L-L) 480 V AC Measurement in quadrants 4 Networks TN, TT, IT Measured voltage input Overvoltage category 300 V CAT III Measured range, voltage L-N, AC (without potential transformer) Vrms Measured range, voltage L-L, AC (without potential transformer) Vrms Resolution 0.01 V Impedance 3 MOhm / phase Frequency measuring range Hz Power consumption approx. 0.1 VA Sampling frequency per channel (50 / 60 Hz) / 25.6 khz Measured current input Rated current 1 / 5 A Resolution 0.1 ma Measurement range Amps Overvoltage category 300 V CAT II Measurement surge voltage 2 kv Power consumption approx. 0.2 VA (Ri = 5 mohm) Overload for 1 sec. 120 A (sinusoidal) Sampling frequency per channel (50 / 60 Hz) / 25.6 khz Residual current input Analogue inputs 2 (for residual current or temperature measurement) Measurement range, residual current input* ma Digital outputs Switching voltage max. 60 V DC, 33 V AC Switching current max. 50 ma Eff AC / DC Response time 10 / 12 periods + 10 ms Pulse output (energy pulse) max. 50 Hz Maximum cable length up to 30 m unscreened, from 30 m screened Mechanical properties Weight approx. 370 g Device dimensions in mm (H x W x D) *4 96 x 96 x 78 Battery CR2032, 3 V,type Lithium Protection class per EN Front: IP40; Front with seal: IP54; Back: IP20 Assembly per IEC EN / DIN EN Front panel installation Cable cross section Supply voltage 0.2 to 2.5 mm² Current measurement 0.2 to 2.5 mm² Voltage measurement 0.08 to 4.0 mm² Environmental conditions Temperature range Operation: K55 ( C) Relative humidity Operation: 0 to 75 % RH Operating height ,000 m above sea level Degree of pollution 2 Installation position user-defined Electromagnetic compatibility Electromagnetic compatibility of electrical equipment Directive 2004/108/EC Electrical appliances for application within particular voltage limits Directive 2006/95/EC Comment: For detailed technical information please refer to the operation manual and the Modbus address list. = included - = not included * 3 Example of residual current input 30 ma with 600/1 residual current transformer: 600 x 30 ma = 18,000 ma * 4 Accurate device dimensions can be found in the operation manual. 81

82 Chapter 02 UMG 96 RM-E Equipment safety Safety requirements for electrical equipment for measurement, regulation, control IEC/EN and laboratory use Part 1: General requirements Part 2-030: Particular requirements for IEC/EN testing and measuring circuits Noise immunity Class A: Industrial environment IEC/EN Electrostatic discharge IEC/EN Voltage dips IEC/EN Emissions Class B: Residential environment IEC/EN Radio disturbanc voltage strength MHz IEC/CISPR11/EN Radiated interference voltage MHz IEC/CISPR11/EN Safety Europe CE labelling Firmware Update via GridVis software. Firmware download (free of charge) from Firmware update the website: Comment: For detailed technical information please refer to the operation manual and the Modbus address list. = included - = not included L3 L2 L1 N Energy, operating current, PQ Summation current measurement (RCM) of residual current Measurement of the central grounding point 82
83 Chapter 02 UMG 96-PA UMG 96-PA 4-in-1 energy measurement device four functions one solution Power quality Colour graphical display Harmonics GridVis Analysis software Modbus interface Accuracy of measurement 0.5 Interface RS485 Power quality Harmonics up to 25th harmonic, odd Distortion factor THD-U Distortion factor THD-I Networks TN, TT networks with voltage swell category 600 V CAT III Communication Protocols: Modbus RTU / Slave Accuracy of measurement Energy: Class 0.5 S ( / 5 A) Current: 0.2 % Voltage: 0.2 % COMING SOON MID measurement Tamper-proof and legally secure Measured data memory 4 MB Intuitive user guidance Colour graphics display with userfriendly menu guidance Digital inputs and outputs 3 each Network visualisation software Free GridVis Basic 83


 3 Current measurement inputs Continuous sampling of the voltage and")

84 Chapter 02 UMG 96-PA Areas of application Measurement, monitoring and checking of electrical characteristics in energy distribution systems Recording of load profiles in energy management systems (e.g. ISO 50001) Acquisition of the energy consumption for cost centre analysis Measured value transducer for building management systems or PLC (Modbus) As MID variant, suitable for accounting applications Optional module-based extension for residual and leakage current measurement Near-realtime reactions for triggering countermeasures Permanent RCM measurement for systems in permanent operation without the opportunity to switch off Main features Power quality Harmonics analysis up to 25th harmonic, indirect Distortion factor THD-U / THD-I Minimum and maximum values Measurement of positive, negative and zero sequence component Features 3 Voltage measurement inputs (600 V CATIII) 3 Current measurement inputs Continuous sampling of the voltage and current measurement inputs Measurement of the reactive distortion power Sampling rate 8.33 khz Transfer of the measured values via a serial interface Fig.: UMG 96-PA energy measurement device Extension of functions by add-on modules 2 analogue inputs can be selected as 0 20 ma analogue inputs or as RCM measuring inputs with detection of cable breaks and additional temperature measurement Module selectable with Ethernet interface Continuous monitoring of residual currents (Residual Current Monitoring, RCM) Fig.:UMG 96-PA incl. module with Ethernet connection 84

85 Chapter 02 UMG 96-PA Digital IOs Additional application options with comprehensive peripherals (three digital inputs and outputs and an analogue output) Extensive configuration of IOs for intelligent integration for monitoring of limit values and message upon exceedance User-friendly, colour graphical display with intuitive user guidance High resolution colour graphical display 320 x 240 pixels, 6 buttons User-friendly, self-explanatory and intuitive operation Illustration of measured values in numeric form, as a bar graph or line graph MID-compliant measurement Certified and tamp-proof measurement Legally secure accounting & energy acquisition (EEG [German renewable energy sources] law, StromStG [German electricity tax law]) Fulfilment of legal stipulations Fig.: UMG 96-PA colour graphics display 85
86 Chapter 02 UMG 96-PA Typical connection variant + = - S1 S2 S3 - = + K3 K4 K5 - = + Data GND A B Digitaleingänge Versorgungsspannung L/+ N/ V V+ Digitalausänge Analogausgang UMG 96-PA C A B RS485 Spannungsmessung V1 V2 V3 VN Strommessung I1 I2 I3 S1 S2 S1 S1 S2 S PE PE N L1 N L1 L2 L3 230V/400V 50Hz S1 S2 S1 S2 S1 S2 Verbraucher Device overview and technical data, basic device Basic device without MID *1 UMG 96-PA Item number Measured voltage (L-N/L-L) 417 / 720 V AC Supply voltage (from 3-phase network) - General Use in low and medium voltage networks Accuracy of measurement with voltage 0.2 % Accuracy of measurement with current 0.2 % Accuracy of measurement with active energy (kwh, /5 A) Class 0.5S Number of measurement points per period 166 Uninterrupted measurement RMS - momentary value Current, voltage, frequency Active, reactive and apparent power / total and per phase Power factor / total and per phase Energy measurement Active, reactive and apparent energy [L1,L2,L3, L1-L3] Number of tariffs HT / LT Recording of the mean values Voltage, current / present and maximum Active, reactive and apparent power / present and maximum Frequency / present and maximum Comment: For detailed technical information, please refer to the operation manual and the Modbus address list. = included - = not included *1 MID certification applied for 86
87 Chapter 02 UMG 96-PA UMG 96-PA Measurement of the power quality Harmonics per order / current 1. 25th. Harmonic per order / voltage 1. 25th. Distortion factor THD-U in % Distortion factor THD-I in % Current and voltage, positive, zero and negative sequence component Measured data recording Current measurement channels 3 Recording period Up to 144 days Memory (Flash) 4 MB Battery CR2032 Clock Mean, minimum, maximum values Communication Interfaces RS485: Autobaud, kbps (Screw-type terminal) Protocols Modbus RTU Software GridVis Basic *1 Online graphs Databases (Janitza DB, Derby DB) Manual reports (energy, power quality) Topology views Manual read-out of the measuring devices Graph sets Programming / threshold values / alarm management Technical data Comparator (2 Groups with 3 comparators each) Continuous real effective value Type of measurement measurement up to the 25th harmonic Nominal voltage, three-phase, 4-conductor (L-N, L-L) 417 / 720 V AC (+ 10%) Measurement in quadrants 4 Networks TN, TT Measured voltage input Overvoltage category 600 V CAT III Maximum metering range, voltage L-N, AC (without transformer) Vrms Maximum metering range, voltage L-L, AC (without transformer) Vrms Resolution 0.01 V Frequency measuring range 45 to 65 Hz Power consumption 4.5 VA Measurement voltage surge 6 kv Sampling rate 8.33 khz / phase Measured current input Rated current 1 / 5 A Resolution 0.1 ma Metering range Amps Overvoltage category 300 V CAT II Measurement voltage surge 2 kv Power consumption Approx. 0.2 VA (Ri = 5 mohm) Overload for 1 sec. 60 A (sinusoidal) Sampling rate 8.33 khz / phase Mechanical properties Weight 250 g Device dimensions in mm (H x W x D) Approx. 96 x 96 x 86 Protection class per EN Front IP40 / back IP20 Assembly per IEC EN / DIN EN Front panel installation Connecting phase (U), Single core, multi-core, fine-stranded Terminal pins, core end sheath Connecting phase (I), Single core, multi-core, fine-stranded Terminal pins, core end sheath 0.08 to 4.0 mm² 0.2 to 2.5 mm² 0.2 to 2.5 mm² 0.2 to 2.5 mm² 87
88 Chapter 02 UMG 96-PA Environmental conditions Temperature range Operation: K55 ( C) Relative humidity Operation: 0 to 75 % Operating altitude 0 to 2,000 m above sea level Pollution degree 2 Installation position any Electromagnetic compatibility Electromagnetic compatibility of equipment Directive 2004/108/EC Electrical equipment for use within certain voltage limits Directive 2006/95/EC Equipment safety Safety requirements for electrical equipment for measurement, control, and laboratory use IEC/EN Part 1: General requirements Part 2-030: Particular requirements for testing and measuring circuits IEC/EN Immunity from interference Industrial area IEC/EN Electrostatic discharge IEC/EN Voltage dips IEC/EN Emissions Class A: Residential area IEC/EN RFI Field Strength 30 1,000 MHz IEC/CISPR11/EN Radiated interference voltage MHz IEC/CISPR11/EN Safety Europe CE labelling Firmware Update via GridVis software. Firmware update Firmware download (free of charge) from the website: * 1 Optional additional functions with the packages GridVis -Professional, GridVis -Service and GridVis -Ultimate. Comment: For detailed technical information please refer to the operation manual and the Modbus address list. = included - = not included Dimension diagrams All dimensions in mm 96 Battery 87,2 6 Cut-out size: 92 +0,8 x 92 +0,8 mm 87,2 6 Side view View from below 88

89 Chapter 02 UMG 96-PA Fourth current transformer input (e.g. N-phase) Ethernet connection COMING SOON Fig.:UMG 96-PA with Ethernet connection Fig.:UMG 96-PA basic device without module Device overview and technical data module Modules for the UMG 96-PA Module without Ethernet connection Available soon Module with Ethernet connection Available soon Residual current input Analogue inputs 2 for residual current or analogue measurement Rated current 30 ma rms Triggering current 50 µa Resolution 1 µa Temperature measurement 1x Update time 1 second Connectable sensors PT100, PT1000, KTY83, KTY84 Current measurement N measuring (I4) Rated current 1 / 5 A Overvoltage category 300 V CAT II Power consumption Approx. 0.2 VA (Ri = 5 mohm) Sampling rate 8.33 khz Interface Ethernet connection RJ45, 10/100 Mbit 89
90 Chapter 02 UMG 96-PA Typical connection variant UMG 96-PA Modul-Konnektor Modul-Konnektor UMG 96-PA Modul (mit Ethernet-Anschluss) Analog-Eingänge I4 S2 S ma IPE 0-30 ma IDIFF PT100 L1 L2 L3 N S2 S1 230V/400V 50Hz Verbraucher Ethernet 10/100Base-T RJ45 PC 90
 Modbus (RTU, TCP, Gateway) TCP/IP BACnet (optional) HTTP (Homepage) FTP (File transfer) SNMP TFTP NTP (time synchronisation) SMTP (email function) DHCP Interfaces")
91 Chapter 02 Network analyser UMG 508 UMG 508 Multifunction power analyser Power quality Colour graphical display Ethernet connection Ethernet-Modbus gateway Graphic programming Alarm management Communication Profibus (DP/V0) Modbus (RTU, TCP, Gateway) TCP/IP BACnet (optional) HTTP (Homepage) FTP (File transfer) SNMP TFTP NTP (time synchronisation) SMTP ( function) DHCP Interfaces Ethernet Profibus / RS485 (DSUB-9) Accuracy of measurement Energy: Class 0.2S ( / 5 A) Current: 0.2 % Voltage: 0.1 % Power quality Harmonics up to 40th harmonic Short-term interruptions (> 20 ms) Transient recorder (> 50 μs) Starting currents (> 20 ms) Unbalance Full wave effective value recording (up to 4.5 min.) Networks IT, TN, TT networks 3 and 4-phase networks Up to 4 single-phase networks Measured data memory 256 MByte Flash 32 MB SDRAM PLC functionality Graphical programming Jasic programming language Programming of threshold values etc. 8 digital inputs Pulse input Logic input State monitoring HT / LT switching 5 digital outputs Pulse output kwh / kvarh Switch output Threshold value output Logic output Peak demand management (optional) Up to 64 switch-off stages Network visualisation software Free GridVis -Basic 91

 Main features High quality measurement with high sampling rate (20 khz per channel) Power quality Harmonics analysis up to 40th harmonic Acquisition of short-term interruptions")
92 Chapter 02 UMG 508 Areas of application Continuous monitoring of the power quality Energy management systems (ISO 50001) Master device with Ethernet gateway for subordinate measurement points Visualisation of the energy supply in the LVDB Analysis of electrical disturbances in the event of power quality problems Cost centre analysis Remote monitoring in the property operation Use in test fields (e.g. in universities) Main features High quality measurement with high sampling rate (20 khz per channel) Power quality Harmonics analysis up to 40th harmonic Acquisition of short-term interruptions Acquisition of transients Display of waveforms (current and voltage) Unbalance Vector diagram Fig.: GridVis Graph set User-friendly, colour graphical display with intuitive user guidance High resolution graphics display User-friendly, self-explanatory and intuitive operation Clear and informative representation of online graphs and further power quality events Modern communications architecture via Ethernet Ethernet interface and web server Faster, better cost-optimised and more reliable communication system High flexibility due to the use of open standards Integration in PLC systems and BMS through additional interfaces BACnet optionally available Fig.: Large colour display, e.g. 12 monthly demand values 92
 Jasic source code programming")


93 Chapter 02 UMG 508 Modbus Gateway function Economical connection of devices without Ethernet interface Integration of devices with Modbus-RTU interface possible Data can be scaled and described Minimised number of IP addresses required Graphical programming Comprehensive programming options (PLC functionality) Jasic source code programming Sustainable functional expansions far beyond pure measurement Complete APPs from the Janitza library Fig.: GridVis topology view Powerful alarm management Internet Can be programmed via the graphic programming or Jasic source code All measured values can be used Can be arbitrarily, mathematically processed Individual forwarding via sending, switching of digital outputs, writing to Modbus addresses etc. Watchdog APP Further alarm management functions via GridVis -Service alarm management Fig.: The alarm management system reports events arising in good time. Dimension diagrams All dimensions in mm Side view View from below Ethernet connection Cut out: ,8 x ,8 mm 93
94 Chapter 02 UMG 508 Typical connection SPS SPS DSUB Digital Outputs 1-5 Digital Inputs 5-8 Digital Inputs 1-4 RS485 Modbus/Profibus UMG 508 Ethernet 10/100Base-TX RJ45 Switch Auxiliary Supply N/- L/+ PE I1 Current Input 1-4 I2 I3 I4 Voltage Input 1-4 V1 V2 V3 V4 Vref PC PC PE PE N N S1 S2 L1 L1 S1 S2 L2 S1 S2 L3 S1 S2 Device overview and technical data UMG 508 Item number Supply voltage AC V AC V AC Supply voltage DC V DC V DC Item number (UL) Supply voltage AC V AC V AC Supply voltage DC V DC V DC Device options Emax function (peak demand management) BACnet communication General Use in low, medium and high voltage networks Accuracy voltage measurement 0.1 % Accuracy current measurement 0.2 % Accuracy active energy (kwh, /5 A) Class 0.2S Number of measurement points per period 400 Uninterrupted measurement RMS - momentary value Current, voltage, frequency Active, reactive and apparent power / total and per phase Power factor / total and per phase Energy measurement Active, reactive and apparent energy [L1, L2, L3, L4, L1 L3, L1 4] Number of tariffs 8 Recording of the mean values Voltage, current / actual and maximum Active, reactive and apparent power / actual and maximum Frequency / actual and maximum Demand calculation mode (bi-metallic function) / thermal Other measurements Operating hours measurement Clock Weekly timer Jasic Power quality measurements Harmonics per order / current and voltage Harmonics per order / active and reactive power 1st 40th 1st 40th L1 L2 L3 N PE Fig.: Current and voltage measurement S1 S2 S1 S2 Comment: For detailed technical information please refer to the operation manual and the Modbus address list S1 S2 = included - = not included 94


95 Chapter 02 UMG 508 Fig.: Example for the configuration of current measurement via 3 current transformers in a threephase 4-wire network on the UMG 508 display Fig.: Illustration of the full wave effective values for an event Comment: For detailed technical information please refer to the operation manual and the Modbus address list. = included - = not included * 1 Optional additional functions with the packages GridVis -Professional, GridVis -Service and GridVis -Ultimate. * 2 With UL variants: 347/600 V Distortion factor THD-U in % Distortion factor THD-I in % Voltage unbalance Rotary field indication Current and voltage, positive, zero and negative sequence component Transients > 50 µs Error / event recorder function Short-term interruptions 20 ms Oscillogram recording (waveform U and I) Full wave effective values (U, I, P, Q) Under and overvoltage recording Measured data recording Memory (Flash) 256 MB Average, minimum, maximum values Measured data channels 8 Alarm messages Time stamp Time basis average value freely user-defined RMS averaging, arithmetic Displays and inputs / outputs LCD colour graphical display 320 x 240, 256 colours, 6 buttons Language selection Digital inputs 8 Digital outputs (as switch or pulse output) 5 Voltage and current inputs each 4 Password protection Peak load management (optionally 64 channels) Communication Interfaces RS485: kbps (DSUB-9 connector) Profibus DP: Up to 12 Mbps (DSUB-9-plug) Ethernet 10/100 Base-TX (RJ-45 socket) Protocols Modbus RTU, Modbus TCP, Modbus RTU over Ethernet Modbus Gateway for Master-Slave configuration Profibus DP V0 HTTP (homepage configurable) SMTP ( ) NTP (time synchronisation) TFTP FTP (File-Transfer) SNMP DHCP TCP/IP BACnet (optional) ICMP (Ping) Software GridVis -Basic *1 Online and historic graphs Databases (Janitza DB, Derby DB); MySQL, MS SQL with higher GridVis versions) Manual reports (energy, power quality) Graphical programming Topology views Manual read-out of the measuring devices Graph sets Programming / threshold values / alarm management Application programs freely programmable 7 Graphical programming Programming via source code Jasic Technical data Type of measurement Constant true RMS Up to 40th harmonic Nominal voltage, three-phase, 4-conductor (L-N, L-L) 417 / 720 V AC *2 Nominal voltage, three-phase, 3-conductor (L-L) 600 V AC Measurement in quadrants 4 Networks TN, TT, IT Measurement in single-phase/multi-phase networks 1 ph, 2 ph, 3 ph, 4 ph and up to 4 times 1 ph Measured voltage input Overvoltage category 600 V CAT III Measured range, voltage L-N, AC (without potential transformer) Vrms 95
96 Chapter 02 UMG 508 Measured range, voltage L-L, AC (without potential transformer) Vrms Resolution 0.01 V Impedance 4 MOhm / phase Frequency measuring range Hz Power consumption approx. 0.1 VA Sampling frequency 20 khz / phase Measured current input Rated current 1 / 5 A Resolution 0.1 ma Measurement range Amps Overvoltage category 300 V CAT III Measurement surge voltage 4 kv Power consumption approx. 0.2 VA (Ri = 5 MOhm) Overload for 1 sec. 120 A (sinusoidal) Sampling frequency 20 khz Digital inputs and outputs Number of digital inputs 8 Maximum counting frequency 20 Hz Reaction time (Jasic program) 200 ms Input signal present V DC (typical 4 ma) Input signal not present V DC, current < 0.5 ma Number of digital outputs 5 Switching voltage max. 60 V DC, 30 V AC Switching current max. 50 ma Eff AC / DC Output of voltage dips 20 ms Pulse output (energy pulse) max. 20 Hz Maximum cable length up to 30 m unscreened, from 30 m screened Mechanical properties Weight 1080 g Device dimensions in mm (H x W x D) 144 x 144 x approx. 81 Battery Type CR1/2AA, 3 V, Li-Mn Protection class per EN Front: IP40; Rear: IP20 Assembly per IEC EN / DIN EN Front panel installation Connecting phase (U / I), Single core, multi-core, fine-stranded Terminal pins, core end sheath Environmental conditions Temperature range Relative humidity Operating height 0.2 to 2.5 mm² 0.2 to 2.5 mm² Operation: K55 ( C) Operation: % RH ,000 m above sea level Degree of pollution 2 Installation position user-defined Electromagnetic compatibility Electromagnetic compatibility of electrical equipment Directive 2004/108/EC Electrical appliances for application within particular voltage limits Directive 2006/95/EC Equipment safety Safety requirements for electrical equipment for measurement, regulation, control and laboratory use IEC/EN Part 1: General requirements Part 2-030: Particular requirements for testing and measuring circuits IEC/EN Noise immunity Class A: Industrial environment IEC/EN , EMV-ILA Version Electrostatic discharge IEC/EN Voltage dips IEC/EN , EMV-ILA V01-03 Emissions Class B: Residential environment IEC/EN , EMV-ILA Version Radio disturbanc voltage strength MHz IEC/CISPR11/EN Radiated interference voltage MHz IEC/CISPR11/EN Radiated interference voltage khz EMV-ILA V01-03 Safety Europe CE labelling USA and Canada UL variants available Firmware Firmware update Update via GridVis software. Firmware download (free of charge) from the website: External auxiliary power Fig.: Connection of two electronic relays to digital outputs 4 and 5 Comment: For detailed technical information please refer to the operation manual and the Modbus address list. = included - = not included 96

97 Chapter 02 UMG 509-PRO UMG 509-PRO Multifunction power analyser with RCM 25. Grenzwertüberwachung Power quality RCM Residual current monitoring Transienten Ethernet connection Ethernet-Modbus gateway Graphic programming Alarm management 32 MB 128 MB 256 MB 512 K Communication Profibus (DP/V0) Modbus (RTU, TCP, Gateway) TCP/IP BACnet (optional) HTTP (Homepage) FTP (File transfer) SNMP TFTP NTP (time synchronisation) SMTP ( function) DHCP Power quality Harmonics up Datenspeicher to 63th harmonic Short-term interruptions (> 20 ms) Transient recorder (> 50 μs) Starting currents (> 20 ms) Unbalance Networks IT, TN, TT networks 3 and 4-phase networks Up to 4 single-phase networks 2 digital inputs Pulse input Logic input State monitoring HT / LT switching 2 digital outputs Pulse output kwh / kvarh Switch output Threshold value output Logic output Interfaces Ethernet Profibus (DSUB-9) RS485 Modbus (terminal strip) Measured data 1memory 256 MByte Flash Tariffs 32 MB SDRAM 2 Tariffs Network visualisation software Free GridVis -Basic 14 Tariffs Accuracy of measurement Energy: Class 0.2S ( / 5 A) Current: 0.2 % Voltage: 0.1 % PLC functionality Graphical programming Jasic programming language Programming of threshold values etc. Thermistor input PT100, PT1000, KTY83, KTY84 Messg O C RCM Residual Current Monitoring 2 residual current inputs 97 Temperatureingang Modbus

 Main features High quality measurement with high sampling rate (20 khz per channel) Power quality Harmonics analysis up to 63rd harmonic Acquisition of short-term interruptions")
98 Chapter 02 UMG 509-PRO Areas of application Continuous monitoring of the power quality Energy management systems (ISO 50001) Master device with Ethernet gateway for subordinate measurement points Visualisation of the energy supply in the LVDB Analysis of electrical disturbances in the event of power quality problems Cost centre analysis Remote monitoring in the property operation Use in test fields (e.g. in universities) Main features High quality measurement with high sampling rate (20 khz per channel) Power quality Harmonics analysis up to 63rd harmonic Acquisition of short-term interruptions Acquisition of transients Display of waveforms (current and voltage) Unbalance Vector diagram RCM (Residual Current Monitoring) Continuous monitoring of residual currents (Residual Current Monitor, RCM) Alarming in case a preset threshold fault current reached Near-realtime reactions for triggering countermeasures Permanent RCM measurement for systems in permanent operation without the opportunity to switch off Ideal for the central earthing point in TN-S systems Modern communications architecture via Ethernet Ethernet interface and web server Faster, better cost-optimised and more reliable communication system High flexibility due to the use of open standards Integration in PLC systems and BMS through additional interfaces BACnet optionally available Up to 4 ports simultaneous Versatile IP protocols Fig.: Example RCM measurement 98


99 Chapter 02 UMG 509-PRO Modbus Gateway function Economical connection of devices without Ethernet interface Integration of devices with Modbus-RTU interface possible Data can be scaled and described Minimised number of IP addresses required Graphical programming Fig.: GridVis Alarmmanagement Comprehensive programming options (PLC functionality) Jasic source code programming Sustainable functional expansions far beyond pure measurement Complete APPs from the Janitza library Powerful alarm management Can be programmed via the graphic programming or Jasic source code All measured values can be used Can be arbitrarily, mathematically processed Individual forwarding via sending, switching of digital outputs, writing to Modbus addresses etc. Watchdog APPs Further alarm management functions via GridVis -Service alarm management Dimension diagrams All dimensions in mm Side view View from below Ethernet connection Cut out: ,8 x ,8 mm 99
100 Chapter 02 UMG 509-PRO Typical connection IDIFF IPE PT100 A K1 + B K ma A B RS485 UMG 509-PRO I5 I6 RCM Temp Digital Outputs Digital Inputs Ethernet 10/100Base-T RJ45 Switch PC PC Hilfsenergie Auxiliary Supply L/+ N/ PE Strommessung 1-4 Current Input 1-4 I1 I2 I3 S1 S2 S1 S2 S1 S I4 S1 S Spannungsmessung 1-4 Voltage Input 1-4 V1 V2 V3 V4 VN Profibus DSUB-9 SPS SPS PE PE N L1 N L1 S1 L2 L3 S2 S1 S2 S1 S2 S1 S2 Verbraucher Loads Device overview and technical data UMG 509-PRO Item number Supply voltage AC V AC V AC Supply voltage DC V DC V DC Device options BACnet communication General Use in low, medium and high voltage networks Accuracy voltage measurement 0.1 % Accuracy current measurement 0.2 % Accuracy active energy (kwh, /5 A) Class 0.2S Number of measurement points per period 400 Uninterrupted measurement RMS - momentary value Current, voltage, frequency Active, reactive and apparent power / total and per phase Power factor / total and per phase Energy measurement Active, reactive and apparent energy [L1, L2, L3, L4, L1 L3, L1 4] Number of tariffs 8 Recording of the mean values Voltage, current / actual and maximum Active, reactive and apparent power / actual and maximum Frequency / actual and maximum Demand calculation mode (bi-metallic function) / thermal Other measurements Operating hours measurement Clock Weekly timer Jasic Power quality measurements Harmonics per order / current and voltage Harmonics per order / active and reactive power Distortion factor THD-U in % Distortion factor THD-I in % Comment: For detailed technical information please refer to the operation manual and the Modbus address list 1st 63rd 1st 63rd L1 L2 L3 N PE S1 S2 S1 S2 Last S1 S2 S1 S2 Fig.: Example current measurement = included - = not included 100
 Comment: For detailed technical information please refer to the operation manual and the Modbus address list.")
101 Chapter 02 UMG 509-PRO Fig.: Example for the configuration of current measurement via 3 current transformers in a threephase 4-wire network on the UMG 509-PRO display Fig.: Illustration of the full wave effective values for an event (voltage drop) Comment: For detailed technical information please refer to the operation manual and the Modbus address list. = included - = not included * 1 Optional additional functions with the packages GridVis -Professional, GridVis -Service and GridVis -Ultimate. * 2 With UL variants: 347/600 V Voltage unbalance Rotary field indication Current and voltage, positive, zero and negative sequence component Transients > 50 µs Error / event recorder function Short-term interruptions 20 ms Oscillogram recording (waveform U and I) Full wave effective values (U, I, P, Q) Under and overvoltage recording Measured data recording Memory (Flash) 256 MB Average, minimum, maximum values Measured data channels 10 Alarm messages Time stamp Time basis average value freely user-defined RMS averaging, arithmetic Displays and inputs / outputs LCD colour graphical display 320 x 240, 256 colours, 6 buttons Language selection Digital inputs 2 Digital outputs (as switch or pulse output) 2 Voltage and current inputs each 4 Residual current inputs 2 Temperature input 1 Password protection Communication Interfaces RS485: kbps (terminal board) Profibus DP: Up to 12 Mbps (DSUB-9-plug) Ethernet 10/100 Base-TX (RJ-45 socket) Protocols Modbus RTU, Modbus TCP, Modbus RTU over Ethernet Modbus Gateway for Master-Slave configuration Profibus DP V0 HTTP (homepage configurable) SMTP ( ) NTP (time synchronisation) TFTP FTP (File-Transfer) SNMP DHCP TCP/IP BACnet (optional) ICMP (Ping) Software GridVis -Basic *1 Online and historic graphs Databases (Janitza DB, Derby DB); MySQL, MS SQL with higher GridVis versions) Manual reports (energy, power quality) Graphical programming Topology views Manual read-out of the measuring devices Graph sets Programming / threshold values / alarm management Application programs freely programmable 7 Graphical programming Programming via source code Jasic Technical data Type of measurement Constant true RMS Up to 63rd harmonic Nominal voltage, three-phase, 4-conductor (L-N, L-L) 417 / 720 V AC *2 Nominal voltage, three-phase, 3-conductor (L-L) 600 V AC Measurement in quadrants 4 Networks TN, TT, IT Measurement in single-phase/multi-phase networks 1 ph, 2 ph, 3 ph, 4 ph and up to 4 times 1 ph Measured voltage input Overvoltage category 600 V CAT III Measured range, voltage L-N, AC (without potential transformer) Vrms 101
102 Chapter 02 UMG 509-PRO Measured range, voltage L-L, AC (without potential transformer) Vrms Resolution 0.01 V Impedance 4 MOhm / phase Frequency measuring range Hz Power consumption approx. 0.1 VA Sampling frequency 20 khz / phase Measured current input Rated current 1 / 5 A Resolution 0.1 ma Measurement range Amps Overvoltage category 300 V CAT III Measurement surge voltage 4 kv Power consumption approx. 0.2 VA (Ri = 5 MOhm) Overload for 1 sec. 120 A (sinusoidal) Sampling frequency 20 khz Residual current / Temperature inputs Residual current inputs 2 Measurement range, residual current inputs 0, ma Temperature input 1 Digital inputs and outputs Number of digital inputs 2 Maximum counting frequency 20 Hz Reaction time (Jasic program) 200 ms Input signal present V DC (typical 4 ma) Input signal not present V DC, current < 0.5 ma Number of digital outputs 2 Switching voltage max. 60 V DC, 30 V AC Switching current max. 50 ma Eff AC / DC Output of voltage dips 20 ms Pulse output (energy pulse) max. 20 Hz Maximum cable length up to 30 m unscreened, from 30 m screened Mechanical properties Weight 1080 g Device dimensions in mm (H x W x D) 144 x 144 x approx. 81 Battery Type CR2450, 3 V, Li-Mn Protection class per EN Front: IP40; Rear: IP20 Assembly per IEC EN / DIN EN Front panel installation Connecting phase (U / I), Single core, multi-core, fine-stranded Terminal pins, core end sheath Environmental conditions Temperature range Relative humidity Operating height 0.2 to 2.5 mm² 0.2 to 2.5 mm² Operation: K55 ( C) Operation: % RH ,000 m above sea level Degree of pollution 2 Installation position user-defined Electromagnetic compatibility Electromagnetic compatibility of Directive 2004/108/EC electrical equipment Electrical appliances for application within Directive 2006/95/EC particular voltage limits Equipment safety Safety requirements for electrical equipment for measurement, regulation, control IEC/EN and laboratory use Part 1: General requirements Part 2-030: Particular requirements for IEC/EN testing and measuring circuits Noise immunity Class A: Industrial environment IEC/EN Electrostatic discharge IEC/EN Voltage dips IEC/EN Emissions Class B: Residential environment IEC/EN Radio disturbanc voltage strength MHz IEC/CISPR11/EN Radiated interference voltage MHz IEC/CISPR11/EN Safety Europe CE labelling USA and Canada UL variants available Firmware Update via GridVis software. Firmware download (free of charge) from Firmware update the website: Digital Ouput 1 Digital Ouput 2 Fig. Example for two electronical relays connected to the digital outputs Comment: For detailed technical information please refer to the operation manual and the Modbus address list. = included - = not included External auxilliary voltage DC DC + K1 K2 24V DC - 102
 HTTP (configurable homepage) FTP (file transfer) TFTP NTP (time synchronisation) SMTP (email function) DHCP SNMP Interfaces Ethernet Profibus / RS485 (DSUB-9) Accuracy of measurement")
103 Chapter 02 UMG 511 UMG 511 Class A power quality analyser Class A Flicker Reporting Homepage Harmonics Alarm management Communication Profibus (DP/V0) Modbus (RTU, TCP, Gateway) TCP/IP BACnet (optional) HTTP (configurable homepage) FTP (file transfer) TFTP NTP (time synchronisation) SMTP ( function) DHCP SNMP Interfaces Ethernet Profibus / RS485 (DSUB-9) Accuracy of measurement Energy: Class 0.2S (... / 5 A) Current: 0.2 % Voltage: 0.1 % Power quality acc. Class A Harmonics up to the 63rd harmonic Flicker measurement Short-term interruptions (> 20 ms) Transient recorder (> 50 μs) Starting currents (> 10 ms) Unbalance Half wave RMS recordings (up to 4.5 min.) Networks IT, TN, TT networks 3 and 4-phase networks Measured data memory 256 MByte Flash Programming language Graphical programming Jasic PLC functionality 8 digital inputs Pulse input Logic input State monitoring HT / LT switching 5 digital outputs Pulse output kwh / kvarh Switch output Threshold value output Logic output (expandable via external I/O modules) Peak demand management (optional) Up to 64 switch-off stages Network visualisation software Free GridVis -Basic PQ Report Generator 103

 Interharmonics (U, I) Distortion factor THD-U / THD-I / TDD Measurement of positive, negative and zero sequence")
104 Chapter 02 UMG 511 Areas of application Continuous monitoring of the power quality Harmonics analysis with power quality problems Checking the internal supply network according to EN , EN , EN Fault analysis in case of problems with the energy supply Documentation of the power quality for customers and regulatory authorities Ethernet Gateway for subordinate measurement points Report generator for power quality standards: EN 50160, IEE519, ITIC Report generator for energy consumptions Energy Dashboard Remote monitoring of critical processes Main features Power quality Harmonics analysis up to the 63rd harmonic, even / odd (U, I, P, Q) Interharmonics (U, I) Distortion factor THD-U / THD-I / TDD Measurement of positive, negative and zero sequence component Unbalance Direction of rotation field Voltage crest factor Flicker measurement in accordance with DIN EN Logging and storage of transients (> 50 µs) Short-term interruptions (> 20 ms) Monitoring start-up processes Fig.: UMG 511 Class A-certified High quality measurement Constant true RMS measurement Measurement process in accordance with IEC Certified accuracy of measurement according to class A Continuous sampling of the voltage and current measurement inputs at 20,000 Hz 400 measurement points per period Recording of over 2,000 measured values per measurement cycle Accuracy of active energy measurement: Class 0.2S Fast measurement even enables the logging of rapid transients from 50 µs Logging of currents and voltages ( Hz) 104


105 Chapter 02 UMG 511 User-friendly, colour graphical display with intuitive user guidance High resolution colour graphical display 320 x 240, 256 colours, 6 buttons User-friendly, self-explanatory and intuitive operation Backlight for optimum reading, even in darker environments Illustration of measured values in numeric form, as a bar graph or line graph Clear and informative representation of online graphs and power quality events Multilingual: German, English, Russian, Spanish, Chinese, French, Japanese, Turkish... Fig.: Transients list Various characteristics 4 voltage and 4 current measurement inputs, i.e. logging of N and / or PE possible 8 digital inputs, e.g. as data logger for S0 meter 5 digital outputs for alarm message or e.g. for connection to a BMS or PLC Free name assignment for the digital IOs, e.g. if used as data logger Fig.: Graphical representation of a transient Comprehensive communication and connection possibilities Modbus Profibus Ethernet (TCP/IP) Digital IOs BACnet (optional) Configurable Firewall Modern communications architecture via Ethernet Simple integration in an Ethernet network Reliable and cost-optimised establishment of communication Ideal for Master-Slave structures High flexibility due to the use of open standards Integration in PLC systems and BMS through additional interfaces Various IP protocols: SNMP, ICMP (Ping), NTP, FTP 105
 Online data directly available via the homepage, historic data optional via the APP measured value monitor, 51.00.245 BACnet protocol for building communication Fig.")
106 Chapter 02 UMG 511 Measuring device homepage Web server on the measuring device, i.e. device's inbuilt homepage Function expansion possible through APPs Remote operation of the device display via the homepage Comprehensive measurement data incl. PQ (transients, events ) Online data directly available via the homepage, historic data optional via the APP measured value monitor, BACnet protocol for building communication Fig.: Illustration of the historic data via the homepage Optimal interoperability between devices from various manufacturers Predefined BIBBs (BACnet Interoperability Building Block) BACnet is optionally available with UMG 511 UMG 511 supports the device type B-SA with the BIBBs DS-RP-B and DS-WP-B Furthermore, the BIBBs DS-COV-B and DM-UTC-B are also supported UMG 511 BACnet IP Ethernet UMG 604-PRO Database Modbus Gateway function Fig.: BACnet topology Economical connection of subordinate measuring devices without Ethernet interface Integration of devices with Modbus-RTU interface possible (harmonisation of data format and function code necessary) Data can be scaled and described Minimised number of IP addresses required Tried and tested integrated solution without additional hardware Programming / PLC functionality Further processing of the measurement data in the measuring device (local intelligence) Monitoring and alarm functions simple to program Sustainable functional expansions far beyond pure measurement Comprehensive programming options with - Jasic source code programming - Graphical programming Complete APPs from the Janitza library Large measurement data memory 256 MB data memory Memory range up to 2 years (configuration-dependent) Individually configurable recordings 106
107 Chapter 02 UMG 511 Recording averaging times can be freely selected PQ recordings template preconfigured for conventional standards (e.g. EN 50160) User-defined memory segmenting possible UMG 511 Powerful alarm management Information available immediately by Inform maintenance personnel via the powerful device homepage Via digital outputs, Modbus addresses, GridVis software Programming via Jasic or graphical programming Further alarm management functions via GridVis -Service alarm management Fig.: Large measurement data memory Peak load representation and peak load management Illustration of the 3 highest monthly power peaks on the LCD display (P, Q, S) Rolling bar chart representation of the peak power values over 3 years on the LCD display (P, Q, S) Plain text representation on the LCD display (P) Fig.: GridVis alarm management, alarm list (logbook) GridVis -Basic power quality analysis software Multilingual Manual read-out of the measuring devices Manual report generation (power quality and energy consumption reports) Comprehensive PQ analysis with individual graphs - Online graphs - Historic graphs - Graph sets Integrated databases (Janitza DB, Derby DB) Graphical programming Topology views High memory range Fig.: GridVis load profile, asic instrument for EnMS Certified quality through independent institutes ISO 9001 Energy management certified according to ISO Class A certificate (IEC ) UL certificate EMC-tested product 107
108 Chapter 02 UMG 511 Dimension diagrams All dimensions in mm Side view View from below Rear view Cut out: ,8 x ,8 mm Typical connection SPS SPS DSUB Digital Outputs 1-5 Digital Inputs 5-8 Digital Inputs 1-4 RS485 Modbus/Profibus UMG 511 Ethernet 10/100Base-TX RJ45 Switch Auxiliary Supply N/- L/ PE Current Input 1-4 I1 I2 I3 I Voltage Input 1-4 V1 V2 V3 V4 Vref PC PC PE PE N N S1 S2 L1 L1 S1 S2 L2 S1 S2 L3 S1 S2 108
109 Chapter 02 UMG 511 Device overview and technical data Hysteresis Hysteresis Starting time event (Trigger time) Event recording Forward Overrun Events End time Measured data half-wave effective values Limit value UMG 511 Item number Supply voltage AC V AC V AC Supply voltage DC V DC V DC Item number (UL) Supply voltage AC V AC V AC Supply voltage DC V DC V DC Device options Emax function (peak demand management) BACnet communication Fig.: The event record consists of a mean value, a minimum or maximum value, a start time and an end time. General information Use in low, medium and high voltage networks Accuracy voltage measurement 0.1 % Accuracy current measurement 0.2 % Accuracy active energy (kwh, /5 A) Class 0.2S Number of measurement points per period 400 Seamless measurement RMS - momentary value Current, voltage, frequency Active, reactive and apparent power / total and per phase Power factor / total and per phase Energy measurement Active, reactive and apparent energy [L1, L2, L4, L3, L1 L3, L1 4] Number of tariffs 8 Recording of the mean values Voltage, current / actual and maximum Active, reactive and apparent power / actual and maximum Frequency / actual and maximum Demand calculation mode (bi-metallic function) / thermal Other measurements Operating hours measurement Clock Weekly timer Jasic Power quality measurements Harmonics per order / current and voltage Harmonics per order / active and reactive power Distortion factor THD-U in % Distortion factor THD-I in % Voltage unbalance Current and voltage, positive, zero and negative sequence component Flicker 1st - 63rd 1st - 63rd Transients > 50 µs Error / event recorder function Short-term interruptions Oscillogram function (wave form U and I) Ripple voltage signal Under and overvoltage recording Measured data recording Memory (Flash) Average, minimum, maximum values Measured data channels 8 Alarm messages Time stamp Time basis average value RMS averaging, arithmetic 20 ms 256 MB freely user-defined Comment: For detailed technical information please refer to the operation manual and the Modbus address list. = included - = not included 109
110 Chapter 02 UMG 511 Displays and inputs / outputs LCD colour graphical display 320 x 240, 256 colours, 6 buttons Language selection Digital inputs 8 Digital outputs (as switch or pulse output) 5 Voltage and current inputs each 4 Password protection Peak load management (optionally 64 channels) Communication Interfaces RS485: kbps (DSUB-9 connector) Profibus DP: Up to 12 Mbps (DSUB-9 connector) Ethernet 10/100 Base-TX (RJ-45 socket) Protocols Modbus RTU, Modbus TCP, Modbus RTU over Ethernet Modbus Gateway for Master-Slave configuration Profibus DP V0 HTTP (homepage configurable) SMTP ( ) NTP (time synchronisation) TFTP FTP (file transfer) SNMP DHCP TCP/IP BACnet (optional) ICMP (Ping) Software GridVis -Basic *1 Online and historic graphs Databases (Janitza DB, Derby DB); MySQL, MS SQL with higher GridVis versions) Manual reports (energy, power quality) Graphical programming Topology views Manual read-out of the measuring devices Graph sets Programming / threshold values / alarm management Application programs freely programmable 7 Graphical programming Programming via source code Jasic Technical data Type of measurement Constant true RMS up to the 63rd harmonic Nominal voltage, three-phase, 4-conductor (L-N, L-L) 417 / 720 V AC *2 Nominal voltage, three-phase, 3-conductor (L-L) 600 V AC Measurement in quadrants 4 Networks TN, TT, IT Measurement in single-phase/multi-phase networks 1 ph, 2 ph, 3 ph, 4 ph and up to 4 times 1 ph Measured voltage input Overvoltage category 600 V CAT III Measured range, voltage L-N, AC (without potential transformer) Vrms Measured range, voltage L-L, AC (without potential transformer) Vrms Resolution 0.01 V Impedance 4 MOhm / phase Frequency measuring range Hz Power consumption approx. 0.1 VA Sampling frequency 20 khz / phase Measured current input Rated current 1 / 5 A Resolution 0.1 ma Measurement range Amps Overvoltage category 300 V CAT III Measurement surge voltage 4 kv Power consumption approx. 0.2 VA (Ri = 5 MOhm) Overload for 1 sec. 120 A (sinusoidal) Sampling frequency 20 khz Fig.: Example, current measurement via a summation current transformer Comment: For detailed technical information please refer to the operation manual and the Modbus address list. = included - = not included * 1 Optional additional functions with the packages GridVis -Professional, GridVis -Service and GridVis -Ultimate. * 2 With UL variants: 347/600 V 110
 Maximum cable length Mechanical properties Weight 20 Hz 200 ms 18... 28 V DC (typically 4 ma) 0.")
111 Chapter 02 UMG 511 Digital inputs and outputs Number of digital inputs 8 Maximum counting frequency Reaction time (Jasic program) Input signal present Input signal not present Number of digital outputs 5 Switching voltage Switching current Output of voltage dips Pulse output (energy pulse) Maximum cable length Mechanical properties Weight 20 Hz 200 ms V DC (typically 4 ma) V DC, current < 0.5 ma max. 60 V DC, 30 V AC max. 50 ma Eff AC / DC 20 ms max. 20 Hz up to 30 m unscreened, from 30 m screened 1080 g Device dimensions in mm (H x W x D) 144 x 144 x approx. 81 Battery Protection class per EN Type CR1/2AA, 3 V, Li-Mn Front: IP40; Rear: IP20 Assembly per IEC EN / DIN EN Front panel installation Connecting phase (U / I), Single core, multi-core, fine-stranded Terminal pins, core end sheath 0.2 to 2.5 mm² 0.25 to 2.5 mm² Environmental conditions Temperature range Operation: K55 ( C) Relative humidity Operation: 0 to 95 % RH Operating height ,000 m above sea level Degree of pollution 2 Installation position user-defined Electromagnetic compatibility Electromagnetic compatibility of electrical equipment Directive 2004/108/EC Electrical appliances for application within particular voltage limits Directive 2006/95/EC Equipment safety Safety requirements for electrical equipment for measurement, regulation, control and laboratory use IEC/EN Part 1: General requirements Part 2-030: Particular requirements for testing and measuring circuits IEC/EN Noise immunity Class A: Industrial environment IEC/EN Electrostatic discharge IEC/EN Voltage dips IEC/EN Emissions Class B: Residential environment IEC/EN Radio disturbanc voltage strength MHz IEC/CISPR11/EN Radiated interference voltage MHz IEC/CISPR11/EN Safety Europe CE labelling USA and Canada UL variants available Firmware Comment: For detailed technical information please refer to the operation manual and the Modbus address list. = included - = not included Firmware update Update via GridVis software. Firmware download (free of charge) from the website: Firmware Version Serial number of the device Fixed MAC address of the device Set IP address Set Gateway Address Date and Time Set password Reset setting Fig.: User-friendly system of IP addresses, date, time and password 111

112 Chapter 02 UMG 511 Fig.: Automatically generated power quality and energy report 112

113 Chapter 02 UMG 512-PRO Certificated UMG 512-PRO Class A power quality analyser with RCM 25. Grenzwertüberwachung Class A RCM Residual current monitoring Transienten Reporting Alarm management Harmonics Voltage quality Spannungsqualität 32 MB 128 MB 256 MB 512 K Communication Profibus (DP/V0) Modbus (RTU, TCP, Gateway) TCP/IP BACnet (optional) HTTP FTP (file transfer) TFTP NTP (time synchronisation) SMTP ( function) DHCP SNMP Power quality Harmonics up to the 63rd harmonic, odd / even Datenspeicher Flicker measurement Short term interruptions (from 10 ms) Transient recorder (> 39 μs) Start-up currents (> 10 ms) Imbalance Half wave RMS recordings (up to 11 min.) Events can be displayed as waveforms 2 digital inputs Pulse input Logic input State monitoring HT / LT switching 2 digital outputs Pulse output kwh / kvarh Switch output Threshold value output Logic output Interfaces Ethernet Profibus (DSUB-9) RS485 Modbus (terminal strip) Measured data memory 256 MByte Flash MB SDRAM Tariffs Tariffs Thermistor input PT100, PT1000, KTY83, KTY84 14 Tariffs Accuracy of measurement Energy: Class 0.2S (... / 5 A) Current: 0.1 % Voltage: 0.1 % Programming language Graphical programming Jasic PLC functionality RCM Residual Current Monitoring 2 residual current inputs Messg Networks IT, TN, TT networks 3 and 4-phase networks Network visualisation software Free GridVis -Basic O C 113 Temperatureingang Modbus

 Interharmonics (U, I) Distortion factor THD-U / THD-I / TDD Measurement of positive, negative and zero")
114 Chapter 02 UMG 512-PRO Areas of application Continuous monitoring of the power quality Harmonics analysis with power quality problems Checking the internal supply network according to EN , EN , EN Fault analysis in case of problems with the energy supply Documentation of the power quality for customers and regulatory authorities Ethernet Gateway for subordinate measurement points Report generator for power quality standards: EN 50160, IEE519, EN , ITIC Report generator for energy consumptions Energy Dashboard Remote monitoring of critical processes Main features Power quality Harmonics analysis up to the 63rd harmonic, even / odd (U, I, P, Q) Interharmonics (U, I) Distortion factor THD-U / THD-I / TDD Measurement of positive, negative and zero sequence component Unbalance Direction of rotation field Voltage crest factor Flicker measurement in accordance with DIN EN Logging and storage of transients (> 39 µs) Short-term interruptions (> 10 ms) Monitoring start-up processes Fig.: UMG 512-PRO Class A certificated High quality measurement Constant true RMS measurement Measurement process in accordance with IEC Certified accuracy of measurement according to class A Continuous sampling of the voltage and current measurement inputs at 25,6 khz 512 measurement points per period Recording of over 2,000 measured values per measurement cycle Accuracy of active energy measurement: Class 0.2S Fast measurement even enables the logging of rapid transients from 39 µs Logging of currents and voltages ( Hz) 114


115 Chapter 02 UMG 512-PRO RCM (Residual Current Monitoring) Continuous monitoring of residual currents (Residual Current Monitor, RCM) Alarming in case a preset threshold fault current reached Near-realtime reactions for triggering countermeasures Permanent RCM measurement for systems in permanent operation without the opportunity to switch off Ideal for the central earthing point in TN-S systems User-friendly, colour graphical display with intuitive user guidance High resolution colour graphical display 320 x 240, 256 colours, 6 buttons User-friendly, self-explanatory and intuitive operation Backlight for optimum reading, even in darker environments Illustration of measured values in numeric form, as a bar graph or line graph Clear and informative representation of online graphs and power quality events Multilingual: German, English, Russian, Spanish, Chinese, French, Turkish... Fig.: Event list Fig.: Graphical event display (voltage drop) Various characteristics 4 voltage and 6 current measurement inputs 2 digital inputs, e.g. as data logger for S0 meter 2 digital outputs for alarm message or e.g. for connection to a BMS or PLC Free name assignment for the digital IOs, e.g. if used as data logger Comprehensive communication and connection possibilities Modbus Profibus Ethernet (TCP/IP) Digital IOs BACnet (optional) Configurable Firewall Abb.: Connection example of residual current monitoring and PE via current transformers 115
, NTP, FTP Up o 4 ports")
116 Chapter 02 UMG 512-PRO Modern communications architecture via Ethernet Simple integration in an Ethernet network Reliable and cost-optimised establishment of communication Ideal for Master-Slave structures High flexibility due to the use of open standards Integration in PLC systems and BMS through additional interfaces Various IP protocols: SNMP, ICMP (Ping), NTP, FTP Up o 4 ports simultaneous Fig.: Illustration of the historic data via the homepage (APP measurement monitor) Measuring device homepage Web server on the measuring device, i.e. device's inbuilt homepage Function expansion possible through APPs Remote operation of the device display via the homepage Comprehensive measurement data incl. PQ (transients, events ) Online data directly available via the homepage, historic data optional via the APP measured value monitor, BACnet protocol for building communication ma Residual current Personnel protection System protection Fire protection Message from RCM UMG 604-PRO Switch-off Information advantage t Database Time Optimal interoperability between devices from various manufacturers Predefined BIBBs (BACnet Interoperability Building Block) BACnet is optionally available with UMG 512-PRO UMG 512-PRO supports the device type B-SA with the BIBBs DS-RP-B and DS-WP-B Furthermore, the BIBBs DS-COV-B and DM-UTC-B are also supported Fig.: Report prior to switching off an aim of residual current monitoring Modbus Gateway function Economical connection of subordinate measuring devices without Ethernet interface Integration of devices with Modbus-RTU interface possible (harmonisation of data format and function code necessary) Data can be scaled and described Minimised number of IP addresses required Tried and tested integrated solution without additional hardware Programming / PLC functionality Further processing of the measurement data in the measuring device (local intelligence) Monitoring and alarm functions simple to program Sustainable functional expansions far beyond pure measurement Comprehensive programming options with - Jasic source code programming - Graphical programming Complete APPs from the Janitza library 116
 User-defined memory segmenting possible Powerful alarm management Abb.")

117 Chapter 02 UMG 512-PRO Large measurement data memory 256 MB data memory Memory range up to 2 years (configuration-dependent) Individually configurable recordings Recording averaging times can be freely selected PQ recordings template preconfigured for conventional standards (e.g. EN 50160) User-defined memory segmenting possible Powerful alarm management Abb.: Heatmap total number of breaches of EN Information available immediately by Inform maintenance personnel via the powerful device homepage Via digital outputs, Modbus addresses, GridVis software Programming via Jasic or graphical programming Further alarm management functions via GridVis -Service alarm management Peak load representation Fig.: GridVis alarm management, alarm list (logbook) Illustration of the 3 highest monthly power peaks on the LCD display (P, Q, S) Rolling bar chart representation of the peak power values over 3 years on the LCD display (P, Q, S) Plain text representation on the LCD display (P) GridVis -Basic power quality analysis software Multilingual Manual read-out of the measuring devices Manual report generation (power quality and energy consumption reports) Comprehensive PQ analysis with individual graphs - Online graphs - Historic graphs - Graph sets Integrated databases (Janitza DB, Derby DB) Graphical programming Topology views High memory range Fig.: GridVis load profile, asic instrument for EnMS Certified quality through independent institutes ISO 9001 Energy management certified according to ISO Class A certificate (IEC ) UL certificate EMC-tested product 117

118 Chapter 02 UMG 512-PRO Dimension diagrams All dimensions in mm Side view View from below Rear view Cut out: ,8 x ,8 mm Typical connection IDIFF IPE PT100 A K1 + B K ma A B RS485 UMG 512-PRO I5 I6 RCM Temp Digitale Ausgänge Digitale Eingänge Ethernet 10/100Base-T RJ45 Switch PC PC Hilfsenergie Auxiliary Supply L/+ N/ PE Strommessung 1-4 Current Input 1-4 I1 I2 I3 S1 S2 S1 S2 S1 S S1 I4 S Spannungsmessung 1-4 Voltage Input 1-4 V1 V2 V3 V4 VN Profibus DSUB-9 SPS SPS PE PE N L1 N L1 L2 L3 S1 S2 S1 S2 S1 S2 S1 S2 Verbraucher Loads 118
119 Chapter 02 UMG 512-PRO Device overview and technical data Hysteresis Hysteresis Events Measured data half-wave effective values Limit value UMG 512-PRO Item number Supply voltage AC V AC V AC Supply voltage DC V DC V DC Device options BACnet communication Starting time event (Trigger time) End time Forward Event recording Overrun Fig.: The event record consists of a mean value, a minimum or maximum value, a start time and an end time. General information Use in low, medium and high voltage networks Accuracy voltage measurement 0.1 % Accuracy current measurement 0.1 % Accuracy active energy (kwh, /5 A) Class 0.2S Number of measurement points per period 512 Seamless measurement RMS - momentary value Current, voltage, frequency Active, reactive and apparent power / total and per phase Power factor / total and per phase Energy measurement Active, reactive and apparent energy [L1, L2, L4, L3, L1 L3, L1 4] Number of tariffs 8 Recording of the mean values Voltage, current / actual and maximum Active, reactive and apparent power / actual and maximum Frequency / actual and maximum Demand calculation mode (bi-metallic function) / thermal Other measurements Operating hours measurement Clock Weekly timer Jasic Power quality measurements Harmonics per order / current and voltage Harmonics per order / active and reactive power Distortion factor THD-U in % Distortion factor THD-I in % Voltage unbalance Current and voltage, positive, zero and negative sequence component Flicker 1st - 63rd 1st - 63rd Transients > 39 µs Error / event recorder function Short-term interruptions Oscillogram function (wave form U and I) Ripple voltage signal Under and overvoltage recording Measured data recording Memory (Flash) Average, minimum, maximum values 10 ms 256 MB Measured data channels 10 Alarm messages Time stamp Time basis average value RMS averaging, arithmetic freely user-defined Comment: For detailed technical information please refer to the operation manual and the Modbus address list. = included - = not included 119

120 Chapter 02 UMG 512-PRO Displays and inputs / outputs LCD colour graphical display 320 x 240, 256 colours, 6 buttons Language selection Digital inputs 2 Digital outputs (as switch or pulse output) 2 Voltage and current inputs each 4 Residual current inputs 2 Temperature input 1 Password protection Communication Interfaces RS485: kbps (terminal board) Profibus DP: Up to 12 Mbps (DSUB-9 connector) Ethernet 10/100 Base-TX (RJ-45 socket) Protocols Modbus RTU, Modbus TCP, Modbus RTU over Ethernet Modbus Gateway for Master-Slave configuration Profibus DP V0 HTTP (homepage configurable) SMTP ( ) NTP (time synchronisation) TFTP FTP (file transfer) SNMP DHCP TCP/IP BACnet (optional) ICMP (Ping) Software GridVis -Basic *1 Online and historic graphs Databases (Janitza DB, Derby DB) Manual reports (energy, power quality) Graphical programming Topology views Manual read-out of the measuring devices Graph sets Programming / threshold values / alarm management Application programs freely programmable 7 Graphical programming Programming via source code Jasic Abb.: Replacing the battery using long-nose pliers Technical data Type of measurement Constant true RMS up to the 63rd harmonic Nominal voltage, three-phase, 4-conductor (L-N, L-L) 417 / 720 V AC *2 Nominal voltage, three-phase, 3-conductor (L-L) 600 V AC Measurement in quadrants 4 Networks TN, TT, IT Measurement in single-phase/multi-phase networks 1 ph, 2 ph, 3 ph, 4 ph and up to 4 times 1 ph Measured voltage input Overvoltage category 600 V CAT III Measured range, voltage L-N, AC (without potential transformer) Vrms Measured range, voltage L-L, AC (without potential transformer) Vrms Resolution 0.01 V Impedance 4 MOhm / phase Frequency measuring range Hz Power consumption approx. 0.1 VA Sampling frequency 25,6 khz / phase Measured current input Rated current 1 / 5 A Resolution 0.1 ma Measurement range Amps Overvoltage category 300 V CAT III Measurement surge voltage 4 kv Power consumption approx. 0.2 VA (Ri = 5 MOhm) Overload for 1 sec. 120 A (sinusoidal) Sampling frequency 25,6 khz Comment: For detailed technical information please refer to the operation manual and the Modbus address list. = included - = not included * 1 Optional additional functions with the packages GridVis -Professional, GridVis -Service and GridVis -Ultimate. * 2 With UL variants: 347/600 V 120
 Maximum cable length Mechanical properties Weight 20 Hz 200 ms 18... 28 V DC (typically 4 ma) 0.")
121 Chapter 02 UMG 512-PRO Digital inputs and outputs Number of digital inputs 2 Maximum counting frequency Reaction time (Jasic program) Input signal present Input signal not present Number of digital outputs 2 Switching voltage Switching current Output of voltage dips Pulse output (energy pulse) Maximum cable length Mechanical properties Weight 20 Hz 200 ms V DC (typically 4 ma) V DC, current < 0.5 ma max. 60 V DC, 30 V AC max. 50 ma Eff AC / DC 20 ms max. 20 Hz up to 30 m unscreened, from 30 m screened 1080 g Device dimensions in mm (H x W x D) 144 x 144 x approx. 81 Battery Type Li-Mn CR2450, 3 V (approval i.a.w. UL 1642) Protection class per EN Front: IP40; Rear: IP20 Assembly per IEC EN / DIN EN Front panel installation Connecting phase (U / I), Single core, multi-core, fine-stranded Terminal pins, core end sheath 0.2 to 2.5 mm² 0.25 to 2.5 mm² Environmental conditions Temperature range Operation: K55 ( C) Relative humidity Operation: 0 to 95 % RH Operating height ,000 m above sea level Degree of pollution 2 Installation position user-defined Electromagnetic compatibility Electromagnetic compatibility of electrical equipment Directive 2004/108/EC Electrical appliances for application within particular voltage limits Directive 2006/95/EC Equipment safety Safety requirements for electrical equipment for measurement, regulation, control and laboratory use IEC/EN Part 1: General requirements Part 2-030: Particular requirements for testing and measuring circuits IEC/EN Noise immunity Class A: Industrial environment IEC/EN Electrostatic discharge IEC/EN Voltage dips IEC/EN Emissions Class B: Residential environment IEC/EN Radio disturbanc voltage strength MHz IEC/CISPR11/EN Radiated interference voltage MHz IEC/CISPR11/EN Safety Europe CE labelling USA and Canada UL variants available Firmware Comment: For detailed technical information please refer to the operation manual and the Modbus address list. = included - = not included Firmware update Update via GridVis software. Firmware download (free of charge) from the website: Firmware Version Serial number of the device Fixed MAC address of the device Set IP address Set Gateway Address Date and Time Set password Reset setting Fig.: User-friendly system of IP addresses, date, time and password 121

122 Chapter 02 UMG 512-PRO 122
 HTTP FTP (File-Transfer) TFTP NTP (Zeitsynchronisierung) SMTP (E-Mail-Funktion) DHCP SNMP Interfaces Ethernet 10/100Base-TX RCM Residual Current Monitoring 2 residual current inputs")
123 Chapter 02 MRG 96RM-E RCM Flex & MRG 512-PRO PQ Flex MRG 96RM-E RCM Flex & MRG 512-PRO PQ Flex Power quality Transients Reporting Homepage Events Graphic Programming Communication Modbus over TCP/IP BACnet (optional) HTTP FTP (File-Transfer) TFTP NTP (Zeitsynchronisierung) SMTP ( -Funktion) DHCP SNMP Interfaces Ethernet 10/100Base-TX RCM Residual Current Monitoring 2 residual current inputs Power quality Harmonics up to the 40th (MRG 96RM-E) or 63rd (MRG 512-PRO) harmonic Distortion factor THD-U / THD-I / TDD Measurement of positive, negative and zero sequence component (only MRG 512-PRO) Direction of rotation field Acquisition of short-term interruptions Transient recorder, 39 μs (only MRG 512-PRO) Starting currents (from 20 ms) Unbalance (only MRG 512-PRO) Flicker measurement per EN (only MRG 511 Flex) Display of waveforms (only MRG 512-PRO) Buffered UPS (only MRG 512-PRO) Up to 3 hrs PLC functionality (only MRG 512-PRO) Graphical programming Jasic programming language Networks TN, TT networks 3 and 4-phase networks Up to 4 single-phase networks Network visualisation software Free GridVis -Basic Rogowski coil (300 mm) A Measured range 250 A, 500 A, 1000 A, 2000 A, 4000 A 123
 Temporary measurement e.g.")
 Recording of residual currents over an external current transformer (not included in the scope of delivery)")
 Remote access via Ethernet and embedded web server GridVis PQ analysis software Standard PQ reports, depending on the version: EN 50160, IEEE519, ITIC, EN 61000-2-4 Cost centre report Large 256 MB")
124 Chapter 02 MRG 96RM-E RCM Flex & MRG 512-PRO PQ Flex Areas of application High quality PQ analysis at class A level (IEC ) Temporary measurement e.g. for the design of power factor correction systems Analysis of electrical disturbances in the event of PQ problems Fault analysis with power quality problems High quality comparative measurement of energy measurement devices and meters Calibration of measurement devices (ISO audit) Recording of residual currents over an external current transformer (not included in the scope of delivery) Main features Monitoring of the power quality Capturing of all power quality parameters (harmonics, short-term interruptions, asymmetries etc.) Remote access via Ethernet and embedded web server GridVis PQ analysis software Standard PQ reports, depending on the version: EN 50160, IEEE519, ITIC, EN Cost centre report Large 256 MB internal memory for storing measurement data UPS-supported power supply for up to 3 hours MRG 512-PRO PQ Flex: User-friendly, colour graphical display with intuitive user guidance Fig.: MRG 512-PRO PQ Flex Portable power quality analyser with RCM (Image similar) High resolution graphics display User-friendly, self-explanatory and intuitive operation Clear and informative representation of online graphs and further power quality events Modern communications architecture via Ethernet Ethernet interface and web server Faster, better cost-optimised and more reliable communication system High flexibility due to the use of open standards Large measurement data memory Fig.: MRG 96RM-E RCM Flex Portable energy measurement device with RCM (Image similar) 256 MByte Recording range of up to 2 years, depending on the recording configuration Recording freely configurable 124

 Jasic source code programming Sustainable functional expansions")
125 Chapter 02 MRG 96RM-E RCM Flex & MRG 512-PRO PQ Flex RCM (Residual Current Monitoring) Continuous monitoring of residual currents (Residual Current Monitoring, RCM) Alarming in case a preset threshold fault current reached Near-realtime reactions for triggering countermeasures Permanent RCM measurement for systems in permanent operation without the opportunity to switch off Ideal for the central earthing point in TN-S systems Graphical programming (only MRG 512-PRO) Fig.: Colour graphical display MRG 512-PRO PQ Flex Example voltage profile over time Comprehensive programming options (PLC functionality) Jasic source code programming Sustainable functional expansions far beyond pure measurement Complete APPs from the Janitza library Scope of delivery for the MRG product range Compact, robust plastic housing with measurement device and all connections UPS-supported power supply for up to 3 hours Supplementary description for each measurement device Operation manual for each measurement device DVD with following content: - Programming software GridVis -Basic - Functional description - GridVis Carry soft bag for accessories Mains connection cable 1 Crossover patch cable, CAT5e 1 set of voltage measuring cables with fuses (brown, black, grey, blue, green/yellow) Voltage tap-offs 2 connection cable 3 m for residual current measuring with connector Incl. Rogowski coil Ø 95 mm (MRG 96RM-E RCM Flex), Ø 175 mm (MRG 512-PRO PQ Flex); length 300 mm Optional accessories: Differential current transformer on request. Fig.: Colour graphical display MRG 512-PRO PQ Flex Example harmonics analysis Fig.: Measurement connection for current transformer and voltage; auxiliary voltage and ethernet connection 125
126 Chapter 02 MRG 96RM-E RCM Flex & MRG 512-PRO PQ Flex Device overview and technical data MRG 96RM-E RCM Flex MRG 512-PRO PQ Flex Item number Interfaces Ethernet 10/100 Base-TX (RJ-45 socket) Measurement of the power quality Harmonics per order / current and voltage Harmonics per order / active and reactive power Interharmonics - current / voltage - Flicker: Short term, long term, present - Measured data recording Memory (Flash) 256 MB 256 MB Measured voltage input Overvoltage category 600 V CAT III 600 V CAT III Displays and inputs / outputs LCD display LCD display with backlight, 2 buttons Colour graphical display 320 x 240, 256 colours, 6 buttons General MRG 96RM-E RCM Flex MRG 512-PRO PQ Flex Use in low and medium voltage networks Accuracy of measurement with voltage 0.2 % 0.1% Accuracy of measurement with current 0.2 % 0.1% Accuracy of measurement with active energy (kwh, /5 A) Class 0.5S Class 0.2S Number of measurement points per period Uninterrupted measurement RMS - momentary value Current, voltage, frequency Active, reactive and apparent power / total and per phase Power factor / total and per phase Energy measurement Active, reactive and apparent energy [L1, L2, L3, L4, Σ L1 3,Σ L1 4] Recording of the mean values Voltage, current / actual and maximum Active, reactive and apparent power / actual and maximum Frequency / actual and maximum Requirement calculation mode (bi-metallic function) / thermal Other measurements Operating hours measurement Clock Measurement of the power quality Distortion factor THD-U in % Distortion factor THD-I in % Current and voltage, positive, zero and negative sequence component Transients - > 39 µs Error / event plotter function Short term interruptions Oscillogram function (wave form U and I) - Under and overvoltage recording Measured data recording Mean, minimum, maximum values Alarm messages Time stamp Time basis mean value freely user-defined freely user-defined RMS averaging, arithmetic Displays and inputs / outputs Analogue inputs (RCM, analogue) Voltage and current inputs L1, L2, L3 + N every 4 Password protection Comment: For detailed technical information, please refer to the operation manual and the Modbus address list. = included = not included 126

 SMTP (email) NTP (time synchronisation) TFTP (automatic configuration) FTP (file")

127 Chapter 02 MRG 96RM-E RCM Flex & MRG 512-PRO PQ Flex Fig.: Rogowski coil with measurement transducer Fig.: Voltage taps Comment: For detailed technical information, please refer to the operation manual and the Modbus address list. = included = not included * 1 Optional additional functions with the packages GridVis - Professional, GridVis -Service and GridVis -Ultimate. MRG 96RM-E RCM Flex MRG 512-PRO PQ Flex Protocols Modbus TCP, Modbus RTU over Ethernet HTTP (homepage configurable) SMTP ( ) NTP (time synchronisation) TFTP (automatic configuration) FTP (file transfer) SNMP DHCP TCP/IP BACnet (optional) ICMP (Ping) Software GridVis Basic *1 Online graphs Historical graphs Databases (Janitza DB, Derby DB) Manual reports (energy, power quality) Graphical programming - Topology views Manual read-out of the measuring devices Graph sets Programming / threshold values / alarm management Application programs freely programmable - 7 Graphical programming - Programming via source code Jasic - Comparator (5 Groups with 10 comparators each) - Technical data Nominal voltage, three-phase, 4-conductor (L-N, L-L) 277 / 480 V AC 417 / 720 V AC Nominal voltage, three-phase, 3-conductor (L-L) 480 V AC 600 V AC Measurement in which quadrants 4 4 Networks TN, TT, IT TN, TT Measurement in single-phase/multi-phase networks 1 ph, 2 ph, 3 ph, 4 ph 1 ph, 2 ph, 3 ph, 4 ph and up to 4 times 1 ph Measured voltage input Metering range, voltage L-N, AC (without transformer) Vrms Vrms Metering range, voltage L-L, AC (without transformer) Vrms Vrms Resolution 0.01 V 0.01 V Impedance 3 MOhm / phase 4 MOhm / phase Frequency measuring range 45 to 65 Hz Hz Power consumption approx. 0.1 VA approx. 0.1 VA Measured current input Rated current 5 A 5 A Resolution 0.1 ma 0.1 ma Metering range Amps Amps Overvoltage category 300 V CAT II 300 V CAT III Measurement surge voltage 2 kv 6 kv Power consumption approx. 0.2 VA (Ri = 5 mohm) approx. 0.1 VA (Ri = 5 MOhm) Overload for 1 sec. 120 A (sinusoidal) 120 A (sinusoidal) Sampling rate 20 khz 25,6 khz Mechanical properties Weight approx. 3,4 Kg approx. 14,5 Kg Device dimensions in mm (L x W x H) 350 x 295 x 150 ca. 500 x 390 x 230 Protection class per EN Front: IP40; Back: IP20 Front: IP40; Back: IP20 Security Europe CE labelling CE labelling 127
128 Chapter 03 Energy management 03 Energy management MID energy meter Digital pulse transducer or communication at field bus level Measurement of reactive or active energy consumption MID-certified Page 129 Emax APP peak demand management Peak load shedding programs for the maximum monitor function (EMAX). Up to 64 switch-off stages can be implemented (depending on the hardware). The configuration and monitoring is implemented via the device's website. Page 138 ProData data logger Compact and universal data logger Acquisition of electrical and non electrical values Modbus Ethernet Gateway functionality enables simple integration of slave devices Page 139 Field bus modules series FBM Decentralised I/O field bus modules Connection with master devices via RS485 interface Seamless recording of various measurement and process data Page


129 Chapter 03 MID energy meter ECSEM series 32 MB 128 MB 256 MB 512 K speicher Emax 2 Tariffs GridVis 7 Tariffs 8 Tariffs 14 Tariffs 0,2 kwh Class 0,5 kwh Class 1,0 kwh Class Pulse output Tarife 2 tariffs Messgenauigkeit Modbus MID M-Bus eratureingang Modbus M-Bus MID ENERGY METER ECSEM SERIES 129
 1 or 2 tariffs 4-quadrant")
130 Chapter 03 MID energy meter Areas of application Energy management Cost centre analysis Measured value transducer for PLC controls or building management systems (BMS) For energy billing purposes Main features Communication: Modbus, M-Bus, S0 pulse outputs Direct measurement up to 65 A, transformer measurement up to 6 A, secondary (CT ration freely adjustable) 1 or 2 tariffs 4-quadrant measurement Class 1 for effective energy MID and IEC calibrated at the factory Lead-sealed terminal cover Measured values: Active energy, reactive energy, active power, reactive power Precision class 1 for active energy Modbus Fig.: Measured energy values are available via the integrated communication interface Modbus RTU. Applications Logging of active and reactive energy S0 pulse outputs, proportional to energy flowing, can be connected to a control system PLC, SCADA system or data logger Integrated interface makes available protocols such as M-Bus or Modbus RTU Measurements of 1 and 3-phase systems with a voltage of L-N 230 V AC / L-L 400 V AC Measurement of input currents via direct connection or via current transformer (.../1 A or.../5 A) DIN rail installation 130
131 Chapter 03 MID energy meter MID energy meter B21 Single-phase energy meter, 65 A Single-phase energy meter (1 + N) Direct connection up to 65 A With measured values and alarm function Width, 2 DIN modules Tested and approved per MID *1 and IEC Pulse output included *1 Regional different requirements apply in Switzerland in connection with MID energy meters. Voltage V Precision class Inputs/outputs Communication Type Item no. Weight Pulse output B J Active energy: B (class 1) 2 outputs, 1 x 230 V AC Pulse output, RS-485 B J Reactive energy: class 2 2 inputs Pulse output, M-Bus B J MID calibration report for MID-energy meter, item no Dimensions in mm OK I SET A und B B21 connection terminals Pulse output S L N Out2 15 Out1 13 optional kω Evaluation device? Input + UP 24 V DC - ZP 131 A
132 Chapter 03 MID energy meter MID energy meter B23 Three-phase energy meter, direct measurement, 65 A Three-phase energy meter, direct measurement (3 + N) Direct connection up to 65 A With measured values and alarm function For 3-conductor and 4-conductor connection Width, 4 DIN modules Tested and approved per MID *1 and IEC Pulse output included *1 Regional different requirements apply in Switzerland in connection with MID energy meters. Voltage V Precision class Inputs/outputs Communication Type Item no. Weight Pulse output B J Active energy: B (class 1) 2 outputs, 3 x 230/400 V AC Pulse output, RS-485 B J Reactive energy: class 2 2 inputs Pulse output, M-Bus B J MID calibration report for MID-energy meter, item no Dimensions in mm A und B B23 connection terminals Pulse output S0 3-conductor connection with 2 measuring units 18 L1 L2 L conductor connection with 3 measuring units Out2 15 Out1 13 optional kω Evaluation device? Input + UP 24 V DC - ZP L1 L2 L3 N 132

133 Chapter 03 MID energy meter MID energy meter B24 Three-phase energy meter, CT measurement, 6 A Three-phase energy meter, CT measurement (3 + N) Transformer connection CT, 1(6) A Transformer ratio freely adjusted up to 9999/1-6 With measured values and alarm function For 3-conductor and 4-conductor connection Width, 4 DIN modules Tested and approved per MID *1 and IEC Pulse output included *1 Regional different requirements apply in Switzerland in connection with MID energy meters. Voltage V Precision class Inputs/outputs Communication Type Item no. Weight Pulse output B J Active energy: B (class 1) 2 outputs, 3 x 230/400 V AC Pulse output, RS-485 B J Reactive energy: class 2 2 inputs Pulse output, M-Bus B J MID calibration report for MID-energy meter, item no Dimensions in mm A und B B24 connection terminals Pulse output S conductor connection with 2 measuring units 18 L1 L2 L P1 4-conductor connection with 3 measuring units P1 S1 P1 S2 P Out2 15 Out1 13 optional kω Evaluation device? Input + UP 24 V DC - ZP S1 S2 L1 L2 L3 N P1 P1 P1 P1 P2 133
134 Chapter 03 MID energy meter Device overview and technical data B21 Single-phase energy meter B23 Three-phase energy meter, direct measurement B24 Three-phase energy meter, CT measurement Voltage/current inputs Rated voltage 230 V AC 3 x 230/400 V AC 3 x 230/400 V AC Voltage range V AC (-20% +15%) 3 x V AC (-20% +15%) 3 x V AC (-20% +15%) Power dissipation, voltage circuits 1.0 VA (0.4 W) total 1.6 VA (0.7 W) total 1.6 VA (0.7 W) total Power dissipation, current circuits VA (0.007 W) at 230 V AC and I b VA (0.007 W) per phase at 230 V AC and I b VA (0.007 W) per phase at 230 V AC and I b Reference current I ref 5 A 5 A 1 A Transition current I tr 0.5 A 0.5 A 0.05 A Max. current I max 65 A 65 A 6 A Min. current I min 0.25 A 0.25 A 0.02 A Start-up current I st < 20 ma < 20 ma < 1 ma Connection cross-section 1 25 mm mm mm 2 Recommended tightening torque 3 Nm 3 Nm 1.5 Nm Transformer ratio Configurable current ratio (CT) 9999/1-6 Pulse display (LED) Pulse frequency 1000 imp/kwh 1000 imp/kwh 5000 imp/kwh Pulse length 40 ms 40 ms 40 ms General information Frequency 50 or 60 Hz ± 5% 50 or 60 Hz ± 5% 50 or 60 Hz ± 5% Precision class B (cl. 1) and reactive power cl. 2 B (cl. 1) and reactive power cl. 2 B (cl. 1) and reactive power cl. 2 Effective power 1% 1% 0,5%, 1% Energy display LCD with 6 digits LCD with 7 digits LCD with 7 digits Environmental Operating temperature -40 C +70 C -40 C +70 C -40 C +70 C Storage temperature -40 C +85 C -40 C +85 C -40 C +85 C Humidity 75% annual average, 95% on 30 days/year Fire and heat resistance Terminal 960 C, covering 650 C (IEC ) Water and dust resistance Mechanical environment Electromagnetic environment IP20 on terminal strip without protective housing and IP51 in protective housing, per IEC Class M1 per Measuring Instrument Directive (MID), (2004/22/EC) Class E2 per Measuring Instrument Directive (MID), (2004/22/EC) 75% annual average, 95% on 30 days/year Terminal 960 C, covering 650 C (IEC ) IP20 on terminal strip without protective housing and IP51 in protective housing, per IEC Class M1 per Measuring Instrument Directive (MID), (2004/22/EC) Class E2 per Measuring Instrument Directive (MID), (2004/22/EC) 75% annual average, 95% on 30 days/year Terminal 960 C, covering 650 C (IEC ) IP20 on terminal strip without protective housing and IP51 in protective housing, per IEC Class M1 per Measuring Instrument Directive (MID), (2004/22/EC) Class E2 per Measuring Instrument Directive (MID), (2004/22/EC) 134
135 Chapter 03 MID energy meter Digital outputs Current ma ma ma Voltage 24 V AC 240 V AC, 24 V DC 240 V DC. With meters with only 1 output, 5 40 V DC Output pulse frequency Programmable: pulse/ kwh, pulse/mwh 24 V AC 240 V AC, 24 V DC 240 V DC. With meters with only 1 output, 5 40 V DC Programmable: pulse/ kwh, pulse/mwh Pulse length ms ms ms Connection cross-section 0,5 1 mm 2 0,5 1 mm 2 0,5 1 mm 2 Recommended tightening torque 0.25 Nm 0.25 Nm 0.25 Nm 24 V AC 240 V AC, 24 V DC 240 V DC. With meters with only 1 output, 5 40 V DC Programmable: pulse/ kwh, pulse/mwh Digital inputs Voltage V AC/DC V AC/DC V AC/DC OFF 0 12 V AC/DC 0 12 V AC/DC 0 12 V AC/DC ON V AC/ V DC V AC/ V DC V AC/ V DC Min. pulse length 30 ms 30 ms 30 ms Connection cross-section 0,5 1 mm 2 0,5 1 mm 2 0,5 1 mm 2 Recommended tightening torque 0,25 Nm 0.25 Nm 0.25 Nm Electromagnetic compatibility Surge voltage testing 6 kv 1,2/50 µs (IEC ) 6 kv 1,2/50 µs (IEC ) 6 kv 1,2/50 µs (IEC ) Voltage swell testing 4 kv 1,2/50 µs (IEC ) 4 kv 1,2/50 µs (IEC ) 4 kv 1,2/50 µs (IEC ) Cable-based transients 4 kv (IEC ) 4 kv (IEC ) 4 kv (IEC ) Immunity from interference from electromagnetic HF fields Immunity from interference from conducted interference Immunity from interference with harmonics 80 MHz 2 GHz (IEC ) 80 MHz 2 GHz (IEC ) 80 MHz 2 GHz (IEC ) 150 khz 80 MHz (IEC ) 150 khz 80 MHz (IEC ) 150 khz 80 MHz (IEC ) 2 khz 150 khz 2 khz 150 khz 2 khz 150 khz High frequency emissions EN 55022, Klasse B (CISPR22) EN 55022, Klasse B (CISPR22) EN 55022, Klasse B (CISPR22) Electrostatic discharge 15 kv (IEC ) 15 kv (IEC ) 15 kv (IEC ) Standards IEC , IEC class 1 & 2, IEC class 0,5S, IEC class 2, IEC , GB/T , GB/T class 1 & 2, GB/T class 0.5S, GB , EN category A, B & C Mechanical Material Polycarbonate in transparent front glass, top and bottom housing and terminal covering Dimensions 35 x 97 x 65 mm (B x H x T) 70 x 97 x 65 mm (B x H x T) 70 x 97 x 65 mm (B x H x T) DIN modules


136 Chapter 03 MID energy meter Remote read-out with a higher-level PC GridVis network visualisation software Network Ethernet UMG 509-PRO Power quality analyser with RCM UMG 96RM-E Multifunctional power quality analyser Modbus MID energy meters 1-phase or 3-phase UMG 96RM Network analyser 136


137 Chapter 03 MID energy meter Sankey diagrams Tabular energy reports Dashboard Editor UMG 604-PRO Power quality analyser ProData data logger Gateway for energy meter Modbus Pulse inputs MID energy meters 1-phase or 3-phase MID energy meters 1-phase or 3-phase 137
. The configuration and monitoring is implemented via the device's website.")
138 Chapter 03 Emax APP peak demand management Emax APP peak demand management The APP includes peak load shedding programs for the maximum monitor function (EMAX). Up to 64 switch-off stages can be implemented (depending on the hardware). The configuration and monitoring is implemented via the device's website. The shedding operations can be carried out via FBM modules (available as options), PROFIBUS or Modbus. The APP requires Emax to be enabled (subject to purchase) on the device! Description Item number Emax APP * Emax enabling *1 Only in conjunction with commissioning and Emax enabling (article no: ) 138

139 Chapter 03 ProData data logger ProData DATA LOGGER Ethernet Pulse inputs and Pulse outputs Modbus-Ethernet gateway Thermistor input Memory 32 MB Threshold value monitoring 139
 Monitoring of switching statuses (e.g. circuit breaker, etc.")

140 Chapter 03 ProData data logger Smart and compact: Save energy costs through the universal data logger Basis for a comprehensive energy management system (ISO 50001) Mapping of all consumption and process data (current, water, gas, steam, pressure, etc.) Monitoring of switching statuses (e.g. circuit breaker, etc.) Analysis of energy consumption and operating hours Flexible integration in superordinate systems (Modbus-Ethernet gateway) Long-term storage of data with 32 MB onboard memory Saving of 24 differential monthly energy values as well as maximum power values - for each of the fifteen individual inputs on board Direct reading out and analysis of data via GridVis software Free programming of 64 independent weekly timers Tariff conversion: Each digital input can be assigned a selected tariff from 1 to 8 Universal data logger for all consumption media 15 digital / pulse inputs 3 digital outputs, switchable via Modbus, weekly timer, threshold value and temperature monitoring Temperature measurement input Ethernet interface (Modbus TCP/IP, NTP ) RS485 (Modbus RTU, slave, up to 115 kbps) 32 MB flash data memory Clock and battery function 64 weekly timers Threshold value monitoring Modbus-Ethernet gateway functionality Saving of minimum and maximum values (with time stamp) Configurable records, can be read out via RS485 and Ethernet S0 pulses Fig.: Easy integration of existing meters Applications EnMS per ISO Integration of previously installed pulse counters in an EnMS Logging of non-electrical values Generation of performance indicators (key figures) Logging and monitoring of status messages Generation of alarms Ethernet-Modbus-Slave gateway Fig.: Consolidation of diverse consumption media 140

141 Chapter 03 ProData data logger Ethernet with gateway functionality Communication via Ethernet and Modbus RS485 Simple integration in the LAN network Rapid and reliable data transfer Access to measurement data via various channels Simple integration of existing meters Via Modbus-Ethernet Gateway integration and read-out of subordinate Modbus slave devices (e.g. electricity meters) possible with ease Conveniently capture measurements from all brands of meter with an S0 pulse output Well thought-out to the last (vital) detail Internal clock generates precise data and time information for records and events Permanent operation of the clock thanks to integrated emergency battery Battery not permanently installed; as such convenient replacement possible Serial communication via Modbus with up to 31 meters, at distances of up to 1,200 m Refrigerated display Escalator Lighting Fig.: Simple consolidation of Modbus meters The ProData is the practical person's favourite Wide range power adapter ( V AC, V DC) Auto-Baud detection of the communication interface Screwable plug-in terminals Modbus address easily externally adjustable Rapid DIN rail installation Fig.: Easy exchange of the battery during operation 141
142 Chapter 03 ProData data logger Dimension diagrams All dimensions in mm Front view Side view Typical connection Digital inputs Digital inputs Digital outputs Temperature inputs Supply voltage Supply voltage or Connection example via an external power supply 142

143 Chapter 03 ProData data logger Device overview and technical data ProData 2 Digitale inputs 1-5 4k 4k 4k 4k 4k 3,9V 3,9V 3,9V 3,9V 3,9V 6 5 Digital Input 5 4 Digital Input 4 3 Digital Input 3 2 Digital Input 2 1 Digital Input 1 External Auxiliary voltage 1,3k/1W 24V DC - + S0 pulse transducer Fig.: S0 pulse input with external supply voltage and external plug-in resistor module* 3 Fig.: S0 plug-in module (item no.: ) ProData Item number Supply voltage Overvoltage category Power consumption General Use in low voltage networks Other measurements Operating hours measurement Clock Data logging Memory (Flash) Mean, minimum, maximum values Alarm messages Threshold value monitoring Time stamp Inputs / outputs V AC or V DC 300 V CAT II max. 4 VA / 2 W Digital inputs 15 Digital outputs (as switch or pulse output) 3 Temperature measurement input 1 Password protection Communication Interfaces RS485: kbps Ethernet 10/100 Base-TX (RJ-45 socket) Protocols Modbus RTU, Modbus TCP Modbus Gateway for Master-Slave configuration* 1 NTP (time synchronisation) DHCP TCP/IP ICMP (Ping) Software GridVis -Basic *2 Online and historic graphs Databases (Janitza DB, Derby DB); MySQL, MS SQL with higher GridVis versions) Manual reports (energy) Topology views Manual reading Graph sets 32 MB Comment: For detailed technical information please refer to the operation manual and the Modbus address list. = included - = not included *1 Use as a Modbus RTU slave is not possible in this mode. The ProData is only able to pass on requests to a Modbus slave device; it cannot request Modbus slave devices itself. *2 Optional additional functions with the packages GridVis -Professional, GridVis -Enterprise and GridVis -Service. *3 External resistor S0 plug-in module for connection to an S0 pulse transducer required (item no.: ) Technical data Digital inputs and outputs Number of digital inputs 15 Supply voltage V DC (SELV or PELV supply) Pulse output (S0), maximum count frequency 25 Hz Input signal present > 18 V DC (typical 4 ma for 24 V) Input signal not present V DC Number of digital outputs 3 Supply voltage V DC (SELV or PELV supply) Switching voltage max. 60 V DC Switching current max. 50 maeff DC Pulse output (energy pulse) max. 20 Hz Maximum line length up to 30 m unscreened, from 30 m screened Temperature measurement input 1 Update time 1 sec. Suitable temperature sensor PT100, PT1000, KTY83, KTY84 Total burden (sensor and cable) max. 4 kohm 143
 Protection class per EN 60529 IP20 Assembly per IEC EN 60999-1 / DIN EN 50022 DIN rail mounting Connection capacity of the terminals (digital inputs / outputs, temperature thermistor inputs)")
144 Chapter 03 ProData data logger Mechanical properties and others Weight 200 g Device dimensions in mm (H x W x D) 90 x x approx. 46 Battery Lithium battery CR2032, 3 V (approval i.a.w. UL 1642) Protection class per EN IP20 Assembly per IEC EN / DIN EN DIN rail mounting Connection capacity of the terminals (digital inputs / outputs, temperature thermistor inputs) rigid / flexible Flexible with core end sheath without plastic sleeve Flexible with core end sheath with plastic sleeve Terminal connection capacity Serial interface Single core, multi-core, fine-stranded terminal pins, core end sheath Environmental conditions Temperature range Relative humidity Operating altitude 0.2 to 1.5 mm² 0.2 to 1.5 mm² 0.2 to 1.5 mm² 0.2 to 1.5 mm² 0.2 to 1.5 mm² Operation: K55 ( C) Operation: 0 to 95 % RH ,000 m above sea level Pollution degree 2 Mounting position any Electromagnetic compatibility Electromagnetic compatibility of operating equipment Directive 2004/108/EC Electrical appliances for application within particular voltage limits Directive 2006/95/EC Equipment safety Safety requirements for electrical equipment for measurement, regulation, control and laboratory use IEC/EN Part 1: General requirements Particular requirements for Test and measurement current circuits IEC/EN Noise immunity Class A: Industrial environment IEC/EN Electrostatic discharge IEC/EN Electromagnetic fields MHz IEC/EN , EMV-ILA V01-03 Electromagnetic fields MHz IEC/EN , EMV-ILA V01-03 Rapid transients IEC/EN , EMV-ILA V01-03 Surge voltages IEC/EN , EMV-ILA V01-03 HF conducted interferences MHz IEC/EN , EMV-ILA V01-03 Voltage dips, short term interruptions, voltage variations and frequency change IEC/EN , EMV-ILA V01-03 Emissions Class B: Residential environment IEC/EN RFI Field Strength MHz IEC/CISPR11/EN Radiated interference voltage MHz IEC/CISPR11/EN Radiated interference voltage MHz EMV-ILA V01-03 Safety Europe CE labelling USA and Canada UL labelling Firmware RS485 bus-termination Fig.: Modbus / RS485 termination Firmware update Update via GridVis software. Firmware download (free of charge) from the website: Comment: For detailed technical information please refer to the operation manual and the Modbus address list. = included - = not included 144

145 Chapter 03 Field bus modules series FBM FIELD BUS MODULES SERIES FBM Modbus GridVis Thermistor input Reporting 145

146 Chapter 03 Field bus modules series FBM Decentralised I/O field bus module series FBM10 RS485 interface Protocol Modbus RTU Can be used as a slave device to the measurement devices from series UMG 604-PRO, UMG 605-PRO, UMG 508, UMG 509-PRO, UMG 511 and UMG 512-PRO Also possible to connect over a distance of 1,000 m to the RS485 Modbus Master interface of the device; either via Profibus cable or e.g. a cable of type Li2YCY(TP) 2 x 2 x 0.22 Modules are available pre-configured and programmed according to the selected measurement device Use of the modules FBM10I and FBM10R Consolidation of various input and output signals in order to distribute to the respective participants Connection with the respective Modbus master from the device series UMG 604-PRO, UMG 605-PRO, UMG 508, UMG 509-PRO, UMG 511 or UMG 512-PRO is required in order to use the field bus modules. All data points are integrated into the Janitza system Detection of a wide range of key variables such as process data, states, error messages, threshold values, alarm outputs, etc. Archiving and visualisation via the software GridVis RS485 Fig.: Connection of the I/O field bus modules takes place via the RS485 interface of the UMG measurement device Example of using the inputs Tariff conversion Synchronising measurement periods Error messages State measurements Example of using the outputs Threshold value outputs for measured values Fig.: Connection diagram FBM10 PT1000/PT100; thermistor input 2-wire 146
 The recording and visualisation of the measured values takes place with the aid of UMG 604-PRO, UMG 605-PRO, UMG 508, UMG 509-PRO,")
147 Chapter 03 Field bus modules series FBM Use of the FBM10PT1000 module Temperature field bus module Logging of up to 10 temperature measurements (e.g. via PT100 or PT1000) The recording and visualisation of the measured values takes place with the aid of UMG 604-PRO, UMG 605-PRO, UMG 508, UMG 509-PRO, UMG 511 or UMG 512-PRO and the required expansion (see chapter 04 APPs Expansion with know-how) Fig.: Following the APP installation it is also possible to save the values. Example Temperature monitoring Temperature logging Field bus modules series FBM Type Relay outputs Digital inputs* 1 Analogue inputs* 2 Thermistor inputs Item no. FBM10I * FBM10PT1000 * FBM10R-NC * FBM DI8-AI8 * * 1 Only state message * m * 3 The modules are not suitable for the ProData in gateway operation. General technical data Supply voltage 24 V DC ±20 % No-load current 20 ma Interface, protocol RS485, Modbus-RTU Transmission rate 4,800 to 38,400 Bit/s Digital input 24 V DC, 5 ma Relay outputs 24 V DC 0.5 A / 250 V / 3 A AC1 / 2 A AC3 Ambient temperature C Accuracy <0.1 % for temperature measurement PT1000 EMC per EN Terminal plug-in terminals up to 1 mm² Housing 45 mm installation row system 90 x 88 x 58 mm (H x W x D) Installation top-hat rail Humidity <95 % rel. humidity non-condensing Protection class IP20 Standards CE conformity 147
148 Chapter 04 GridVis software 04 Software and IT solutions Janitza software and IT solutions UMG device homepage & APPs Energy-Portal GridVis software Page 149 Grid visualisation software GridVis Software for energy and power quality monitoring systems Management of all measurement data, general electrical parameter / energy / power quality / RCM Programing and configuration of the measurement devices Page 151 Jasic programming language (PLC functionality) Special programing / script language for various different UMG measurement devices Functions in the UMG device can be individually expanded Up to 7 user defined programs possible Page 175 APPs expansions with know-how Expansions (APPs) for various different UMG measurement devices Functions integrated in the UMG device can be expanded, controlled and visualised via APPs Administration and installation via GridVis software Page 179 Device homepage Page 190 Power management and power quality analysis online Software installation not required Online data, historical data, graphs recording events and much more are directly available from the device homepage Cloud solution for energy management Cloud solution especially designed for energy data Access from anywhere in the world via the PC or tablet under Evaluating and displaying energy data from the UMG measurement devices Seite Page OPC server Standardised interface between UMG measurement device and any OPC compatible Software environment Linking and archiving of various measurement data Integration into building management systems or automation (PLC) systems Page 195 Complete server with GridVis software and database Powerful server as complete solution Pre-configured server guarantees immediate usability Simple integration into existing network Page

 JANITZA SOFTWARE AND")
149 Chapter 04 Janitza software and IT solutions Sankey diagram for flow analysis KPI (Key figures / Benchmarking) JANITZA SOFTWARE AND IT SOLUTIONS 149


 Online acquisition of")
150 Chapter 04 Janitza software and IT solutions Janitza software & IT solutions UMG measurement devices homepage & APPs Display the measured values via the device s own homepage Expansions (APPs) for various different UMG measurement devices Fig.: The device s own homepage Energy portal Cloud solution for energy management No investment in software, databases and IT infrastructure required Simple summarization of all energy data from different locations GridVis -Basic Free basic version GridVis -Professional As GridVis -Basic, but with the following additional features: Automatic read-out of the measurement devices Virtual device MySQL / MS-SQL database driver User administration Fig.: Energy-Portal GridVis -Service As GridVis -Professional, but with the following additional features: Service (runs activeley in the background for automatic data read-out) Online acquisition of measurement data REST interface (enables external applications to access the measurement values saved) Alarm management Fig.: GridVis -Software GridVis -Ultimate As GridVis -Service, but with the following additional features: Includes the GridVis -Energy web interface Expanded user management Create your own dashboards and templates Overview of all devices Upload your own images with the image manager 150


151 Chapter 04 GridVis software GridVis Grid visualisation software 151

152 Chapter 04 GridVis software GridVis software An elementary component for energy management systems and power quality monitoring systems Analysis and visualisation of energy measurement data, electrical- and power quality data Uninterrupted documentation of important measurement data Chronological arrangement of harmonics, voltage variations or power failures, for example Timely detection of inadequate power quality prevents production downtime and optimises the utilisation of operational equipment Introduction of measures for improving energy efficiency due to the analysis of the load profiles and consumptions Creation of framework conditions for operational energy management systems (ISO 50001) Software and hardware components provide more transparency and a more reliable documentation of the energy supply Energy management systems serve as support for economical, ecological and optimised use of energy in companies Promotion of energy management systems in Germany In principle all companies based in Germany or with a branch office in Germany are entitled to apply Companies that are not entitled to apply are those: - that have lodged a claim under the "Special compensation scheme per 40 ff. Renewable energy act and were obligated to verify certification per 41 section 1, number 2 of the Renewable energy act. - for whom an exoneration was granted within the scope of the equalisation of peaks per 10 electricity tax law and 55 energy tax law The amount of the grant is: - Max. 80% of the eligible tasks and max. 8,000 Euro for the first certification of an energy management system per DIN EN ISO Max. 80% of the eligible tasks and max. 1,500 Euro for the first certification of an energy control system - Max. 20 % of the eligible tasks and max. 8,000 Euro for the procurement of measurement equipment for energy management systems - Max. 20 % of the eligible tasks and max. 4,000 Euro for the procurement of software for energy management systems - The complete sum of the grant is restricted to max. 20,000 Euro per company within a period of 36 months Detailed and updated information can be found at energie/energiemanagementsysteme/index.html 152

153 Chapter 04 GridVis software Your benefits Reduction of energy costs Energy tax reduction in conjunction with an EnMS (e.g. in Germany) Transparency of energy consumption in the individual departments Increase in supply reliability Environmental protection, image enhancement (ecological mindset) Application of an improved energy mix Optimisation of energy contracts Greater employee awareness with regard to energy efficiency and climate protection Cost centre management: Cause-related assignment and breakdown of energy costs Increase in competitive capability GridVis main features AMR (automatic meter reading system) Configuration of the monitoring system and the UMG measurement devices Measurement device management Automatic or manual read out of the devices' measurement data Graphical display of online and historical measured values Display of minimum, average and maximum values in a graph Statistical evaluations Comprehensive export functions e.g. into an Excel file APPs management (customer-specific applications / programs) Saving of data in a database incl. database management (e.g. MySQL / MS SQL / Derby DB / Janitza DB) Topological views (configurable, graphical user interface with freely configurable register levels) Individually configurable schedules (e.g. report generator, memory read-out, etc.) Virtual devices e.g. summation of energy from multiple meters Generic Modbus device for incorporation of "Non-Janitza devices" Report generators allow the adjustment and configuration of reports (energy costs and power quality) Comprehensive alarm management with escalation management and log book function User administration 153

154 Chapter 04 GridVis software GridVis license model / software variants GridVis Basic + GridVis Professional + GridVis Service *1 + GridVis Ultimate Free basic variant Maximum of 5 devices Comprehensive graph screen Manual reports Topology view Janitza DB As GridVis -Basic, but with the following additional features: No restriction in number of measurement devices MySQL / MS SQL DB support Automatic read-out of the measurement devices Virtual measurement devices User management (for assigning user rights) Scheduling point in time CSV data import RCM report As GridVis -Professional, but with the following additional features: Service for automatic data logging in the background Online logging of measurement data REST interface Comprehensive alarm management Excel export Generic Modbus Automatic reports I PQ reports Cost centers Scheduling time periods As GridVis -Service, but with the following additional features: GridVis -Energy web interface Expanded user management Dashboards (customized creation of an unlimited number of pages) Widgets Key Performance Indicator (KPIs) Sankey diagram for energy flow analysis Device overview with graph function Image manager *1 Some functions are only available in conjunction with GridVis installation on the desktop. See variants table on page 174 for details on the variants Device configuration Setting up and configuration of the measurement devices Comprehensive adjustment and customizing options User-friendly incorporation, parameterisation and configuration of the UMG devices Determination of trigger values for the measurement of events and transients Saving of individually defined measured values including their storage intervals Threshold values for the monitoring function can be programmed via comparators External temperature sensors allow the acquisition of transformer- or ambient temperature Time correlation of results at various different measurement points by means of time server (NTP) Fig.: Configuration of measurement devices in the GridVis software 154

 The connection of non-janitza devices is implemented via a UMG Master or in the case of Mod/TCP via an arbitrary Mod/TCP gateway As an alternative the value")
155 Chapter 04 GridVis software Generic Modbus devices Modbus RTU, Modbus TCP/IP Simple integration for devices from other manufacturers via Modbus RTU or Modbus TCP/IP Fig.: Example of an ECS template for Modbus meters Fig.: Communication checking via integrated statistical function Prerequisite: - Non-Janitza devices support Modbus RTU or Mod / TCP protocol - Data formats in accordance with the Modbus recommendations (Modbus-ASCII protocols are not supported) The connection of non-janitza devices is implemented via a UMG Master or in the case of Mod/TCP via an arbitrary Mod/TCP gateway As an alternative the value read-out can be implemented directly with the GridVis software (Modbus TCP/IP over Ethernet) Non-Janitza devices are integrated via profiles and administered as templates in GridVis Templates can be exported Profiles can be created and edited directly in GridVis Measured values read out from the non-janitza devices can be displayed in the topology view With GridVis -Service it is possible to save the measured values online, incl. the calculation of the average value Measured values are polled cyclically Checking of the communication via integrated statistical function An overview of functions Data transfer rates 9.6; 19.2; 38.4; kbps Device integration via RS232, RS485, Modbus (Ethernet) Supported function codes: Read coil status (fc = 1), Read holding registers (fc = 3), Read input status (fc = 2), Read input registers (fc = 4) as well as the floating point formats (32 bit, 64 bit) each per IEEE 754 such as Short (16 bit), Unsigned Short (16 bit), Integer (32 bit), Unsigned Integer (32 bit) und Integer (64 bit) Profiles can be freely configured Online saving of values possible Values: Water, gas, heat, energy, etc. Importing and exporting of values possible Values are read in blocks 155


156 Assembly plant Seattle Plant Denver Test Center Montreal Research and technology Chicago Plant Buenos Aires Plant São Paulo Headquarters Lahnau Research Center Pfeffenhausen Assembly plant Hamburg Plant Freiburg Plant Gothenburg Plant Glasgow Plant Seville Plant Parma Plantk Istanbul Plant Talin Plant Warsaw Assembly plant Moscow Plant Talin Plant Gothenburg Plant Glasgow Assembly plant Moscow Assembly plant Hamburg Werk Warsaw Headquarters Lahnau Research Center Pfeffenhausen Plant Freiburg Plant Parma Plant Istanbul Plant Seville Assembly plant Cairo Research and technology Chicago kw Plant Denver kw Test Center Montreal kw Assemly plant Seattle kw Plant Buneos Aires kw Plant São Paulo kw Plant Johannesburg kw Assembly plant Cairo kw Plant Johannesburg kw kw kw kw kw kw kw kw kw kw kw kw Plant Seoul Assembly plant Shanghai Technology Center Tokyo Plant Seoul Technology Center Tokyo Assembly plant Shanghai Research and Technology Melbourne Research and Technology Melbourne kw kw kw kw Chapter 04 GridVis software Topological views (visualisation) Quick overview of your energy distribution system Localisation of disturbances and monitoring of defined tolerances by comparison of individual measurement points Immediate and simple realisation of customer-specific solutions by using exisiting graphical data such as flow plans, manufacturing lines etc. as well as the incorporation of the associated measurement devices ("Drag-and-drop") View of threshold value exceedances as well as the conditions of the inputs and outputs Highlighting of threshold values being exceeded or dropped below by means of colour coding Device view can be called up for each measurement device connected to the network Selected measurement data can be called up remotely online (device dependent) Fig.: Complete overview of the energy distribution by means of topological views Fig.: A warning message of a certain production line Animation in the topology Value-dependent display of images possible and thus, for example, colour coding. Possible to change view between images, measurement value dependent There is an option, for example, when the nominal voltage is exceeded to activate a red traffic-light style indicator or to mark a circuit breaker as tripped Hyperlinks in the topology Hyperlinks can be set in the topological view for the following elements: - URLs, i.e. call-up of arbitrary internet sites - To other topological pages - To saved graphs - To documents, e.g. calibration- or PQ report - For execution of programs Access to calibration certificates, operations manuals, Excel evaluations or arbitrary homepages Starting batch jobs or other programs 156


157 Chapter 04 GridVis software Online and historical measured values Fig.: Display of active power L1 L3, load profile as basic instrument for energy management considerations Fig.: GridVis Screen with historical evaluations Online measurement data All measured values that are created transmitted by the measurement devices in realtime Data management of all measured points Measured values are available either as line graphs or bar charts in the online measurement mode Line graphs are always up-to-date (older data will be deleted, FIFO-principle) Display of double y-axes with two units (e.g. current and voltage synchronously) possible for measurement data Multiple measurement devices can be displayed in the same graphs for each unit Colours in the graphs can be individually changed Historical measurement data Measured values that have been saved in accordance with defined rules for averaging times in the device or by reading out the device into a central database Each value receives a timestamp as well as the corresponding device ID Administration of the data saved in the database, sorted by parameter, year, month and day Selective marking of the data guaranteed Time periods of interest can be expanded with the zoom and can be quantified by means of the measurement function Annotating the bar charts / line graphs or histograms with headers and comments Display of transients and events in the transient or event browser Missing measurement data during particular time periods or unrealistic measurement information can be displayed by means of a flag browser Creation of load profiles (for example for the generation of precise forecasting for optimised energy delivery contracts) Statistical function (voltage etc.) 157

 Reports can be generated, time-driven Manual report generation in cases of concrete needs Automatic report generation Freely configurable time plans Energy management")
158 Chapter 04 GridVis software Reporting Power quality Fig.: Power quality report An important part of the PQ analysis is the GridVis report generation Fast and clear presentation of whether the power quality in the time period in question is in line with a standard or not Further tools provided for determining causes of problems Power quality reports as based on international standards - EN EN NeQual - IEEE ITIC (CBEMA) (only manual, not automatic) Reports can be generated, time-driven Manual report generation in cases of concrete needs Automatic report generation Freely configurable time plans Energy management Measurement and monitoring of important parameters of the electrical power supply Visualisation of the data delivered by the measurement devices (online current values or historical values) Integrated report generator enables the evaluation of the delivered data Reports can generate different information, depending on the requirements or the settings Transmission of energy and power related cost centre reports Presentation of the electrical energy values from measurement devices as well as evaluation of other media (e.g. gas, water, etc.) possible Load profile analyses provide an overview of peak consumption throughout a stipulated period of time Automatic creation of the individual reports via freely configurable time plans or manual creation by the user Reports' outputs as paper or digital (HTML, XML, Excel, Word or PDF) Fig.: Load profile, monthly view 158
 of data Free data or specific energy selection Excel document with multiple pages to be filled with data by GridVis Measurement data, time period and various different measurement devices will")

159 Chapter 04 GridVis software Export Manually and automatically via time plans Time-driven, automatic Excel export (.xls,.csv,.pdf) of data Free data or specific energy selection Excel document with multiple pages to be filled with data by GridVis Measurement data, time period and various different measurement devices will be selected by the user in GridVis and contain pure data from the database as well as pre-calculated data (energies) There are three options available for the export: Overwrite existing data, create new data with date or change existing data Export options likewise time-driven and furnished with a time plan freely defined by the user Convenient evaluation guaranteed Customer-specific evaluations can be implemented Fig.: Exported data from GridVis in an Excel file Fig.: Customer-specific Excel evaluation for el. power and energy based on the automatic Excel report 159
160 Chapter 04 GridVis software Database management Database integration in GridVis -Desktop and -Service Backing up of data in a database when reading out the measurement device memory Possible databases: Apache Derby, MySQL, MS SQL and Janitza DB GridVis Desktop and GridVis -Service or a mixture of both are available The reading out of a UMG device at a point in time is always linked to precisely one GridVis or one Service GridVis -Desktop The installation is implemented locally on a Desktop PC or centrally on a virtual machine The GridVis must be active for the data to be read out Consequently, devices can be controlled, read out and configured Data created will be written into the database associated with the respective GridVis Project UMG 511 TCP/IP Fig.: GridVis -Desktop Database UMG 508 Fieldbus Modbus RTU UMG 96RM GridVis -Service Works via a system service on a remote server The system service can read data in the background continuously from the measurement devices without GridVis -Desktop being open and a user logged-in This service installation enables multiple clients to operate in parallel Configuration of UMG measurement devices or projects is implemented via the GridVis -Desktop program There will be a subsequent transfer of the device rights to the GridVis Service The GridVis Service can be configured via a web browser Graphical and statistical evaluations continue to run via the GridVis Desktop Service UMG 511 Database Administration UMG 508 Fieldbus Modbus RTU UMG 96RM Fig: GridVis -Service 160
161 Chapter 04 GridVis software Janitza DB Since GridVis release # 4.1, the Janitza database "Janitza DB" has been released This database can be selected during the set-up of a new project Creation of the database through GridVis This database has been specially optimised for GridVis It is extremely fast Data exchange with other software platforms, homepages etc. can be realised via the REST interface Delivered with all editions of GridVis There are no additional costs No additional installation effort Note: With the Janitza DB it is not possible for multiple clients to access the Janitza DB! One can only connect a GridVis Desktop and a GridVis Service on "one" computer or server with the same Janitza DB! Data exchange Uncomplicated system integration through numerous interfaces and protocols (Modbus, M-Bus) Networking of all energy measurement devices with one another possible The communication between GridVis and the measurement devices is implemented typically via Modbus RTU or Modbus TCP (as well as other TCP/IP protocols) Automatic read-out of the measurement devices via a Fieldbus Measurement data will be made available for further use via central data servers Ethernet TCP/IP as backbone for the data communication to reduce installation costs Rapid, cost-optimised and reliable communication assured through integration into an Ethernet architecture PLC, BMS or SCADA software can access the Modbus addresses directly Alternatively, it is possible to integrate UMG measurement devices into a PLC environment via Profibus Communication of various different systems in the building automation via BACnet (available as an option) Online values (e.g. topology, linear graphs) Historical values Load profile Reports Visualisation (SCADA, GLT, building control systems) HTTP BinFile (FTP) customer-specific software OPC Server (e.g. PLC, BMS etc.) TCP/IP UMG 511 GridVis Modbus RTU SQL database Excel export REST (Representational State Transfer) UMG 96RM UMG 103-CBM UMG 104 Fig.: Overview of the multifaceted integration options to superordinate software environments 161

162 Chapter 04 GridVis software Virtual measurement devices (cost centres, key figures) Virtual measurement devices are available for mathematical calculations by means of GridVis Compilation of multiple sites through the addition of various different measurement points (cost centre management) Calculation of key figures e.g. for the evaluation of the energy efficiency in data centres Calculation of current and historical values with existing databases The following operations are possible: Addition, Division, Subtraction, Multiplication Generation of percentage values based on numeric constants No creation of additional measurement values in the database Calculation implemented in the runtime of the GridVis There are various different target data points available (e.g. ProData data logger) for the calculation of nonelectrical media Possibility of incorporating devices from other manufacturers via the generic GridVis Modbus option (integration test may be necessary) Measurement values from the measurement devices' global variables can be processed in virtual measurement devices as an option Virtual Device 400 V bus / measurement outputs Dept. 1: Lighting Dept. 1: HVAC Dept. 1: Manufacturing Dept. 1: Admin Dept. 1: Workshop Dept. 1: Compressor Fig.: The virtual measurement device calculates the total consumption in the supply line Fig.: Configuration of a virtual device: Here, the total of the active energy from 6 different measurement points 162


163 Chapter 04 GridVis software Power quality analysis In parallel to energy monitoring, GridVis places the monitoring of the power quality in the foreground Defining of threshold values via GridVis Automatic recording of events, including the period immediately before and after, such as over-voltage or under-voltage, short-term interruptions, over-current and transients Preconfigured parameter lists for recordings per EN and EN available GridVis provides a series of features for the power quality analysis: Fig.: Statistical function with histogram, e.g. with triple deviation (99%) for the evaluation of the voltage fluctuation at a defined measurement point over time Oscilloscope function for the live wave forms of current and voltage Topological view with threshold value monitoring of online values Transients and events overview in the measurement devices' dashboard Graph sets with freely configurable measurement parameters Automatic creation of PQ reports per time plans PQ reports for various different standards: NeQual, EN 50160, EN , IEEE 519 Comprehensive statistical functions ITI (CBEMA ) curve Event browser via lists and graphical display for detailed analysis Transient browser via lists and graphical display for detailed analysis Fig.: Graph set with freely configurable PQ measurement values Events and transients Events are short-term increases in voltage, dips in voltage or short-term interruptions (e.g. through bird strike or short circuits) Identification and analysis of the causes for fluctuations in power quality with the help of user-friendly tools Event and transients browsers are helpful tools for the determination and assignment of various different processes Call-up, expanding, reducing, printing out or exporting (PDF or Excel file) of the graph directly from the list Optimum utilisation of the UMGs performance by GridVis Secure acquisition and processing of events from 20 ms and transients from 50 µs duration with UMG 511 and UMG 605-PRO for example Fig.: The event browser provides a quick overview of the voltage dips with date and timestamps as well as the length and depth of the voltage dip. Fig.: Detailed analysis of a critical voltage dip 163


164 Chapter 04 GridVis software User management Multifaceted user profiles Typically, a user (Admin) who will have no restrictions within the GridVis is defined The Administrator can for example administer users and add or delete devices/topologies etc. Permits the specific assignment and deletion of each user's rights Defined access authorisations can be assigned through the rights Likewise, users are created and they are assigned rights or assigned to groups with this function The user administration can be agreed and set as an active function within a project Only one user administration can be defined for each project All users, passwords, roles and rights are held in one database (user directory). Multiple projects can be protected from one single user directory The individual rights of users are compiled in predefined roles (groups of entitlements) Roles (groups of rights) are cumulative, i.e. the rights of users from various roles are added together If a project is protected via the user administration, it is necessary to log in to gain access to the project Use of user administration within GridVis is available in all editions (from GridVis 4.0) except for the basic edition Fig.: User administration overview Fig.: User editor Fig.: Assignment of roles 164
165 Chapter 04 GridVis software REST interface via GridVis -Service Online and historical data are supported Fig.: Graphical display of the energy values via the REST interface from GridVis Gas 32% Water 27% Fig.: Cost distribution Energy 40% Simple and rapid calculation of energy data The REST interface (Representational State Transfer) describes a standardised request for measured variables or further information via a URL address Various different methods can be used to integrate measurement data into software from other manufacturers due to very open system architecture Integration of data from GridVis into other software environments, e.g. SCADA or BMS Further processing of the data, e.g. for the calculation of the key figures Results of the query via the URL are the page contents in JSON / XML with the queried measurement variables / information Extremely useful for the integration of measurement data into your own software solutions, visualisation systems or homepages Extraordinarily fast interface Querying and transfer of online and historical data REST interface only available via the "GridVis -Service" edition of GridVis UMG 511 Database Database TCP/IP REST interface UMG 96RM Fieldbus UMG 508 Fig.: Data transfer between GridVis -Service and an external SCADA system via the REST interface GridVis -Service SCADA 165
 Rapid and reliable signalling of fault conditions (e.g. disconnected communications between measurement devices and measurement data servers, measured value exceedances, etc.")
166 Chapter 04 GridVis software Alarm management Intelligent alarm management system Systematic management of alarms in the field of energy-, RCM- and power quality monitoring Monitoring of all measurement parameters of the UMG measurement devices Powerful alarm management (from GridVis Release 4.2, Edition GridVis -Service) Rapid and reliable signalling of fault conditions (e.g. disconnected communications between measurement devices and measurement data servers, measured value exceedances, etc.) Fully automatic fault reporting immediately after the occurrence via various different channels to be transmitted to a multitude of different recipients Alarms are defined as events, which require an immediate reaction from the energy manager responsible or from the person responsible for operations An individual adaptation can be implemented, tailored to the particular requirements of the operator through the various options Extensive range of services Direct, rapid and secure information for the service personnel responsible Convenient administration of employees and actions Acknowledge function Escalation management; in the event of there being no feedback the next employee is informed Log book function, alarm list with open and acknowledged alarms Sorting and filtering functions Effective monitoring facilities Online values: Monitoring threshold values (absolute values, consumption values over time) Historical values: Monitoring threshold values (absolute values, consumption values over time) Monitoring the availability of the measurement points (UMGs) in terms of data communication Monitoring of the last point in time for synchronised data 166
 similar configuration structure Output in PDF or XLS data, also special format incl.")
 Optimized for differential currents")
167 Chapter 04 GridVis software PQ reports Freely configurable limits, annual report acc. EN50160, heat map and evaluation functions 4 new reports (heat map, matrix, device sheets and table) similar configuration structure Output in PDF or XLS data, also special format incl. company logo and own signature Template function for set of threshold values Optimized monthly and annual reports EN and EN conform template Fig.: PQ report heat map RCM report Analyze and evaluate differential current failures 4 limit values Support of dynamic limits (RCM measuring device) Optimized for differential currents Varity of 2 different report designs Light function Optical highlighting of the results Output in PDF and XLS data Fig.: RCM report 167
168 Chapter 04 GridVis software GridVis editions a multitude of possibilities GridVis -Ultimate As GridVis -Service, but with the following additional features: NEW: GridVis -Energy web interface Expanded user management Dashboards (customized creation of an unlimited number of pages) Widgets Key Performance Indicator (KPIs) Sankey diagram for energy flow analysis Device overview with graph function Image manager GridVis -Service *1 *1 As GridVis -Professional, but with the following additional features: Service (background process) for automatic data logging in the background Online logging of measurement data REST interface Comprehensive alarm management Excel export Generic Modbus Automatic reports Cost centers Scheduling time periods PQ reports GridVis -Professional As GridVis -Basic, but with the following additional features: No restriction in number of measurement devices MySQL / MS SQL DB support Automatic read-out of the measurement devices Virtual measurement devices User management (for assigning user rights) GridVis -Basic free basic variant Maximum of 5 devices Comprehensive graph screen Manual reports Topology view Janitza DB *1 Some functions are only available in conjunction with GridVis installation on the desktop. 168

169 Chapter 04 GridVis software NEW: Web visualization GridVis -Energy with the software variant GridVis -Ultimate Item no Log and display energy data, reduce costs Tailored web solution for energy management and visualising the energy data Highest standards for transparency and flexibility in allocating your company s resources Comparing energy data based on Key Performance Indicator or mass flow diagrams Comprehensive and easy to handle configuration of all Janitza measurement devices Monitoring energy flows and power quality Graphs, tables, diagrams, key figures, Sankey diagrams etc. can be created and freely positioned on so-called dashboards Transparency for your energy consumption or generation Realtime monitoring, or display of historical measured values possible at any time via a web browser User administration Intuitive operating Sankey diagram for flow analysis 3 in1 Energy management (according to DIN EN ISO 50001) Power quality monitoring and analysis Residual current monitoring (RCM) KPI (Key figures / Benchmarking) 169
 Database management (automated & manual) Measurement device management (direct access to settings and memory of the measurement devices) Cost centre")
170 Chapter 04 GridVis software A convincing list of features Ultimate edition Alarm management (automated monitoring and notification tool) Report functions (automated & manual), outputs to formats.xls,.csv,.pdf Read-out devices (automated & manual) Database management (automated & manual) Measurement device management (direct access to settings and memory of the measurement devices) Cost centre management (virtual devices allow you to view cost centres) Power quality monitoring (EN & EN ) Service (background process optimised for server) Online logging (log measured values permanently, even for devices with no memory function) REST interface (web API for direct access to historical and live values) Web interface Detailed functional overview GridVis -Energy web interface Web-based visualisation software KPIs (key figures & benchmarking) Sankey (graphical representation of mass flows) TÜV-certified according to ISO (energy audit & EnMS) Comparison & benchmarking of locations & facilities (gauge the potential for optimisations) Analysis of energy & measurement data (simple & complex analyses are possible) No restriction on data points (free & unlimited access to all measurement data) Access your visualisations regardless of location (no client installation necessary, access them directly via a web browser) Dashboard configurator (create overviews to meet your own particular demands, clear & simple engineering effort) User management (manage user access rights) Evaluation of live & historical measured values (direct access to measurement devices & database) The GridVis -Energy Web Visualisation is part of the Grid- Vis -Ultimate edition Animated widgets (charts, diagrams, tables, KPIs, Sankey & many more) Image manager (simple management of graphics & images) 170


171 Chapter 04 GridVis software Dashboards Individual web pages design with 17 different widgets 17 Widgets Custom web pages Dashboard Editor Links Zoom Print function Grouping Templates Key Performance Indicator (KPIs) Comparability of consumption, economic figures, or quantitíes Key Performance Indicator Evaluation Comparison Widget Trend 171


172 Chapter 04 GridVis software Sankey diagram Graphical representation of mass flows Mass flows Freely configurable Widget Live values Historical values Accompanying values Loss indication User management Individual access rights and simple user management Intuitive User rights User profile Status indicator User management 172


173 Chapter 04 GridVis software Device overview Structured and tabular device overview list Structured Table Information Template Image manager Administration of its own images, icons and graphics Incorporate your own images, icons and graphics into the application All common graphics formats are accepted SVG format recommended 173
174 Chapter 04 GridVis software Overview of GridVis editions Attribute Basic Professional Service NEW Ultimate Installations (desktop) Installations (service / virtual server) Number of devices 5 Unlimited Unlimited Unlimited Update period Unlimited 1 year 1 year 1 year Telephone support Unlimited Unlimited Unlimited Unlimited Graphs *2 *2 Janitza DB / Derby DB database Manual reports *2 *2 Graphical programming *2 *2 Topology *2 *2 MS SQL / MySQL database support *1 - Automatic read-out - Virtual device - User administration - Scheduling points in time - CSV data import - RCM report - Scheduling time periods - - PQ reports - - Automatic Excel export - - Generic Modbus - - Graphical programming module - - (read / write Modbus) *2 *2 Automatic reports - - *2 *2 Online logging - - Service - - Alarm management - - REST interface - - GridVis -Energy web Visualisation Item number Item number for update extension (per year) Item number for upgrade to next higher suite * 1 SQL database is not included in the scope of deliverables. * 2 This function is only available in conjunction with GridVis installation on the desktop. Number of devices: Update period: Automatic read-out: Online logging: Service: Max. number of simultaneously loaded devices (e.g. within the basic version: a project with 5 devices or 5 projects with one device). Time period in which new versions can be installed free of charge. Device read-out in accordance with freely configurable time plans. Measurement data from devices without memory will be averaged in the GridVis software. The GridVis software runs in the background and will be started automatically. Devices can be readout time-independent and automatically. For configuration and data processing the desktop installation is required. 174

175 Chapter 04 Jasic programming language Jasic PROGRAMMING LANGUAGE 175


176 Chapter 04 Jasic programming language Manifold programming options Special programming / script language for the measurement devices UMG 604-PRO / UMG 605-PRO / UMG 508 / UMG 509-PRO / UMG 511 and UMG 512-PRO The user is no longer restricted to the functionalities integrated in the measurement device, but rather the device can be expanded to suit the individual's requirements Graphical programming supports the creation and configuration of mathematical functions and logical links The devices' own digital outputs can be set Digital inputs can be easily evaluated The processing and writing of registers belonging to external devices can be implemented via the Modbus Free configuration of threshold value infringements, timer functions or recording of special values can be implemented Programs created can be stored as files or transferred directly to the measurement device There are 7 memory spaces available, each with 128 kbyte, for the saving of the programs Simultaneous operation of these 7 programs possible User-friendly, graphical programming Free programming of the Jasic source code by the user Fig.: Jasic source code 176
177 Chapter 04 Jasic programming language Graphical programming: Examples Example of threshold value monitoring (comparator) Example 1 Monitoring of current L1: Determination of the threshold value by means of constants, lower level 2 A, upper level 100 A Digital output 1 signals the exceedance of the predefined values Example 2 Works with only one lower threshold (in this case 100 A) In the event of the current dropping below 100 A, digital output 2 will be activated 177
178 Chapter 04 Jasic programming language Example 3 An will be sent in the event of the value dropping below the predefined setting In this example the will be sent with an under-voltage of < 200 V in phases L1, L2 or L3 Additional information: Voltage values from the 3 phases at the time of the undervoltage 178

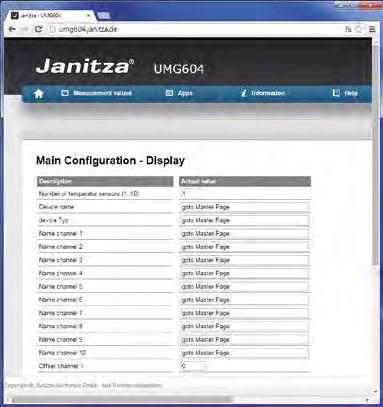

179 Chapter 04 APPs APPs expansions with know-how 179
180 Chapter 04 APPs Software based expansions for the measurement devices Functions integrated in the UMG device can be expanded, controlled and visualised via APPs Depending on the application, consisting of several Jasic, Flash and homepage files (administration and installation implemented via GridVis software) The programming language for creating APPs is Jasic Alternatively, the programming can also be implemented graphically with the GridVis Development of further APPs for the measurement devices by the user and third parties possible The creation of APPs requires programming knowledge of Jasic, JAVA Script, JSON, AJAX or Action Script depending on the application Overview of product variants Description Alert Messenger *6 Configurable Jasic program for sending fault messages by Suitable for UMG 604 / UMG 605 / UMG 508 / UMG 509 / UMG 511 / UMG 512 and PRO series Item number EN50160 Watchdog *6 Integrated "Watchdog"-function for continuous monitoring per EN FBM10PT1000 *2 Up to 10 additional thermistor inputs can be implemented via the RS485 interface by means of hardware expansion GPS Sync Synchronization of the device time via digital input. For usage of the APP the GPS receiver, item no , is required Humidity & Temperature JFTF-I *3 Processing and recording of up to 8 temperature / moisture sensors possible IEC Watchdog *6 Integrated "Watchdog"-function for continuous monitoring per IEC IEC Watchdog Light *6 Integrated "Watchdog"-function for continuous monitoring per IEC *4 *6 Measurement monitor Display of current and historical measured values in the form of diagrams on the device's own homepage UMG 605 / UMG UMG 604 / UMG 605 / UMG 508 / UMG 509 / UMG 511 / UMG 512 and PRO series UMG 604 / UMG 605 / UMG 508 / UMG 509 / UMG 511 and PRO series UMG 604 / UMG 605 / UMG 508 / UMG 509 / UMG 511 / UMG 512 and PRO series UMG 605 / UMG UMG 604 / UMG UMG 96RM-E APP Mini EnMS *6 Display of current and historical measured values in numbers and diagrams from a master device and max. 15 UMGs without memory, on the device's own homepage Multitouch *1 Reading out of 30 measured values and max. 31 slave devices via RS485 *5 *6 Push Service Sending data directly from the measurement device to a server without any additional software with 10 slave devices *5 *6 Push Service + UMG 20CM Sending data directly from the measurement device to a server without any additional software For UMG 20CM queries over: UMG 604 / UMG 605 / UMG 508 / UMG 509 / UMG 511 / UMG 512 and PRO series SNMP Threshold monitoring with alarm function (SNMP-Trap) UMG 604 / UMG 605 / UMG 508 / UMG 509 / UMG 511 / UMG 512 und PRO-Serie UMG 604 / UMG 605 / UMG 508 / UMG 509 / UMG 511 / UMG 512 and PRO series UMG 604 / UMG 605 / UMG 508 / UMG 509 / UMG 511 / UMG 512 UMG 604 / UMG 605 / UMG 508 / UMG 509 / UMG 511 / UMG 512 and PRO series UMG 604 / UMG 605 / UMG 508 / UMG 509 / UMG 511 / UMG 512 and PRO series *1 Also needed for BACnet, if slave devices have to be visualized via RS485. *2 Free APP for item-no *3 Free APP for item-no *4 No APP installation; device activation required *5 The APP Push Service is integrated in the firmware of the measuring device UMG 96RM-EL (unencrypted). *6 Serial number is needed 180

 Emails* 1 with consumption values for day, week and month can be sent (a non-encrypted mail server is required) Serial number is needed Suitable for: UMG 604 / UMG 605 / UMG")
181 Chapter 04 APPs APP Fault message Item no Configurable Jasic program for sending fault messages by Depending on configuration, sending of fault messages with the following events: Total harmonic distortion voltage exceeded, short-term interruption detected, transient detected Saving the meter readings for the event and transient messages in the Modbus register Option to monitor additional measured values via an interface (not included) s* 1 with consumption values for day, week and month can be sent (a non-encrypted mail server is required) Serial number is needed Suitable for: UMG 604 / UMG 605 / UMG 508 / UMG 509 / UMG 511 / UMG 512 and PRO series APP FBM10 PT1000 Item no Up to 10 additional thermistor inputs can be implemented via the RS485 interface Hardware expansion FBM10 PT1000 a DIN rail module with 10 PT1000 inputs necessary for this APP Suitable for: UMG 604 / UMG 605 / UMG 508 / UMG 509 / UMG 511 / UMG 512 and PRO series Fig.: Measured value display via the devices homepage APP Humidity & Temperature JFTF-I Item no Can process and record the measured values from up to 8 temperature/ moisture sensors (item no ) In doing so the display of the measured values is implemented via a homepage after installing the APP, or via global variables in the GridVis Measured values can be saved in a second Jasic program via the graphical programming Delivers two analogue 4 20 ma output signals, which will be processed by the function module FBM DI8AI8 (item no ) Suitable for: UMG 604 / UMG 605 / UMG 508 / UMG 509 / UMG 511 / UMG 512 and PRO series Fig.: Humidity / temperature sensor JFTF -I 181

182 Chapter 04 APPs APP EN Watchdog Item no & Integrated Watchdog function for continuous monitoring of the power quality per EN The power quality on the supply side should comply with EN This standard describes various power quality parameters for the distribution of electrical power on public power grids. EN pertains to mains voltage, i.e. the voltage measured at the mains connection point. With power quality monitoring per EN 50160, all the algorithms (including for 95% and 100% values) are integrated in the measurement device itself. The auxiliary voltage of the device should be buffered to ensure that power failures can be reliably detected as events. Integrated watchdog function No need to transmit large volumes of measured data from the measurement device to a host system Save on communications costs for applications with remote consumers Simple analysis possible thanks to integrated colour display based on a traffic light system Possible to perform power quality analyses even with no particular knowledge on the topic No alarm functionality Serial number is needed Item no suitable for: UMG 605 and UMG 512 Item no suitable for: UMG605-PRO and UMG 512-PRO Fig.: APP Power Quality Report based on the EN

183 Chapter 04 APPs APP IEC Watchdog Item no / / / Integrated Watchdog function for continuous monitoring of the power quality per IEC The standard IEC defines numerical limits for industrial and private power distribution systems at rated voltages up to 35 kv. For the consumer, the standard IEC should be applied with reference to power quality. Therefore the power quality in all technical systems must be continuously monitored in accordance with IEC , in order to ensure fault-free operation of the installed system. The auxiliary voltage of the device should be buffered to ensure that power failures can be reliably detected as events. Integrated watchdog function accordance with standard IEC No need to transmit large volumes of measured data from the measurement device to a host system Save on communications costs for applications with remote consumers Simple analysis possible thanks to integrated colour display based on a traffic light system Possible to perform power quality analyses even with no particular knowledge on the topic No alarm functionality Serial number is needed Item no suitable for: UMG 605 and UMG 512 Item no suitable for: UMG 605-PRO and UMG 512-PRO Item no suitable for: UMG 604 and UMG 509 Item no suitable for: UMG 604-PRO and UMG 509-PRO Fig.: APP Power Quality Analyse acc. to IEC

 Up to 60,000 data")
184 Chapter 04 APPs APP Measurement monitor Item no The Measured value monitor APP allows you to display current and historical measured values, in the form of diagrams, on the homepage of a Janitza UMG device. User-friendly controls mean you can create diagrams quickly and easily. Fully web-based, you only need a web browser Can be run on desktops, laptops, tablets etc. Access the most important current and historical measured values Easy operation with drag & drop Up to 6 measured values in a diagram (2 Y-axes) Up to 60,000 data points in a diagram (10,000 per measured value) Serial number is needed Suitable for: UMG 96RM-E Fig.: APP Measurement monitor 184

 Expansion for live value display Integrated BACnet gateway")
 The BACnet-ID can be changed via the homepage Program installs a control program Possible communications fault (RS485-Bus) directly visible via a status display The number of devices and device")

185 Chapter 04 APPs APP Multitouch Item no & Reads out 30 measured values (fixed default value) from up to 31 slave devices (configurable) via RS485 Filing of the measured values in the master in global variables or on BACnet data points Display of the measured values is implemented via the JPC35 touch panel or via the device homepage (browser with FLASH plug-in necessary) Expansion for live value display Integrated BACnet gateway function (option, item no ) The BACnet-ID can be changed via the homepage Program installs a control program Possible communications fault (RS485-Bus) directly visible via a status display The number of devices and device descriptions can be configured via the master devices homepage The master device is automatically recognised and entered in the "Device type" field The BACnet configuration is likewise implemented via the master device homepage Each device can be assigned its own BACnet-ID EDE file for the import of the BACnet data points in a BACnet-GLT is included in the scope of deliverables for the APP Item no suitable for: UMG 604 / UMG 605 / UMG 508 / UMG 509 / UMG 511 / UMG 512 and PRO series Item no suitable for UMG 20CM queries via: UMG 604 / UMG 605 / UMG 508 / UMG 509 / UMG 511 / UMG 512 and PRO series Fig.: Multitouch APP: Slave measurement devices overview on the master device homepage, e.g. up to 31 UMG Modbus slaves can be displayed via a UMG 604-PRO master device Fig.: Display of measured values for an individual slave device Fig.: General configuration of the monitoring master/slave devices Fig.: General BACnet configuration 185
186 Chapter 04 APPs APP Push Service 2.0 Item no & Applications Sending data directly from the device to the energy portal (without additional software) The delivery of data is implemented via port 80 Data can be saved in a MySQL database automatically Data can be visualised via a web server by means of a web browser An APP must be installed on each device Only Jasic-capable devices are supported (UMG 604-PRO / UMG 605-PRO / UMG 508 / UMG 509-PRO / UMG 511 / UMG 512-PRO) UMG 96RM-EL with integrated Push App function is supported Prodata and UMG 20CM only via Jasic -capable devices UMG 604EP-PRO Sending the data Firewall UMG 604EP-PRO Network Port 80 Sending the data Fig.: Sending the content of the memory for the web application Properties Sending of up to 25 measured values is possible simultaneously Delivery of the last mean values from the ring buffer APP automatically detects which data in the ring buffer is saved with which averaging time, and presents these for selection The measured values to be sent can be selected via the homepage Mean values are automatically synchronised to the device time The transmission time can be adjusted for the transmission buffer. In the event of the network connection failing, there are no gaps in the data so long as the failure is shorter than the transmission buffer time View of a status display on the homepage with the last data transmitted Setting of a daily status to verify a successful sending process (optional) Advantages Less data traffic Multiple devices can send data simultaneously The transmission string can be easily modified to suit individual requirements Thus there is an option to send data from external software The sending of data is implemented via port 80 (generally enabled with firewalls) Decentralisation and thus less susceptible to interference The transmission of data can be implemented as randomly controlled, so that there will be no overlapping Simple configuration 186
 Configuration implemented via the device website APP will be")

187 Chapter 04 APPs Overview of the main features of the APP Push Service 2.0 Sending of up to 25 measured variables to a "software as a service" program Time intervals adjustable via port 80 (via HTTP/Json) Configuration implemented via the device website APP will be delivered, encrypted, linked to an individual serial number of the UMG device (provision of the serial number necessary) Serial number is needed Item no suitable for: UMG 604 / UMG 605 / UMG 508 / UMG 509 / UMG 511 and UMG 512 Item no suitable for: UMG 604-PRO / UMG 605-PRO / UMG 509-PRO and UMG 512-PRO Fig.: Push Service 2.0 UMG 604-PRO Server Apikey for identifying the sender Setting of transmission buffer and transmission interval Server IP address Selection of the measured values to be transmitted. Only measured values that were previously configured in the measurement device will be displayed Fig.: Convenient configuration of the APP Push Service


188 Chapter 04 APPs GPS Sync Item no Synchronisation of the device time via digital input No NTP server required Easy installation Accuracy +/-1 s per GPS synchronization A GPS receiver (item no ), available as an accessory, is required This APP is not required for the UMG 512-PRO because the GPS receiver can be connected to the digital input 1 without an APP on the UMG 512-PRO Suitable for: UMG 604 / UMG 605 / UMG 508 / UMG 509 / UMG 511 and PRO series SNMP Item no The Limit value alarm via SNMP application monitors the settings made on the weg page and in GridVis and sends an SNMP trap when it is exceeded. Freely adjustable trap number Until two hosts setable Suitable for: UMG 604 / UMG 605 / UMG 508 / UMG 509 / UMG 511 / UMG 512 and PRO series Fig.: Configuration page on an UMG without RCM functionality Fig.: Configuration page on an UMG with RCM functionality 188


189 Chapter 04 APPs APP Mini EnMs Item no With the Mini EnMs APP you can set up a small, local, web-based energy management system for a maximum of 16 Janitza devices without memory. Online and historical data from the master and slave devices are displayed via the web-based user interface. The master device also acts as a data collector for the slave devices. Optimised for use on desktops, laptops or tablets Select measured variables for the master device and slave devices using drag & drop Select the desired time window with the integrated calendar function The main variables of the Modbus slaves are stored and displayed on the main measurement device No external server or software package needed; just a standard browser will suffice Maximum of 16 slaves (UMG 103-CBM, UMG 104 or UMG 96RM) Memory variables for slave devices Current L1, L2, L3 Total effective power Total apparent power Total effective energy The master collects the data and presents it on its own device homepage. The APP was developed for small applications where GridVis ist not being used. Serial number is needed Suitable for: UMG 604-PRO / UMG 605-PRO / UMG 508 / UMG 509-PRO / UMG 511 / UMG 512-PRO Fig.: APP Mini EnMS 189


190 Chapter 04 Device homepage Device homepage Power management and power quality analysis online The device-specific homepage for the measuring devices is ideal for users or target groups within a company, who do not wish to install the GridVis software or do not require it. For access to this, the user simply requires a conventional web browser and an Ethernet connection (or a local patch cable). The screens have been graphically revised and have now been made even more user-friendly. Each measuring device has an integrated web server, which makes a separate, password-protected homepage available. It is possible to operate the device just as comprehensively via this, as via the device display. Furthermore, extensive online and historic measuring data (standard power consumptions), including the power quality analysis, can also be called up. It is even possible to control the measuring device remotely and configure it via the display indications. Because a multitude of PQ measured values can be displayed in addition to the countless standard electrical values, for many users the measuring device homepage constitutes the basic configuration for a monitoring system. Access to the powerful meter-homepage via web browser No software installation necessary Real-time data, historical data etc. directly accessible via the meter home page Function extension via APPs possible Remote control of device display via homepage Password protection possible Fig.: IEC analysis with traffic-light principle Abb.: Power Quality Statusübersicht 190

191 Chapter 04 Energy-Portal 191


 Extremely cost-effective and convenient solution Lower data volume due to the push function APP Push Service 2.")

192 Chapter 04 Energy-Portal Energy-Portal The cloud solution for energy management Cloud solution especially designed for energy data Access from anywhere in the world via the PC or tablet under Evaluating and displaying energy data from the UMG measurement devices without requiring an IT infrastructure or expensive software The energy data can be pushed directly into the Energy-Portal from one location or from severeal locations. Measured values are captured at the same time from various locations Saves high acquisition and operating costs for software, database, server, commissioning and software maintenance Intuitive operation Data is extremely secure (HTTPS) Extremely cost-effective and convenient solution Lower data volume due to the push function APP Push Service 2.0 charateristics Up to 25 measured values per measuring device can be sent simultaneously After installing the APP and configuring the device s memory, the measured values that are to be sent can be selected on the measurement device homepage. Up to 50 measurement devices can be managed per account. Up to 25 measured values per measurement device can be sent simultaneously Mean values 10 minutes can be selected. Up to 100 dashboards are possible per account The APP Push Service 2.0 sends the measured data automatically to the hosting server in cycles. The APP Push Service 2.0 sends the measured data automatically to the com hosting server in cycles. The measured data can then be evaluated from anywhere in the world using any web browser. Transferring the last measured values from the UMG ring buffer The APP automatically detects which measured data in the UMG ring buffer is saved with which averaging time, and presents it for selection The measured values to be sent can be selected via the UMG measurement device s homepage Mean values are automatically synchronised to the device time The sending time can be adjusted for the transmission buffer (1 hour 100 days). If the communication connection fails, there are no gaps in the data as long as the failure is shorter than the transmission buffer time The transmission interval is adjustable (1 second 30 minutes) Status indicator on the homepage shows the last measured data transmitted Die Cloud-Lösung für ihr Energiemanagement 192
 Database storage capacities Data backup APP Push Service 2.")

 and the power value displayed using an analogue pointer display. Fig.")

193 Chapter 04 Energy-Portal What does the solution include? Server capacities, processing power (IaaS) Database storage capacities Data backup APP Push Service 2.0 to be installed on the UMG measurement devices Software as a service (SaaS): Provision of appropriate standardised visualisation software for energy consumption evaluation Quick and simple summarization of all energy data from different locations Fig.: Example of a dashboard with a line chart (load profile) and the power value displayed using an analogue pointer display. Fig.: Benchmark for the production sites with level displays. The limit values can be adjusted individually for each of the locations. Fig.: Heat map (spectral analysis) to determine peak loads that drive costs. The scroll bar in the chart s header area can be used to adjust the threshold values individually. Fig.: Dashboard example with two bar charts to compare el. energy values from the current day with the previous day or the current week with the previous week. 193
 Janitza Energy Portal (Software as a Service) hosting solution Creation of customer-specific dashboards Extension of data archiving duration from 3 to 5 years Transmits")
194 Chapter 04 Energy-Portal Description APP Push Service 2.0 *1 (per measuring device) Janitza Energy Portal (Software as a Service) hosting solution Creation of customer-specific dashboards Extension of data archiving duration from 3 to 5 years Transmits data (up to 25 measuring values from master device to Energy Portal via Port 80 (HTTP/Json) in adjustable time intervals. Additionally 12 more metered values are sent (current L1, L2, L3; PF L1, L2, L3; THD L1, L2, L3; apparent power total; active power total and active energy from up to 10 Slave devices). he averaging time is 15 minutes. The configuration is done on the website of the device. The counterpart station (SaaS = Software as Services) is not included inside scope of delivery. The APP is delivered encrypted. (Please provide the serial number) Applicable for master UMGs: 604-PRO / 605-PRO / 508 / 509-PRO / 511 / 512-PRO Applicable for slave: ProData2, UMG 96RM, UMG 96RM -E, UMG 103-CBM, MID energy meters Transmits data (up to 25 measuring values from master device to Energy Portal portal.com) via Port 80 (HTTP/Json) in adjustable time intervals. Additionally 128 measuring values are sent (current input 1..20, active power 1..20, reactive energy 1..20, voltage L1/N, L2/N, L3/N, frequency up to 2 slave devices UMG 20CM) The averaging time is 15 minutes. The configuration is done on the website of the device. The counterpart station (SaaS = Software as Services) is not included inside scope of delivery. The APP is delivered encrypted. (Please provide the serial number) Applicable for master UMGs: 604-PRO / 605-PRO / 508 / 509-PRO / 511 / 512-PRO Applicable for slave: UMG 20CM Analysis of energy data via the internet A Software-as-a-Service contract is concluded between the Contractor (Janitza electronics GmbH) and the Customer. The Energy Portal Software as a Service agreement can be requested by specifying document number Data archiving: 3 years (optionally 5 years, ) Price per year - up to 50 UMG measuring devices - up to 100 UMG measuring devices - up to 150 UMG measuring devices - up to 200 UMG measuring devices - up to 250 UMG measuring devices - up to 300 UMG measuring devices - from 300 UMG measuring devices Creation of customer-specific dashboards from the available display modules Linking of the display modules to the measurement variables The scope of delivery does not include the programming of new display modules The Contractor will verify in advance whether it is possible to present the DASHBOARD to the Customer s specifications Price per hour Extension of data archiving duration from 3 to 5 years Data more than 5 years old will be deleted automatically Item no xxx xxx xxx xxx xxx xxx * 1 The APP Push Service 2.0 is integrated in the firmware of the measuring device UMG 96RM-EL (unencrypted). 194

195 Chapter 04 OPC server OPC-SERVER 195


196 Chapter 04 OPC server OPC server Significance of OPC OPC stands for "OLE for Process Control" Standardised interface in the field of automation technology Benefits: Universal possibility of optimal communication between industrial bus systems and protocols User-friendly and simple integration of OPC drivers in control and monitoring systems of an arbitrary size The wide world of automation Integration of UMG measured values in UMG visualisation systems via OPC server OPC drivers therefore offer standardised interfaces for simple data exchange without precise knowledge of the communication possibilities of the "counterpart" Linking of measurement data with the data from other works as well as archiving of data in the database structures of the building management system OPC-drivers for building management systems are available from almost all manufacturers of building automation systems Modbus Suite TOP Server item no Janitza electronics GmbH recommends the proven OPCTop Server with Modbus Suite available to purchase from Toolbox ( Provision of support in conjunction with the UMG measurement devices by Janitza electronics GmbH is guaranteed in this case Fig.: OPC Quick Client Fig.: Stipulation of the OPC variables 196

197 Chapter 04 OPC server Functionality of the OPC server OPC is a software driver and must be installed on a PC in the network The installation is guaranteed if: - The operating system is compatible with the OPC - The available automation software exhibits sufficient performance reserves - This software operates seamlessly on the computer The OPC server also works on systems where GridVis is already installed (assuming appropriate system resources are available) The software driver contains a TCP/IP mode or Modbus over TCP/IP master and an OPC server Data is read out via the Ethernet interface (Port 502 or Port 8000) and forwarded on to an OPC server Transfer of the data to the OPC client of the external program Simultaneous access for up to 4 software applications on port 502 of the UMG 604E-PRO / UMG 604EP-PRO Simultaneous access for an additional 2 applications on downstream measurement devices (via RS485) Measurement data can thus be read out synchronously with the GridVis and the OPC server Configuration of the OPC server Adjustments are implemented via a convenient user interface Knowledge in the field of data types (Word, Float etc.) and Bus technology required Individual adaptation of the communications settings for each channel The following data types are supported: Char, Byte, Long, Float, Word, Double (as Big-Endian and Little-Endian) Rapid online checking of the data via OPC Quick Client Automatic adoption and display of the data from the configuration table Statistical functions provide support during fault-finding Fig.: Communications settings 197
198 Chapter 04 OPC server GridVis MS SQL / My SQL / Excel / etc. BMS / SCADA / HTTP GridVis - Energy Ethernet PLC UMG 604-PRO UMG 605-PRO UMG 96RM-E UMG 508 UMG 511 Fig.: Application example for an OPC environment 198

199 Chapter 04 Database server DATABASE SERVER 199
200 Chapter 04 Database server Database server Comprehensive monitoring and analyses require powerful server solutions Janitza electronics GmbH offers a powerful server as a complete solution Trouble-free and immediate use is guaranteed Simple and rapid integration of the pre-configured server into the existing network GridVis software is already installed on the database server Available databases: Janitza DB, MS SQL or MySQL Application of a powerful tower or rack server from Dell The Dell PowerEdge server offers high quality and reliability with maximum expandability A RAID-10 system with hot-plug hard drives guarantees a high standard of data security Fig.: Server (tower) Guaranteed all-round service Access to the database server thanks to Janitza maintenance diagnostics and fault rectification (only with authorisation) Rapid diagnostics and rectification of problems possible Highest level of security: Use of common remote maintenance solutions with three-stage encryption per industry standards Fig.: Server (rack) For larger projects we currently recommend the following configuration: Current Intel processor 16 GB RAM RAID controller RAID 10 with 4 hard drives, 1 TB capacity each DVD-ROM drive Windows 2008 Server with 5 CALs, 64 Bit (German or English version) Installation of GridVis software and the database driver for SQL servers MySQL / MS SQL databases should be provided by the client The integration of the server into the company's own network must be implemented by the customer's own administration 200
 for downstream RS485 devices.")

201 Chapter 04 Database server UMG 508 Current values (online values) Client server with GridVis Saving of historical measured values Historical data Database server with GridVis Fig.: The UMG 508, for example, currently has 6 communication ports. Of these, two are designed as gateways (port 8000) for downstream RS485 devices. Areas of application With extensive monitoring systems with a large number of measurement devices For applications that require a high degree of data security and maximum performance With companies whose systems must be scalable and expandable Application GridVis runs as a service on the server Log-in of a user not required for automatic data logging For measured value analysis the client computer accesses the server directly via the network Access to measurement data within the database by any number of client systems possible Display of online measurement values dependent of the number of ports per device, i.e. visualisation of historical data via the database, online measurement values available direct from the UMG device 201
 Item no. 15.06.")
 Note: GridVis software and database driver for SQL server MySQL / MS SQL databases should be provided by the customer The integration of the server into the company's")
202 Chapter 04 Database server Product overview Description Server (tower) Current Intel processor 16 GB RAM RAID controller RAID 10 with 4 hard drives, 1 TB capacity each DVD-ROM drive Incl. mouse and keyboard with german layout Windows 2012 Server with 5 CALs, 64 Bit (German or English version) Item no (Windows version, German) (Windows version, English) Note: GridVis software and database driver for SQL server MySQL / MS SQL databases should be provided by the customer The integration of the server into the company's own network must be implemented by the customer's own administration Warranty from Dell GmbH Fig.: Server (tower) Server (rack) Current Intel processor 16 GB RAM RAID controller RAID 10 with 4 hard drives, 1 TB capacity each DVD-ROM drive Windows 2012 Server with 5 CALs, 64 Bit (German or English version) (Windows version, German) (Windows version, English) Note: GridVis software and database driver for SQL server MySQL / MS SQL databases should be provided by the customer The integration of the server into the company's own network must be implemented by the customer's own administration Warranty from Dell GmbH Fig.: Server (rack) Setup package 1 for MS SQL Setup package 2 for My SQL Setup package 3 for JanDB Install hard drives Install operating system RAID configuration (RAID 10) Install updates Install MS SQL Server* Install GridVis Install hard drives Install operating system RAID configuration (RAID 10) Install updates Install MySQL Server* Install GridVis Install hard drives Install operating system RAID configuration (RAID 10) Install updates Install JanDB Install GridVis Install RTP user * The MS SQL or MySQL database should be provided by the customer. GridVis software and database drivers are separate items. The integration of the server into the company's own network must be implemented by the customer's own administration. Hardware warranty from Dell GmbH. 202
203 Chapter 04 Database server UMG 508 Master gateway Energy management and power quality monitoring Central GridVis database server Web interface Local and remote access Internet / intranet (IP architecture) RS485 / Modbus RTU UMG 96RM UMG 96RM UMG 96RM UMG 103-CBM UMG 103-CBM UMG 103-CBM Modbus slave devices are simply integrated via RS485 interface Fig.: Master-Slave communication architecture 203
204 Chapter 05 Industrial data communication 05 Industrial data communication Industrial data communication Page 206 Mobile communication modem EasyGateway EG400 GPS radio receiver Gateway MBUS-GEM PowerToStore UPS system with extension Industrial DIN rail Ethernet switch with 8 ports USB converter and repeater Industrial power supply for DIN rail mounting Isolating transformer for auxiliary supply Connector Touch panels user-friendly visualisation of measured values without PC, directly at site 204

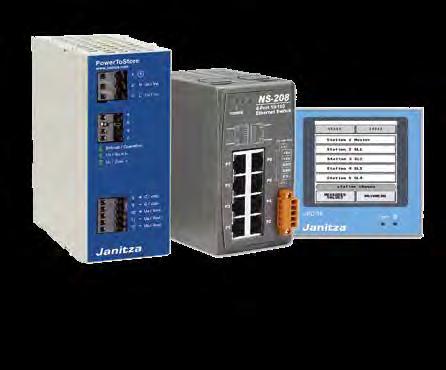

205 Chapter 05 Industrial data communication INDUSTRIAL DATA COMMUNICATION 205
206 Chapter 05 EasyGateway EG400 Mobile communication modem EasyGateway Data connection and simple commissioning Communication Gateway for wireless and hard-wired communication The EasyGateway EG400 connects the UMG measuring devices with Ethernet interface with the PC via mobile network The system software GridVis includes a driver, which enables the simple establishment of a connection with the measuring devices via the EG400 Connection of the EasyGateway to the measuring device Setting up the measuring device in GridVis and selection of the EasyGateway communication Activation of the connection via GridVis necessary Suitable for: UMG 604-PRO, UMG 605-PRO, UMG 96RM-E, UMG 508, UMG 509-PRO, UMG 511 und UMG 512-PRO Managed Service Connect-2-Control *1 Connect-2-Control (C2C) is a simple and secure managed solution Simple access to the measuring device (location-independent) is guaranteed via public IP networks (internet, mobile data networks, company networks) Certificate-protected security (SSL) SSL-encrypted from the PC to the Gateway No VPN tunnel required Managing static IP addresses Ethernet UMTS aartesys C2C Hub Secure connection Certificates C2C EasyGateway Mobile Network Ethernet Firewall Port 443 Port 443 Internet Desktop application GridVis Fig.: Secure SSL-encrypted measurement data transfer *1 The connect-2-control service for the administration of the local, static IP addresses of our Janitza devices as well as the startup is offered by aartesys. The relevant application form is included to the shipment of the EasyGateway or can be downloaded under 206
207 Chapter 05 EasyGateway EG400 Technical data Communication Gateway for wireless and hard-wired communication Item number Supply voltage Frequency Interfaces Ethernet 10 / 100 Base-TX Communication UMTS / HSPA6+ Integrated security module for secure, certificate-protected communication V AC (integrated power supply) Hz RJ45 (for hard-wired communication) yes (for fast internet connection via mobile network) yes General data Operating system Embedded LINUX Processor ARM 9 Cycle rate 400 MHz Memory (RAM) 256 MB Memory (Flash) 256 MB Hardware Watchdog and temperature monitoring Screw-on antenna or external antenna yes via SMA antenna connector SIM card slot Power supply Mechanical data Installation Integrated wall fastening Housing Protection class LED indications integrated standard AC Weight 280 g Dimensions in mm (H x W x D) 63 x 106 x mm DIN top-hat rail yes closed 3-part plastic housing IP20 4 units (2-colour for commissioning and operating display) Accessories Item number AMR rubber antenna, 2 m cable Extension cable, 5 m Extension cable, 10 m Angled antenna INOX antenna mounting bracket

208 Chapter 05 GPS radio receiver GPS radio receiver Main features Works worldwide Receive and process the GPS time signal (GMT) For time synchronisation of the measuring devices UMG 604-PRO *1, UMG 605-PRO *1, UMG 508 *1, UMG 509-PRO *1, UMG 511 und UMG 512-PRO 1 digital connection controls up to four UMGs Wall mounted Small, compact construction Easy to install, housing screws into mounting bracket Check LED on the housing Connection using three-wire shielded cable Connection voltage V / DC External power supply necessary Dimension diagrams 208
209 Chapter 05 GPS radio receiver Technical data Technical data Item number Synchronization accuracy with the UMG 512-PRO 20 ms (compared to the UTC time) Synchronization accuracy with the UMG 604-PRO, UMG 605-PRO, UMG 508, UMG 509-PRO and 1 s (compared to the UTC time) UMG 511 *1 Connection voltage V / DC Supply = External Power consumption Ø up to 100 ma GPS time synchronous pulse signal Output signal Adjustable via DIP switches Pulse for minutes (1 sec.) and/or hours (5 sec.) Imax 50 ma Protection class IP 54 acc. to DIN EN Ambient temperature -30 C to 55 C Regulations / Test marks EN / CE Housing Self-extinguishing thermoplastic Installation type Wall mounted with mounting bracket Recommended cable(s) Shielded/cable section 0.33 to 2.5 mm 2 *1 Please note: For the measuring devices UMG 604-PRO, UMG 605-PRO, UMG 508, UMG 509-PRO and UMG 511 the APP GPS TIMESYNC ( ) is needed DC FU V ŌUTPUT + Typical connection GPS DI V GND OUTPUT UMG 512 Dig.-INPUT UMG 512 Dig.-INPUT UMG 512 Dig.-INPUT UMG 512 Dig.-INPUT V GND 209

210 Chapter 05 Gateway MBUS-GEM Gateway MBUS-GEM M-Bus Gateway on Modbus TCP Communication interface for the integration of consumer meters in GridVis. Connection at control level Standard per IEC6115 Supply voltage: 24 V DC +/- 5%, screw-type terminal M-Bus per EN , screw-type terminal Ethernet 100 MBit, RJ45 socket, screened High-performance driver for the connection of up to 80 standard loads Highly compact design (W x H x D in mm) 35 x 89 x 58 Spatial requirements 2TE wide for mounting on DIN rail 35 mm Galvanic separation from the M-Bus and RJ45 Suited for use in industrial areas Commissioning by Janitza is recommended. For more detailed information please refer to chapter 9. Technical data MBUS-GEM Gateway Item number Architecture Controller-based gateway Supply 24 V DC, < 300 ma, max. 2.5 mm 2 M-Bus connections Screw-type terminal, max. 2.5 mm 2 Ethernet connection 100 MBit, RJ45, screened Dimensions Assembly Max. Baud rate Number of slaves IP address TCP port 35 x 89 x 58 (W x H x D in mm) DIN mounting rail 35 mm, IP40 300, 2400 or 9600 bps max. 80 standard loads freely configurable or by DHCP freely configurable 210

211 Chapter 05 PowerToStore buffer power supply PowerToStore Buffer power supply with capacitors Typically serves to bridge short term interruptions Operates with integrated ultra-capacitors for energy storage With a supply voltage interruption, the stored energy of the ultracapacitors is released on a regulated basis A buffer module feeds the load up to full discharge The buffer time is dependent on the charge status of the capacitor and the height of the discharge current Can be used only with 24-V UMG devices Main features Lifelong maintenance-free Compact housing Deep-discharge proof consequently unlimited storage time Operation possible under extreme temperature conditions No gas generation, therefore installation in hermetically-sealed housings possible Rapid availability because short charging time after discharging Technical data PowerToStore (PTS) Item number Input Nominal input voltage V AC Stored energy in Ws 1,000 Output Output voltage in buffer operation 24 V DC constant Nominal output current 3 A Current limiting x INom Degree of efficiency Ua = 23.5 V DC, Ia = INom > 90 % General data Connection type input U E 2.5 mm² cable cross section Connection type output U A 2.5 mm² cable cross section Connection type I/Os 1 mm² cable cross section Protection class IP20 Type PTS2403 Storage temperature C Ambient temperature C Weight 1.2 kg Dimensions in mm (H x W x D) 153 x 72 x 130 Note: The power quality analysers UMG 604-PRO / UMG 605-PRO / UMG 96RM are supplied during short term interruptions of up to 225 sec. by the buffer device (item no ). With the power quality analysers UMG 508 / UMG 509-PRO / UMG 511 / UMG 512-PRO, the expansion unit (item no ) is additionally required. With this configuration short term interruptions lasting up to 256 sec can be bridged. 211

212 Chapter 05 Ethernet switch Industrial DIN rail Ethernet switch NS-208 Main features Ethernet switch for DINI rail installation in a plastic housing In order to connect Ethernet UMG devices in the distribution panel Speed: 8 x 10/100 Mbps Ethernet ports Screened RJ-45 connections Automatic setting of the transfer rate Compatible with IEEE 802.3, 802.3u and 802.3x Temperature range from -40 to +75 C Ideally suited for use in industrial areas Technical data Industrial DIN rail Ethernet switch NS-208 Item number Switch 8 x RJ45, 10 / 100 MBit/s Bandwidth 2.0 Gbps ESD protection 8 kv direct contact 15 kv discharge air gap Network cable 10/100 Base-T (Cat 5 UTP cable; max. 100 m) Supply voltage 10 to 30 V DC (mains adapter required separately) Current consumption approx A with 24 V DC; ±5 % Installation DIN rail Housing robust plastic housing Operating temperature range C Storage temperature C Humidity % (non-dewing) Weight 300 g Dimensions in mm (H x W x D) approx. 118 x 64 x
 Axial design with two cable feeds Bus system: PROFIBUS DP up to 12 MBit/s Termination resistor can be switched in via Dip switch Pin assignment: 3, 5, 6, 8 Screw-type terminal")
 Technical data D-SUB bus connector Item number 13.10.539 Item number 13.10.543* Nominal voltage 50 V Rated current 100 ma Termination resistor 390 Ω 220 Ω 390 Ω (can be switched in) Bus system PROFIBUS DP Max.")
213 Chapter 05 Connector D-SUB bus connector Main features For RS485 (Modbus and Profibus) with the measurement devices UMG 508 and UMG 511 D-sub connector, 9-pole With termination (switch on/off termination resistors) Axial design with two cable feeds Bus system: PROFIBUS DP up to 12 MBit/s Termination resistor can be switched in via Dip switch Pin assignment: 3, 5, 6, 8 Screw-type terminal connection With UMG 508 / UMG 511 also for Modbus required Fig.: SUBCON-PLUS-PROFIB/AX/SC (item no ) Technical data D-SUB bus connector Item number Item number * Nominal voltage 50 V Rated current 100 ma Termination resistor 390 Ω 220 Ω 390 Ω (can be switched in) Bus system PROFIBUS DP Max. number of plugin cycles > 200 Connection D-SUB plug-in connection Number of poles 9 Connection Print connection Connection type Screw terminal Cable diameter max. 8.4 mm Cable diameter min. 7.6 mm Operating temperature range C Storage / transport temperature range C Weight 38.6 g Dimensions in mm (H x W x D) 17 x 31.5 x 58.2 Housing material ABS, metallized Pin assignment: 3, 5, 6, 8 Fig.: SUBCON-PLUS-PROFIB/SC2, 90 bent version (item no ) * 90 bent version 213
214 Chapter 05 RS485 repeater K-7510: RS485 repeater, isolated Main features One RS485 input and output respectively for the expansion of an RS485 network by a further 32 UMG devices and by a further 1.2 km transfer length Twin and four-wire operation RS485 Galvanic separation up to 3 kv DC Automatic direction detection Automatic Baud rate detection Insulated interface Suitable for: UMG 103-CBM, UMG 104, UMG 604-PRO, UMG 605-PRO, UMG 96RM, Prophi, ProData Separate power supply required Fig.: Figure similar Technical data RS485 repeater, isolated Item number RS485 network expansion by a max. length of 1.2 km and by 32 modules Support up to 256 RS485 devices Max. number of repeaters per network 8 Insulation up to 3,000 V DC Power consumption 1.2 W Interface connections with screw-type terminals Installation DIN rail or wall mounting Operating temperature range C Weight 157 g Dimensions in mm (H x W x D) 121 x 72 x 25 Note: Repeater is not suitable for Profibus. 214

215 Chapter 05 RS485 Hub K-7513: RS485 to 3 x RS485 Hub Main features 1 x RS485 input and 3 x RS485 output for a RS485 star type network Galvanic separation up to 3 kv DC DIN rail or wall mounting Suitable for: UMG 103-CBM, UMG 104, UMG 604-PRO, UMG 605-PRO, UMG 96RM, Prophi, ProData Separate power supply required Technical data Fig.: Figure similar RS485 to 3 x RS485 Hub Item number Input 1 x RS485, twin wire (D+, D-) Output 3 x RS485, twin wire (D+, D-) Transmission rate 300 to kbps Insulation up to 3000 V DC Supply voltage 10 to 30 V DC Power consumption 2.2 W Connections detachable screw-type terminals Installation DIN rail or wall mounting Operating temperature range C Weight 157 g Dimensions in mm (H x W x D) 121 x 72 x 33 Miscellaneous each I/O interface is equipped with its own line driver, max. 1.2 km line length per interface 215
216 Chapter 05 USB RS485 Hub K-7563: USB to 3 x RS485 Hub Main features USB converter to 3 times RS485 For star type RS485 network Galvanic separation up to 3 kv DC DIN rail or wall mounting Operating systems Windows XP, Windows 7 Suitable for: UMG 103-CBM, UMG 104, UMG 604-PRO, UMG 605-PRO, UMG 96RM, Prophi, ProData Use of system software GridVis possible Technical data Fig.: Figure similar USB to 3 x RS485 Hub Item number Input USB 1.1 and USB 2.0 compatible Output 3 x RS485, twin wire (D+, D-) Transmission rate 300 to kbps Insulation up to 3,000 V DC Supply voltage 10 to 30 V DC Power consumption 2.2 W Connections detachable screw-type terminals Installation DIN rail or wall mounting Operating temperature range C Weight approx. 120 g Dimensions in mm (H x W x D) 120 x 72 x 33 In the scope of supply USB connection cable Miscellaneous each I/O interface is equipped with its own line driver, max. 1.2 km line length per interface 216
217 Chapter 05 1-phase SMPS type power supply 1-phase SMPS type power supply Main features Nominal power: 24 W Output voltage: 24 V DC +/- 1 % Wide range input voltage: 115 V AC to 230 V AC Certification: CSA and culus approval Technical data 1-phase SMPS type power supply Item number Input Frequency input 50 / 60 Hz Voltage input V AC, V DC Current input at 115 V AC 460 ma ± 20 % Current input at 250 V DC 120 ma ± 20 % Input fuse 2 A slow blow fuse (internal) Output Power output 24 W Voltage output 24 V DC ± 1 % Current output 1 A Parallel operation possible yes, max. 2 Overload protection overcurrent / thermal switch-off General information Galvanic separation output ground 0.5 kv Galvanic separation input output 3 kv Connection screw-type terminal Installation horizontal, DIN rail Operating temperature range C Weight 169 g Dimensions in mm (H x W x D) 90.5 x 52 x

218 Chapter 05 Industrial power supply Industrial power supply TCL for DIN rail mounting Main features For applications in industrial, office and residential areas Ultra-compact plastic housing Pluggable screw-type terminal block DIN rail mounting Adapter for wall mounting Universal mains input V AC, 50/60 Hz Output voltage 24 V DC DC-OK signal Low residual ripple Overload and short circuit protection Parallel operation possible Worldwide safety approvals: CB-Report (IEC ), UL approval, CSA certificates, BG certificates (SIQ) Technical data Industrial power supply TCL for DIN rail mounting Item number Input Frequency Hz Voltage V AC, V DC Current at full load (115 V AC) 2 A Current at full load (230 V DC) 1 A Fuse 5 A (characteristic C or slow blow fuse) Output Power 120 W Voltage (adjustable via potentiometer on the front side) V DC Current 5 A Parallel operation possible yes, max. 5 Overvoltage protection (trigger point at) < 40 V DC DC-OK signal switching point: > 22 V output signal (reference: Uoff): 22.0 V ±2.0 V / 30 ma max. General information Switching frequency khz depending on the load (pulse frequency modulation) Protection class 1 Degree of protection IP20 Installation DIN rail 35 mm or wall mounting (adapter enclosed) Operating temperature range C Storage temperature range C Weight 440 g Dimensions in mm (H x W x D) 75 x 85 x

219 Chapter 05 Isolating transformer Isolating transformer for auxiliary supply Main features For protecting UMG meters in case of heavily distorted supply voltages Exceptional good temperature changing behaviour Maximum safety and longevity High voltage tolerance Self-extinguishing plastic materials Individually tested with test certificate Technical data Isolating transformer for auxiliary supply Item number Input Frequency input 50/60 HZ Voltage input 230 V (1 3 terminals) Current input 0.05 A Input fuse 2 A Output Power output 10 VA Voltage output 185 V (4 5 terminals) Current output 0.06 A General information Protection class 2 Protection class IP20 Installation DIN rail Operating temperature range C Weight 470 g Dimensions in mm (H x W x D) approx. 82 x 58 x

220 Chapter 05 Touch panels Touch panels user-friendly visualisation of measured values without PC, directly at site Effective, sustainable observation and operation Visualisation of process and energy data at site Embedded systems in form of touch panels serve the monitoring of electrical data JPC35 is equipped with an RS485 or RS232 interface Use of compact flash memory cards Due to use of special processors and cooling elements cooling fans could be avoided Dust, dirt and moisture are not a problem thanks to high front side protection class Standard application available for the visualisation of up to 32 measurement points *1 (Multi Touch) JPC35 "Multi Touch" Equipped with a 3.5" touch panel Alignment and configuration possible for various applications Presentation of measurement values up to 32 measurement devices *1 on one display User-friendly, intuitive configuration and menu guidance Clear assignment of the measured values through specific naming of each measurement point Display mode is variable and can be configured directly on the display UMG 604-PRO or UMG 605-PRO can be connected as the master RS232 interface serves the communication between master and JPC35 JPC35 "Multi Touch" requires the free APP (expansion) "Multi Touch" (item no ) on the UMG measurement device The JPC "MultiTouch" visualises the following measured values for one master and up to 31 slave devices: Measured values Display range Unit Voltage: L1, L2, L3 / L1 L2, L2 L3,L1 L V V Current: L1, L2, L3, current in N A A Active power: L1, L2, L3, sum kw kw Apparent power: Sum kva kva Reactive power: Sum kvar kvar Cosphi: L1, L2, L3, sum 0.00 cap 0.00 ind - THD: UL1, UL2, UL % % Frequency Hz Hz Rotating field left / right - Current averaging A with overline Active Active energy sum kwh kwh Reactive energy inductive sum kvarh kvarh Measurement points text input max. 15 characters - * 1 slave devices and one master device 220


221 Chapter 05 Touch panels JPC35 remote display Equipped with a 3.5" touch panel Can be used for measured value indication of a measurement point The measurement point name is freely configurable Switching between measured value list and measured value indication possible within the display mode Connection and communication takes place via an RS232 or RS485 interface No expansion (APP) is required for the application on the measurement device Info: The measurement device address of the JPC35 remote display RS485 is always established at 1. Application example JPC
222 Chapter 05 Touch panels Efficient variant diversity of the JPC35 JPC35 "MultiTouch" Box, item no Requisite components JPC35 (item no ) 1 master (UMG 604 / UMG 605) 0 to 31 slave(s) (UMG 103-CBM, UMG 104, MG 604-PRO, UMG 605-PRO and UMG 96RM) 1 mains adapter 24 V (e.g. item no ) APP "MultiTouch" (item no ) Information UMG 604-PRO RS232 RS485 Connection via RS232 (max. 15 metre distance to the master) APP "MultiTouch" must be installed on the UMG 604 / UMG 605 The display mode can be configured directly via the display Number of measurement points can be configured directly via the display Measurement point names (max. 15 characters) are configured directly via the display Language selection (German, English, Spanish) Communication monitoring of the slave devices Configuration assistant UMG 96RM UMG 103-CBM Fig.: Modbus station selection RS232 UMG 605-PRO Display of measured value / Modbus Real value display of the following values: UL1, UL2, UL3, ULL1, ULL2, ULL3, I1, I2, I3, ISUM, P1, P2, P3, PSUM, SSUM, QSUM, Cosphi1, Cosphi2, Cosphi3, CosphiSum, THDU1, THDU2, THDU3, Hz, rotation field, AVG_I1, AVG_I2, AVG_I3, KWH, kvarh Mode setting: Standard, station selection, security measurement, energy list UMG 604-PRO Fig.: Modbus standard JPC35 Remote Display Box (RS232), item no Requisite components JPC35 (item no ) UMG 604-PRO, UMG 605-PRO, UMG mains adapter 24 V (e.g. item no ) Information RS232 Remote display via RS232 (max. 15 metre distance) No device APP installation required Measurement point names (max. 15 characters) Language selection (German, English, Spanish) Configuration assistant Display (Measured value / Modbus) Real value display of the following values: UL1, UL2, UL3, ULL1, ULL2, ULL3, I1, I2, I3, ISUM, P1, P2, P3, PSUM, SSUM, QSUM, Cosphi1, Cosphi2, Cosphi3, CosphiSum, THDU1, THDU2, THDU3, Hz, rotation field, AVG_I1, AVG_I2, AVG_I3, KWH, kvarh Modbus selection: Device matrix display, measured value list UMG 604-PRO Note: Not usable for the UMG 96RM, UMG 508 and UMG 511, because these devices do not possess an RS232 interface. JPC35 Remote Display Box (RS485), item no Requisite components JPC35 (item no ) UMG 604-PRO, UMG 605-PRO, UMG 104, UMG 509-PRO, UMG 511, UMG 512-PRO, UMG 96RM 1 mains adapter 24 V (e.g. item no ) Side angled D-SUB-9 connector (item no ) Information Remote display via RS485 (max. 1,200 metre distance) No device APP installation required Measurement point names (max. 15 characters) Language selection (German, English, Spanish) Configuration assistant Display (Measured value / Modbus) UMG 604-PRO RS485 Real value display of the following values: UL1, UL2, UL3, ULL1, ULL2, ULL3, I1, I2, I3, ISUM, P1, P2, P3, PSUM, SSUM, QSUM, Cosphi1, Cosphi2, Cosphi3, CosphiSum, THDU1, THDU2, THDU3, Hz, rotation field, AVG_I1, AVG_I2, AVG_I3, KWH, kvarh Modbus selection: Device matrix display, measured value list Note: The JPC35 functions in this variant as RS485 master. The RS485 / Ethernet Gateway function of the UMG 604-PRO can no longer be used in this case. 222
223 Chapter 05 Touch panels Overview of devices Types JPC35 "MultiTouch" JPC35 remote display RS232 JPC35 remote display RS485 Item number Front panel Resolution (Pixel) 240 x x x 240 Brightness (cd/m 2 ) Number of colours 16 greyscale 16 greyscale 16 greyscale Input resistive touch resistive touch resistive touch Screen diagonal 3.5" 3.5" 3.5" General technical data Supply voltage (external) 24 V DC ± 15 % 24 V DC ± 15 % 24 V DC ± 15 % Weight 0.21 kg 0.21 kg 0.21 kg Operating temperature range C C C Storage temperature range C C C External dimensions in mm (H x W x D) 96 x 96 x x 96 x x 96 x 40.6 Installation dimensions in mm (H x W) 89.3 x x x 89.3 Protection class front IP65 IP65 IP65 CPU Processor (MHz) 32 Bit RISC 32 Bit RISC 32 Bit RISC Communication Interfaces RS485 no no yes RS232 yes yes no Protocols Modbus RTU yes yes yes Applications (optional) Visualisation of measured values of the slave devices possible yes no no Expansion required (APP) yes no no 223
224 Chapter 06 Current / voltage transformers and sensors 06 Current / voltage transformers and sensors Current transformers Moulded case current transformer, class 1 / 5 A Moulded case current transformer, class 0.5 / 5 A Moulded case current transformer, class 0.2S / 5 A Calibratable moulded case current transformer, class 0,5... / 5 A Summation current transformer, class 1 and 0.5 for moulded case (feed through type) and split core type CTs Summation current transformer, class 1 for cable type (KUW) split core current transformers Cable type split core current transformers DIN rail current transformer with voltage tap and fuse Compact current transformer CT27 Class 1 Flexible current transformer Residual current transformer for RCM Monitoring Differential current transformer, KBU series, split core, rectangular shape Differential current transformer, CT-AC series Feedthrough residual current transformer, JZ series, round shape Feedthrough current transformer up to 63 A, class 1, CT20 Split-core current transformer, series SC-CT-20 and SC-CT-21 6-fold DIN rail current transformer CT-6-20 for UMG 20CM Split core operating current transformer up to 600 A for UMG 20CM Accessories Voltage transformer Voltage tap with and without integrated fuse Current transformer terminal block with short-circuiting, measurement and calibration possibility Humidity and temperature sensor JFTF-I Page 225 Page 249 Page


225 Chapter 06 Current / voltage transformers and sensors CURRENT / VOLTAGE TRANSFORMERS AND SENSORS 225

226 Chapter 06 Overview Current transformer overview Moulded case current transformer (feedthrough type) class 1 and 0,5... / 5 A*1 Calibratable moulded case current transformer class 0,5... / 5 A Type IPA 40 IPA A A A A615.3 EIPA30.5 E6A315.3 E7A412.3 E9A615.3 Round conductor in mm Primary bus bar in mm 40 x x x x x x x x x x 12 2 x 30 x x 12 2 x 40 x x 15 2 x 50 x 10 30,5 x 10,5 25,5 x 25,5 10,5 x 30,5 33 x x x 33 Primary current 50 in A Details: Page ,5 x x x 40,5 64 x x x x x 64 = 1 A = 5 A *1 Other variants on request 226
227 Chapter 06 Overview Calibratable moulded case current transformer class 0,5... / 5 A Calibratable moulded case current transformer class 0,2S / 0,5S... / 5 A E13A ERM60-E2A ERM60-E3A ERM60-E3A ERM60-E3A ERM70-E4A ERM70-E4A ERM70-E4A ERM70-E4B ERM70-E4B ERM85-E6A 85 22,7 24,5 24,5 24,5 30,5 30,5 30,5 30,5 30,5 30,6 101 x x x x x x x x x x x x x = 1 A = 5 A *1 Other variants on request 227

228 Chapter 06 Overview Current transformer overview Summation current transformer *1 for cable type split core current transformers Type STS20 STS30 STS40 STS50 STS60 STS21 STS31 STS41 STS51 STS61 Transformation ratio Primary in A 1 5 Details: Page Customerspecific Customerspecific Customerspecific Customerspecific Customerspecific Summation current transformer for moulded case feedthrough and split core current transformers Type IPS20 IPS30 IPS40 IPS21 IPS31 IPS41 Transformation ratio Primary in A 1 5 Details: Page Customerspecific Customerspecific Customerspecific DIN rail current transformer Current transformer... / 1 A Three-phase CTs Cable type split core current transformers (to be used with isolated cables) Type 35 / 1 A 64 / 1 A CT27-35 CT27-64 ASRD 14 KUW 1 / 30 KUW 1 / 40 KUW 2 / 40 KUW 4 / 60 KUW 4.2 / 60 Round conductor in mm x Primary bus bar in mm x x 85 Primary current 35 in A Details: Page KBU 58 KBU 812 = 1 A = 5 A *1 Other variants on request 228

229 Chapter 06 Current transformers CURRENT TRANSFORMERS 229

230 Chapter 06 Moulded case current transformer Moulded case CT, class 1 and 0.5 / 5 A Increased reliability Both halves of the housing overlap rather than butting up against one another Break-proof plastic housing made from polyamide Non-combustible per UL 94 VO and self-extinguishing Protective caps for primary bus bar fastening screws Fixing screws pins for the primary rail can be insulated by means of protective caps, available as an option Safeguard to prevent accidental contact Secondary connections Feeding of the secondary connections to the connection terminals through the rectangular opening in the front and rear sides Secondary connection by means of cable lugs through the side slots Expanded secondary terminal covering In addition to the normal terminal covering, extra protective hoods are available Locking of the front and rear feed to the secondary terminals Dimension diagrams All dimensions provided in mm IPA40 IPA40.5 6A A A A
231 Chapter 06 Moulded case current transformer General mechanical properties Nominal frequency Hz Insulation class E (other classes on request) Thermal rated short-term current Ith = 60 x IN/1s Rated surge current Idyn = 2.5 x Ith, min., however 100 ka Highest voltage for operating equipment Um = 0.72 kv Rated insulation level (test voltage) 4 kv / 1 min (per EN ) Over-current limit factor FS5 or FS10 Harmonics currents up to 50th harmonic Technical data Device overview, moulded case current transformer, class 1 / 5 A Secondary current* Type Primary current in A Power in VA Primary conductor (bus bars) Round conductor in mm Width in mm Weight (kg) Item no. IPA x 10; 30 x 15; 25 x A x 15 ; 20 x A x 15; 20 x A x 15, 20 x A x 15; 20 x A x 15; 20 x A x 15; 20 x A x 15; 20 x A x 15; 20 x A x 12; 2 x 30 x A , x 12; 2 x 30 x A , x 12; 2 x 40 x A , x 12; 2 x 40 x A , x 15; 2 x 50 x A , x 15; 2 x 50 x A , x 15; 2 x 50 x A , x 15; 2 x 50 x Device overview, moulded case current transformer, class 0.5 / 5 A Secondary current* Type Primary current in A Power in VA Primary conductor (bus bars) Round conductor in mm Width in mm Weight (kg) Item no. IPA x 10; 30 x 15; 25 x IPA x 10; 30 x 15; 25 x IPA x 15 ; 20 x IPA x 15; 20 x A x 15, 20 x A x 15; 20 x A x 15; 20 x A x 15; 20 x A x 15; 20 x A x 15; 20 x A x 12; 2 x 30 x A , x 12; 2 x 30 x A , x 12; 2 x 40 x A , x 15; 2 x 50 x A , x 15; 2 x 50 x A , x 15; 2 x 50 x A , x 15; 2 x 50 x Accessories Mounting clip for DIN rail EN , suitable for 9A615.3, IPA40 style, 1 pair Mounting clip for DIN rail EN , suitable for 6A315.3, 7A412.3, 8A512.3 and 9A615.3 style, 1 pair Mounting clip for DIN rail EN , suitable for IPA40.5 style, 1 pair * Secondary current transformer / 1 A as well as other types on request. Basic Information for the use of current transformer can be found in chapter
232 Chapter 06 Calibratable moulded case current transformer Moulded case current transformer for billing purposes class 0.5 / 5 A Increased safety Both halves of the housing overlap rather than butting up against one another Burst-resistant plastic housing made from polyamide Non-combustible per UL 94 VO and self-extinguishing Protective caps for primary rail fastening screws Screw-in pins for the primary rail terminals can be insulated by means of protective caps, available as an option Safeguard to prevent accidental contact Secondary connection feed Feeding of the secondary connection to the connection terminals through the rectangular opening in the front and rear sides During installation, e.g. behind the safety strip, the secondary connection is implemented by means of cable lugs through the side slots Expanded secondary terminal covering In addition to the normal terminal covering, extra protective hoods are available Locking of the front and rear feed to the secondary terminals Dimension diagrams All dimensions in mm EIPA30.5 E6A315.3 E7A ,5 10,5x30,5 25,5x25,5 30,5x10,5 E9A615.3 E13A x64 32x54 42x x40,5 31x31 40,5x x64 32x54 42x x81 84x64 101x31 232
233 Chapter 06 Calibratable moulded case current transformer General mechanical properties Nominal frequency Hz Insulation class E (other classes on request) Thermal rated short-term current Ith = 60 x IN/1s Rated surge current Idyn = 2.5 x Ith, however min. 100 ka with all plug-in current transformers Highest voltage for operating equipment Um = 0.72 kv Rated insulation level (test voltage) 4 kv / 1 min (per EN ) Over-current limit factor FS5 or FS10 Harmonics current up to 50th harmonic Technical Data Device overview, calibratable plug-in current transformer, class 0.5 / 5 A Secondary current* Type Primary current in A Power in VA Primary conductor (bus bars) Round conductor in mm Width in mm Weight (kg) Item no. EIPA x 10.5; 25.5 x 25.5; x 30.5 EIPA x 10.5; 25.5 x 25.5; x 30.5 EIPA x 10.5; 25.5 x 25.5; x 30.5 E6A x 16; 23 x 23, 16 x E6A x 16; 23 x 23, 16 x E6A x 16; 23 x 23, 16 x E6A x 16; 23 x 23, 16 x E6A x 16; 23 x 23, 16 x E6A x 16; 23 x 23, 16 x E7A x 13; 31 x 31, 13 x E7A x 13; 31 x 31, 13 x E9A x 16; 54 x 32; 42 x 42; x 54; 16 x 64 E13A x 31; 84 x 64; 54 x E13A x 31; 84 x 64; 54 x E13A x 31; 84 x 64; 54 x Description Item no. Conformity declaration with corrigendum * These transformers are not on stock and will be ordered to customer order, products are excluded from return. Transformers with other primary or secondary currents on request. Basic Information for the use of current transformer can be found in chapter

234 Chapter 06 Calibratable moulded case current transformer Moulded case current transformer for billing purposes Class 0,2S / 0,5S Billing current transformer The current transformer for billing with a constantly sufficient load. In short, with which the valid regulations for kwh measurement devices are fulfilled. Each current transformer is individually measured and the test reports can be called up online. Flexibility, the compact design and safety are unique selling features of the line. All transformers are equipped with an integrated lockable terminal cover, produced from polycarbonate. The current transformers are supplied with a fastening tool, for mounting on rails, cables or assembly plates. The transformers can be optionally ordered with clips, which enable mounting on a DIN rail. Dimension diagrams All dimensions in mm ERM60-E2A ERM60-E3A ERM70-E4A ERM85-E6A ,2 23, Ø 22, , ,5 11,7 13, Ø 24,5 89 Ø 30,5 6,5 6,5 6,5 H+ 18 H H+ 18 H H+ 18 H Type A B C 13,8 17,8 10,6 15,6 16,6 110 Ø 30,6 6,5 H+ 24 H 15,5 20, ,5 25,5 30, ,6 40, ,7 38,2 37, ,6 60,
235 Chapter 06 Calibratable moulded case current transformer General properties Nominal frequency Hz Insulation class E Thermal rated short-term current I th = 60 x I N /1s Thermal continuous current 1.2 x I N Rated surge current I dyn = 2.5 x I th, however min. 100 ka with all plug-in current transformers Highest voltage for operating equipment U m = 0.72 kv Rated insulation level (test voltage) 3 kv / 1 min (per IEC ) Over-current limit factor FS5 with max. power or FS10 with min. power Harmonics current up to 50th harmonic Test report available Temperature range -25 to 55 C Other current transformer requirements on request Technical data Device overview calibratable moulded case current transformer, class 0,2S / 0,5S Type Primary current in A Class Power in VA Transformation ratio Primary conductor Round conductor in mm Width in mm Weight (kg) Item no. ERM60-E3A S 1 VA 150/5 A 30 x 10 24,5 60 0, ERM60-E3A S 2 VA 200/5 A 30 x 10 24,5 60 0, ERM60-E3A S 2,5 VA 250/5 A 30 x 10 24,5 60 0, ERM70-E4A S 2,5 VA 300/5 A 40 x 10 30,5 70 0, ERM70-E4A S 5 VA 400/5 A 40 x 10 30,5 70 0, ERM70-E4A S 5 VA 500/5 A 40 x 10 30,5 70 0, ERM70-E4B S 5 VA 600/5 A 40 x 10 30,5 70 0, ERM70-E4B S 5 VA 750/5 A 40 x 10 30,5 70 0, ERM85-E6A S 5 VA 1000/5 A 60 x 10 30,6 85 0, These transformers are not on stock and will be ordered to customer order, products are excluded from return. Basic Information for the use of current transformer can be found in chapter
236 Chapter 06 Summation current transformer Summation current transformer, class 1 and 0.5 for feedthrough and split core Potential-free measurement Summation of the secondary currents from multiple main CTs Thus measuring of multiple feeders by just one meter Standardised measurement signal available at the output Alongside the addition of the input currents, the total is also divided by the number of inputs Distinction for similar and dissimilar main transformers General mechanical properties Break-proof plastic housing made from ABS, IP40 Non-combustible per UL 94 VO, self-extinguishing Nickel-plated terminals with Plus-Minus screws Integrated electric shock protection, IP10 Nominal frequency Hz Insulation class E (other classes on request) Thermal rated short-term current Ith = 60 x IN/1s Rated surge current Idyn = 2.5 x IN Maximum operating voltage Um = 0.72 kv * 1 Rated insulation level (test voltage) 3 kv / 1 min* 1 Over-current limit factor FS5 or FS10 Maximum conductor cross-section: 2.5 Ø solid, 1.5 Ø flexible Dimension diagrams All dimensions in mm Technical data Summation current transformer, class 1 Type Primary current in A Secondary current in A Power in VA Transformation ratio Dimensions in mm (H x W x D) Weight (kg) Item no. IPS :1 115 x 45 x IPS :1:1 115 x 45 x IPS :1:1:1 115 x 45 x IPS :1 115 x 45 x IPS :1:1 115 x 45 x IPS :1:1:1 115 x 45 x IPS as required 115 x 45 x 73 0, IPS as required 115 x 45 x 73 0, IPS as required 115 x 45 x 73 0, Summation current transformer, class 0.5 Type Primary current in A Secondary current in A Power in VA Transformation ratio Dimensions in mm (H x W x D) Weight (kg) Item no. IPS :1 115 x 45 x IPS :1:1 115 x 45 x IPS :1:1:1 115 x 45 x Not useable in combination with cable split core. * 1 Other currents on request. 236

237 Chapter 06 Summation current transformer Summation current transformer, class 1 for cable type split core current transformers No-compromise, individual measurement High measurement accuracy User friendly spring-clamp technology Designed for use with the series KUW split core CTs Technical data Summation current transformer, class 1 Type Primary current in A Secondary current in A Power in VA Transformer ratio Dimensions in mm (H x W x D) Weight (kg) Item no. STS :1 80 x 30 x STS :1:1 80 x 30 x STS :1:1:1 80 x 55 x STS :1:1:1:1 80 x 55 x STS :1:1:1:1:1 80 x 55 x STS Customer-specific 80 x 30 x STS Customer-specific 80 x 30 x STS Customer-specific 80 x 55 x STS Customer-specific 80 x 55 x STS Customer-specific 80 x 55 x With dissimilar main CTs, the ratio of the largest to the smallest primary current should not be lager than 10/1. Dimension diagrams All dimensions in mm STS20 / STS30 / STS21 / STS31 STS40 / STS50 / STS60 / STS41 / STS51 / STS61 Basic Information for the use of current transformer can be found in chapter


238 Chapter 06 Cable split core current transformers Cable split core current transformers Innovative and reliable Particularly well suited to digital measurement devices Especially fast installation For applications with insulated cable up to 2 x 42 mm max. Transformation ratio of / 1 A or ,000 / 5 A Including color-coded secondary cables Additional fastening of the transformer with the two UV-resistant cable ties provided Especially suited for retrofitting, primary circuit must not be disconnected Ideal for use in very compact installation spaces Fig.: Type KUW4.2/60 Dimension diagrams All dimensions in mm KUW1/30 KUW1/40 KUW2/40 238


 Cable feed through")

239 Chapter 06 Cable split core current transformers Technical data Environmental conditions Position of installation For indoor usage, only for insulated cables Ambient temperature C Relative humidity 5 85 % (no condensation) Protection class IP20 Application conditions Standard IEC Thermal short time rated current 60 x In / 1 s Thermal continuous current 100 % Rated isolation level 0.72 / 3 / kv Rated frequency 50 / 60 Hz Insulation class E (120 C) Cable feed through window For conductors max. Ø 18 / 28 / 42 or 2 x 42 mm Secondary conductor / 1 A: 0.5 mm² / 5 A: 1.5 mm² KUW4/60 KUW4.2/60 Basic Information for the use of current transformer can be found in chapter
240 Chapter 06 Cable split core current transformers Series KUW1 for insulated cable up to max. 18 mm diameter Type Primary current in A Secondary current in A Power in VA (at the end of the wire) Class Cable length in m Diameter Primary conductor in mm Weight (kg) Item no. KUW1/ KUW1/ KUW1/ KUW1/ KUW1/ KUW1/ KUW1/ KUW1/ KUW1/ KUW1/ KUW1/ KUW1/ KUW1/ KUW1/ KUW1/ Series KUW2 for insulated cable max. 28 mm diameter Type Primary current in A Secondary current in A Power in VA (at the end of the wire) Class Cable length in m Diameter Primary conductor in mm Weight (kg) Item no. KUW2/ KUW2/ KUW2/ KUW2/ KUW2/ KUW2/ KUW2/ KUW2/ KUW2/ Series KUW4/60 for insulated cable up to max. 42 mm diameter Type Primary current in A Secondary current in A Power in VA (at the end of the wire) Class Cable length in m Diameter Primary conductor in mm Weight (kg) Item no. KUW4/ KUW4/ KUW4/ KUW4/ KUW4/ KUW4/ KUW4/ KUW4/ , KUW4/ KUW4/ KUW4/ KUW4/ KUW4/ KUW4/ KUW4/ , Series KUW4.2/60 for insulated cable up to max. 2 x 42 mm diameter Type Primary current in A Secondary current in A Power in VA (at the end of the wire) Class Cable length in m Diameter Primary conductor in mm Weight (kg) Item no. KUW4.2/ x KUW4.2/ x KUW4.2/ x KUW4.2/ x KUW4.2/ x KUW4.2/ x KUW4.2/ x KUW4.2/ , x KUW4.2/ x KUW4.2/ x KUW4.2/ x KUW4.2/ x KUW4.2/ x KUW4.2/ x KUW4.2/ , x


 KBU 58 250 5 1.5 1 125 158 34 / 58 55 85 0.9 15.")


241 Chapter 06 Split core current transformer Cable split core current transformer, type KBU Features / benefits Ideal for retrospective installation in existing systems Simple and secure attachment - current transformer audibly latches Available with secondary current 5 A / 1 A Also available in accuracy class 0.5 Four different configurations Working temperature range: -5 C < T < +50 C Storage temperature range -25 C < T < +70 C Therm. nominal continuous current I cth : 1,0 x I N Therm. nominal short-time current I th : 60 x I N, 1 sec. Max. supply voltage U m : 0,72 kv Insulation test voltage: 3 kv, U eff, 50 Hz, 1 min. Nominal frequency: 50 Hz Insulation class: E Applied technical standards: DIN EN 61869, part Technical data Cable split core current transformer, type KBU Type Primary Secondary Power in VA Class Dimensions in mm Weight Item no. current in A current in A A B C / C1 D E (kg) KBU / KBU / KBU / KBU / KBU / KBU / KBU / KBU / KBU , / Dimension diagrams All dimensions in mm KBU 58 KBU 812 Basic Information for the use of current transformer can be found in chapter

 Weight (kg) Item no. ASRD 14 50 5 1 1 13.5 105 x 90 x 54 0.5 15.03.403 ASRD 14 75 5 1.5 1 13.5 105 x 90 x 54 0.5 15.03.404 ASRD 14 100 5 2.")
242 Chapter 06 Split core current transformer Three-phase current transformer type ASRD 14 Three-phase current transformer with 5 A secondary current Primary current 100 A Secondary current 5 A Conductor feed-through Ø 13.5 mm per phase For connection to current measuring systems with 5 A input Technical data Three-phase current transformer type ASRD 14 Type Primary current in A Secondary current in A Power in VA Class Round conductor in mm Dimensions in mm (H x W x D) Weight (kg) Item no. ASRD x 90 x ASRD x 90 x ASRD x 90 x ASRD x 90 x ASRD x 90 x Dimension diagrams All dimensions in mm 242

243 Chapter 06 DIN rail current transformer DIN rail current transformer with voltage tap and fuse Save time and space For precise current and voltage measurement Integrated current transformer and fuse protected voltage tap Prevention of connection errors Specially developed for energy measurement up to 64 A Transformation ratios 35/1 and 64/1 A With test mark from KEMA-KEUR Dimension diagrams All dimensions in mm Technical data Technical data General Maximum voltage 690 V, Uimp 6 kv Insulation voltage 1890 V / 50 Hz 1 min Rated current 35 / 64 A Max. current (16 mm²) 42 / 76 A Protection class E (max. 120 ) Protection class IP20 Ambient temperature C Housing PA, 30 % glass proportion Screw connection cross head DIN 7962-H2 Terminal Standard IEC Connection cross-section 1.5 mm² 16 mm² Voltage tap-off Short-circuit withstand capability 70 ka to 400 V / 50 Hz Connection cross-section max. 4 mm² Fuse type 5 x 25 mm (with notification) Max. 2 A SIBA DIN Current transformers Standard IEC Maximum short term current 60 x In Insulation voltage 3 kv / 50 Hz 1 min DIN rail current transformer overview Type Transformation ratio Power in VA Class Dimensions in mm (H x W x D) Weight (kg) Item no. CT 35/1A 35/1 A x 32 x CT 64/1A 64/1 A x 32 x Basic Information for the use of current transformer can be found in chapter
244 Chapter 06 Current transformers Current transformer CT27 Class 1 Compact innovation Compact current transformer Particularly well suited to digital measurement devices Current transformer per IEC Transformation ratios 35/1, 64/1 A, class 1 Primary conductor feed-through window for insulated cable up to Ø 7.5 mm For use on a 3-phase circuit breaker with phase spacing of 17.5 mm DIN rail mounting (35 mm) via rail clamps (optional) Plug-in type CTs (Lego concept) Dimension diagrams All dimensions in mm Technical data Technical data Environmental conditions Position of installation Indoor usage; only for insulated conductors Ambient temperature C Relative humidity 5 85 % (no condensation) Protection class IP20 Application conditions Standard IEC Thermal short time rated current 60 x In / 1 s Thermal continuous current 100 % Rated isolation level 0.72 / 3 / kv Rated frequency 50 / 60 Hz Insulation class E (120 C) Cable feed through window Ø 7.5 mm Secondary conductor (spring clamps) Wire cross section: mm²; rigid, flexible Current transformer CT27 Class 1 Type Primary current in A Secondary current in A Power in VA (at the terminal) Max. diameter, primary conductor in mm Dimensions in mm (H x W x D) Weight (kg) Item no. CT x 27 x CT x 27 x Accessories Mounting clip For DIN rail EN , suitable for CT27-35 and CT x 41 x

245 Chapter 06 Current transformers for operating current for the measurement device UMG 20CM Split-core current transformer SC-CT-20 Innovative and flexible Compact, divisible, split-core current transformer Separable current transformer up to max. 63 A especially for retrofitting Transformation ratio 3,000/1 Primary window can be used for insulated cable up to Ø 10 mm Special version for the UMG 20CM branch circuit monitoring device Dimension diagrams All dimensions in mm 32 mm 14,7 mm 32,3 mm 41,4 mm Technical data Environmental conditions Position of installation Indoor usage; only for insulated conductors Ambient temperature C Protection class IP20 Application conditions Measuring accuracy 1 % Thermal continuous current 100 % Insulation resistance 100 MOhm Rated frequency 50 / 60 Hz Max. frequency Hz Secondary conductor Wire cross section: 0.75 mm² Rigid, flexible Split-core current transformer SC-CT-20 Type Max. operating current (A) Transformation ratio Max. primary conductor diameter in mm Class Accuracy (%) Dimensions in mm (H x W x D) Weight (kg) Item no. SC-CT-20* 63 3,000/ x 32 x Individual accessory (load is included the scope of the SC-CT-20 delivery) Burden (3.9 Ω) for operating current monitoring with the SC-CT-20 with 1.5 m ready-made connection cable and spring type terminal adapter * Incl. ready-made connection cable; 1.5 m with burden and spring type terminal adapter for operating current measurement Basic Information for the use of current transformer can be found in chapter

 0,01 100 A (RL = 10 Ohm) 0,01 200 A (RL = 10 Ohm) 0,1 300 A (RL = 10 Ohm) 0,01 400 A (RL = 5 Ohm) 0,01 500 A (RL = 5 Ohm) 0,01 600 A (RL = 5 Ohm)")
246 Chapter 06 Current transformers for operating current for the measurement device UMG 20CM Split core operating current CTs up to 600 A Fast installation reliable measurement Snap-in technology make installation in existing equipment easier Secure latching in place High number of secondary windings Small size, low weight Suitable for UMG 20CM Dimension diagrams All dimensions in mm D E C Ød A B k l Technical data Technical data Type SC-CT SC-CT SC-CT SC-CT SC-CT SC-CT Current ratio 120 A / 40 ma 200 A / 66,6 ma 300 A / 100 ma 400 A / 100 ma 500 A / 100 ma 600 A / 100 ma Current range (50/60 Hz) 0, A (RL = 10 Ohm) 0, A (RL = 10 Ohm) 0,1 300 A (RL = 10 Ohm) 0, A (RL = 5 Ohm) 0, A (RL = 5 Ohm) 0, A (RL = 5 Ohm) Position of installation Indoor usage (any mounting position) Ambient temperature C C Storage temperature C, rel. humidity <85 % (no condensation) Split core operating current transformer up to 600 A Type Operating mode Max. operating current in A SC-CT SC-CT SC-CT SC-CT SC-CT SC-CT Transformation ratio Max. primary conductor diameter in mm Accuracy (%) Dimensions in mm (H x W x D) A B C D E Weight (kg) Item no. Operating current / ca measurement* 1 Operating current / ca measurement* 1 Operating current / ca measurement* 1 Operating current / ca measurement* 1 Operating current / ca measurement* 1 Operating current / ca measurement* 1 Single accessory (burden is included the scope of the transformer delivery) Burden (2.2 Ω) for operating current transformer SC-CT with 1.5 m ready-made connection cable and spring type terminal adapter Burden (1.1 Ω) for operating current transformer SC-CT with 1.5 m ready-made connection cable and spring type terminal adapter Burden (0.8 Ω) for operating current transformer SC-CT /400/500/600 with 1.5 m ready-made connection cable and spring type terminal adapter * 1 Incl. ready-made connection cable; 1.5 m with burden and spring type terminal adapter for operating current measurement 246

247 Chapter 06 Flexible current transformers Flexible current transformer Rogowski coil thinner, lighter flex converter for simple installation The Rogowski coil is used for current measurement of AC currents and is primarily employed for retrospective installation in existing systems - optionally on power rails or power cables. Frequency bandwidth 50/60 Hz, up to 700 khz without load (no-load operation) Accuracy per class 0.5, in accordance with IEC Operating temperature 40 C bis +80 C Rated insulation voltage 1 kv CAT III Rogowski coil from 10 to A RMS in combination with Janitza measurement transducer RogoTrans up to 4000 A RMS Sealing possible CE certified (2014/30/EU), in accordance with the European Directive 2014/35/EU and tested in accordance with the standard IEC Retrospective clip-on system without disconnecting the phase conductor Device for fixing to the primary conductor with a cable tie Internal screening High linearity, no saturation, no current upper limit of the Rogowski coil Description Item no. Diameter Length Weight Rogowski current transformer Ø 70 mm mm 3 m 192 g Rogowski current transformer Ø 175 mm mm 3 m 206 g Rogowski current transformer Ø 300 mm mm 3 m 222 g Note: in order to ensure smooth operation of the Rogowski coils, a combination of the coil and the Janitza measurement transducer RogoTrans ( ) is always necessary! Additionally a 24 V DC power supply is needed. Technical data Item no Max. output voltage 30 V 30 V 30 V Primary current *1 up to A *1 up to A *1 up to A *1 Rated transformation ratio (@ 50 Hz) 44,44 ka/v 44,44 ka/v 44,44 ka/v Rated frequency 50/60 Hz 50/60 Hz 50/60 Hz Secondary voltage 22,5 mv (at 1000 A / 50 Hz) 22,5 mv (at 1000 A / 50 Hz) 22,5 mv (at 1000 A / 50 Hz) Mutual inductance 71,98 nh 72,314 nh 72,84 nh Temperature coefficient of M ±30 ppm/k ±30 ppm/k ±30 ppm/k Frequency bandwidth (cable length 1,5 m) *2 420 khz *2 350 khz *2 300 khz *2 Phase displacement 0,004 *3 0,004 *3 0,004 *3 Coil inductance 180 µh 343 µh 566 µh Coil resistance 56 Ω 105 Ω 170 Ω Ratio error (cenred) 0,5... 0,5 % class 0,5 Accuracy per IEC Ration error (all positions) *4 0, ,75 *4 incl. positioning errors 0,5... 0,5 % class 0,5 Accuracy per IEC , ,75 *4 incl. positioning errors Linearity error none none none Influence of external current *5 ±0,2 *5 ±0,2 *5 ±0,2 *5 0,5... 0,5 % class 0,5 Accuracy per IEC , ,75 *4 incl. positioning errors *1 In combination with Janitza measurement transducer RogoTrans up to 4000 A. *2 On request, the frequency bandwidth and phase shifting model can be made available. *3 With installation at a right angle to the phase conductor. *4 Under consideration that the Janitza Rogowski current transformer is installed perpendicular to a primary conductor of min. Ø 15 mm. *5 Under consideration that a further phase conductor of min. Ø 15 mm is installed at the same height and at a right angle to the Janitza Rogowski current transformer. Basic Information for the use of current transformer can be found in chapter

248 Chapter 06 Flexible current transformers Measurement transducer Measurement transducer for Rogowski current transformer The measurement transducer RogoTrans for the Rogowski current transformer measures alternating currents and possesses a standardised output signal of 0 to 1 A. Compact construction in a plast housing Assembly on DIN rail possible Metering range up to 4000 A Voltage supply 24 V DC Technical data Item no Dimesions 22.5 x 100 x 110 mm (W x H x D) Weight approx. 0.2 kg Power supply 24 V DC (18 to 36 V) / 1 A Current draw < 300 ma (with 1 A output current) < 80 ma (without output current) Input Janitza Rogowski coil max. 90 mv (4000 A range) Current metering ranges 1 to 4000 A 1 to 2000 A 1 to 1000 A 1 to 500 A 1 to 250 A Metering range setting (button) LED (yellow) Wear-free metering range selection via micro-controller and PGA Operating and metering range display via 6 LED (green) Phase angle < 1 Linearity error at 50 Hz Measuring error at 50 Hz Input impedance Signal output Measurement range exceeding 110% < 0.2% in all metering ranges < 0.2% in all metering ranges 10 k Ω in all metering ranges 0 to 1 A Burden 0 to 1.5 Ohm Linearity error burden 0 to 1.5 Ohm < 0,02% Alarm output 24 V DC / 200 ma (floating potential optical output, open with fault) Alarm messages (via red LED) Overload (range exceeding) Burden too great (output circuit) Undervoltage (24 V) Alarm delay 60 seconds Protection type IP30 Ambient temperature 20 C to +70 C Installation position Vertical; if multiple devices are used next to each other then a minimum distance of 5 mm must be maintained between the devices (heat development) Storage temperature 25 C to +85 C Basic Information for the use of current transformer can be found in chapter

249 Chapter 06 Residual current transformer RESIDUAL CURRENT TRANSFORMER 249

250 Chapter 06 Split-core residual current transformer Split-core residual current transformer Handy and compact Simple and economical installation, especially for retrofit Practical locking system: Separating of primary cable not required Available in various different sizes No interruption of operations Suitable for UMG 96RM-E, UMG 96RM-PN, UMG 20CM, UMG 509-PRO and UMG 512-PRO Dimension diagrams All dimensions in mm Technical data Technical data General Construction style Conductor low voltage residual current transformer Housing material Polycarbonate, grey RAL 7035 Max. voltage for electrical equipment Um < = 0.72 kv Insulation test voltage 3 kv Ueff.; 50 Hz; 1 min Rated frequency 50 Hz Secondary connection Brass profile, nickel plated, max. 4.0 mm 2 Nominal ratio Ipn / Isn 10 / A Working frequency range Hz Secondary rated apparent power 0.05 VA Ambient temperature range C Max. temperature of the primary conductor 90 C Advice: In case that the residual current converters of series KBU are used in connection with UMG 20CM, the measuring range of UMG 20CM can be raised from 900 ma or 1 A to 14 A or 15 A by use of a burden with item no Differential current transformer type A Type Transformation ratio Max. primary residual Dimensions in mm Weight (kg) Item no. current in ma* A B C / C1 D E KBU 23D 600/ / KBU 58D 600/ / KBU 812D 600/ / * When using the analogue inputs of the UMG 96RM-E, UMG 96RM-PN, UMG 509-PRO and UMG 512-PRO. 250
 and general circuit breakers")

251 Chapter 06 Split-core residual current transformer Split-core residual current transformer Main features Makes it possible, in conjunction with the UMG devices, to determine the residual current to earth of machines or systems Compact construction Detection of very small currents Designed to increase the sensitivity of residual current breakers (personal protection) and general circuit breakers Suitable for the UMG 96 RM-E, UMG 96RM-PN, UMG 509-PRO, UMG 512-PRO, UMG 20CM Technical data General data Insulation voltage 0,72 kv Frequency 3 khz Operating temperature -10 to +55 C Test voltage 3 kv RMS 50 Hz / 1 min. Device overview Plug-in residual current transformer type A Type Transformation ratio Max. primary residual current in ma* Item no. CT-AC RCM A110N 700/ CT-AC RCM A150N 700/ CT-AC RCM A310N 700/ * When using the analogue inputs of the UMG 96RM-E, UMG 96RM-PN, UMG 509-PRO and UMG 512-PRO. Advice: In case that the residual current converters of series CT-AC are used in connection with UMG 20CM, the measuring range of UMG 20CM can be raised from 900 ma or 1 A to 14 A or 15 A by use of a burden with item no Dimension diagrams All dimensions in mm CT-AC RCM A110N/150N S1 S2 S3 S4 Abb. CT-AC RCM A310N C A B 79 Dimensions - Plug-in residual current transformer type A Type Dimensions in mm Weight A B C (kg) CT-AC RCM A110N ,35 CT-AC RCM A150N ,50 CT-AC RCM A310N ,80 Basic Information for the use of current transformer can be found in chapter
 and general circuit breakers")

252 Chapter 06 Feadthrough residual current transformer Feadthrough residual current transformer Main features Makes it possible, in conjunction with the UMG devices, to determine the residual current to earth of machines or systems Compact construction Detection of very small currents Designed to increase the sensitivity of residual current breakers (personal protection) and general circuit breakers Suitable for the UMG 96 RM-E, UMG 96RM-PN, UMG 20CM, UMG 509-PRO, UMG 512-PRO Technical data General data Insulation voltage 0,72 kv Frequency 3 khz Operating temperature -10 to +55 C Test voltage 3 kv RMS 50 Hz / 1 min. Device overview - Plug-in residual current transformer type A Type Transformation ratio Max. primary residual current in ma* Item no. CT-AC RCM 35N 700/ CT-AC RCM 80N 700/ CT-AC RCM 110N 700/ CT-AC RCM 140N 700/ CT-AC RCM 210N 700/ * When using the analogue inputs of the UMG 96RM-E, UMG 96RM-PN, UMG 509-PRO and UMG 512-PRO. Advice: In case that the residual current converters of series CT-AC are used in connection with UMG 20CM, the measuring range of UMG 20CM can be raised from 900 ma or 1 A to 14 A or 15 A by use of a burden with item no Dimension diagrams All dimensions in mm B C A E D Dimensions - Plug-in residual current transformer type A Type Dimensions in mm Weight A B C D E (kg) CT-AC RCM 35N ,25 CT-AC RCM 80N ,35 CT-AC RCM 110N ,50 CT-AC RCM 140N ,70 CT-AC RCM 210N ,20 252


253 Chapter 06 Differential current transformer Type B+ Differential current transformer Type B+ Main features Recording of type B+ residual currents (up to 300 ma) Prealarm in case of malfunction Standard interface 4 20 ma Continuous monitoring of residual currents Power supply voltage 24 V DC Compact, solid plastic housing Alternative to insulation measurement for testing of stationary electrical installations and equipments. Provisions for fire and facility protection can easily be implemented Decentralised, direct disconnection of equipment parts Technical data Overview of product variants Description Operating voltage DC Max. primary residual current in ma Own consumption Dimensions in mm A B C D E Item number CT-AC/DC Typ B+ 35 RCM 24 V ( V) 0,3 A max. 1.5 W CT-AC/DC Typ B+ 70 RCM 24 V ( V) 0,3 A max. 1.5 W Accessories 1-phase switching power supply in the installation housing prim V 50/60 Hz, sec. 24 V DC; 1 A Dimensions in mm (H x W x D): 90.5 x 52 x 62.5; weight: ca. 169 g Advice: In case that the residual current converters of series CT-AC are used in connection with UMG 20CM, the measuring range of UMG 20CM can be raised from 900 ma or 1 A to 14 A or 15 A by use of a burden with item no Dimension diagrams All dimensions in mm E E D E A D A A F D G B C B B C C H Basic Information for the use of current transformer can be found in chapter
254 Chapter 06 Current transformers for operating and differential current for the measurement device UMG 20CM Current transformer, class 1, CT20 Precise and efficient Can be used with operational currents up to max. 63 A and for residual currents from 1 ma to 1,000 ma acc. type A Compact construction Ratio 700/1 Primary window can be used for insulated cable Ø 7.5 mm (max.) For use on a 3-phase circuit breaker with a phase spacing of 17.5 mm DIN rail mounting (35 mm) via rail clamps (optional) Special version for the monitoring device UMG 20CM Technical data Dimension diagrams All dimensions in mm Current transformer CT-20 Environmental conditions Position of installation Indoor usage; only for insulated conductors Ambient temperature C Relative humidity 5 85 % (no condensation) Protection class IP20 Application conditions Measuring accuracy 1 % Thermal short time rated current 60 x In / 1 s Thermal continuous current 100 % Rated isolation level 0.72 / 3 / kv Rated frequency 50 / 60 Hz Insulation class E (120 C) Cable feed through window Ø 7.5 mm Secondary conductor Wire cross section: mm² Rigid, flexible, spring type terminal Current transformer CT-20 operating or differential current transformer type A Operating or residual current CT type A Max. operating current in A Residual current in ma Transformation ratio Max. diameter, primary conductor in mm Class Dimensions in mm (H x W x D) Weight (kg) Item no. CT (with burden) / x 27 x Accessories Mounting clip For DIN rail EN , suitable for type CT x 41 x Ready-made connection cable 1.5 m with burden (0,8 Ω) and spring type terminal adapter for operating current measurement

255 Chapter 06 Current transformers for operating and differential current for the measurement device UMG 20CM Split-core current transformer SC-CT-21 Micro-fine and high-precision Compact, divisible, split-core current transformer Suitable for residual current measurement ( ma) High measurement accuracy Simple installation thanks to clip technology UL and EN certified Specially designed for use with the UMG 20CM Dimension diagrams All dimensions in mm Black White I 160 ± 20 AWG#22 S2(l) Black S1(k) White Technical data Technical data Measuring accuracy 1 % Current measurement range A Max. continuous current 35 A DC resistance 33 Ohm ±10 % Insulation category CAT III Environmental conditions Position of installation Indoor usage Ambient temperature C Storage temperature C Relative humidity < 85 % (no condensation) Protection class IP20 Split-core current transformer SC-CT-21 Type Residual current (ma) Transformation ratio Max. primary conductor diameter in mm Class Accuracy (%) Dimensions in mm (H x W x D) Weight (kg) Item no. SC-CT , / x 35 x Basic Information for the use of current transformer can be found in chapter
256 ON - Operating Current Mode OFF - RCM-Mode OC ON ON ON ON ON ON ON RCM OFF number of CT Chapter 06 Current transformers for operating and differential current for the measurement device UMG 20CM 6-fold DIN rail current transformer CT-6-20 Monitor, detect and treat For operational current as well as RCM-monitoring suitable Residual current acquisition with integrated current transformers (residual currents per IEC type A) 6 measurement channels Compact construction Parallel acquisition and processing of measured values Use in distribution outputs for consumers and systems Special version for the monitoring device UMG 20CM Dimension diagrams All dimensions in mm 174,00 mm 21,00 Operating current and RCM fault sensor strip for UMG20CM CT T1 T2 T3 T2 T3 T5 T3 T2 T4 T4 T5 T4 T5 T6 Janitza electronics GmbH Vor dem Polstück 1 D Lahnau Deutschland X1 45,00 mm 56,00 mm Ratio: 1/700 Burden RCM/Operating Current: 0/1 Ohm Made in Germany Ib max: 63A Idiff max: 1000mA 21,00 Technical data General data Number of measuring channels Monitoring Evaluation Rated isolation level 4 kv Transformer rated voltage max. 720 V AC Transformer rated frequency Hz Therm. rated short-term current 60 x In / 1 sec. Therm. Continuous current 100% Ambient temperature C Class 1 Protection class E Protection class IP20 6 (current transformers integrated) Parallel, real effective value measurement ("True RMS") Residual or operating currents (configurable as required in the individual application) 6-fold DIN rail current transformer CT-6-20 (operating and residual current transformer type A) Type Operating mode* 1 Measurement accuracy CT-6-20 Residual or operating currents Operating current with load in A Residual current in ma Number of measuring channels* 2 Transformation ratio Max. primary conductor diameter in mm Dimensions in mm (H x W x D) Weight (kg) Item no , / x 174 x Accessories Ready-made connection cable 1.5 m twisted, shielded with connector * 1 Pre-configurable as needed via DIP switch * 2 Measurement transformer integrated. 256

257 Chapter 06 Accessories ACCESSORIES 257

258 Chapter 06 Voltage transformer Voltage transformer Powerful and precise Input, 3-pole Output is 3-pole + N Use in IT networks without neutral line For reducing the measurement voltage for the UMG measurement input Use in IT networks in conjunction with the measurement devices from the series UMG Dimension diagram All dimensions in mm 240,5 100,5 229 Befestigung Ø 4, Technical data Voltage transformer 3-phase voltage transformer Protection class IP20 Transformer class 1 Core section M65 / 27.8 Specification EN EN Nominal input voltage see below (0.028 A) Output voltage 400 V AC, A Frequency 50 / 60 Hz Protection primary M A, 5 x 3 mm Nominal power 5 VA Voltage transformer Type Primary voltage (V AC) Secondary voltage (V AC) Primary fuse (A) Rated power (VA) Dimensions in mm (H x W x D) Weight (kg) Item no. Voltage transformers BV x x Voltage transformers BV x x Voltage transformers BV x x

259 Chapter 06 Voltage tap Voltage tap ZK4S, ZK4B and ZK4R Compact and secure Terminals to tap off the voltage on current-conducting bus bars Suitable for tapping off voltage for energy measurement devices Fusing directly on the rail Primary connection with M8 Allen screw Short-circuit resistance 70 ka to 400 V / 50 Hz High operational reliability Dimension diagrams All dimensions in mm Fig.: ZK4S and ZK4B ZK4S-ZK4B 15 B 42,7 15,2 13,9 A 50 36,6 Fig.: Insulated tool ZK4R Technical data Voltage tap Max. operating voltage 690 V Test voltage / pulse 3 kv / 50 Hz 6 kv In max. 10 A Insulation class E (max. 120 ) Fuse type 5 x 25 mm (with notification), 10 A SIBA DIN Ambient temperature C* 1 Temperature increase, bus bar Max. 75 K* 1 Primary connection M8 Allen screw Allen size Number 6 Max. bus bar thickness 4 15 mm Housing Polyamide (PA6.6) Terminal material Nickel plated brass * 1 Max. temperature of the primary rail 120 ºC (total of ambient temperature and temperature increase of the rail) Device overview Voltage tap Type Color Description Fuse (A) Cross-section connection line (mm²) Dimensions in mm (H x W x D) A B Weight (kg) Item no. ZK4S Black With fuse ZK4B Blue Without fuse Accessories 1 x voltage tap set 3 x ZK4S (item no ); 1 x ZK4B (item no ) ZK4R Insulated tool for fixing the tap; 1,000 V, EN / IEC

260 Chapter 06 Voltage tap Voltage tap ZK4/M6 and ZK4/M8 fused measurement voltage connection Fused voltage tap for measurement purposes Simple installation underneath existing fastening points, directly on the current bus bar Compact housing Delivered with a 5 x 25 mm, 2 A, 450 V, F, 70 ka fuse Dimension diagrams All dimensions in mm ZK4M6-M8 14 M6/M8 B 36,5 A 2 46,9 Technical data Environmental conditions Installation location Indoor usage (suitable for copper rails) Ambient temperature range C Relative humidity 5 to 85 % (no thawing) Protection class IP20 (basic insulation) Application conditions Standard IEC Maximum operating voltage 400 V ~ Test voltage 3 kv / 50 Hz Surge voltage 6 kv 1.2 / 50 µs Imax 2 A Voltage drop < 500 m V ~ Fuse 2 A, 450 V, F, 70 ka, 5 x 25 mm, ceramic (SIBA Part.no ) Torque Max. 2.0 Nm Device overview Voltage tap Type Color Primary connection Fuse (A) Cross-section connection line (mm²) Dimensions in mm (H x W x D) Weight (kg) Item no. (mm) A B ZK4/M6 Black ZK4/M8 Black
261 Chapter 06 Current transformer terminal block Current transformer terminal block Modular and reliable Application: Short circuiting of current transformers, parallel measurement for cross checking ( quasi calibrating ) measurement devices For installation on DIN rails Completely equipped for 4 conductors Insulated bridges for grounding and short circuiting of the CT terminal Dimension diagrams All dimensions in mm PE L1 L1 L2 L2 L3 L3 N N 50.9 S1 S2 S1 S2 S1 S2 S1 S2 Technical data General data DIN mounting rail installation 35 mm DIN rail Connection max. 4 CTs 4 pairs, 2-conductor, disconnecting and measurement terminals with contact protected test sockets Test connector (ø) 4 mm (with switching bridge) Rated voltage EN 500 V Measurement surge voltage 6 kv Rated current 30 A Degree of pollution 3 Connection design CAGE CLAMP S Type of conductor Single or fine-stranded Fine stranded diameter mm² "f"+ "e" diameter mm² "f" diameter with AEH mm² Stripping length mm Each terminal is labelled. The terminal position S2 on each transformer is connected to ground potential via a fixed, pre-installed bridge. Each pair of disconnecting and measurement terminals is equipped with a yellow switch lock for the disconnect lever. 2 disconnect levers are coupled together via an interlocking cap. Current transformer terminal block Type Rated current (A) Current transformer terminal block Rated voltage EN (V) Rated voltage surge (kv) Type of conductor Single or fine-stranded Crosssection (mm²) Dimensions in mm (H x W x D) Weight (kg) Item no x 85 x
262 Chapter 06 Humiditiy and temperature sensor Humidity and temperature sensor JFTF-I High-precision and reliable measurement For the measurement of relative humidity and temperature of the ambient air Intended for the measurement of unpolluted, non-condensing air without any positive or negative pressure High measurement accuracy A sintered filter protects the sensor from external contaminants The sensors themselves are fitted in a metal tube so that the warming up of the analogue unit has no detrimental influence on the measurement. FBM modul DI8-AI8 required (Item no ) Overview of devices Humidity and temperature sensor Designation Type Item no. With current output (2-wire system) ma Operating voltage V DC, depending on total apparent load Relative humidity output ma corresponding to %, Load resistance Ω Temperature output ma corresponding to C Load resistance Ω Current consumption max. 40 ma JFTF-I
263 Chapter 06 Current / voltage transformers and sensors Current transformer error curve Over current for monitoring CTs FS5 F i / % E i / % Working Current Area Error Limit Curve for cl. 1 Error Limit Curve for cl. 3 Fehlergrenzkurve für Kl. 3 Over current for monitoring CTs FS10 % / I N Arbeitsstrombereich FS5-limit FS5-Grenze Überstrombereich für Messwandler FS5 Überstrombereich für Messwandler FS10 Example for a measuring c.t. of cl. 1 FS5 and 1/1 burden Beispiel eines Strom-Messwandlers der Kl. 1 FS5 bei 1/1 Bürde Example for a protection c.t. 10P10 and 1/1 burden Beispiel eines Schutzwandlers 10P10 bei 1/1 Bürde Example for a measuring c.t. of cl. 1 FS5 and 1/4 burden Beispiel eines Strom-Messwandlers der Kl. 1 FS5 bei 1/4 Bürde Example for a protection c.t. 10P10 and 1/4 burden Beispiel eines Schutzwandlers 10P10 bei 1/4 Bürde 263
264 Chapter 07 Accessories 07 Accessories Accessories Integration and installation aids Adapters for DIN rail installation Seals Blank plastic covers Adapter plates Ethernet front panel connector and protective covers Page


265 Chapter 07 Accessories ACCESSORIES INTEGRATION AND INSTALLATION AIDS 265
: 60 x 85 x 90 UMG 96L / UMG 96 / UMG 96S UMG 96RM basic device / UMG 96RM-M 52.09.201 52.22.")
266 R2 Chapter 07 Accessories Adapters for DIN rail installation 1 R1 R2 R2 Description Type Item no. Adapter for DIN rail mounting AH96 Dimensions in mm (H x W x D): 60 x 85 x 90 UMG 96L / UMG 96 / UMG 96S UMG 96RM basic device / UMG 96RM-M Dimension diagrams All dimensions in mm Front view AH96 for the UMG 96L / UMG 96 View from below 3D view Front view AH96 for the UMG 96RM View from below 3D view Description Type 103,5 Item no. 96 mm adapter for DIN rail mounting UMG with Profibus 74 AH96P 45 4,2 Dimensions in mm (H x W x D): 113 x 85 x 90 UMG 96RM-E / UMG 96RM-EL / UMG 96RM-CBM / UMG 96RM-P / UMG 96RM-PN Dimension diagrams 6 All dimensions in mm R1 R2 R2 R1 15, ,7 113, , ,5 103,5 74 4,2 45 Gewindedüse M4 (2x) 18 15, ,2 103, , R1 R1 1 15,6 15,7 62 R1 15, R , ,5 Gewindedüse M4 (2x) D view Front view View from below 93,5 266 Gewindedüse M4 (2x)
267 Chapter 07 Accessories Description Type Item no. 144 mm adapter for DIN rail mounting AH144 Dimensions in mm (H x W x D): 95 x 160 x 74 Prophi UMG 508 / UMG Further accessories Overview Description Type Item no. Sealing (to IP54) for UMG 96RM, UMG 96RM-P, UMG 96RM-CBM, UMG 96RM-M, UMG 96RM-E, UMG 96RM-EL, UMG 96RM-PN D Sealing (to IP42) for UMG 96, UMG 96S and UMG 96L D Sealing (to IP42) for UMG 508, UMG 509-PRO, UMG 511, D UMG 512-PRO and Prophi Blank cover in black plastic, 96 x 96 mm BA Blank cover in black plastic, 144 x 144 mm BA Adapter plate 144 mm to 96 mm, color RAL 7032 Adapter plate 144 mm to 96 mm, color RAL 7035 AB144/1 AB144/ Ethernet front panel feed-through with extension frame and RJ45 socket type VS-08-BU-RJ45/BU EFD Protective cover, flat design for covering the contact insert RJ45 EFDD
268 Chapter 08 Power factor correction (PFC) and harmonics filter 08 Power factor correction (PFC) and harmonics filter Prophi power factor controller Optimised control for longer service life The universal capacitor monitoring system Protection of capacitors and PFC systems PFC power capacitors 3-phase power capacitors in aluminium cans Automatic power factor correction systems without reactors Automatic power factor correction, modular design (up to 500 kvar) Automatic power factor correction, extractable module, up to 100 kvar Automatic de-tuned power factor correction systems Automatic de-tuned power factor correction (harmonics filter), compact design 7 % de-tuned power factor correction (harmonics filter) 14 % de-tuned power factor correction (harmonics filter) De-tuned capacitor modules Dynamic power factor correction systems (real time PFC) 7 % de-tuned dynamic power factor correction 14 % de-tuned dynamic power factor correction De-tuned dynamic PFC module Power factor correction spare parts and accessories Component selection table for a nominal voltage 400 V 50 Hz Accessory Passive harmonics filter Electronic circuit breaker (thyristor controller) Page 271 Page 287 Page 289 Page 295 Page 301 Page 309 Page


269 Chapter 08 Power factor correction (PFC) and harmonics filter POWER FACTOR CORRECTION (PFC) AND HARMONICS FILTER 269
270 Chapter 08 Power factor correction (PFC) and harmonics filter Types of power factor correction (PFC) Individual PFC A suitably sized capacitor will be connected in parallel to each inductive load Relieving of the load on the supply line as well as the switching equipment No separate switching equipment required for the capacitor and no controller required Economic with longer duty cycles and greater power draw Group PFC Will be implemented with load groups with the same operational behaviour For multiple inductive loads, that are always operated together The supply lines and group switches will be relieved of reactive current and the simultaneity factor results in a smaller capacitor size Automatic central PFC (APFC) The central PFC will be integrated into the main LV distribution Near constant, good power factor that adapts automatically through a power factor controller via contactors or thyristor switches The output of the capacitors installed will be better utilised Better adaptation of the capacitor power to the reactive power demand Networks with harmonics can be more easily detuned through APFC Controller Mixed PFC Combination of individual, group and central PFC Controller 270
 Modbus RTU (up to 115.2 kbit/s) Profibus DP V0 (1.")
271 Chapter 08 Prophi power factor controller Prophi POWER FACTOR CONTROLLER Hybrid switching Dynamic PFC Harmonics display Smart control Interfaces / communication (optional) RS485 Profibus Communication / protocols (optional) Modbus RTU (up to kbit/s) Profibus DP V0 (1.5 MBit/s) Triple Safety Temperature monitoring Monitoring the capacitor switching cycles Monitoring of over-current Power quality Harmonics up to the 19th THD-U in % THD-I in % Smart control Minimised number of switching cycles Balanced number of contactor switching cycles Optimised service life Network visualisation software Free GridVis -Basic Alarm messages Under-voltage detection Over-voltage detection Under-compensation Measurement current exceedance Harmonics threshold values Delivery of active power Overtemperature Dropping below the minimum measurement current Switching outputs (depending on variants) 6 conventional relay outputs 12 conventional relay outputs 6 transistor outputs for dynamic PFC 12 transistor outputs for dynamic PFC 6 transistor and 6 relay outputs for hybrid PFC 271
 contactors and thyristor switching Main features Automatic or manual configuration Display of U, I, f, Q, P, S, cosphi, all odd current and voltage")
272 Chapter 08 Prophi power factor controller Areas of application Automatically controlled power factor correction Detuned power factor correction Harmonics filter Voltage stabilisation by means of dynamic PFC Mixed operation (hybrid switching) contactors and thyristor switching Main features Automatic or manual configuration Display of U, I, f, Q, P, S, cosphi, all odd current and voltage harmonics, 1 19th harmonics Display of the indirectly measured capacitor currents Display of the switching cycles per capacitor stage Display of the total switch-on duration per capacitor stage Zero voltage triggering within 15 ms Degree of reactors in % for each stage, programmable from 0 to 20 % Setting of the discharge time for all stages from 0 to 1200 sec. Capacitor outputs individually programmable Temperature sensor for fan control Overtemperature shut-down programmable Control of external semi-conductor switching (max. 50 switching operations per second) Current transformer input for 1 A; 5 A Password protection External, changable target cosphi 1 and 2 (except 6R / 6T) Fig.: Device rear side Prophi 12RS Alarm output programmable for... Under-voltage detection Over-voltage detection Under-compensation Measurement current exceedance Dropping below the minimum measurement current Harmonics threshold values Delivery of active power Overtemperature Functional principle Single-phase, electronic measurement system Acquisition of the active and reactive current portion of the network via the current and voltage circuit Reactive power will be calculated with the current from a phase conductor and the voltage between two phase conductors 272
273 Chapter 08 Prophi power factor controller Switching ON or OFF of capacitor stages in the event of deviations in the set power factor Switching of capacitors via contactors or semiconductors Control via capacitor contactors is implemented in an optimised manner Transistor outputs for the near-realtime control of semiconductor switches Fig.: Display examples: Voltage Fan control Fan control via integrated temperature sensors Either via relay outputs or the alarm relay Programming of a lower or upper limit temperature necessary Fig.: Reactive power Automatic configuration With the "LEARN" function it is possible to learn and save the connection configuration of the power factor controller LCD display Fig.: Harmonics High quality LCD display with excellent contrast Display of comprehensive measurement parameters (app. 100 measured values) Overtemperature shut-down The overtemperature shut-down switches off connected capacitor stages This results in the reduction of the interior temperature of the PFC cabinet and protects the capacitors Programming of a lower or upper limit temperature as well as the pause time Upper temperature limit Interface Fig.: Overtemperature shut-down Depending on version, equipped with an RS485 interface The Modbus RTU or Profibus DP V0 protocols are available via RS485 Integration of PLC systems, building management systems or energy management systems Modbus transfer rates: 9.6; 19.2; 38.4; 57.6; kbit/s Profibus transfer rates: Up to max. 1.5 Mbit/s Fig.: Connection assignment - RS485 interface 273
274 Chapter 08 Prophi power factor controller Dimension diagrams All dimensions in mm Rear side view Side view Cut out: ,8 x ,8 mm Typical connection Supply Loads Modbus- or Profibus-Master Prophi Alarm output Internal temperature sensor Contact opens during alarm Target cosphi changeover Motor of ventilator Fig.: Connection example power factor controller Prophi 12RS (item no ) with voltage measurement L2 L3, 12 relay outputs, target cos(phi) changeover, alarm output and RS485 interface 274
275 Chapter 08 Prophi power factor controller Device overview and technical data Prophi 6R Prophi 12R Prophi 6T Prophi 12 T Item number Measurement and auxiliary voltage 400 V AC (+10 %, -15 %)* 1 Changeover target cosphi 1/2 - - Outputs Relay outputs (conventional) Transistor outputs (dynamic) Interface Modbus or Profibus RS485 * 2, * Prophi 6T6R Prophi 12RS Prophi 6T6RS Prophi 12TS Item number Measurement and auxiliary voltage 400 V AC (+10 %, -15 %) * 1 Changeover target cosphi 1/2 Outputs Relay outputs (conventional) Transistor outputs (dynamic) Interface Modbus or Profibus RS485 * 2, * 4 - Software Free GridVis -Basic - * 3 * 3 * 3 * 1 Optional measurement and auxiliary voltage 100 V, 110 V, 200 V, 230 V, 440 V AC (+10 %,-15 %). * 2 Not possible with 50 switching operations per second. * 3 Optional additional functions with the packages GridVis -Professional, GridVis -Enterprise and GridVis -Service. * 4 Modbus or Profibus possible, please stipulate when ordering. General Prophi Use in low and medium voltage networks L-N or L-L Accuracy voltage measurement (1-phase, L-N or L-L) 0.5 % Accuracy current measurement (1-phase) 0.5 % Accuracy cosphi measurement (sum L1-L3) 1 % * 5, * 6 Accuracy power measurement (sum L1-L3) 1 % Accuracy frequency measurement 0,5 % * 6 Accuracy harmonics measurement 2 % RMS momentary value Current, voltage, frequency Effective, reactive and apparent power Power factor Recording of the mean values Power factor Power quality measurement Harmonics per order / current and voltage, 1-phase 1st 19th, odd Distortion factor THD-U in %, 1-phase Distortion factor THD-I in %, 1-phase Measured data recording Mean, minimum, maximum values Displays and inputs / outputs Digital display, 3 buttons Relay outputs (as switch output) 6 or 12 See overview of devices Transistor outputs (as switch output) 6 or 12 See overview of devices Alarm output (as switch output) 1 Digital input (for tariff changeover) 1 See overview of devices Temperature sensor (internal) 1 * 5 Applies to input currents > 0.2 A and in the cosphi range 0.85 to * 6 In the range from -10 to +18 C and 28 to 55 C an additional error of ±0,2 of the measurement value per K must be taken into account. 275
276 Chapter 08 Prophi power factor controller Communication Interface RS485: 9.6; 19.2; 38.4; 57.6; kbps Profibus DP V0: 9.6 kbps to 1.5 Mbps Protocols Modbus RTU Profibus DP V0 Software GridVis -Basic* 3 Online graphs Historical graphs Databases (Janitza DB, Derby DB); MySQL, MS SQL with higher GridVis versions) See overview of devices See overview of devices Prophi Messung Measurement 0,01.. 5A L/L siehe Typenschild see type label k l L2 L3 Manual reports Topology views Manual reading Graph sets Error messages Under-voltage Over-voltage Dropping below the minimum measurement current Measurement current exceedance Insufficient compensation power Delivery of active power Harmonics threshold values Overtemperature Technical data Supply voltage L-L, L-N AC See overview of devices Measurement in which quadrants 4 Networks TN, TT, (IT) Measurement in multi-phase networks 3 ph Measured voltage input Overvoltage category CAT III Measured range, voltage L-N, AC (without potential transformer) See overview of devices Measured range, voltage L-L, AC (without potential transformer) See overview of devices Voltage tolerance range % Back-up fuse 2 A 10 A T Measurement surge voltage 4 kv Test voltage relative to ground 2,200 V AC Frequency measuring range Hz Power consumption max. 7 VA Sampling rate 2 khz (at 50 Hz) Measured current input Signal frequency 45 Hz... 1,200 Hz Nominal current at.../5 A ( /1 A) 5 A (1 A) Minimum measurement current 10 ma Upper measurement current 5.3 A (sinusoidal) Overloading 180 A for 2 sec. Measurement rate 30 (50) measurements / sec. Power consumption approx. 0.2 VA Updating the display 1 time per second Zero voltage triggering < 15 ms Inputs and outputs Number of digital inputs (for tariff changeover) 1, see overview of devices Relay outputs (as switch output) 6 or 12, see overview of devices Back-up fuse 6.3 AT Switching voltage max. 250 V AC Switching power max. 1,000 W L1 k l L2../5(1)A L3 PE A Fig.: Connection of measurement and auxiliary voltage between L2-L3 and the current measurement via current transformer Verbraucher Loads * 3 Optional additional functions with the packages GridVis -Professional, GridVis -Enterprise and GridVis -Service. 276
277 Chapter 08 Prophi power factor controller Max. switching frequency Mechanical service life Electrical service life Transistor outputs (as switch output) Switching voltage Switching current Max. switching frequency 50 Hz > 30 x 10 6 switching cycles > 2.8 x 10 5 switching cycles 6 or 12, see overview of devices V DC max. 50 ma Alarm output (as switch output) 1 Temperature sensor (internal) 1 Target cosphi changeover (current consumption) Mechanical properties Weight 50 Hz approx ma 1000 g Device dimensions in mm (H x W x D) 144 x 144 x 49 Protection class per IEC Installation Connecting phase (U / I), Single core, multi-core, fine-stranded Terminal pins, core end sheath Features Display of capacitor currents Display of switch-on times for the individual stages Display of switching cycles per stage Zero voltage triggering Automatic configuration Password protection Environmental conditions Front: IP65, Rear: IP20 Front panel installation 0.08 to 2.5 mm² 1.5 mm² Temperature range Operation: C *7 Storage: C Relative humidity 15 to 95 % Operating altitude ,000 m above sea level Degree of pollution 2 Mounting position any Electromagnetic compatibility Electromagnetic compatibility of equipment Directive 2004/108/EC max. 300V T6,3A Fig.: Connection assignment, alarm output Electrical appliances for application within Directive 2006/95/EC particular voltage limits Equipment safety Safety requirements for electrical equipment for measurement, regulation, control IEC/EN and laboratory use Part 1: General requirements Part 2 008: Particular requirements for testing IEC/EN and measuring circuits Protection class I = Device with protective conductor Noise immunity Industrial environment DIN EN , Table 2; (IEC ) Emissions Class B: Residential environment DIN EN ; (IEC ) Class A: Industrial environment DIN EN ; (IEC ) Safety Europe CE labelling Comment: For detailed technical information please refer to the operation manual and the Modbus address list. * 7 Devices with the "RS485 interface" option are only suitable for an operating temperature range of -10 to +50 C. 277
 cosphi = 1 Effective power (P) ~ M Optimized usage of: Generators Power transformers Supply lines Distribution equipment Avoidance of reactive energy costs and")
278 Chapter 08 Power factor correction (PFC) Utilities Effective power (P) Reactive power (Q) Effective power (P) Reactive power (Q) ~ M cosphi = 0.7 Utilities Effective power (P) cosphi = 1 Effective power (P) ~ M Optimized usage of: Generators Power transformers Supply lines Distribution equipment Avoidance of reactive energy costs and penalties from the power supply companies. Lower losses, lower voltage drop, lower energy cost! Reactive power (Q) Janitza PFC Fig.: Active and reactive power in the mains with PFC 278

279 Chapter 08 Prophi 7 power factor controller Prophi 7 POWER FACTOR CONTROLLER Hybrid switching Dynamic PFC Harmonics display Smart control Interfaces / communication RS485 Communication / protocols Modbus RTU Modbus KTR ASCII Out Extern Slave Hybrid Slave Mode Master Mode Triple Safety Temperature monitoring Monitoring the capacitor protective switching cycles Monitoring of over-current Single-phase reactive current compensation monitoring Measuring voltage 3-phase V (L-L), V (L-N) Power quality Harmonics up to the 33rd THD-U in % THD-I in % Intelligent control Minimised number of switching cycles Compensated number of contactor switch cycles Optimised service life Mixed control (single and three-phase) Separate control of single-phase capacitors Sequential switching Cyclic switching Switching outputs 15 relay outputs, freely programmable 12 transistor and 12 relay outputs for hybrid PFC Alarm messages Undervoltage detection Overvoltage detection Under-compensation Measurement current exceedance Harmonics threshold values Delivery of active power Overtemperature Dropping below the measurement current C-defect Modbus error Switching cycle warning Display mode Display three measured values simultaneously Graphical representation of harmonics in bar graph form Three-digit display of power factor (cos phi), switchable (tan phi) Display of controlled steps, fault messages and time Display of apparent current, active current and reactive current in display mode 279
 contactors and thyristor switching Main features Fig.")


280 Chapter 08 Prophi 7 power factor controller Areas of application Automatically regulated power factor correction Choked power factor correction Harmonics filter Voltage stabilisation by means of dynamic PFC Mixed operation (hybrid switching) contactors and thyristor switching Main features Fig.: Auto-Mode 12 or 13 switching outputs Extended measured voltage range (up to 760 V ~ L-L) Control of inductive compensation systems possible 20 pre-programmed control series Control series editor Graphical display 128 x 64 pixels Plain language menu navigation Four-quadrant operation Automatic initialisation Display of various grid parameters Display of harmonics Display of distortion factor THD-V / THD-I Monitoring of the capacitor current Saving of the maximum values Saving of the switching cycles and times Manual / Automatic mode Zero voltage shutdown Various error messages / alarm relay Error memory Test run of the system with error analysis Control of inductive compensation systems possible Voltage, current, frequency, active power, reactive power, apparent power Harmonics of the voltage (up to the 33rd / up to the 16th (even)) Harmonics of the current (up to the 33rd / up to the 16th (even)) Alarm output programmable for... Undervoltage detection / Overvoltage detection Under-compensation / Over-compensation Under-current / Over-current Harmonics threshold values Delivery of active power Overtemperature Message for delivery of active power Measured voltage error Switching cycle warning Modbus error C-defect Fig.: Display-Mode Fig.: Bargraph-Mode Fig.: Error message (customisable backlight) 280
281 Chapter 08 Prophi 7 power factor controller Functional principle Single-phase/three-phase electronic measurement system Detection of the reactive and active current portion of the grid via the current and voltage circuit Switching in or out of the capacitor stages via the outputs in the event of deviations in the set power factor Switching of capacitors via contactors or semiconductors Regulation via capacitor air contactors is implemented in an optimised manner Transistor outputs for the near-realtime control of semiconductor switches Fan control Development of fan control via integrated temperature sensors and a fan Uses the signal relay Programming of a lower or upper limit temperature necessary LCD display Graphical display 128 x 64 pixels Display a comprehensive selection of measurement parameters Overtemperature shut-down The overtemperature shut-down switches off the capacitor stages connected This results in the reduction of the interior temperature of the switching cabinet and protects the capacitors Programming of a lower or upper limit temperature as well as the pause time Interface Two independent potential-free RS485 interfaces The Modbus RTU, Modbus KTR, ASCII out, Slave Hybrid, Slave Mode, and Master Mode protocols are available via the RS485s Integration of PLC systems, building management systems or energy management systems Modbus transfer rates: kbit/s 281
282 Chapter 08 Prophi 7 power factor controller Dimension diagrams All dimensions in mm Betr.spg. Meßspg. Meßstrom SERVICE L N L1 N k l (L3) (L2) Typ: Prophi 7-1 Best.nr.: Meßspannung: V~ (L-N) V~ (L-L) Betr.spg: VAC 50/60Hz Ser.nr.: BLINDLEISTUNGSREGLER MADE IN GERMANY P P Schaltausgänge 1-6 Schaltausgänge 7-12 Alarmrelais Rear side view Side view Cut out: ,8 x ,8 mm Typical connection L1 (R) L2 (S) L3 (T) N PE Betriebsspannung Ub Meßspannung Um Meßstrom Im (5A/1A) k l 1. Kondensatorabzweig T 2A T 2A T 6,3A L N L1 N k l P1 P2 K1 Blindleistungsregler Alarmrelais Kondensatorabzweig 1-6 Kondensatorabzweig 7-12 Fig.: Connection example for the Prophi 7 power factor controller 282
283 Chapter 08 Prophi 7 power factor controller Device overview and technical data Prophi 7-I Prophi 7-III Item number Operating voltage 110 to 440 V ~ +/-15% 50/60 Hz Measuring voltage 30 to 440 V ~ (L-N) 50/60 Hz 50 to 760 V ~ (L-L) 50/60 Hz - Measuring voltage 3 x 30 to 440 V ~ (L-N) 50/60 Hz 50 to 760 V ~ (L-L) 50/60 Hz - Changeover target cos phi 1/2 - Outputs Relay outputs (conventional) Transistor outputs (dynamic)*1 - - Interfaces (with Modbus) RS485 * 1 - * 1 Prophi 7 with RS485 and dynamic variant upon request General Prophi 7 Use in low and medium voltage networks L-N or L-L Accuracy voltage measurement (1-phase, L-N or L-L) 1 % Accuracy current measurement (1-phase) 1 % Accuracy cosphi measurement (sum L1-L3) 1 % * 2, * 3 Accuracy power measurement (sum L1-L3) 2 % Accuracy frequency measurement 0,5 % * 3 Accuracy harmonics measurement 2 % RMS momentary value Current, voltage, frequency Effective, reactive and apparent power Power factor Recording of the mean values Power factor Power quality measurement Harmonics per order / current and voltage, 1-phase , odd Distortion factor THD-U in %, 1-phase Distortion factor THD-I in %, 1-phase Measured data recording Mean, minimum, maximum values Displays and inputs / outputs Digital display, 6 buttons Relay outputs (as switch output) 12 See overview of devices Transistor outputs (as switch output) 12 See overview of devices Alarm output (as switch output) 1 Digital input (for tariff changeover) 1 See overview of devices Temperature sensor (internal) 1 * 2 Applies to input currents > 0.2 A and in the cosphi range 0.85 to * 3 In the range from -10 to +18 C and 28 to 55 C an additional error of ±0,2 of the measurement value per K must be taken into account. 283
284 Chapter 08 Prophi 7 power factor controller Communication Interface RS485: 9,6; 19,2; 38,4; 57,6; 115,2; 250; 256 kbps See overview of devices Protocols Modbus RTU Error messages Under-voltage Over-voltage Dropping below the minimum measurement current Measurement current exceedance Insufficient compensation power Delivery of active power Harmonics threshold values Overtemperature Technical data Supply voltage L-L, L-N AC See overview of devices Measurement in which quadrants 4 Networks TN, TT, (IT) Measurement in multi-phase networks 3 ph Measured voltage input Overvoltage category CAT III Measured range, voltage L-N, AC (without potential transformer) See overview of devices Measured range, voltage L-L, AC (without potential transformer) See overview of devices Voltage tolerance range +10 %, -15 % Back-up fuse 2 A 10 A T Measurement surge voltage 4 kv Test voltage relative to ground V AC Frequency measuring range Hz Power consumption max. 5 VA Sampling rate 10 khz (at 50 Hz) Measured current input Signal frequency 45 Hz Hz Nominal current at.../5 A ( /1 A) 5 A (1 A) Minimum measurement current 10 ma Upper measurement current 5.3 A (sinusoidal) Overloading 180 A for 2 sec. Measurement rate 30 (50) measurements / sec. Power consumption approx. 0.2 VA Updating the display 1 time per second Zero voltage triggering < 15 ms Inputs and outputs Number of digital inputs (for tariff changeover) 1, see overview of devices Relay outputs (as switch output) 13, see overview of devices Back-up fuse 6,3 AT Switching voltage max. 250 V AC Switching power max W Fig.: Prophi 7 interface 284

285 Chapter 08 Prophi 7 power factor controller Max. switching frequency Mechanical service life Electrical service life Transistor outputs (as switch output) Switching voltage Switching current Max. switching frequency 50 Hz > 30 x 10 6 switching cycles > 2.8 x 10 5 switching cycles 12, see overview of devices V DC max. 50 ma Alarm output (as switch output) 1 Temperature sensor (internal) 1 Target cosphi changeover (current consumption) Mechanical properties Weight 50 Hz Input 230 V AC 1000 g Device dimensions in mm (H x W x D) 144 x 144 x 53 Protection class per IEC Installation Connecting phase (U / I), Single core, multi-core, fine-stranded Terminal pins, core end sheath Features Display of capacitor currents Display of switch-on times for the individual stages Display of switching cycles per stage Zero voltage triggering Automatic configuration Password protection Environmental conditions Front: IP54, Rear: IP20 Front panel installation 0.08 to 2.5 mm² 1.5 mm² Temperature range Operation: C *4 Storage: C Relative humidity 15 to 95 % Operating altitude ,000 m above sea level Degree of pollution 2 Mounting position any Electromagnetic compatibility Electromagnetic compatibility of equipment Directive 2004/108/EC Fig.: Prophi 7, rear view Electrical appliances for application within Directive 2006/95/EC particular voltage limits Equipment safety Safety requirements for electrical equipment for measurement, regulation, control IEC/EN and laboratory use Part 1: General requirements Part 2 008: Particular requirements for testing IEC/EN and measuring circuits Protection class I = Device with protective conductor Noise immunity Industrial environment DIN EN , Table 2; (IEC ) Emissions Class B: Residential environment DIN EN ; (IEC ) Class A: Industrial environment DIN EN ; (IEC ) Safety Euroope CE labelling Comment: For detailed technical information please refer to the operation manual and the Modbus address list. * 4 Devices with the RS485 interface option are only suitable for an operating temperature range of -10 to +50 C. 285

286 Chapter 08 Prophi 7 power factor controller 286

287 Chapter 08 Capacitor monitoring THE UNIVERSAL CAPACITOR MONITORING SYSTEM Safety 128 MB memory Monitoring Events Modbus-Ethernet gateway Homepage Continuous capacitor monitoring Over-current limit value Under-current limit value Unbalance limit value Temperature limit value Harmonics limit value Voltage limit value Number of switching cycles Safety Timely detection of capacitor aging Timely replacement of contactors Prevention of fire damage Prevention of downtimes Interfaces Ethernet RS232 RS485 Communication Profibus (DP/ V0) Modbus (RTU, TCP, Gateway) TCP/IP BACnet (optional) HTTP (Homepage) FTP (file transfer) SNMP TFTP NTP (time synchronisation) SMTP ( function) DHCP Power quality Harmonics up to 40th harmonic Short term interruptions Transient recorder (> 50 μs) Inrush currents (> 20 ms) Imbalance Full cycle RMS recordings (up to 4.5 min.) Measured data memory 128 MByte Flash 16 MB RAM 2 digital outputs Pulse output kwh / kvarh Switch output Threshold value output Logic output Thermistor input PT100, PT1000, KTY83, KTY84 287


288 Chapter 08 Capacitor monitoring PFC protection Capacitor monitoring Item no.: Increases the safety of PFC systems Monitoring of all overload scenarios by means of the UMG 604E-PRO Timely detection of capacitor overloading as well as short circuits Main features Measurement 3-phase, 3 CTs in the supply line for the PFC system PFC-APP (Jasic monitoring software on UMG 604E-PRO) Monitoring of: Short-circuit to ground, over-current and under-current, overvoltage, unbalance, switching frequency, temperature, etc. Additional, comprehensive network analysis functions Extensive analysis options via GridVis -Basic software Integration into networks with Ethernet or RS485-Modbus RTU Flexible alarm system with monitoring of up to 32 measured values Menu-driven user guidance in plain text on the UMG 604E-PRO homepage Fig.: Capacitor monitoring in a PFC system Fig.: Monitoring of short-circuits to ground, temperature, over-current etc. with the power analyser UMG 604E-PRO Fig.: Monitoring of limit values via UMG 604-PRO homepage 288

289 Chapter 08 PFC power capacitors PFC POWER CAPACITORS Segmented film Low loss Self-healing Long service life High tolerance of inrush currents Optimised metal spraying process Wave-cut film Long service life Highend impregnation technology Good thermal dissipation High quality base materials Fivefold safety Self-healing technology Dry technology Over-pressure disconnector Segmented capacitor film Integrated discharge device Reliable connection technology Connection adapter for reliable long term connections 289

 and high operational reliability Highend impregnation technology Excellent thermal")

290 Chapter 08 3-phase power capacitors Areas of application Motor fixed PFC Group PFC Automatic power factor correction Detuned power factor correction systems Harmonics filter Dynamic power factor correction systems Main features Fivefold safety Self-healing technology Dry technology Over-pressure disconnector Segmented capacitor film Integrated discharge device Fig.: Principle of over-pressure disconnector Long service life (up to 170,000 hours) and high operational reliability Highend impregnation technology Excellent thermal dissipation High quality base materials Reliable connection technology Fig.: Self-healing, segmented capacitor film Connection adapter for reliable long term connections High inrush currents withstand capability Optimised metal spraying process Wave-cut film design High of overload withstand capability Max. over-current: 2.2 In Max. inrush current: 300 x In Fig.: The connection adapter offers a low transfer resistance and a permanent, fixed electrical and mechanical contact 290
291 Chapter 08 3-phase power capacitors Low loss 0.2 Watt/kvar dielectric loss 0.5 Watt/kvar total power dissipation Metallisation (Electrode) Plastic film (Dielectric) Contact layer (Schoopage) Connection Fig.: Contacting (metal spraying) of the metallised Polypropylene film (Dielectric) Technical data Technical data and limit values for power capacitors Standards IEC , EN Output range QR (kvar) Nominal voltage range UR (V) 400 V* 1 Un + 10 % (up to 8 h daily) / Un + 15 % (up to 30 mins daily) Over-voltage U max Un + 20 % (up to 5 mins daily) / Un + 30 % (up to 1 min daily) Overcurrent I max 2.2 x In (at nominal voltage, 50 Hz) Inrush current withstand capability IS Up to 300* In Dielectic losses Pdiel. < 0.2 Watt per kvar Total capacitor losses Pv < 0.5 Watt per kvar Nominal frequency f 50 / 60 Hz Capacitor tolerance % Test voltage (terminal / terminal) VTT 2.15 x Un, AC, 2 s / 1.85 x Un, AC, 18 s Test voltage (terminal / housing) VTC 3,900 V, 2 s Service life expectancy t LD(Co) Up to 170,000 h Ambient temperature Class: -25/D Max. temperature +65 C Max. 24 h average = +45 C Max. 1 year average = +35 C Lowest temperature = -40 C Max. housing temperature Tg +75 C Air humidity H rel max. 95 % Operating altitude max. 4,000 m above sea level Fastening and grounding M12 threaded bolts and house base Safety Dry technology, over-pressure disconnector, self-healing, max. permissible fault current 10,000 A per UL-810 standard Discharging Discharge resistors Housing Aluminium can and sheet steel housing Protection class IP20, indoor installation (optionally with IP54 terminal covering) Dielectric Polypropylene film Impregnation Dry Number of switching cycles per year Max. 60,000 switching cycles in accordance with IEC (with capacitor contactors) * 1 Nominal voltage 400 V illustrated in the catalogue V on request. 291


292 Chapter 08 3-phase power capacitors 3-phase power capacitors in aluminium cans Main features PFC power capacitors in aluminium cans Delta connection With discharge resistors Long service life, low loss Dimension diagrams Capacitor with d = 60 / 70 mm for connection with flat connector 6.3 x 0.8 mm Capacitor with connection adapter ASS 1 d = 60 / 70 mm Capacitor with d = 85 mm for connection with flat connector 9.5 x 1.2 mm Capacitor with connection adapter ASS 2 d = 85 mm Protective cap SK60 / SK70 for Capacitor with d = 60 / 70 mm (not available for capacitors with d = 85 mm) 292
293 Chapter 08 3-phase can type capacitors in aluminium housing Technical data Delta connection with discharge resistor - Protection type: IP00 Frequency: 50 Hz Nominal output in kvar at a nominal voltage of: 400 V 415 V 440 V 480 V 525 V Type Capacitance in µf % Dimensions in mm (D x H) Weight in kg Item no JCP525/4.1-D-ASS 3 x x JCP480/3.6-D-ASS 3 x x JCP525/8.3-D-ASS 3 x x JCP480/7.2-D-ASS 3 x x JCS525/10.0-D-ASS 3 x x JCP440/7.6-D-ASS 3 x x JCS525/12.5-D-ASS 3 x x JCS525/15.0-D-ASS 3 x x JCP440/9.1-D-ASS 3 x x JCP440/12.1-D-ASS 3 x x JCS480/15.5-D-ASS 3 x x JCP400/9.3-D-ASS 3 x x JCP400/10.0-D-ASS 3 x x JCP400/11.7-D-ASS 3 x x JCS440/15.0-D-ASS 3 x x JCP400/20.0-D-ASS 3 x x JCS440/28.2-D-ASS 3 x x JCS440/30.0-D-ASS 3 x x
294 Chapter
295 Chapter 08 Automatic power factor correction systems without reactors AUTOMATIC POWER FACTOR CORRECTION SYSTEMS WITHOUT REACTORS Optimised, thermal design Low loss Self-healing Long service life High tolerance of start-up currents inrush current withstand capability Optimised metal spraying process Wave-cut film design Capacitor contactors with pre-closing contacts for inrush current d amping Long service life Generous space- / power-ratio Generously dimensioned cooling system High quality capacitors High operational reliability Capacitors with fivefold safety system PFC controller with 8-way alarm message Heavy duty sheet steel cabinets Optimised thermal design Exclusive use of quality components 295
296 Chapter 08 Automatic power factor correction systems without reactors Areas of application Automatica Power Factor Correction (APFC) For use in mains supply with low harmonics distortion Converter power (non-linear loads) < 15 % of total connection power Total harmonic distortion of THD-U < 3 % No combined use in networks with de-tuned capacitors No use with critical ripple control systems in the range 270 to 425 Hz Device overview and technical data Power factor correction without reactors Standards DIN, VDE 0660 part 500, EN and EN /2 Design DIN EN part 1, partial type-approved combination Construction type Sheet steel cabinet for versions KB and ES, module for version MO PFC controller Prophi per datasheet or selection table Power capacitors High quality, self-healing, polypropylene 3-phase capacitors using dry technology Contactors Specific capacitor contactors with pre-charging resistors Capacitor protection HRC fuses, 3-phase, per capacitor stage Nominal voltage 400 V, 50 Hz (other voltages on request) Control voltage 230 V, 50 Hz (other voltages on request) Output range kvar (alternative staging, powers on request) Capacitor nominal voltage 440 V without reactors 8 h daily 484 V Voltage withstand capability of capacitors 30 min daily 506 V 5 min 528 V 1 min 572 V Power dissipation Capacitors < 0.5 W/kvar, systems 4 7 W/kvar Switching cycles capacitor contactors max. 100,000 switching cycles Current transformer connection... /1 A,.../5 A Control ratio See overview of variants Discharging With discharge resistors per EN /2 Maximum altitude Up to 2,000 m above sea level Ambient temperature 35 C per DIN EN part 1 (temperature class of the capacitors should be assured with adequate ventilation/cooling at the place of installation!) Protection class Cabinet version = IP32 / Slide-in module = IP00 Type of cooling Forced ventilation (except slide-in modules) Colour Grey, RAL 7035 (other colours on request) Noise emission (FK) < 60 db with closed systems at 1 m distance Connection cross-section and fuse See technical annex 296
 Main features APFC in the steel cabinet For free-standing installation Nominal voltage: 400 V, 3-phase, 50 Hz Protection class: IP32 With natural convection (air exchange) With discharge")
297 Chapter 08 Automatic power factor correction systems without reactors Automatic power factor correction in modular design (up to 500 kvar...) Main features APFC in the steel cabinet For free-standing installation Nominal voltage: 400 V, 3-phase, 50 Hz Protection class: IP32 With natural convection (air exchange) With discharge resistors With power factor controller Prophi 6R/12R Dimension diagrams D Technical data ES8184 (dimensions in mm): H = 1820, W = 800, D = 400 A1 = 374, A2 = 25, A3 = 700, A4 = 100 A5 = 1,480 APFC in modular design ES8184 Nominal output kvar Stage power kvar Control ratio Type Width in mm Weight in kg Item no /25/50/50 1:1:2:2 JF440/150ER6ES8184** /12.5/25/50/50 1:1:2:4:4 JF440/150ER12ES8184** /25/ :1:1:1:1:1 JF440/150ER6ES8184** /20/ :1:2:2:2 JF440/160ER8ES8184** /50/50/50 1:2:2:2 JF440/175ER7ES8184** /12.5/25/25/ :1:2:2:4:4 JF440/175ER14ES8184*** /40/ :2:2:2:2 JF440/180ER9ES8184** / :1:1:1 JF440/200ER4ES8184** /25/ :1:2:2:2 JF440/200ER8ES8184** /12.5/25/ :1:2:4:4... JF440/200/ER16ES8184** /20/ :1:2:2:2:2 JF440/200ER10ES8184** /20/ :1:2:2... JF440/240ER12ES8184*** :1:1:1:1 JF440/250ER5ES8184** /25/ :1:2:2... JF440/250ER10ES8184** /12.5/25/ :1.2:4:4... JF440/250ER20ES8184*** / :1:1:1:1:1 JF440/300ER6ES8184** /25/ :1:2:2... JF440/300ER12ES8184*** /12.5/25/ :1:2:4:4... JF440/300ER24ES8184*** /50/ :1... JF440/400ER8ES8184*** 2 x /50/ :1... JF440/500ER10ES8184*** 2 x Accessories Socket 100 mm high SO 100/800/ Socket 200 mm high SO 200/800/ ** With power factor controller Prophi 6R *** With power factor controller Prophi 12R Other rated voltages, frequencies, kvar-outputs, mechanical configurations or variants with circuit breakers on request. Expansion units, systems in ISO housing as well as audio frequency blocking devices on request. 297
 With discharge resistors Dimension diagrams MO84")

298 Chapter 08 Automatic power factor correction systems without reactors Automatic power factor correction on extractable module, up to 100 kvar Main features Ready-to-install PFC slide-in modules without reactors For cabinet installation Nominal voltage: 400 V, 3-phase, 50 Hz Protection class: IP00 With natural convection (air exchange) With discharge resistors Dimension diagrams MO84 (dimensions in mm): H = 330, W = 703, D = 333 A1 = 290, A2 = 14, A3 = 26.5 Technical data PFC module M084 Nominal output kvar Stage power kvar Control ratio Type Weight in kg Item no JF440/50EK1MO /25 1:1 JF440/50/2EK2MO /20/20 1:2:2 JF440/50/3EK5MO /12.5/25 1:1:2 JF440/50/3/EK4MO /40 1:2 JF440/60/2EK3MO /10/20/20 1:1:2:2 JF440/60/4EK6MO /50 1:2 JF440/75/2EK3MO /25/25 1:1:1 JF440/75/3EK3MO /12.5/25/25 1:1:2:2 JF440/75/4EK6MO /40 1:1 JF440/80/2EK2MO /20/40 1:1:2 JF440/80/3EK4MO /50 1:1 JF440/100/2EK2MO /25/50 1:1:2 JF440/100/3EK4MO /25/25/25 1:1:1:1 JF440/100/4EK4MO /40/40 1:2:2 JF440/100/3EK5MO /12.5/25/50 1:1:2:4 JF440/100/4EK8MO Control module with Prophi 6R controller MCCB, CT terminals and 2 m connection cable (mounted on the capacitor module) Control module with Prophi 12R controller MCCB, CT terminals and 2 m connection cable (mounted on the capacitor module) Accessories Set module fixing rail for Rittal cabinets, left/right, with accessories (for Rittal cabinet MO84) Other rated voltages, frequencies, ouputs, mechanical configurations or variants with circuit breakers on request. 298
299 Chapter 08 De-tuned power factor correction (passive harmonics filter) Schematic diagram Equivalent circuit diagram I V Transformer L T L T I V C Z V C Z V Converter PFC Load PFC Capacitor Transformer Load Fig.: Parallel resonant circuit between transformer and capacitors without reactors Relative impedance Frequency in Hz Fig.: Relative impedance progression for parallel resonant circuit with detuned capacitor and transformer U k = 4 % p = 5.67 % 1...Q C / S N = 5 % 2...Q C / S N = 15 % 3...Q C / S N = 30 % 4...Q C / S N = 50 % 5...Q C / S N = 80 % Q C =PFC output S n =Apparent power of transformer 299
300 Chapter

301 Chapter 08 Automatic de-tuned power factor correction systems AUTOMATIC DE-TUNED POWER FACTOR CORRECTION SYSTEMS Optimised, thermal design Low loss De-tuned version Long service life Optimised filter design Precise filter circuit frequency matching High quality reactors Temperature protection in the event of overload Filter circuit reactors with high linearity and low loss Long service life Generous space- / power-ratio Generously dimensioned cooling system High quality capacitors and filter circuit reactors with 100 % duty cycle High operational reliability Capacitors with fivefold safety PFC controller with 8-way alarm message Optimised thermal design Exclusive use of quality components 301
302 Chapter 08 Automatic de-tuned power factor correction systems Areas of application Automatic power factor correction with reactors For use in mains supply with harmonics distortion Converter power (non-linear loads) > 15 % of the connection power Total harmonic distortion of THD-U > 3 % To preveant cases of resonance Harmonics filtering and improvement of power quality Reduction in reactive energy costs and PFC penalties Device overview and technical data De-tuned power factor correction Technical data Standards DIN, VDE 0660 part 500, EN and EN /2 Design in accordance with DIN EN part 1, partial type-approved combination Construction type Sheet steel cabinet for versions KB and ES, module for version MO Dynamic PFC controller Prophi per datasheet or selection table Power capacitors High quality, self-healing, polypropylene 3-phase capacitors using dry technology Filter circuit reactors Low-loss 3-phase reactors with high linearity, 7%, 14% (other ratings on request), with 100% duty cycle Contactors Specific capacitor contactors Capacitor protection HRC fuses, 3-phase, per capacitor stage Nominal voltage 400 V, 50 Hz (other voltages on request) Control voltage 230 V, 50 Hz (other voltages on request) Output range kvar (alternative staging, outputs on request) Capacitor nominal voltage 440 V with % (detuned), 525 V with 14 % (detuned) At p = % 440 V At p = 14 % 525 V 8 h daily 484 V 577 V Voltage withstand capability of capacitors 30 min daily 506 V 604 V 5 min 528 V 630 V 1 min 572 V 682 V Power dissipation Capacitors < 0.5 W/kvar, systems 4 7 W/kvar System design Permissible harmonics currents Harmonics voltage I 250 Hz I 350 Hz U 250 Hz U 350 Hz FK IN IN 5 % 5 % FK IN IN 5 % 5 % FK IN IN 5 % 5 % Switching cycles capacitor contactors max. 100,000 switching cycles Current transformer connection... /1 A,.../5 A Control ratio See overview of variants Discharging With discharge resistors per EN /2 Maximum altitude Up to 2,000 m above sea level Ambient temperature 35 C per DIN EN part 1 (temperature class of the capacitors should be assured with adequate ventilation/cooling at the place of installation!) Protection class Cabinet version = IP32 / Slide-in module = IP00 Type of cooling Forced ventilation (except slide-in modules) Colour Grey, RAL 7035 (other colours on request) Noise emission (FK) < 60 db with closed systems at 1 m distance Connection cross-section and fuse See technical annex The following reactors can be used in mains supply with ripple control systems: Ripple control frequency De-tuning factor Filter series resonant frequency < 168 Hz p = 14 % fr = 134 Hz Hz p = 14 / 5.67 % fr = 134 / 210 Hz > = p = 8 % fr = 177 Hz > 228 Hz p = 7 % fr = 189 Hz > 350 Hz p = 5.67 % fr = 210 Hz 302

303 Chapter 08 Automatic de-tuned power factor correction systems Automatic de-tuned power factor correction (Harmonics filter), compact design Main features APFC in the steel cabinet For wall mounting Nominal voltage: 400 V, 3-phase, 50 Hz Reactors: 7 % and 14 % Protection class: IP32 Ventilation: From 31 kvar with fan in the cabinet door for forced cooling With discharge resistors With power factor controller Prophi 6R Dimension diagrams Technical data W KB6825 (dimensions in mm): W = 600, H = 800, D = 250, A1 = 410 KB6123 (dimensions in mm): W = 600, H = 1,200, D = 300, A1 = % de-tuned in accordance with series resonant frequency 189 Hz Nominal output kvar Stage power kvar Control ratio Type Design Weight in kg Item no. 15 5/10 1:2 JF440/15ER3KB6825FK7 KB /5/10 1:1:2 JF440/20ER4KB6825FK7 KB /10/10 1:2:2 JF440/25ER5KB6825FK7 KB /12.5/12.5 1:2:2 JF440/31/ER5KB6825FK7 KB /10/20 1:2:4 JF440/35ER7KB6825FK7 KB /12.5/25 1:2:4 JF440/43.75ER7KB6825FK7 KB /20/20 1:2:2 JF440/50ER5KB6825FK7 KB /20/30 1:2:3 JF440/60ER6KB6123FK7 KB /25/37.5 1:2:3 JF440/75ER6KB6123FK7 KB Other rated voltages, frequencies, outputs, reactors, mechanical configurations or variants with circuit breakers on request. 14 % de-tuned in accordance with series resonant frequency 134 Hz Nominal output kvar Stage power kvar Control ratio Type Design Weight in kg Item no. 15 5/10 1:2 JF525/15ER3KB6825FK14 KB /5/10 1:1:2 JF525/20ER4KB6825FK14 KB /10/10 1:2:2 JF525/25ER5KB6825FK14 KB /12.5/12.5 1:2:2 JF525/31/ER5KB6825FK14 KB /10/20 1:2:4 JF525/35ER7KB6825FK14 KB /12.5/25 1:2:4 JF525/43.75ER7KB6825FK14 KB /20/20 1:2:2 JF525/50ER5KB6825FK14 KB /20/30 1:2:3 JF525/60ER6KB6123FK14 KB /25/37.5 1:2:3 JF525/75ER6KB6123FK14 KB Other rated voltages, frequencies, outputs, reactors, mechanical configurations or variants with circuit breakers on request. 303
304 Chapter 08 Automatic de-tuned power factor correction systems 7 % de-tuned power factor correction (harmonics filter), extractable design ES8206 FK7 Main features APFC in steel cabinet (free-standing mounting) Nominal voltage: 400 V, 3-phase, 50 Hz Reactor: 7 % (189 Hz series resonant frequency) Protection class: IP32 Ventilation: From 120 kvar with fan in the cabinet door for forced cooling With power factor controller Prophi 6R/12R Dimension diagrams D ES8206 (dimensions in mm): H = 2.020, W = 800 or 1.600, D = 600 Technical data A1 = 537, A2 = 63, A3 = 737, A4 = 62, A5 = 1,480 Nominal output kvar Stage power kvar Control ratio Type Width in mm Weight in kg Item no /20/30 1:2:3... JF440/60ER6ES8206FK7** /12.5/ :1:2... JF440/75ER6ES8206FK7** /25/50 1:1:2 JF440/100ER4ES8206FK7** /12.5/25/50 1:1:2:4 JF440/100ER8ES8206FK7** /20/40/40 1:1:2:2 JF440/120ER6ES8206FK7** /25/50/50 1:1:2:2 JF440/150ER6ES8206FK7** /50/50/50 1:2:2:2 JF440/175ER7ES8206FK7** :1:1... JF440/200ER4ES8206FK7** /25/ :1:2... JF440/200ER8ES8206FK7** /12.5/25/ :1:2:4.. JF440/200ER16ES8206FK7** :1:1... JF440/250/ER5ES8206FK7** /25/ :1:2... JF440/250ER10ES8206FK7** :1:1... JF440/300ER6ES8206FK7** /25/ :1:2... JF440/300ER12ES8206FK7*** :1:1... JF440/350ER7ES8206FK7-1S*** :1:1... JF440/350ER7ES8206FK7*** 1, / :1:1... JF440/400ER8ES8206FK7-1S*** : JF440/400ER8ES8206FK7*** 1,600 2x :1:1... JF440/450ER9ES8206FK7*** 1, / :1:1... JF440/500ER10ES8206FK7*** 1, / :1:1... JF440/550ER11ES8206FK7*** 1,600 2x :1:1... JF440/600ER12ES8206FK7*** 1,600 2x Accessories 100 mm high socket for easy supply cable connection SO 100 / 800 / mm high socket for easy supply cable connection SO 200 / 800 / Other rated voltages, frequencies, outputs, reactors, mechanical configurations or variants with circuit breakers on request. ** With Prophi 6R, *** With Prophi 12R 304
 Nominal voltage: 400 V, 3-phase, 50 Hz Reactors: 14 % (134 Hz series resonant frequency) Protection class: IP32 Ventilation: From 120 kvar with fan in the cabinet door for")
305 Chapter 08 Automatic de-tuned power factor correction systems 14 % de-tuned power factor correction (harmonics filter), extractable design ES8206 FK14 Main features APFC in steel cabinet (free-standing mounting) Nominal voltage: 400 V, 3-phase, 50 Hz Reactors: 14 % (134 Hz series resonant frequency) Protection class: IP32 Ventilation: From 120 kvar with fan in the cabinet door for forced cooling With power factor controller Prophi 6R/12R Dimension diagrams D ES8206 (dimensions in mm): H = 2.020, W = 800 or 1.600, D = 600 Technical data A1 = 537, A2 = 63, A3 = 737, A4 = 62, A5 = 1,480 Nominal output kvar Stage power kvar Control ratio Type Width in mm Weight in kg Item no /20/30 1:2:3 JF525/60ER6ES8206FK14** /12.5/25/25 1:1:2:2 JF525/75ER6ES8206FK14** /25/50 1:1:2 JF525/100ER4ES8206FK14** /12.5/25/50 1:1:2:4 JF525/100ER8ES8206FK14** /20/40/40 1:1:2:2 JF525/120ER6ES8206FK14** /25/50/50 1:1:2:2 JF525/150ER6ES8206FK14** /50/50/50 1:2:2:2 JF525/175ER7ES8206FK14** :1:1:1 JF525/200ER4ES8206FK14** /25/ :1:2... JF525/200ER8ES8206FK14** /12.5/25/ :1:2:4... JF525/200ER16ES8206FK14** :1:1... JF525/250/ER5ES8206FK14** /25/ :1:2... JF525/250ER10ES8206FK14** :1:1... JF525/300ER6ES8206FK14** /25/ :1:2... JF525/300ER12ES8206FK14*** :1:1... JF525/350ER7ES8206FK14-1S*** :1:1... JF525/350ER7ES8206FK14*** 1, / :1:1... JF525/400ER8ES8206FK14-S*** :1:1... JF525/400ER8ES8206FK14*** 1,600 2x :1:1... JF525/450ER9ES8206FK14*** 1,600 2x :1:1... JF525/500ER10ES8206FK14*** 1, / :1:1... JF525/550ER11ES8206FK14*** 1, / :1:1... JF525/600ER12ES8206FK14*** 1, / Accessories 100 mm high socket for easy supply cable connection SO 100 / 800 / mm high socket for easy supply cable connection SO 200 / 800 / Other rated voltages, frequencies, outputs, reactors, mechanical configurations or variants with circuit breakers on request. ** With Prophi 6R, *** With Prophi 12R 305
 and 14 % (134 Hz) Protection class:")
306 Chapter 08 De-tuned capacitor modules De-tuned capacitor modules, extractable design Main features Ready-to-install, de-tuned PFC slide-in modules Completely mounted and wired with capacitors, reactors, contactors and HRC-fuses For slide-in installation in existing PFC or switchgear cabinets Nominal voltage: 400 V, 3-phase, 50 Hz Reactors: 7 % (189 Hz) and 14 % (134 Hz) Protection class: IP32 Ventilation: Natural (care must be taken to ensure sufficient ventilation) With discharge resistors Dimension diagrams Dimensions in mm: H = 330, W = 703, D = 533 A1 = 290, A2 = 14, A3 =
307 Chapter 08 De-tuned capacitor modules Technical data 7 % de-tuned capacitor modules (189 Hz) MO86FK7 (width 800 mm, depth 600 mm) Nominal output Stage power Control Type Weight Item no. kvar kvar ratio in kg JF440/10EK1MO86FK JF440/12.5EK1MO86FK JF440/20EK1MO86FK JF440/25/EK1MO86FK JF440/40EK1MO86FK JF440/50EK1MO86FK /2 10 1:1 JF440/20/2EK2MO86FK / :1 JF440/25/2EK2MO86FK /2 10/20 1:2 JF440/30/2EK2MO86FK /2 20 1:1 JF440/40/2EK2MO86FK /3 10/10/20 1:1:2 JF440/40/3EK2MO86FK /2 25 1:1 JF440/50/2EK2MO86FK /2 25/50 1:2 JF440/75/2EK2MO86FK /2 40 1:1 JF440/80/2EK2MO86FK /2 50 1:1 JF440/100/2EK2MO86FK Other rated voltages, frequencies, outputs, reactors, mechanical configurations (e.g. 500 mm switch cabinet depth) or variants with circuit breakers on request. Accessories, see page % de-tuned capacitor modules (134 Hz) MO86FK14 (width 800 mm, depth 600 mm) Nominal output Stage power Control Type Weight Item no. kvar kvar ratio in kg JF525/10EK1MO86FK JF525/12.5EK1MO86FK JF525/20EK1MO86FK JF525/25EK1MO86FK JF525/40EK1MO86FK JF525/50EK1MO86FK /2 10 1:1 JF525/20/2E2MO86FK / :1 JF525/25/2EK2MO86FK /2 10/20 1:2 JF525/30/2EK2MO86FK /2 20 1:1 JF525/40/2EK2MO86FK /3 10/10/20 1:1:2 JF525/40/3EK3MO86FK /2 25 1:1 JF525/50/2EK2MO86FK /2 25/50 1:2 JF525/75/2EK2MO86FK /2 40 1:1 JF525/80/2EK2MO86FK /2 50 1:1 JF525/100/2EK2MO86FK Other rated voltages, frequencies, outputs, reactors, mechanical configurations or variants (e.g. 500 mm switch cabinet depth) with circuit breakers on request. Accessories, see page
308 Chapter 08 Dynamic power factor correction systems (real time PFC) Mains supply L1 L2 L3 Load Super-fast semiconductor fuses Thyristor 1... n Realtime PFC controller Thyristor module Filter circuit reactors Prophi 6/12T Switching time: < 20 ms Capacitors 308

309 Chapter 08 Dynamic power factor correction systems (real time PFC) DYNAMIC POWER FACTOR CORRECTION SYSTEMS (REAL TIME PFC) Optimised, thermal design Long service life De-tuned version Minimised grid distortion Hardly any mains supply distortion Switching at zero point transition No inrush currents Stabilisation of the mains supply voltage Reduction of harmonics distortion Switching times < 20 ms Long service life Generous space- / power-ratio Generously dimensioned cooling system High quality capacitors and filter circuit reactors High operational reliability Capacitors with fivefold safety PFC controller with 8-way alarm message Filter circuit reactors with high linearity and 100% duty cycle Optimised thermal design Exclusive use of quality components Thyristor switch for capacitor connection without mains supply distortion 309
 > 15 % of the connection power Total harmonic distortion of THD-U > 3 % Harmonics filtering and improvement of power quality Reduction in reactive current costs")
 Lift systems and cranes Start-up compensation for large motors Drilling rigs in oil production Wind turbines Welding technology Steel production Plastic injection moulding systems Fishing vessels I")
310 Chapter 08 Dynamic power factor correction systems (real time PFC) Areas of application Use in applications with fast and high load changes APFC in LVDB For use in mains supply with harmonics burden Converter power (non-linear loads) > 15 % of the connection power Total harmonic distortion of THD-U > 3 % Harmonics filtering and improvement of power quality Reduction in reactive current costs Stabilisation of the mains supply voltage Typical applications Automotive industry (welding systems, presses, etc.) Lift systems and cranes Start-up compensation for large motors Drilling rigs in oil production Wind turbines Welding technology Steel production Plastic injection moulding systems Fishing vessels I in A Control signal Current without dynamic PFC With dynamic PFC in sec Fig.: Current reduction by means of dynamic PFC Particular advantages Voltage With dynamic PFC Without dynamic PFC Improved power quality, i.e. avoidance of high start-up currents for the power capacitors Significant extending the service life for the PFC system Safety of the complete system is significantly increased (i.e. avoidance of damages through defective contactors and subsequent exploding capacitors) Ultra-fast compensation of power factor, resulting in a reduction in the reactive current costs and kwh losses Voltage stabilisation (e.g. contactors support during the start-up phase of large motors) Improved utilisation of the energy distribution (transformers, cabling, switchgear, etc.) through the elimination of power peaks Shortening of process times (e.g. welding) due to stabilized voltage Current Without dynamic PFC With dynamic PFC Fig.: Comparison of current and voltage with and without dynamic PFC when starting up a large motor 310
311 Chapter 08 Dynamic power factor correction systems (real time PFC) Device overview and technical data Dynamic power factor correction Technical data Standards DIN, VDE 0660 part 500, EN and EN /2 Design in accordance with DIN EN part 1, partial type-approved combination Construction type Sheet steel cabinet for versions KB and ES, module for version MO Dynamic power factor controller Prophi T version per datasheet or selection table Power capacitors High quality, self-healing, polypropylene 3-phase capacitors using dry technology Filter circuit reactors Low-loss 3-phase reactors with high linearity, 7%, 14% (other reactor ratings on request) Electronic switch (t < 20 ms) Thyristor actuator for switching in the zero point transition (to avoid network disturbances) Capacitor protection Ultra-fast electronic fuses Nominal voltage 400 V, 50 Hz (other voltages on request) Control voltage 230 V, 50 Hz (other voltages on request) Output range kvar (alternative staging, outputs on request) Capacitor nominal voltage 440 V with out reactors and % (choked), 525 V with 14 % (reactors) At p = % 440 V At p = 14 % 525 V 8 h daily 484 V 577 V Voltage withstand capability of capacitors 30 min daily 506 V 604 V 5 min 528 V 630 V 1 min 572 V 682 V Power dissipation Capacitors < 0.5 W/kvar, systems 4 7 W/kvar System design Permissible harmonics currents Harmonics voltage I 250 Hz I 350 Hz U 250 Hz U 350 Hz FK IN IN 5 % 5 % FK IN IN 5 % 5 % FK IN IN 5 % 5 % Current transformer connection... /1 A,.../5 A Control ratio See overview of variants Discharging With discharge resistors per EN /2 Maximum altitude Up to 2,000 m above sea level Ambient temperature 35 C per DIN EN part 1 (temperature class of the capacitors should be assured with adequate ventilation/cooling at the place of installation!) Protection class Cabinet version = IP32 / Slide-in module = IP00 Type of cooling Forced ventilation (except slide-in modules) Colour Grey, RAL 7035 Noise emission (FK) < 60 db with closed systems at 1 m distance Connection cross-section and fuse See technical annex The following reactors can be used in mains supply with ripple control systems: Mains supply ripple control frequency De-tuning factor Filter series resonant frequency < 168 Hz p = 14 % fr = 134 Hz Hz p = 14 / 5.67 % fr = 134 / 210 Hz > = p = 8 % fr = 177 Hz > 228 Hz p = 7 % fr = 189 Hz > 350 Hz p = 5.67 % fr = 210 Hz 311
312 Chapter 08 De-tuned, dynamic power factor correction systems (real time PFC) 7 % de-tuned dynamic power factor correction, extractable design ES8206 FKTh Main features Dynamic (t < 20 ms), de-tuned APFC in extractable design in steel cabinet Modular cabinet for free-standing mounting (expandable in output) Nominal voltage: 400 V, 3-phase, 50 Hz Reactors: 7 % (189 Hz series resonant frequency) Protection class: IP32 Ventilation: From 120 kvar with fan in PFC cabinet door for forced cooling With power factor controller Prophi 6T / 12T Dimension diagrams D W Technical data ES8206 (dimensions in mm): H = 2,020, W = 800, D = 600, A1 = 537 A2 = 63, A3 = 737, A4 = 62, A5 = 1,480 Nominal output kvar Stage power kvar Control ratio Type Width in mm Weight in kg Item no /20/30 1:2:3 JF440/60ER6ES8206FK7Th** /12.5/25/25 1:1:2:2 JF440/75ER6ES8206FK7Th** /25/50 1:1:2 JF440/100ER4ES8206FK7Th** /20/40/40 1:1:2:2 JF440/120/ER6ES8206FK7Th** /12.5/25/50 1:1:2:4 JF440/100ER8ES8206FK7Th** /25/37.5/50 1:2:3:4 JF440/125ER10ES8206FK7Th** /12.5/25/ :1:2:4... JF440/150ER12ES8206FK7Th** /25/50/50 1:1:2:2 JF440/150ER6ES8206FK7Th** /25/37.5/ :2:3:4... JF440/175ERES8206FK7Th** /50/50/50 1:1:1:1 JF440/200ER4ES8206FK7Th** /25/ :1:2... JF440/200ER8ES8206FK7Th** /12.5/25/ :1:2:4... JF440/200ER16ES8206FK7Th** / :1... JF440/250ER5ES8206FK7Th** /25/ :1:2... JF440/250ER10ES8206FK7Th** /12.5/25/ :1:2:4... JF440/250ER20ES8206FK7Th*** / :1... JF440/300ER6ES8206FK7Th** /25/ :1:2... JF440/300ER12ES8206FK7Th*** / :1... JF440/400ER8ES8206FK7Th*** 1,600 2 x / :1... JF440/500ER10ES8206FK7Th*** 1, / / :1... JF440/600ER12ES8206FK7Th*** 1,600 2 x Accessories 100 mm high socket for easy supply cable connection SO 100 / 800 / mm high socket for easy supply cable connection SO 200 / 800 / Other rated voltages, frequencies, outputs, reactors, mechanical configurations or variants with circuit breakers on request. ** With Prophi 6T, *** With Prophi 12T 312
313 Chapter 08 De-tuned, dynamic power factor correction systems (real time PFC) 14 % de-tuned dynamic power factor correction, extractable design ES8206 Th Main features Dynamic (t < 20 ms), de-tuned APFC in extractable design in steel cabinet Modular cabinet for free-standing mounting (expandable in output) Nominal voltage: 400 V, 3-phase, 50 Hz Reactors: 14 % (134 Hz series resonant frequency) Protection class: IP32 Ventilation: From 120 kvar with fan in PFC cabinet door for forced cooling With power factor controller Prophi 6T / 12T Dimension diagrams D W Technical data ES8206 (dimensions in mm): H = 2,020, W = 800, D = 600, A1 = 537 A2 = 63, A3 = 737, A4 = 62, A5 = 1,480 Nominal output kvar Stage power kvar Control ratio Type Width in mm Weight in kg Item no /20/30 1:2:3 JF525/60ER6ES8206FK14Th* /12.5/25/25 1:1:2:2 JF525/75ER6ES8206FK14Th** /25/50 1:1:2 JF525/100ER4ES8206FK14Th** /20/40/40 1:1:2:2 JF525/120/ER6ES8206FK14Th** /12.5/25/50 1:1:2:4 JF525/100ER8ES8206FK14Th** /25/37.5/50 1:2:3:4 JF525/125ER10ES8206FK14Th** /12.5/25/ :1:2:4... JF525/150ER12ES8206FK14Th** /25/50/50 1:1:2:2 JF525/150ER6ES8206FK14Th** /25/37.5/ :2:3:4... JF525/175ERES8206FK14Th** /50/50/50 1:1:1:1 JF525/200ER4ES8206FK14Th** /25/ :1:2... JF525/200ER8ES8206FK14Th** /12.5/25/ :1:2:4... JF525/200ER16ES8206FK14Th** / :1... JF525/250ER5ES8206FK14Th** /25/ :1:2... JF525/250ER10ES8206FK14Th** /12.5/25/ :1:2:4... JF525/250ER20ES8206FK14Th*** / :1... JF525/300ER6ES8206FK14Th** /25/ :1:2... JF525/300ER12ES8206FK14Th*** / :1... JF525/400ER8ES8206FK14Th*** 1,600 2 x / :1... JF525/500ER10ES8206FK14Th*** 1, / / :1... JF525/600ER12ES8206FK14Th*** 1,600 2 x Accessories 100 mm high socket for easy supply cable connection SO 100 / 800 / mm high socket for easy supply cable connection SO 200 / 800 / Other rated voltages, frequencies, powers, reactors, mechanical configurations or variants with circuit breakers on request. ** With Prophi 6R, *** With Prophi 12R 313
, 14 % (134 Hz series resonant frequency) Protection class: IP32")
314 Chapter 08 De-tuned, dynamic PFC modules De-tuned, dynamic PFC modules extractable design Main features Dynamic (t < 20 ms), de-tuned APFC in extractable desgin in steel cabinet For installation in existing switch gear or PFC cabinets Nominal voltage: 400 V, 3-phase, 50 Hz Reactors: 7 % (189 Hz series resonant frequency), 14 % (134 Hz series resonant frequency) Protection class: IP32 Ventilation: Natural cooling (care must be taken to ensure sufficient ventilation) With discharge resistors Dimension diagrams W D dimensions in mm: H = 330, W = 703, D = 550 A1 = 290, A2 = 14, A3 =
315 Chapter 08 De-tuned, dynamic PFC modules Technical data 7 % de-tuned capacitor modules MO86FK7Th (width 800 mm, depth 600 mm) Nominal output Stage power Control Type Weight Item no. kvar kvar ratio in kg JF440/10EK1MO86FK7Th JF440/12.5EK1MO86FK7Th JF440/20EK1MO86FK7Th JF440/25/EK1MO86FK7Th JF440/40EK1MO86FK7Th JF440/50EK1MO86FK7Th /2 10 1:1 JF440/20/2EK2MO86FK7Th / :1 JF440/25/2EK2MO86FK7Th /2 10/20 1:2 JF440/30/2EK2MO86FK7Th /2 20 1:1 JF440/40/2EK2MO86FK7Th /2 25 1:1 JF440/50/2EK2MO86FK7Th /2 25/50 1:2 JF440/75/2EK2MO86FK7Th /2 40/40 1:1 JF440/80/2EK2MO86FK7Th /2 50/50 1:1 JF440/100/2EK2MO86FK7Th % de-tuned capacitor modules MO86FK14Th (width 800 mm, depth 600 mm) Nominal output Stage power Control Type Weight Item no. kvar kvar ratio in kg JF525/10EK1MO86FK14Th JF525/12.5EK1MO86FK14Th JF525/20EK1MO86FK14Th JF525/25EK1MO86FK14Th JF525/40EK1MO86FK14Th JF525/50EK1MO86FK14Th /2 10 1:1 JF525/20/2E2MO86FK14Th / :1 JF525/25/2EK2MO86FK14Th /2 10/20 1:2 JF525/30/2EK2MO86FK14Th /2 20 1:1 JF525/40/2EK2MO86FK14Th /2 25 1:1 JF525/50/2EK2MO86FK14Th /2 25/50 1:2 JF525/75/2EK2MO86FK14Th /2 40/40 1:1 JF525/80/2EK2MO86FK14Th /2 50/50 1:1 JF525/100/2EK2MO86FK14Th Other rated voltages, frequencies, outputs, reactors, mechanical configurations or variants with circuit breakers on request. 315

 400 V / 50 Hz Linear loads Dynamic APFC (hybrid")
316 Chapter 08 Communications architecture: PFC and power quality analysis combined Main distribution 13.8 kv T-1 = 2000 kva Prophi 6R/6T Modbus UMG 604-PRO GridVis Ethernet (TCP/IP) 400 V / 50 Hz Linear loads Dynamic APFC (hybrid solution) Non-linear, dynamic loads 316
317 Chapter 08 PFC-Accessories POWER FACTOR CORRECTION SPARE PARTS AND ACCESSORIES Reactors Capacitor contactors Capacitors HRC fuses 317
318 Chapter 08 Spare parts list Component selection table for a nominal voltage 400 V 50 Hz De-tuned power factor correction Detuning factor % Reactive output in kvar Capacitor Item no x JCP525 / 4.17-D Filter circuit reactors Item no. FKD 2.50 kvar / 7 % Capacitor contactor Item no. KS 12.5 kvar / K3-18ND Cable diameter (mm²) HRC fuse socket Item no. 4 NH / RSUmB / Gr00 / 3p HRC fuses Item no. NHS10Gr x JCP525 / 8.33-D FKD 5.00 kvar / 7 % KS 12.5 kvar / K3-18ND NH / RSUmB / Gr00 / 3p NHS10Gr x JCS525 / 10.0-D FKD 6.25 kvar / 7 % KS 12.5 kvar / K3-18ND NH / RSUmB / Gr00 / 3p NHS16Gr x JCP400 / 9.30-D FKD 10.0 kvar / 7 % KS 12.5 kvar / K3-18ND NH / RSUmB / Gr00 / 3p NHS25Gr x JCP400 / 11.7-D FKD 12.5 kvar / 7 % KS 12.5 kvar / K3-18ND NH / RSUmB / Gr00 / 3p NHS25Gr x JCP400 / 9.30-D x JCP525 / 8.30-D FKD 15 kvar / 7 % KS 20.0 kvar / K3-24A NH / RSUmB / Gr00 / 3p NHS35Gr x JCP400 / 9.30-D FKD 20.0 kvar / 7 % KS 20.0 kvar / K3-24A NH / RSUmB / Gr00 / 3p NHS50Gr x JCP400 / 11.7-D FKD 25.0 kvar / 7 % KS 25.0 kvar / K3-32A NH / RSUmB / Gr00 / 3p NHS63Gr x JCP400 / 9.30-D FKD 30.0 kvar / 7 % KS 50.0 kvar / K3-62A NH / RSUmB / Gr00 / 3p NHS63Gr x JCS440 / 15.0-D FKD 40.0 kvar / 7 % KS 50.0 kvar / K3-62A NH / RSUmB / Gr00 / 3p NHS100Gr x JCP400 / 11.7-D FKD 50.0 kvar / 7 % KS 50.0 kvar / K3-62A NH / RSUmB / Gr00 / 3p NHS125Gr x JCP525 / 4.17-D FKD 2.50 kvar / 14 % KS 12.5 kvar / K3-18ND NH / RSUmB / Gr00 / 3p NHS10Gr x JCP525 / 7.70-D FKD 5.00 kvar / 14 % KS 12.5 kvar / K3-18ND NH / RSUmB / Gr00 / 3p NHS10Gr x JCP480 / 7.20-D FKD 6.25 kvar / 14 % KS 12.5 kvar / K3-18ND NH / RSUmB / Gr00 / 3p NHS16Gr x JCS525 / 15.0-D FKD 10.0 kvar / 14 % KS 12.5 kvar / K3-18ND NH / RSUmB / Gr00 / 3p NHS25Gr x JCS525 / 12.5-D x JCP525 / 5.90-D FKD 12.5 kvar / 14 % KS 12.5 kvar / K3-18ND NH / RSUmB / Gr00 / 3p NHS25Gr x JCS525 / 12.5-D x JCP525 / 10.0-D FKD 15 kvar / 14 % KS 20.0 kvar / K3-24A NH / RSUmB / Gr00 / 3p NHS35Gr x JCS525 / 12.5-D x JCS525 / 15.0-D FKD 20.0 kvar / 14 % KS 25.0 kvar / K3-32A NH / RSUmB / Gr00 / 3p NHS50Gr x JCS525 / 12.5-D FKD 25.0 kvar / 14 % KS 50.0 kvar / K3-62A NH / RSUmB / Gr00 / 3p NHS63Gr x JCS525 / 15.0-D FKD 30.0 kvar / 14 % KS 50.0 kvar / K3-62A NH / RSUmB / Gr00 / 3p NHS63Gr x JCS525 / 12.5-D x JCS525 / 15.0-D FKD 40.0 kvar / 14 % KS 50.0 kvar / K3-62A NH / RSUmB / Gr00 / 3p NHS100Gr x JCS525 / 12.5-D x JCS525 / 15.0-D FKD 50.0 kvar / 14 % KS 50.0 kvar / K3-62A NH / RSUmB / Gr00 / 3p NHS125Gr
319 Chapter 08 Spare parts list Component selection table for dynamic PFC Dynamic power factor correction Detuning factor % Reactive output in kvar Capacitor Item no x JCP525 / 4.17-D Filter circuit reactors Item no. FKD 2.50 kvar / 7 % Thyristor actuator Item no. TSM-LC10 THY Cable diameter (mm²) HRC fuse socket Item no. 4 NH / RSUmB / Gr00 / 3p HRC fuses Item no. NH00/20A/Ultra Quick x JCP525 / 8.33-D FKD 5.00 kvar / 7 % TSM-LC10 THY NH / RSUmB / Gr00 / 3p NH00/20A/Ultra Quick x JCS525 / 10.0-D FKD 6.25 kvar / 7 % TSM-LC10 THY NH / RSUmB / Gr00 / 3p NH00/20A/Ultra Quick x JCP400 / 9.30-D FKD 10.0 kvar / 7 % TSM-LC10 THY NH / RSUmB / Gr00 / 3p NH00/25A/Ultra Quick x JCP400 / 11.7-D FKD 12.5 kvar / 7 % TSM-LC10 THY NH / RSUmB / Gr00 / 3p NH00/25A/Ultra Quick x JCP400 / 9.30-D x JCP525 / 8.30-D FKD 15 kvar / 7 % TSM-LC25 THY NH / RSUmB / Gr00 / 3p NH00/50A/Ultra Quick x JCP400 / 9.30-D FKD 20.0 kvar / 7 % TSM-LC25 THY NH / RSUmB / Gr00 / 3p NH00/50A/Ultra Quick x JCP400 / 11.7-D FKD 25.0 kvar / 7 % TSM-LC25 THY NH / RSUmB / Gr00 / 3p NH00/63A/Ultra Quick x JCP400 / 9.30-D FKD 30.0 kvar / 7 % TSM-LC50 THY NH / RSUmB / Gr00 / 3p NH00/63A/Ultra Quick x JCS440 / 15.0-D FKD 40.0 kvar / 7 % TSM-LC50 THY NH / RSUmB / Gr00 / 3p NH00/100A/Ultra Quick x JCP400 / 11.7-D FKD 50.0 kvar / 7 % TSM-LC50 THY NH / RSUmB / Gr00 / 3p NH00/125A/Ultra Quick x JCP525 / 4.17-D FKD 2.50 kvar / 14 % TSM-LC10 THY NH / RSUmB / Gr00 / 3p NH00/20A/Ultra Quick x JCP525 / 7.70-D FKD 5.00 kvar / 14 % TSM-LC10 THY NH / RSUmB / Gr00 / 3p NH00/20A/Ultra Quick x JCP480 / 7.20-D FKD 6.25 kvar / 14 % TSM-LC10 THY NH / RSUmB / Gr00 / 3p NH00/20A/Ultra Quick x JCS525 / 15.0-D FKD 10.0 kvar / 14 % TSM-LC10 THY NH / RSUmB / Gr00 / 3p NH00/25A/Ultra Quick x JCS525 / 12.5-D x JCP525 / 5.90-D FKD 12.5 kvar / 14 % TSM-LC10 THY NH / RSUmB / Gr00 / 3p NH00/25A/Ultra Quick x JCS525 / 12.5-D x JCP525 / 10.0-D FKD 15 kvar / 14 % TSM-LC25 THY NH / RSUmB / Gr00 / 3p NH00/50A/Ultra Quick x JCS525 / 12.5-D x JCS525 / 15.0-D FKD 20.0 kvar / 14 % TSM-LC25 THY NH / RSUmB / Gr00 / 3p NH00/50A/Ultra Quick x JCS525 / 12.5-D FKD 25.0 kvar / 14 % TSM-LC25 THY NH / RSUmB / Gr00 / 3p NH00/63A/Ultra Quick x JCS525 / 15.0-D FKD 30.0 kvar / 14 % TSM-LC50 THY NH / RSUmB / Gr00 / 3p NH00/63A/Ultra Quick x JCS525 / 12.5-D x JCS525 / 15.0-D FKD 40.0 kvar / 14 % TSM-LC50 THY NH / RSUmB / Gr00 / 3p NH00/100A/Ultra Quick x JCS525 / 12.5-D x JCS525 / 15.0-D FKD 50.0 kvar / 14 % TSM-LC50 THY NH / RSUmB / Gr00 / 3p NH00/125A/Ultra Quick
 MCCB, CT terminals and 2 m connection cable (mounted on the capacitor module) 3 50.10.")
320 Chapter 08 PFC-Accessories PFC-Accessories Dynamic power factor correction Thyristor control modules Item Weight in kg Item no. Control module with Prophi 6T controller (for 6 capacitor stages) MCCB, CT terminals and 2 m connection cable (mounted on the capacitor module) Control module with Prophi 12T controller (for 12 capacitor stages) MCCB, CT terminals and 2 m connection cable (mounted on the capacitor module) Fixing rails Item Weight in kg Item no. Set fixing rail, left / right (for Rittal cabinets MO84) Set fixing rail, left / right (for Rittal cabinets MO86) Accessory Passive harmonics filter Control modules Item Control module with Prophi 6R controller, 6 stages (relay outputs) MCCB, CT terminals and 2 m connection cable (mounted on the capacitor module) Control module with Prophi 12R controller, 12 stages (relay outputs) MCCB, CT terminalsand 2 m connection cable (mounted on the capacitor module) Item no Fixing rail for slide-in modules in Rittal switch gear cabinets Item Item no. Set fixing rail, left / right (for Rittal cabinets MO84) Set fixing rail, left / right (for Rittal cabinets MO86) Power analyser with Ethernet connection and PQ analysis software Item Item no. UMG 508 With display, front panel mounting UMG 604E-PRO DIN rail mounting See main catalogue chapter 02 "Energy and power quality measurement products" for other variants 320

321 Chapter 08 Electronic circuit breaker Electronic circuit breaker (thyristor controller) Main features Areas of application: dynamic compensation of rapid processes (presses, welding machines, lifts, power plants, wind turbines, etc.) Component for developing dynamic compensation systems Optimisation of switching behaviour by microprocessor-controlled adaptation to unchoked or choked capacitor branches No wearing parts Monitoring of voltage, phase, temperature Instant switching No mains feedback from switching operations (transients) No auxiliary voltage required Maintenance-free Long service life No switching noise Improved connection technology (connectors) Improved temperature management Dimension diagrams 157,0 mm 146,0 mm 173,1 mm com trigger-signal TSM-LC-N electronic thyristor-module for capacitor switching gn: ok gn: trigger red:error red flash: overtemp. 200,0 mm 170,0 mm C1 C1 L1 L1 L3 L3 C3 C3 34,0 mm 5,5 mm Technical data Nominal output kvar Nominal voltage V (50/60 Hz) Control V DC Type Dimensions in mm (W x H x D) Superfast fuse in A Weight in kg Item no. 12, TSM-LC 10 THY (400 V / 12,5 kvar) 162 x 150 x , TSM-LC-N 25 THY (400 V / bis 25 kvar) 157 x 200 x , TSM-LC-N 50 THY (400 V / bis 50 kvar) 157 x 200 x , TSM-LC-N690 THY (690 V / bis 50 kvar) 157 x 200 x ,
322 Chapter 09 Services 09 Services Services GridVis software training Commissioning Other services Checking the power quality and the IT-compliant energy distribution Power analysers for leasing Analysis and dimensioning of a power factor correction system PFC maintenance with performance per maintenance contract TeamViewer sessions Remote maintenance contracts on an annual basis Calibration with calibration reports Page


323 Chapter 09 Services SERVICES 323

324 Chapter 09 Services From planning to commissioning After we have developed your technical solution, executed it and commissioned it, we continue to support you further: Training of your personnel Commissioning, maintenance and support of the systems Regular training for safe handling of energy management, power quality and our products and system solutions On-site power analysis of existing systems Training: GridVis software GridVis is an elementary module for your energy management and power quality monitoring systems. GridVis serves to facilitate the programming and configuration of power analysers, universal measurement devices, data loggers and power factor controllers, as well as the configuration, storage, display, processing, analysis and evaluation of the measured data. Although GridVis constitutes a highly intuitive software solution in use, the large scope of functionality should be noted. In order to ensure your personnel a rapid and efficient start, we recommend one day of GridVis basic training as a minimum. The aims of this training programme are: Starting out with the GridVis software Installation of GridVis -Service (planner version, limited to 5 devices) as a full version for training purposes on your laptops. The laptop must have administrator rights in order to facilitate the software installation! Acquisition of the most important basic functions of the software GridVis 324
325 Chapter 09 Services This training includes: Setting up the program Establishing user administration Creating projects Setting up UMG measurement devices Creating company-specific measurement structures Configuration of UMG measuring devices Configuration of the TCP/IP and Modbus connections Calling up online measured values Calling up and saving historical measured values Graphic display of the measured values Creating graph sets and topologies Setting threshold values (possible alarm routes) Reports / costs and quality reporting Access and configuration of the UMGs via web browser The following subjects are only briefly mentioned and no detailed training is provided: - Programming of the UMGs with Jasic - APPs Training Description GridVis Basic training for beginners, 2 days *1 Item no. DL GridVis Expert training, main topic: Major projects & Connectivity, 1 day *1 Prerequisite: Basic knowledge of GridVis. GridVis Expert training, main topic: Energy management, 1 day *1 Prerequisite: Basic knowledge of GridVis. GridVis Expert training - Power quality & RCM, 1 day *1 Prerequisite: Basic knowledge of GridVis. In-house training at customer site, 1 day *2 Seminar contents after consultation. GridVis Webinar training, 1 hour *2 Seminar contents after consultation. DL DL DL DL DL * 1 All course fees include seminar fees, refreshments, seminar materials and lunch. Location: Janitza electronics GmbH / Lahnau Travel costs and accommodation must be covered by the seminar participants. 325

326 Chapter 09 Services Commissioning Janitza possesses decades of know-how in the field of energy measurement technology and complete monitoring systems. We shall be happy to support you from concept generation right through to the commissioning of your monitoring solutions. This encompasses the complete bandwidth of tasks: Installation of the GridVis system software Creation of customer projects in GridVis with measurement point structure Parametrisation of the measurement devices, data loggers and other components in the system according to customer specifications (VBI form for preparation) Checking the bus function and accessibility of the measurement devices Generation of graph sets Generation of topology views Brief instruction of the operating personnel on working with the hardware and software components of the Janitza energy management system Official system handover Putting into service Description Installation of GridVis up to 10 devices Installation of the GridVis software (Desktop and/or Service) on a PC or server including configuration of the system by the manufacturer. Creation of a Janitza database or integration of an existing MySQL or MSSQL database, commissioning, instruction of operating personnel, creation of final protocol with transfer of relevant data in hardware and software, topology configuration and GridVis device list to the person responsible for the entire installation. Travel expenses/overnight stays will be charged additionally at cost. Installation of GridVis on more than 10 devices Installation of the GridVis software (Desktop and/or Service) on a PC or server including configuration of the system by the manufacturer. Creation of a Janitza database or integration of an existing MySQL or MSSQL database, commissioning, instruction of operating personnel, creation of final protocol with transfer of relevant data in hardware and software, topology configuration and bus address list of the devices to the person responsible for the entire installation. Travel expenses/overnight stays will be charged additionally at cost. Installation of GridVis Desktop on a further computer Installation of the GridVis Desktop on an additional PC, including configuration of the system by the manufacturer, instruction of operating personnel, creation of final protocol. Travel expenses/overnight stays will be charged additionally at cost. Item no. DL DL DL Commissioning of type 1 measurement device Programming of the measurement device parameters by the manufacturer, integration in the GridVis software for devices UMG 508, 509, 511, 512, 604, 605, commissioning of the system, instruction of operating personnel, backup of configuration data as a TXT file. Travel expenses/overnight stays will be charged additionally at cost. DL Commissioning of type 2 measurement device Programming of the measurement device parameters by the manufacturer, integration in the GridVis software for devices UMG 103, 104, 96S, 96 RM series, commissioning of the system, instruction of operating personnel, backup of configuration data as a TXT file. Travel expenses/overnight stays will be charged additionally at cost. DL Commissioning of type 3 measurement device Programming of the UMG20CM parameters by the manufacturer, recording of data on site, integration in the GridVis software, commissioning of the system, instruction of operating personnel, backup of configuration data as a TXT file. Travel expenses/overnight stays will be charged additionally at cost. DL Commissioning of type 4 measurement device Programming of the ProData 2 parameters by the manufacturer, integration in the GridVis software, commissioning of the system, instruction of operating personnel, backup of configuration data as a TXT file. Travel expenses/overnight stays will be charged additionally at cost. DL
327 Chapter 09 Services Other services Other services Description Commissioning of type 5 measurement device Programming of the energy counter parameters by the manufacturer, recording of data on site, integration in the power quality and cost centre recording, commissioning of the system, instruction of operating personnel, creation of final protocol. Travel expenses/overnight stays will be charged at cost. Item no. DL Acceptance/Checking of cabling Commissioning/acceptance of the physical cabling of the system by qualified specialists. Check of Modbus/Ethernet cabling with regard to cable type, polarity, shield earthing, termination, patching of Ethernet connections, compliance with physical topology, etc. Creation of communication and electrical data lists in Excel format and transfer to the person responsible for the entire installation. Travel expenses/overnight stays will be charged additionally at cost. DL Creation of a virtual device Creation of virtual measuring points (devices) in the GridVis with max. 10 input and output measurements. Travel expenses/overnight stays will be charged at cost. DL Commissioning of Emax basic parameters Programming of the shutdown stages by the manufacturer, setting of the individual consumer parameters such as switching times, priorities and testing of outputs. Instruction of operating personnel, backup of configuration data as a TXT file. Travel expenses/overnight stays will be charged additionally at cost. Commissioning of Emax consumer channels Programming of the shutdown stages by the manufacturer, setting of the individual consumer parameters such as switching times, priorities and testing of outputs. Instruction of operating personnel, backup of configuration data as a TXT file. Travel expenses/overnight stays will be charged additionally at cost. DL DL Commissioning of Emax substation Programming of the FBM modules by the manufacturer, configuration of the FBM modules in the Emax configuration, setting of connection parameters on the FBM module, testing of the RS485 communication between master and FBM module. Instruction of operating personnel, backup of configuration data as a TXT file. Travel expenses/overnight stays will be charged additionally at cost. DL Installation of GridVis Emax Installation of the software on a PC or server, including programming of the parameters required for recording and storing the effective power mean value, trend value and measuring period reset, setting up the database, instruction of operating personnel. Creation of final protocol with transfer of relevant data in hardware and software, such as bus, ring buffer, measurement devices, topology configuration, to the specialist engineer. Travel expenses/overnight stays will be charged additionally at cost. DL Checking of the Emax system Adjustment of the system parameters by the manufacturer to the operating conditions after an operating period of approx. 1/2 year, comparison of the Emax mean value with the ESC invoice. Travel expenses/overnight stays will be charged additionally at cost. DL Commissioning of generic Modbus counter Programming of Modbus measurement devices parameters in accordance with make approved list of Janitza electronics GmbH regarding generic Modbus, implementation in the system, instruction of operating personnel, backup of configuration data as a TXT file. Travel expenses/overnight stays will be charged additionally at cost. DL Commissioning of pulse media counter Programming of pulse media counter parameters, setting of the pulse values, implementation in the system, instruction of operating personnel. Travel expenses/overnight stays will be charged additionally at cost. DL Commissioning of MBus Gateway Solvimus Commissioning of the gateway by Janitza, recording of the data on site, integration in the GridVis software, instruction of operating personnel, creation of final protocol. Travel expenses/overnight stays will be charged additionally at cost. DL
328 Chapter 09 Services Other services Other services Description Item no. Commissioning of the MBus media counter Programming of the M-Bus media counter parameters for connecting to the MBus Gateway Solvimus, recording of the data on site, setting of the M-Bus parameters, implementation in the system, instruction of operating personnel, creation of final protocol. Travel expenses/overnight stays will be charged additionally at cost. Note: From 25 media counters upwards, an overnight stay is required. DL Commissioning of the TopServer (OPC) Installation/commissioning of the OPC TopServer by Janitza. Commissioning of the system, instruction of operating personnel, creation of final protocol. Travel expenses/overnight stays will be charged at cost. DL Integration in the OPC TopServer Integration of a measurement device in the OPC TopServer, recording of the data on site, creation of approx. 5 measured values per measurement device, instruction of operating personnel, creation of final protocol. Travel expenses/overnight stays will be charged additionally at cost. DL Upgrade of GridVis Upgrade of existing and installed GridVis Professional/Enterprise software to Service and/or Ultimate, including programming of the system by the manufacturer, commissioning, instruction of operating personnel. Creation of final protocol. Travel expenses/overnight stays will be charged additionally at cost. DL VISU type 1 service Creation of topology pages in the GridVis, virtual measuring points (PUE + key figures), cost centre/power quality reports (EN 50160/EN ) upon customer request. Instruction of the operating personnel, creation of final protocol. A specification sheet must be provided by the customer. Travel expenses/overnight stays will be charged additionally at cost. DL VISU type 2 service Creation of a dashboard page in GridVis Ultimate with approx. 5 standard widgets, 5 measurement devices and 20 measured values. A specification sheet must be provided by the customer. Travel expenses/overnight stays will be charged additionally at cost. DL VISU type 3 service Creation of a template page in GridVis Ultimate with approx. 5 standard widgets and 20 measured values. A specification sheet must be provided by the customer. Travel expenses/overnight stays will be charged additionally at cost. DL VISU type 4 service Creation of a dashboard overview page in GridVis Ultimate with links to up to 10 subpages. Travel expenses/overnight stays will be charged additionally at cost. DL VISU type 5 service Creation of a Sankey diagram or KPI widget with approx. 20 measured values. Creation of a specification sheet in consultation with the client. Travel expenses/overnight stays will be charged additionally at cost. DL VISU type 6 service Creation of customer-specific graphics for the dashboard pages. A specification sheet must be provided by the customer. DL Checking of difference/pe current measurement Checking of difference/pe current measurement by qualified specialists. A live simulation (e.g. test transformer) must be carried out to check the entire alarm/signalling loop of the Janitza system for compliance with the set threshold value as well as when it is exceeded. This must be carried out for each individually monitored inlet/outlet. The results must be logged and given to the specialist engineer in hardware and software form (Excel). Minimum requirement of the log: Project name, distribution list name, outlet designation, measurement device designation, company name, tester name, measured value, signalling chain function, imprinted current magnitude, type of test device, signature and date, price per diff/converter. Travel expenses/overnight stays will be charged at cost. DL
329 Chapter 09 Services Other services Other services Description Adaptation of the existing software Adaptation of the existing software to the new constellation of the system including software and device updates, integration of the new devices in the software, optional creation of an additional database connection, instruction of operating personnel, creation of final protocol. Travel expenses/overnight stays will be charged at cost. Item no. DL Instruction Project-based instruction in using the software after commissioning, instruction in the functionality of the entire system. Operation of the software with setting options, analysis representations, visualisation, etc. Travel expenses/overnight stays will be charged at cost. DL Programming of the compensation system Programming of the compensation network system parameters by the manufacturer, recording of data on site, commissioning, instruction of operating personnel, creation of final protocol with transfer of relevant data in hardware and software, such as bus, ring buffer, measurement devices, topology configuration, to the specialist engineer. Travel expenses/overnight stays will be charged at cost. DL UMG 20CM Kanäle Programmierung der Parameter der Kanäle, Aufnahme der Daten vor Ort, Einstellung der Impulswertigkeiten, Implementierung in das System, Einweisung des Bedienpersonals, Abschlussprotokollerstellung, ohne An- und Abfahrt. DL Changing of the system parameters Changing of individual system parameters on site, per bus participant after commissioning by the service technician within the first 12 months after initial commissioning, e.g. - Changing of the recording configuration per device - Changing of the nominal values per device - Changing of the current converter settings per device - Changing of the reports per device in the report - Updating of the firmware per device - Software update if necessary Necessary hardware on loan included if required. Changing of the parameters via the option of VPN or remote access included. Access must be guaranteed and made available by the customer. Alternative: Access per TeamViewer. Travel expenses/overnight stays will be charged additionally at cost. DL Alignment of a UMG device homepage Project planning of an energy monitoring or power quality monitoring system Discussion and analysis of the actual status on site, formulation of a customer-specific solution Maintenance of an energy monitoring or power quality monitoring system with checking of communication parameters, plausibility analysis of the measured values, device firmware and GridVis upgrades Integration test of generic Modbus devices PQ QuickCheck to EN /EN

.")
330 Chapter 09 Services Checking the power quality and IT-compliant energy distribution Energy and system check: Checking the power quality quality and TNS systemcompliant electrical installation for IT and other systems. In order to prevent damage and faults in the systems, a link with fault-free electrical supply systems must be created. If this unit is not established, faults can have a negative effect on operating equipment. Such operating equipment includes in particular sensitive operating equipment such as data transfer systems, PLC controls, as well as supply lines for gas and water (alternating current corrosion). Occurrences such as faults in the IT system due to EMC problems, damage to systems through hazardous energy peaks, as well as strongly accelerated appearances of corrosion in buildings can lead to severe damage and production failures. Likewise, the personal safety of personnel and that of the system can also be endangered. Fig.: Avoidance of stray currents on data lines Scope of performance Measurement and analysis of the electrical supply system Detecting potential error sources and fault factors Creation of a detailed report, which provides information on the actual status of the system Creation of a measures catalogue for the improvement and optimisation of the energy supply Further optional measures such as thermographic investigations, online monitoring including recurrent reporting, system monitoring for monitoring the improved systems, etc. on request Fig.: Corrosion of pipes Benefits High operational reliability Reduction of production downtimes Substantiation of the system state Rapid overview of error sources Unique error code analysis Timely detection of system problems Cost centre optimisation of procurement material and repairs Extended service life of machines and systems Rapid data transfer Reports on damaging events Improvement of personnel and system protection 330

331 Chapter 09 Services Customer-side prerequisites for execution Current transformers and voltage transformers must be available for measurement in the medium voltage power grid Presence of the system supervisor or a representative in their absence Fig.: Heating up of neutral conductors through high current harmonics Other services Description Design of compensation system/network analysis Network analysis to assess the network conditions for designing the compensation system with regard to power quality and energy load profiles. The measurement is made in the low voltage network (230/400 V 50 Hz). Recorded and logged in selectable intervals of 5 sec. 15 min. over a period of 7 days per measuring point. The measurement must be carried out during representative operation of the plant section in consultation with the specialist planner. Creation of final protocol with transfer of the relevant data in hardware and software in graphical (pdf/bmp) and numeric (csv/xls) form to the specialist engineer. It is assumed that an electrical specialist with the appropriate specific knowledge of the plant is present during the set-up and dismantling of the measurement. Travel expenses/overnight stays will be charged at cost. Item no. DL Power analysers for leasing Who is not familiar with the problems of grid distortion effects caused by non-linear loads? Typical problems such as defective LED lamps, exploded capacitors, short service lives of converters or other electrical loads, flicker occurrences, production failures due to voltage dips, etc. arise frequently in practice. With concrete power quality problems, whereby no fixed installation power analysers are available, we offer mobile power analysers from the MRG (UMG) range for temporary measurement and fault analysis. The network visualisation software GridVis -Basic is made available in the portable measuring device and in the fixed installation UMG measurement devices. As such, no timeconsuming training period is required. Fig.: MRG portable PQ measuring device 331
332 Chapter 09 Services Other services Description Loan device mobile energy measurement device MRG 96RM-E RCM Flex Loan device for one week For measuring, monitoring and the control of electrical characteristics in power distributions incl. residual current monitoring. Evaluation with the software GridVis Incl. Rogowski coil, Item no (Ø 95 mm) or (Ø 190 mm). The size of the Rogowski coil must also be specified in the order. Current transformer for residual current monitoring on request. Item no Loan device power quality analyser MRG 512 PQ Flex for a power analysis according to EN Loan device for one week Extensive network data collection with recording of faults Evaluation of critical network parameters (harmonics, short-time interruptions,...) and PFC design as well Evaluation with the software GridVis Incl. Rogowski coil, Item no (Ø 95 mm) or (Ø 190 mm). The size of the Rogowski coil must also be specified in the order. Current transformer for residual current monitoring on request Analysis and dimensioning of a power factor correction system Daily power factor check economic checking of power factor correction Upon determining high reactive energy costs it is advisable to check whether the costs arising could be saved through the use of a power factor correction system. In order to design such a system, the billing information of the energy supplier is first applied. If the power factor correction system exceeds 100 kvar, the network conditions installed on site should be determined in order to check for potential harmonic loads. The requisite data is determined here with the aid of a three-phase measurement over 24 hours with load operation. In this way it is possible to check the efficiency of the power factor correction system, as well as the dimensioning in regards to of the harmonic load and further aspects. Fig.: PFC system 332

333 Chapter 09 Services Scope of performance Installation of the measuring equipment Documentation of the data from the billing documents of the energy supplier Acquisition of the local installation conditions Evaluation of the acquired results in the form of a short report Follow-up meeting Proposal for of an economical PFC system Benefits Short amortisation times, lengthy service life and economical investments are guaranteed through a PFC system optimally tailored to the conditions and requirements. If, however, incorrect configuration arises for example due to systems being too large or too small by design this leads to increased investment costs and inaccurate power dimensioning. Incorrectly dimensioned PFC systems in terms of harmonic loads lead in some circumstances to resonance and to a short service life of the PFC system. Fig.: Open dynamic PFC system Customer-side prerequisites for execution Availability of a 230-V power supply at the measurement point Presence of the system supervisor or a representative in their absence Other services Description Item no. Daily reactive power check

334 Chapter 09 Services PFC maintenance with performance per the maintenance contract Annual reactive power check function and safety checking of a PFC system With the aid of a power factor correction system it is possible on the one hand to avoid superfluous reactive power costs by the energy provider, whilst also guaranteeing the optimisation of the energy costs. Furthermore, an improvement in the power quality is also guaranteed with a detuned PFC system because the harmonic currents can be effectively filtered from the network. Checking of the PFC system, which should take place once annually, ensures a long service life and optimum power capability. Scope of performance Visual inspection of the system, which encompasses the following points: Parts, contactors, fans, connections, capacitors, reactors, lines, checking the housing for damage and deformation The regular elimination of dust and pollution prevents creepage distances and short circuits from arising and safeguards the air cooling Measurement and recording of the power values for function testing Creation of a test report for the actual status of the system Further measures: Thermographic testing, etc. Benefits Through consistent care and ensuring the functionality of the system, the following desired beneficial effects and advantages are attained: Avoidance of reactive energy costs on a monthly basis, e.g. it is possible to save up to 500 per month in Germany through the economical configuration of a PFC system with 300 kvar Only a carefully maintained system guarantees a long service life; insufficiently cared for systems can also pose a safety risk Very short amortisation times of just 1 to 2 years can be guaranteed through a functional PFC system Other services Description Item no. Annual PFC check PFC maintenance with performance per the maintenance contract

335 Chapter 09 Services TeamViewer sessions Our engineers and service technicians possess many years of experience and are frequently able to support you without difficulty by way of a remote session in the event of problems and new systems. Furthermore, remote commissioning and training are also possible via remote maintenance. Other services Description Item no. TeamViewer sessions Remote maintenance contracts on an annual basis Safeguard your monitoring and energy management system by having it checked once annually, and keep it in line with the latest engineering practice! Janitza remote maintenance contracts encompasses services including the following: Database: Availability, size, available storage Availability of the measurement devices (communication to the UMGs) Measurement device settings Verification of the recorded measured data Running test reports Under certain circumstances upgrade of the GridVis system software Under certain circumstances upgrade of the UMG firmware Other services Description Item no. Remote maintenance contracts on an annual basis Calibration with calibration reports Calibration includes the following services: Visual inspection for external damage Opening the device and visual inspection for observable damage to electronics and circuit paths Comprehensive function check with automatic testing Firmware update Calibration High voltage test (safety check) Provision of a factory calibration report Other services Description Item no. Calibration with calibration reports
336 Chapter 10 Technical annex 10 Technical annex Technical annex Valid standards Energy(data)management or why ISO is not everything MID Measuring Instruments Directive Overview of the various power quality parameters RCM Residual Current Monitoring Constant (gapless) measurement Measure, calculate, store - ring buffer was yesterday! Collection of mathematical formulas (for UMG measurement devices) General information on current transformers Overvoltage categories Communication via the RS485 interface Ports, protocols and connections Basis for power factor correction Protection classes per EN Prerequisite and confirmation for commissioning (VBI) 3-in-1-Monitoring Page


337 Chapter 10 Technical annex TECHNICAL ANNEX 337
338 Chapter 10 Standards Valid standards Janitza develops, produces and tests its measurement devices and products according to internationally valid standards and directives. The most important national and international standards in conjunction with our products, solutions and applications are as follows: General standards and EMC standards: IEC/EN : Assessment of the flicker strength. IEC/EN : Electromagnetic compatibility (EMC): Ambient conditions; compatibility level for low frequency, conducted interferences and signal transferral in public low voltage networks. IEC/EN : Electromagnetic compatibility (EMC): Ambient conditions; compatibility level for low frequency, conducted interferences in industrial plants. IEC/EN : Threshold values for harmonic currents for electrical devices with current consumption of < 16 A per phase. IEC/EN : Threshold values limit of voltage changes, voltage variations and flicker in public low voltage supply networks for devices with a rated current < = 16 A per phase. IEC/EN : Electromagnetic compatibility (EMC): Threshold values limit of transmission of harmonic currents in low voltage supply networks for devices and equipment with rated currents of over 16 A. IEC/EN : Electromagnetic compatibility (EMC): Threshold values limit of voltage changes, voltage variations and flicker in public low voltage supply networks; devices and equipment with a rated current < = 75 A. IEC/EN : Threshold values for harmonic currents, caused by devices and equipment with a current input of > 16 A and 75 A per phase, which are intended for connection with public low voltage networks. IEC/EN : Electrical safety in low voltage networks up to AC 1000 V and DC 1500 V Devices for testing, measuring or monitoring protective measures. Power quality standards: EN 50160: Characteristics of the voltage (PQ) in public electricity supply networks. 338
339 Chapter 10 Standards D-A-CH-CZ: Technical regulations for the evaluation of grid distortion effects in Germany, Austria, Switzerland and the Czech Republic. TOR D2: Technical and organisational regulations for operators and users of electrical networks, Part D: Special technical regulations; section D2: Directives for the evaluation of grid distortion effects. IEEE 519: (Recommended Practices and Requirements for Harmonics Control in Electrical Power Systems) as a common recommendation from energy suppliers and operators for limiting the effects of non-linear loads through the reduction of harmonics. ENGINEERING RECOMMENDATION: G5/4-1 (planning levels for harmonic voltage distortion to be used in the process for the connection of non-linear equipment) as a directive of the Energy Networks Association (UK) for limiting the effects of non-linear loads through the reduction of harmonics at the transition point (PCC). Valid in Great Britain and Hong Kong. IEEE PQDIF: Recommended Practice for the Transfer of Power Quality Data (data exchange format for power quality data). ITIC (CBEMA): The ITI curve of the Information Technology Industry Council (ITI) represents the withstand capability of computers / power supplies in relation to the height and duration of voltage variations. Standards for PQM devices (power quality analysers) IEC/EN : Electromagnetic compatibility (EMC) Part 4-2: Testing and measurement techniques Electrostatic discharge immunity test. IEC/EN : Electromagnetic compatibility (EMC)Part 4-3: Testing and measurement techniques Radiated, radio-frequency, electromagnetic field immunity test. IEC/EN : Electromagnetic compatibility (EMC) Part 4-4:Testing and measurement techniques Electrical fast transient/burst immunity test. IEC/EN : Electromagnetic Compatibility (EMC) Part 4-5: Testing and measurement techniques Surge immunity test. IEC/EN : Electromagnetic compatibility (EMC)Part 4-6: Testing and measurement techniques Immunity to conducted disturbances, induced by radio-frequency fields. IEC/EN : Electromagnetic compatibility (EMC) Part 4-7: Testing and measurement techniques General guide on harmonics and interharmonics measurements and instrumentation, for power supply systems and equipment connected thereto. IEC/EN : Electromagnetic compatibility (EMC) Part 4-8: Testing and measurement techniques Power frequency magnetic field immunity test. 339
340 Chapter 10 Standards IEC/EN : Electromagnetic compatibility (EMC) Part 4-11: Testing and measurement techniques Voltage dips, short interruptions and voltage variations immunity tests. IEC/EN : Electromagnetic compatibility (EMC) Part 4-15: Testing and measurement techniques Flickermeter Functional and design specifications. IEC/EN : Electromagnetic compatibility (EMC) Part 4-30: Testing and measurement techniques Power quality measurement methods. Standards for energy measurement devices DIN EN : Electricity metering equipment (a.c.) Particular Requirements Part 21: Static meters for active energy (classes 1 and 2). DIN EN : Electricity metering equipment (a.c.) Particular requirements Part 22: Static meters for active energy (classes 0,2 S and 0,5 S). DIN EN : Electricity metering equipment (a.c.) Particular requirements Part 23: Static meters for reactive energy (classes 2 and 3). DIN EN : Electricity metering equipment (a.c.) Particular requirements Part 31: Pulse output devices for electromechanical and electronic meters (two wires only. DIN EN 60529: Degrees of protection provided by enclosures (IP code). Standards for energy management DIN EN ISO 50001: Energy management systems Requirements with instructions on application. DIN EN : Describes the requirements for an energy audit, which enables small and medium-sized companies (SME) to improve their energy efficiency and reduce their energy consumption. DIN EN : Energy audits Part 1: General requirements; possibility for small and medium-sized companies (SME), in the sense of recommendation 2003/361/EC of the European Commission, to fulfil the requirements of the electricity and energy tax legislation for surplus settlement. 340
341 Chapter 10 Energy management ISO Energy(data)management or why ISO is not everything We are constantly confronted with the question: "You sell energy management systems?!" The response is always the same: "Yes and no". Our product portfolio encompasses components, software and solutions for the acquisition and analysis of energy-related data and is therefore also the basis for various possible tasks and objectives, and accordingly also for an energy management system. ISO ISO is the standardised basis for the introduction of an energy management system. The focus here lies on the term management system. This is a methodology, applied in conjunction with other management systems such as ISO 9001 or ISO 14001, through which to set objectives, implement these systematically and in doing so eliminate the chance factor insofar as possible. The term "objective" should essentially be understood here in the sense of "the route is the objective". Using the PDCA system or Plan-Do-Check-Act a CIP (constant improvement process) is pursued, which assesses the step-by-step processes and procedures for their optimisation potential, as well as stipulating measures and responsibilities and the resources and time frames required for these. ISO is similar in configuration to ISO 9001 or ISO and can therefore be easily integrated into existing management systems. This considerably eases the work involved in introduction. Environment management system Workplace safety management Personnel management Energy management system IT management Quality management system Facility management Risk management The word "check" in the PDCA process also pertains to the subject of measured data acquisition and evaluation, or expressed otherwise: Energy data management. Without measurement it is not possible to obtain a target/actual comparison or a benchmark. Although no clear specifications are described in ISO in relation to the scope and frequency of energy measurements, 341
342 Chapter 10 Energy management ISO in practice it is apparent that a minimum volume of measuring technology is required for constant acquisition at least for all significant loads otherwise potential can only be determined to a limited degree and saving objectives cannot be adequately attained on a comprehensive basis. Customers who have achieved their certification with a minimum measurement scope recognise during the ongoing PDCA process the benefits of comprehensive monitoring across as many loads as possible. Energy policy and energy planning plan Corrective and preventative measures Management review Constant improvement Realisation and operation act do Checking, measuring, analysis, audit check Certification Our measuring systems are scalable in application and grow with the requirements of the customer. Existing structures can be incorporated, and likewise our measuring devices can be integrated in existing systems. Questions are regularly asked regarding the gauging and subsequent calibration of measuring devices in conjunction with the introduction of ISO The standard does not specify one or the other. Measuring devices in the form of calibrated meters are not a requirement, nor is the re-calibration of measuring devices at regular intervals. This would mean an infeasible volume of work, because digital measuring devices cannot usually be calibrated whilst installed. The company requiring certification must merely ensure the comparability of the measurements within the various time frames, and document the checks in the usual way. For our universal measuring devices if used as intended (ambient temperature!) this means the accuracy of measurement is always better even after years of use than that of conventional meters immediately after delivery. In practice, we recommend random comparative or parallel measurement of the power and energy values with a high quality measuring device such as our portable measuring devices MRG 605 or MRG 511, via the current transformer measurement terminal strips available from us. 342
343 Chapter 10 Energy management ISO Who even needs ISO 50001? (most recent German legal situation 2013) EEG 40 ff. EEG levy reduction Under certain conditions companies are entitled to submit an application for a reduction in the EEG (German renewable energy act) levy. The company must belong to the manufacturing industry The electricity costs must account for at least 14 % of the gross value added The annual consumption must be at least 1 GWh per site From an annual consumption of 10 GWh, certification per ISO is required in order to request the reduction Information on the subject and application can be obtained from the Federal Office of Economics and Export Control: The regulation is intended to secure the international competitiveness of energyintensive companies. Due to the increase in the proportion of renewable energy generators, the EEG levy is likely to continue rising considerably. This means a significant competitive disadvantage for energy-intensive companies. Despite all the half-truths being touted by the media, in practice it is apparent that the lion's share of all companies who have applied for the EEG reduction and received approval for this are actually amongst the most energy-intensive companies and are in international competition. A significantly greater proportion of companies with a high power consumption of > 1 GWh per year fell at the first hurdle of the approval process, with the 14 % gross value added requirement. Electricity tax law 10 surplus settlement Under certain conditions, companies in the manufacturing sector are able to benefit from the so-called surplus settlement according to 10 StromStG. This allows companies to obtain a reimbursement or tax relief against their remaining tax burden, through the application of 9b StromStG. This "relief in special cases" (surplus settlement) is only granted if the tax burden exceeds 1,000 in the calendar year (excess/basic amount). The rate of relief is dependent on the difference between the energy tax, which exceeds the basic amount, and the (notional) relief, which is derived on the basis that pension contributions have fallen since the introduction of energy tax (general pension contribution was 20.3 % prior to the introduction of energy tax and now stands at 18.9 %; with an employer contribution of 50 % this means a reduction of 0.7 % for the employer in 2013; the "difference"). A maximum 90 % of this difference is granted as relief, reimbursed or credited. This calculation formula leads to companies with a high power consumption and few employees (subject to statutory pension contributions) profiting in particular from the surplus settlement. Since 2013 large companies require a certified energy management system per ISO in order to request the surplus settlement. For small and mediumsized companies (SME) an energy audit per DIN EN is sufficient. You can receive applications and information from the main customs office responsible: 343
344 Chapter 10 Energy management ISO In practice: Managing director F. to works manager A.: "How much current do we actually use?" Works manager A.: "Not entirely sure, certainly a lot!" Managing director F.: "Be sure to change that!" Works manager A. to site electrician M.: "We need to reduce our energy costs. Take care of it." One year later. Managing director F. to works manager A.: "The energy bills are as high as ever. How is that possible?" Works manager A.: "I need to ask M. that." Works manager A. to site electrician M.: "We are still paying crazy energy bills. How is that possible? I told you that you needed to sort that out!" Site electrician M.: "Yes boss. But the controller cancelled the cash for new drives, then my colleague was ill for four weeks and you know that day-to-day work is hectic, the telephone rings constantly and everyone wants something!"... with ISO that would not have happened! Who else needs an energy management system (EnMS)? Essentially, every company that consumes a certain amount of power and has a large number of different loads and processes benefits from the introduction of an energy management system per ISO The system behind this ensures sustainable targeted measures for the reduction of energy costs. Furthermore, an EnMS per ISO will also become an increasingly significant marketing instrument for the presentation of a green and environmentally aware company philosophy in the future. Formulation of targets and strategies e.g. energy use and associated costs, production data Data acquisition Analysis and key figures e.g. target/ actual comparison, formulation of key figures Energy management loop e.g. check target attainment, determination of implementation status Check and correction Planning and concept design e.g. planning the energy use and optimisation measures Energy efficiency measures Prioritisation and execution of measures Energy management constitutes a closed loop with the objective of constant improvement. 344
345 Chapter 10 Energy management ISO One must concede that professionally functioning companies do not necessarily need to establish a certified management system within their organisation, in order to reduce their energy costs on a sustained basis. Furthermore, there are countless companies, for whom the legal prerequisites for an EEG levy reduction or the surplus settlement are irrelevant, whereby ISO is not a significant subject. However, energy costs remain high. Anyone who establishes the requisite transparency with an energy data management system from Janitza, lays in place the cornerstone for sustainable energyconscious housekeeping. Results of the energy analysis Development of a measures catalogue Evaluation of energy saving measures Prioritisation of measures Creation of a detailed measures plan Implementation of the measures Sequence of energy saving measures planning Peak load management and grid fees A further important aspect for cost reduction, which can be pursued with an energy data management system, is the control and reduction of peak loads. Electricity supply companies calculate grid fees on the basis of the maximum load measured within a quarter of an hour. This value then applies under certain circumstances for the entire year. However, it may be that this value was simply arbitrary or coincidental. It is frequently the case that the actual "troublemakers", responsible for the generation of peak loads, are not immediately discernible. You can find a helpful overview of all subjects pertaining to ISO 50001, energy efficiency and subsidy options for the German market on the following internet sites: Federal Office of Economics and Export Control: From the main customs offices: Only those companies who create transparency regarding the load curves of their significant loads will be able to actively counter these. This can take place through the targeted switching off of loads, through the switching on of their own generators or where this is not possible for process reasons with time-delayed switch-on processes or the shutting down of unimportant processes. According to 19 section 1 StromNEV (Germany) special forms of grid use, a further and frequently unknown factor is that supply companies are required to offer their customers a reduced monthly supply tariff if the peak load measured once was significantly higher than normal for the respective company due to unusual circumstances. Load management and optimisation of production processes It is not only peak loads that increase energy costs. Investigations into large production operations have shown that even during shift-free periods and idle phases, depending on the process, annual power consumptions of multiple gigawatt hours can arise per site! A fine-meshed network of measurement points within the production structures in conjunction with modern PLC controllers and production control systems enable automated optimisation in real-time at high level. Janitza monitoring devices and systems are suitable for DENA German energy agency: The DENA list of certified energy consultants: Credit institute for reconstruction A comprehensive overview of all subsidy measures: Federal Ministry for the Environment, Nature Conservation and Nuclear Safety: NRW energy agency: IHK, TÜV and DEKRA on their state-specific websites 345
346 Chapter 10 Energy management ISO this task due to their open communication interfaces, the high sampling rate and accuracy of measurement. Load management and purchasing electricity Anyone who knows their load curves and buys electricity on the spot market is naturally able to do so with pinpoint accuracy, with precise knowledge of their volatile demand due to their load profiles. Grants and public funds The state provides comprehensive assistance for the implementation of measures and investment in systems and operating equipment for the enhancement of energy efficiency. From low-interest credit to actual investment grants and covering the costs of (sometimes mandatory) certified energy consultants. The list is long and the offers change all the time and vary from country to country. 346
347 Chapter 10 MID Measuring Instruments Directive MID Measuring Instruments Directive The abbreviation MID stands for the term "Measuring Instruments Directive" and is the equivalent of the German term "Messgeräte-Richtlinie". This refers to the measuring instruments directive 2004/22/EC of the European parliament and the council dated the 31st March What are the aims of the MID? EU-wide regulation of the market access of respective measuring devices - Creation of a harmonised European market for measuring devices - Uniform approval process for all EU states and individual additional states - Single, uniform approval testing - Uniform, cross-border specification for first calibration Uniform product labelling Reduction of tests and test costs - First calibration takes place through a manufacturer's declaration of conformity - Separate calibration testing and calibration fees omitted - Reduced delivery times Equality in competition due to high requirements for product quality - Additional requirements regarding precision in the small load range - Higher EMC requirements - Improved picture of the latest measuring technology status What does MID regulate? The MID applies to 10 types of measuring device (electricity meters, water meters, gas meters, etc.) in the fields of statutory metrology, and defines fundamental and measuring device-specific requirements. A conformity evaluation process whereby the cooperation of a notified body chosen by the manufacturer is prescribed replaces the previous first calibration by the calibration authority or the state-certified test centre. It transfers the responsibility for first circulation and first commissioning within the EU to the manufacturer. After this, national law applies. 347
348 Chapter 10 MID Measuring Instruments Directive The manufacturer must select one of the conformity evaluation processes prescribed in the MID, through which they guarantee the compliance of the measuring device with the MID under the supervision of a notified body. Only then is it permissible to put the measuring device - compliant with the MID - into circulation or into operation. A declaration of conformity must be supplied with the meter. This is frequently printed in the operating manual. Following circulation or commissioning of the measuring device, the responsibility for attaining accurate measuring results passes to the user. Labelling the devices The sequence of MID labelling is prescribed and must comply with the following example: Re-calibrating? The MID has no effect on re-calibrating according to calibration regulations. Measuring devices, whose conformity has been specified in a prescribed conformity evaluation process and which are correctly labelled, are deemed in German to have been initially calibrated. The measuring device user is once again responsible for submitting a timely application for re-calibration. The duration of calibration validity is stipulated in the national calibration ordinance. In Germany, this is a period of eight years after MID labelling in the case of electronic electricity meters. Further information applicable to Germany can be found under the following link: 348

349 Chapter 10 Power quality parameters Overview of the various power quality parameters In modern energy supply a wide range of single and three-phase, non-linear loads are used in industrial networks right through to office blocks. These include lighting equipment such as lighting controls for headlamps or low energy bulbs, numerous frequency converters for heating, air conditioning and ventilation systems, frequency converters for automation technology or lifts, as well as the entire IT infrastructure with the typically used regulated switched mode power supplies. Today, one also commonly finds inverters for photovoltaic systems (PV) and uninterruptible power supplies (UPS). All of these non-linear electrical loads cause grid distortion effects to a greater or lesser extent, with a distortion of the original "clean" sinusoidal form. This results in the current or voltage waveform being distorted in the same way. Fig.: Distorted current form through consumer electronics The reliable operation of modern plants and systems always demands a high degree of supply reliability and good power quality. The load on the network infrastructure through electrical and electronic loads with grid distortion effects has increased significantly in recent years. Depending on the type of generation system and the operating equipment (mains feed with converter, generator), mains rigidity at the connection point and the relative size of the non-linear loads, varying strengths of grid distortion effects and influences arise. The following power quality parameters must be taken into particular consideration: Harmonics Current and voltage unbalance Rapid voltage changes - transients Voltage dips and short-term overvoltage Voltage interruption (SIs - short term interruptions) Flicker Phase shifting and reactive power 349

350 Chapter 10 Power quality parameters Harmonics The constantly rising number of non-linear loads in our power networks is causing increasing "noise on the grid". One also speaks of grid distortion effects, similar to those that arise in the environment due to water and air pollution. Generators ideally produce purely sinusoidal form current at the output terminals. This sinusoidal current form is considered the ideal alternating current form and any deviation from this is designated mains interference. Voltage progression Current progression 2 1 An increasing number of loads are extracting non-sinusoidal current from the grid. The FFT-Fast-Fourier-Transformation of this "noisy" current form results in a broad spectrum of harmonic frequencies - often also referred to as harmonics. Fig.: Grid distortion effects through frequency converters Harmonics are damaging to electrical networks, sometimes even dangerous, and connected loads are harmed by these; in a similar way to the unhealthy effect that polluted water has on the human body. This results in overloads, reduced service lives and in some cases even the early failure of electrical and electronic loads. Harmonic loads are the main cause of invisible power quality problems and result in massive maintenance and investment costs for the replacement of defective devices. Grid distortion effects of an impermissible high level and the resultant poor power quality can therefore lead to problems in production processes and even to production downtimes. Fig.: Harmonics analysis (FFT) Harmonics are currents or voltages whose frequency lies above the 50/60-Hz mains frequency, and which are many times this mains frequency. Current harmonics have no portion of the effective power, they only cause a thermal load on the network. Because harmonic currents flow in addition to "active" sinusoidal oscillations, they cause electrical losses within the electrical installation. This can lead to thermal overloads. Additionally, losses in the load lead to heating up or overheating, and therefore to a reduction in the service life. The assessment of harmonic loads usually takes place at the connection or transition point to the public mains supply network of the respective energy supplier. One speaks in this case of a Point of Common Coupling (PCC). Under certain circumstances it may also be important to determine and analyse the harmonic load through individual operating equipment or equipment Threshold values of individual harmonic voltages at the transition point up to the 25th order as a percentage of the fundamental oscillation U1 Odd harmonics No multiple of 3 Multiple of 3 Order h Relative voltage amplitude U h Order h Relative voltage amplitude U h Even harmonics Order h % % % % % % % % 6 to % % % % % % % Relative voltage amplitude U h 350
 Total Harmonic Distortion (THD) is a means of quantifying the proportion of distortion arising due to the")
351 Chapter 10 Power quality parameters groups, in order to indicate internal power quality problems and possibly determine their causes. The following parameters are used to assess harmonic loads: Total Harmonic Distortion (THD) Total Harmonic Distortion (THD) is a means of quantifying the proportion of distortion arising due to the non-linear distortion of an electrical signal. It therefore gives the ratio of the effective value of all harmonics to the effective value of the mains frequency. The THD value is used in low, medium and high voltage systems. Conventionally, THD i is used for the distortion of current, and THD u for the distortion of voltage. THD for voltage M = Ordinal number of harmonics M = 50 (UMG 605-PRO, UMG 511, UMG 512-PRO) Mains frequency fund equals n = 1 Fig.: Capacitors destroyed due to harmonics THD for current M = Ordinal number of harmonics M = 50 (UMG 605-PRO, UMG 511, UMG 512-PRO) Mains frequency fund equals n = 1 Total Demand Distortion (TDD) In North America in particular, the expression TDD is commonly used in conjunction with the issue of harmonics. It is a figure that refers to THD i, although in this case the total harmonic distortion is related to the fundamental oscillation portion of the nominal current value. The TDD therefore gives the relationship between the current harmonics (analogous to the THD i ) and the effective current value under full load conditions that arises within a certain interval. Standard intervals are 15 or 30 minutes. TDD (I) TDD gives the relationship between the current harmonics (THD i ) and the effective current value with a full load. I L = Full load current M = 50 (UMG 605-PRO, UMG 511, UMG 512-PRO) Voltage drops can lead to huge complications for example the failure of production processes and to quality problems. Such voltage drops arise much more frequently than interruptions. The commercial effects of voltage 351
352 Chapter 10 Power quality parameters Current / voltage unbalance One speaks of balance in a three-phase system if the three phase voltages and currents are of an equal size and are phase-shifted at 120 to each other. 1 Unbalance arises if one or both conditions are not fulfilled. In the majority of cases the cause of unbalance lies in the loads. 0,5 0-0,5 In high and medium voltage power grids the loads are usually three-phase and symmetrical, although large one- or two-phase loads may also be present here (e.g. mains frequency induction furnaces, resistance furnaces, etc.). In the low voltage network electrical loads are frequently also single-phase (e.g. PCs, consumer electronics, lighting systems, etc.), and the associated load current circuits should be distributed as evenly as possible within the electrical wiring on the three phase conductors. Depending on the symmetry of the singlephase loads, the network is operated on a more balanced or unbalanced basis. -1 Fig.: Balance 1,5 1 0,5 Zeit The compatibility level for the degree of unbalance of the voltage in stationary operation caused by all mains loads is defined as 2 %. Related to individual load systems the resultant degree of unbalance is limited to = 0.7 %, whereby an average over 10 minutes must be obtained. 0-0,5-1 -1,5 Zeit The following effects arise due to unbalance in the voltage: Fig.: Unbalance Increased current loading and losses in the network. With equal load power the phase currents can attain 2 to 3 times the value, the losses 2 to 6 times the value. It is then only possible to load lines and transformers with half or one third of their rated power. Increased losses and vibration moments in electrical machinery. The field built up by the negative sequence component of the currents runs against the phase sequence of the rotor and therefore induces currents in it, which lead to increased thermal loading. Rectifiers and inverters react to unbalance in the power supply with uncharacteristic harmonic currents. In three-phase systems with star connection, current flows through the neutral conductor. U1 U2 U3 Fig.: Illustration of unbalance in the Vector diagram You can find the related detailed formulas in the collection of formulas. 352


353 Chapter 10 Power quality parameters Transients Transients are pulsed electrical phenomena, which exist for just a short period of time. These are usually high frequency, steep signals in the form of transient oscillations. The reliable detection of transient processes in the electrical supply network is very important in order to avoid damages. Through constant changes in the electrical supply network due to switching operations and faults, new network states arise constantly, which the entire system is required to tune itself to. In normal cases transient compensation currents and compensation voltages arise here. In order to assess whether the transient processes result from a desired or undesired change in the network, and whether these still lie in the tolerance range, one requires reliable decision criteria. Fig.: Transients High transient overvoltage, and high dv/dt-ratios, can lead to insulation damage and the destruction of systems and machines, also depending on the energy input (e.g. lightening strike). In order to detect and record transients it is necessary to use high quality, digital power quality analysers with a high sampling rate. Fig.: With the UMG 511 it is possible to display the transients directly on the measuring device. Practical example: High transient currents often arise due to the switching in of capacitors (without reactors or damping facility) also with problem-free network configurations. Choking has a strongly damping effect and therefore protects against avoidable problems that are difficult to foresee. Alternatively, special capacitor contactors or switching devices should be used, e.g. with pre-charging resistors at LV side. 353

354 Chapter 10 Power quality parameters Voltage dips and interruptions drops are seriously underestimated time and again. What is a voltage drop? According to the European standard EN a voltage drop is a sudden lowering of the effective voltage value to a value of between 90% and 1% of the stipulated nominal value, followed by the immediate reinstatement of this voltage. The duration of a voltage drop lies between a half period (10 ms) and one minute. If the effective value of the voltage does not drop below 90% of the stipulated value then this is considered to be normal operating conditions. If the voltage drops below 1% of the stipulated value then this is considered an interruption. Fig.: Example: Voltage dips due to bird droppings A voltage drop should therefore not be confused with an interruption. An interruption arises, for example, after a circuit breaker has tripped (typ. 300 ms). The mains power failure is propagated throughout the remaining distribution network as a voltage drop. The diagram clarifies the difference between a drop, a short interruption and an undervoltage situation. Voltage variations are caused by: Short circuits Ueff (%) Overvoltage Normal operating voltage 90 Voltage dips Undervoltage 1 Short interruption Long interruption 10 ms 1 min 3 min t 354
 Arc furnaces Welding machines Switching on capacitors Construction works Bird droppings Voltage drops can lead to the failure of computer systems, PLC systems, relays and frequency")
355 Chapter 10 Power quality parameters Switch-on and switch-off processes with large loads Starting drives (larger load) Load changes with drives Pulsed power (oscillation package controls, thermostatic controls) Arc furnaces Welding machines Switching on capacitors Construction works Bird droppings Voltage drops can lead to the failure of computer systems, PLC systems, relays and frequency converters. With critical processes just a single voltage drop can result in high costs, continuous processes are particularly impacted by this. Examples of this are injection moulding processes, extrusion processes, printing processes or the processing of foodstuffs such as milk, beer or beverages. Fig.: Critical voltage dip with production standstill The costs of a voltage drop are comprised of: Loss of profits due to production stoppage Costs for catching up with lost production Costs for delayed delivery of products Costs for raw materials wastage Costs for damage to machinery, equipment and moulds Maintenance and personnel costs Sometimes processes run in unmanned areas in which voltage drops are not immediately noticed. In this case an injection moulding machine, for example, could come to a complete standstill unnoticed. If this is discovered later there will already be a large amount of damage. The customer receives the products too late and the plastic in the machine has hardened off. Flicker 10 kv Mains transformer 400 V Dip zone 1 Supply field impedance Z Low voltage main distribution Output field impedance Z1 Dip zone 2 I > In Z2 Z3 Fig.: Motor start-up currents can lead to a voltage dip 355


356 Chapter 10 Power quality parameters Flicker refers to the subjective impression of light density changes or an impression of unsteadiness of visual perceptions, caused by luminous stimuli with temporal fluctuations of the light density or the spectral distribution. From a technical perspective, voltage variations cause light density changes in lamps, which can result in visual perceptions referred to as flicker. From a certain threshold value the appearance of flicker can be disturbing. The disturbing effect of voltage variations depends here on the extent of the repetition rate and the curve form of the change in voltage. The short-term flicker strength and long-term flicker strength are defined measures of the disturbing effect. Voltage variations, caused by individual devices (on the low voltage network), are permissible if the resultant flicker disturbance factor is not greater than 1. The long-term flicker disturbance factor averaged from twelve values must not exceed a value of The most simple method for evaluating the value is the = 1 p.u. curve. P.u. stands here for the "unit of perception" and is the maximum tolerance level for the interference sensitivity of the human eye with regards to its perception of light fluctuations. It is also not permissible to exceed the value = 1 p.u. in combination with all interferers. PST 1,4 1,2 1,0 0, Minuten Fig.: Development over time of short-term flicker (PST) Fig.: Practical example for flicker: Gravel quarry Fig.: Development of flicker Fig.: Effective power development dependent on the volume and consistency of material 356
.")
357 Chapter 10 Power quality parameters Phase shifting and reactive power Reactive power is required in order to generate electromagnetic fields in machines such as three phase motors, transformers, welding systems, etc. Because these fields build up and break down continuously, the reactive power swings between generator and load. In contrast to the effective power it cannot be used, i.e. converted into another form of energy, and burdens the supply network and the generator systems (generators and transformers). Furthermore, all energy distribution systems for the provision of the reactive current must exhibit larger dimensions. It is therefore expedient to reduce the inductive reactive power arising close to the load through a counteractive capacitive reactive power, of the same size where possible. This process is referred to as power factor correction. With power factor correction, the proportion of inductive reactive power in the network reduces by the reactive power of the power capacitor of the power factor correction system (PFC). The generator systems and energy distribution equipment are thereby relieved of the reactive current. The phase shifting between current and voltage is reduced or, in an ideal situation with a power factor of 1, entirely eliminated. The power factor is a parameter that can be influenced by mains interference such as distortion or unbalance. It deteriorates with progressive phase shifting between current and voltage and with increasing distortion of the current curve. It is defined as a quotient of the sum of the effective power and apparent power, and is therefore a measure of the efficiency with which a load utilises the electrical energy. A higher power factor therefore constitutes better use of the electrical energy and ultimately also a higher degree of efficiency. φ I U ωt 1 ϖ 2ϖ Fig.: Phase shifting between current and voltage ( φ) Fig.: Principle of power factor correction Power Factor (arithmetic) The power factor is unsigned cos phi Fundamental Power Factor Only the fundamental oscillation is used in order to calculate the cos phi cos phi sign (φ): - = for delivery of effective power + = for consumption of active power Fig.: Power Factor (arithmetic) Because no uniform phase shifting angle can be cited with harmonic loading, the power factor λ and the frequently used effective factor cos (φ1) must not be equated with each other. Starting with the formula with I1 = fundamental oscillation effective value of the current, I = total effective value of the current, g1 = fundamental oscillation content of the current and cos(φ1) = shifting factor, one sees that only with sinusoidal form voltage and current (g = 1) is the power factor λ the same as the shifting factor cos(φ1). As such, exclusively with sinusoidal form currents and voltages is the power factor λ the same as the cosine of the phase shifting angle φ and is defined as = effective factor. Fig.: cos phi Fundamental Power Factor 357
358 Chapter 10 Residual current monitoring RCM RCM Residual Current Monitoring General information Residual currents caused by the failure of insulation can constitute a significant risk to safety in electrical systems. Using an appropriate protective concept it is possible to detect residual currents, eliminate insulation faults in good time and therefore ensure the availability of the system. RCM stands for Residual Current Monitoring and means the monitoring of residual currents in electrical systems. This current is calculated as the sum of the currents of all conductors, apart from the protective earth (PE), which feed into the system. Residual currents are typically the result of insulation faults, leakage currents or EMC filter leakage currents for example. ma Residual current Personnel protection System protection Fire protection Message from RCM Switch-off Information advantage t Fig.: Report prior to switching off - an aim of residual current monitoring Time Whilst RCD devices (residual current circuit breakers) switch off the power supply in the event of a certain residual current being exceeded, RCM measuring devices indicate the actual value, record the long-term development and report the exceeding of a critical value. This message can also be used in order to switch off the power supply via external switching devices (contactors, relays). Through the use of residual current measuring devices (Residual Current Monitoring, RCM) it is possible to detect and report residual currents in a timely manner. It is possible to initiate counter measures in good time, so that it is not necessary to switch the system off. This facilitates the implementation of measures in the event of slowly deteriorating insulation values or steadily rising residual currents caused for example by ageing insulation before the system is switched off. For example: Insulation faults of lines and electrical operating resources Residual currents from electrical loads Defective PP power capacitors for the PFC Defective components in switched mode power supplies, e.g. in computers Correctness of TNS systems (Terra Neutral Separate) Disclosure of impermissible PEN connections Avoidance of neutral conductor reverse currents to grounded equipment Residual current monitoring in conjunction with energy measurement in combined energy / RCM measuring devices in electrical systems constitutes a measure for fire protection and maintenance prevention. Down times and the associated costs are thereby reduced. Timely and preventative maintenance facilitated through the information additionally gained from an RCM measuring device also significantly enhances the efficiency and availability of a system. Constant RCM monitoring is of particular significance in preventing unwanted surprises in ongoing operation, and provides consistent information regarding the actual status of the electrical system. Fig.: Fault current to ground through high ohmic ground fault 358
359 Chapter 10 Residual current monitoring RCM Fundamental measuring process with RCM The functionality of RCM measuring devices is based on the differential current principle. This requires that all phases be guided through a residual current transformer at the measuring point (outlet to be protected), with the exception of the protective earth. If there is no failure in the system then the sum of all currents will be nil. If, however, residual current is flowing away to ground then the difference will result in the current at the residual current transformer being evaluated by the electronics in the RCM measuring device. Fault current = 0 System is OK L1 I L2 I L3 I N Sum > 0 Fault in the system The measurement process is described in IEC/TR Differentiation is made here between type A and type B. DIN EN / VDE 0663 / IEC standard: The standard applies to residual current monitoring devices for domestic installations and similar applications with a rated voltage of < 440 V AC and a rated current of < 125 A. The UMG 96RM-E can measure residual currents in accordance with IEC/TR ( ) of type A and type B. Optimum monitoring through 6 current measurement channels Modern, highly integrated measuring devices facilitate the combined measurement of Electrical parameters (V, A, Hz, kw...) Power quality parameters (harmonics, THD, SIs...) Energy loads (kwh, kvarh...) RCM residual current in just one measuring device. The following example shows a measuring device with 6 current inputs for this purpose: Residual current monitoring Central grounding point Fig.: Fault current to ground due to an insulation ageing of the motor windings. Minor current through high ohmic fault can be captured with RCM in time and remedial measures initiated to avoid a solid short circuit over time. Thus a production stop can be avoided, as well the risk of a possible fire damage in a worst case scenario. 359
360 Chapter 10 Constant measurement Constant measurement In the past In the past, the micro-processors available on the market were not sufficiently powerful for measuring and simultaneously calculating the various parameters. It was therefore only feasible to carry out random measurements with older measuring devices. In other words measurements were taken for a number of cycles, measuring was subsequently stopped and the values were calculated. No further measurements were taken during processing. This meant that measurements were only taken for a few periods out of 50 periods. "Every measuring device measures constantly, doesn't it..." Customer quote In the present With the new product families, such as the UMG 96RM, UMG 104, UMG 604- PRO, UMG 605-PRO, UMG 508, UMG 511, leading-edge microprocessors are used with an entirely new architecture, integrated performance scope and considerably higher capacities. Such processors were not available in the past! These processors are more expensive than conventional processors, which are still widely used in many simple measuring devices. With the aforementioned product families, constant and gapeless measurement takes place. In this case all periods are captured, i.e. measurements are taken during 50 periods out of 50. In parallel to this, the data is processed and the various electrical, PQ and energy parameters are calculated. It is self-evident that considerably better measurement accuracy is attained. It is also necessary to consider that random measurement can lead to considerable deviations in the measurement results and the energy measurement in the event of rapid load changes (e.g. spot welding). Market situation Simple measuring devices and measuring devices with economical or older measuring electronics are still available for random measurement. If one looks at the global market, random measurement is in fact dominant and remains current engineering practice! It is also frequently the case that energy is measured constantly, although all other values are not acquired constantly but rather on a random sampling basis. Summary Constant measurement requires higher quality components. By constantly measuring all values, a considerably higher accuracy of measurement is attained. 360
, which enable the constant and seamless determination")
361 Chapter 10 Measure, calculate, store Measure, calculate, store ring buffer was yesterday! As described in detail in the previous article, our latest generation measuring devices are equipped with highly powerful signal processors (DSP), which enable the constant and seamless determination of current and voltage, as well as the calculation of every conceivable parameter. How does this take place in detail, what is the measuring process sequence, in what form are the measured values made available, where are they saved? Modern measuring devices such as our UMGs can essentially be considered as PCs. The average elements are the CPU (DSP), RAM, hard drive (flash memory) and communication ports (RS485, RJ45). It is fundamentally possible to distinguish between the following measured value groups: Online values Online values are determined over a measurement interval of 200 ms or as a mean value of the full wave effective values over 10 periods. Online values are all values that are constantly determined and evaluated by the measuring device. Depending on the measuring device this can be up to 2,000 values available for all measuring channels per 200 ms. The significant values can be read out directly from the UMG displays. Using the GridVis software and working in the topology screen it is possible to view the complete scope of measured values. All measured values are constantly available in defined Modbus memory registers for external access via suitable third party software. Historical values Recordings Historical values are generated using the online values. For this purpose one or more recording configurations are predefined in the device configuration. For the purpose of the respective recording a period is stipulated for the generation of a mean value, e.g. 15-minute mean value for the recording of load curves, 1-hour mean value for energy, etc. The time frames can lie between 200 ms and multiple days, depending on the type of device. In order to conduct power quality measurements per EN 50160, EN or EN 50160, IEEE519, predefined recording configurations are available and these can be activated at the click of a mouse button. Historical values are generally initially stored in a measuring device on internal flash memory. This was formerly referred to as a ring buffer. Each stored value is assigned a time stamp. Using the GridVis software the values are read out manually or automatically (Service). The measured value and time stamp are stored in a database. Using GridVis or external database tools it is possible to evaluate these values on a tabular or graphical basis. Fig.: Online values, value tree UMG 605-PRO Fig.: Customer-specific historic recordings, value tree UMG 96RM 361


362 Chapter 10 Measure, calculate, store Events Events are under- and overvoltages as well as overcurrents. The basis is 20- ms full wave effective values with UMG 604-PRO and UMG 508 or 10-ms half wave effective values with UMG 605-PRO and UMG 511. With an exceeding or undercutting of the stipulated tolerance limits the event is stored on the flash memory. Additionally, a pre- and post event period are defined, so that network incidents can be analysed directly before and after the event occurs. As such, all voltage and current channels are graphically shown as a maximum across the specified time frame. Fig.: Event recording voltage dip / undervoltage Transients In order to record transients the full performance of the UMGs is required. With a sampling rate of 20 khz it is possible to capture transients from 50 µs. Similarly to with the recording of events, threshold values as well as pre- and post periods can be defined. Likewise, it is also possible to stipulate which channels are written to a graph in waveform at the time that the transients occur. Fig.: Recording transients Flags Flags are used to mark and save irregularities in measurements and recordings, in accordance with IEC In this way it is possible to recognise the causes of gaps in recordings for example. Flag LostWindow LostPLL OverCurrent OverVoltage Firmware upgrade Initialisation Note 200 ms measurement window has been lost The device has lost the grid synchronisation Overcurrent A Overvoltage V Firmware upgrade Buffer initialisation Fig.: Flag recording All recordings of historical data, events, transients and flags run constantly, independently of each other and in parallel in the measuring device. All saved data is historically sorted for storage. If the flash memory is full then the oldest data historically is overwritten. Through the regular reading out of the data to a database, values that are overwritten on the measuring device will already have been saved to the server, meaning that no measured values are lost. 362

363 Chapter 10 Measure, calculate, store DSP Firmware Measurement Calculation RAM Online values Modbus register Flash Web server Homepage Recordings Events Transients, flags 363
364 Chapter 10 Collection of formulas Collection of formulas (for UMG measurement devices) Effective value of the current for phase conductor p Effective value of the neutral conductor current Effective voltage L-N Effective voltage L-L Neutral voltage (vectorial) Neutral voltage Effective power for phase conductor Apparent power for phase conductor p The apparent power is unsigned. Total apparent power (arithmetic) The apparent power is unsigned. 364
365 Chapter 10 Collection of formulas Ordinal numbers of harmonics xxx[0] = Fundamental oscillation (50Hz/60Hz) xxx[1] = 2nd harmonic (100Hz/120Hz) xxx[2] = 3rd harmonic (150Hz/180Hz) etc. THD THD (Total Harmonic Distortion) is the distortion factor and gives the relationship of the harmonic portions of oscillation to the fundamental oscillation. THD for voltage M = Ordinal number of harmonics M = 50 (UMG 605-PRO, UMG 511, UMG 512-PRO) Mains frequency fund equals n = 1 THD for current M = Ordinal number of harmonics M = 50 (UMG 605-PRO, UMG 511, UMG 512-PRO) Mains frequency fund equals n = 1 ZHD ZHD is the THD for interharmonics Is calculated in the device series UMG 511 and UMG 605-PRO Interharmonics Sinusoidal form oscillations, whose frequencies are not whole multipliers of the mains frequency (fundamental oscillation) Is calculated in the device series UMG 511 and UMG 605-PRO Calculation and measurement processes according to DIN EN The ordinal number of an interharmonic equates to the ordinal number of the next smallest harmonic. For example, the 3rd interharmonic lies between the 3rd and 4th harmonics. TDD (I) TDD (Total Demand Distortion) gives the relationship between the current harmonics (THDi) and the effective current value with full load. IL = Full load current M = 50 (UMG 605-PRO, UMG 511, UMG 512-PRO) 365
366 Chapter 10 Collection of formulas Ripple control signal U (EN ) The ripple control signal U (200 ms measured value) is a voltage measured with a carrier frequency specified by the user. Only frequencies below 3 khz are taken into consideration. Ripple control signal I The ripple control signal I (200 ms measured value) is a current measured with a carrier frequency specified by the user. Only frequencies below 3 khz are taken into consideration. Positive-negative-zero sequence component The proportion of voltage or current unbalance in a three-phase system is labelled with the positive, negative and zero sequence components. The symmetry of the three-phase system strived for in normal operation is disturbed by unbalanced loads, faults and operating equipment. - A three-phase system is referred to as exhibiting symmetry if the three phase conductor voltages and currents are of an equal size and are phaseshifted at 120 to each other. If one or both conditions are not fulfilled then the system is deemed unbalanced. Through the calculation of the symmetrical components comprising positive sequence component, negative sequence component and zero sequence component a simplified analysis of an unbalanced fault in a three-phase system is possible. Unbalance is a characteristic of the power quality, for which threshold values have been stipulated in international standards (e.g. EN 50160). Positive sequence component Pos Negative sequence component Neg 366
367 Chapter 10 Collection of formulas Zero sequence component A zero sequence component can only arise if a total current is able to flow back via the neutral conductor. Zero sequence component Voltage unbalance Downward deviation U (EN ) down down Downward deviation I down Rated current down Rated current K factor The K factor describes the increase in eddy current losses with a harmonics load. In the case of sinusoidal loading of the transformer the K factor = 1. The greater the K factor, the more heavily a transformer can be loaded with harmonics without overheating. Power Factor (arithmetic) The power factor is unsigned. cos phi Fundamental Power Factor Only the fundamental oscillation is used in order to calculate the cos phi cos phi sign: - = for delivery of effective power + = for consumption of effective power 367
368 Chapter 10 Collection of formulas cos phi sum cos phi sign: - = for delivery of effective power + = for consumption of effective power Phase angle Phi The phase angle between current and voltage of phase conductor p is calculated and depicted per DIN EN The sign of the phase angle corresponds with the sign of the reactive power. Fundamental oscillation reactive power The fundamental oscillation reactive power is the reactive power of the fundamental oscillation and is calculated with the Fourier analysis (FFT). The voltage and current do not need to be sinusoidal in form. All reactive power calculations in the device are fundamental oscillation reactive power calculations. Reactive power sign Sign Q = +1 for phi in the range (inductive) Sign Q = -1 for phi in the range (capacitive) Reactive power for phase conductor p Reactive power of the fundamental oscillation Sign 368
369 Chapter 10 Collection of formulas Total reactive power Reactive power of fundamental oscillation Distortion reactive power The distortion reactive power is the reactive power of all harmonics and is calculated with the Fourier analysis (FFT). The apparent power S contains the fundamental oscillation and all harmonic portions up to the Mth harmonic. The effective power P contains the fundamental oscillation and all harmonic portions up to the Mth harmonic. M = 50 (UMG 605-PRO, UMG 512-PRO) Reactive energy per phase Reactive energy per phase, inductive for Q L1 (t) > 0 Reactive energy per phase, capacitive for Q L1 (t) < 0 Reactive energy, sum L1 L3 369
370 Chapter 10 Collection of formulas Reactive energy, sum L1 L3, inductive for Q L1 (t) + Q L2 (t) + Q L3 (t) > 0 Reactive energy, sum L1 L3, capacitive for Q L1 (t) + Q L2 (t) + Q L3 (t) < 0 370
371 Chapter 10 Current transformer General information on current transformers General information Current transformers are predominantly utilised in areas in which it is not possible to measure current directly. They are a special type of transformer with a defined degree of precision (class), which translates the primary current into a (usually) smaller, standardised secondary current, as well as galvanically separating primary and secondary circuits from each other. The physical saturation (especially with monitoring CTs) of the core material additionally guarantees protection of the secondary circuit from higher currents. It is fundamentally possible to distinguish between single-phase current transformers and winding current transformers. The most frequent form of single-phase current transformer is the moulded case feed through current transformer, which is plugged onto the current-carrying phase and therefore forms a transformer with primary winding (and secondary windings in accordance with the transformation ratio). Fig.: Feedthrough CTs Selecting current transformers Transformation ratio The transformation ratio is the relationship between the primary rated current and the secondary rated current, and is cited on the rating plate as an unsimplified fraction. Most frequently, x / 5 A current transformers are used. The majority of measuring devices have the highest precision class at 5 A. For technical and moreover economic reasons, x / 1 A current transformers are recommended with long measuring cable lengths. The line losses with 1-A transformers is only 4 % in comparison to 5-A transformers. However, the measuring devices here frequently exhibit a lower accuracy of measurement. Rated current Rated or nominal current (earlier designation) is the value of the primary and secondary current cited on the rating plate (primary rated current, secondary rated current), for which the current transformer is dimensioned. Standardised rated currents are (apart from in the classes 0.2 S and 0.5 S) A, as well as the decimal multiples and fractions thereof. Standardised secondary currents are 1 and 5 A, preferably 5 A. Standardised rated currents for the classes 0.2 S and 0.5 S are A and their decimal multiples, as well as secondary (only) 5 A. 371
372 Chapter 10 Current transformer Correct selection of the primary nominal current is important for the accuracy of measurement. Recommended is a ratio slightly beyond the measured / defined maximum load current (In). Example: In = 1,154 A; selected transformer ratio = 1,250/5. The nominal current can also be defined on the basis of the following considerations: Dependent on the mains supply transformer nominal current times approx. 1.1 (next transformer size) Protection (rated fuse current = CT primary current) of the measured system part (LVDSB, subdistribution boards) Actual nominal current times 1.2 (if the actual current lies considerably below the transformer or fuse nominal current then this approach should be selected) Over-dimensioning the current transformer must be avoided, otherwise the accuracy of measurement significantly decrease especially with small load currents. Rated power The rated power of the current transformer is the product of the rated load and the square of the secondary rated current and is quoted in VA. Standardised values are VA. It is also permissible to select values over 30 VA according to the application case. The rated power describes the capacity of a current transformer to "drive" the secondary current within the error limits through a load. Calculation of rated power S n : Copper line = 10 m 2.5 mm² When selecting the appropriate power it is necessary to take into consideration the following parameters: Measuring device power consumption (with connection in series), line length, line cross-section. The longer the line length and the smaller the line cross-section, the higher the losses through the supply, i.e. the nominal power of the CT must be selected such that this is sufficiently high. The power consumption should lie close to the transformer's rated power. If the power consumption is very low (underloading) then the overcurrent factor will increase and the measuring devices will be insufficiently protected in the event of a short circuit under certain circumstances. If the power consumption is too high (overloading) then this has a negative influence on the accuracy. Current transformers are frequently already integrated in an installation and can be used in the event of retrofitting with a measuring device. It is necessary to note the nominal power of the transformer in this case: Is this sufficient to drive the additional measuring devices? S n : Copper line* = 3.5 VA S n : Measuring instrument = 2 VA S n : Reserve* = 2 VA Copper line = 2 x 10 m S n : Total = S n Copper line* + S n Measuring instrument + S n Reserve** Example: S n Total = 3.50 VA + 2 VA + 2 VA S n Total = 7.50 VA * Determination of the burden ** S n reserve < 0.5 x (S n copper line + S n measuring instruments) Fig.: Calculation of the rated power S n (Copper line 10 m) 372
373 Chapter 10 Current transformer Precision classes Current transformers are divided up into classes according to their precision. Standard precision classes are 0.1; 0.2; 0.5; 1; 3; 5; 0.1 S; 0.2 S; 0.5 S. The class sign equates to an error curve pertaining to current and angle errors. The precision classes of current transformers are related to the measured value. If current transformers are operated with low current in relation to the nominal current then the accuracy of measurement declines. The following table shows the threshold error values with consideration to the nominal current values: Precision class Current fault Fj in % with % of the rated current 1 % 5 % 20 % 50 % 100 % 120 % 150 % 200 % ext ext S ext ext S We always recommend current transformers with the same precision class for the UMG measuring devices. Current transformers with a lower precision class lead in the complete system current transformer + measuring device to a lower accuracy of measurement, which is defined in this case by the precision class of the current transformer. However, the use of current transformers with a lower accuracy of measurement than the measuring device is technically feasible. Current transformer error curve Over current for monitoring CTs FS5 Over current for monitoring CTs FS10 F i / % E i / % Working Current Area Error Limit Curve for cl. 1 Error Limit Curve for cl. 3 Fehlergrenzkurve für Kl. 3 % / I N Example for a measuring c.t. of cl. 1 FS5 and 1/1 burden Beispiel eines Strom-Messwandlers der Kl. 1 FS5 bei 1/1 Bürde Example for a measuring c.t. of cl. 1 FS5 and 1/4 burden Beispiel eines Strom-Messwandlers der Kl. 1 FS5 bei 1/4 Bürde Arbeitsstrombereich FS5-limit FS5-Grenze Example for a protection c.t. 10P10 and 1/1 burden Beispiel eines Schutzwandlers 10P10 bei 1/1 Bürde Überstrombereich für Messwandler FS5 Überstrombereich für Messwandler FS10 Example for a protection c.t. 10P10 and 1/4 burden Beispiel eines Schutzwandlers 10P10 bei 1/4 Bürde 373
374 Chapter 10 Current transformer Measurement current transformer vs. protection current transformer Whilst measurement current transformers are intended to reach saturation point as quickly as possible once they exceed their operational current range (expressed by the overcurrent factor FS) in order to avoid an increase in the secondary current with a fault (e.g. short circuit) and to protect the connected devices. With protection transformers saturation should lie as far out as possible. Protection transformers are used for system protection in conjunction with the requisite switchgear. Standard precision classes for protection transformers are 5P and 10P. "P" stands for "protection" here. The nominal overcurrent factor is placed after the protection class designation (in %). Therefore, 10P5 for example means that with a five-fold nominal current the negative secondary-side deviation from the anticipated value will be no more than 10% according to the ratio (linear). The use of measurement current transformers is strongly recommended for the operation of UMG measuring devices. Standard current transformer bus bar Type Primary currents in A Bus bar sizes in mm Feedthrough current transformer IPA x x x 20 IPA x x x 20 6A x x 20 7A x 12 2 x 30 x 10 8A x 12 2 x 40 x 10 9A x 15 2 x 50 x 10 Split core current transformer Split x 60 x x 35 Split x 60 x x 35 Split x 60 x x 35 Split x 60 x x 35 Split x 60 x x 35 Split x 60 x x 35 Split x 60 x x 35 Split x 60 x x 35 Split x 60 x x 35 Split x 60 x x 35 Split ,000 2 x 80 x x 32 Split ,200 2 x 80 x x 32 Split ,250 2 x 80 x x

375 Chapter 10 Current transformer Split ,500 Split ,600 Split ,000 Special version Deviating primary rated current Deviating secondary rated current Deviating construction type Deviating rated frequency Expanded class precision and load durability Type-approved / calibrated transformer On request On request On request On request On request On request 2 x 80 x x 32 2 x 80 x x 32 2 x 80 x x 32 Current transformer construction types Moulded case feedthrough current transformer The phase to be measured (conductor rail or line) is fed through the CT window and forms the primary circuit for the current transformer. Feedthrough transformers are predominantly used for mounting on bus bars. Through additional potting it is possible to achieve droplet-tightness, as well as greater shock and vibration resistance with mechanical loading (IEC 68). This is the most common form of current transformers, with the disadvantage that the primary conductor must be interrupted during installation. This form of transformer is therefore most commonly used in new system installations. Split core current transformer Split core current transformers are frequently used with retrofit applications. With these transformers the transformer core is open ready for installation, and is therefore fitted around the bus bars. This enables installation without interrupting the primary conductor. Fig.: Split core current transformer Cable type split core current transformer Cable type split core current transformers are exclusively suitable for installation in isolated primary circuit conductors (supply cables) in weatherproof and dry locations. Installation is possible without interrupting the primary conductor (i.e. with ongoing operation). Fig.: Cable type split core current transformer 375

376 Chapter 10 Current transformer DIN rail current transformer with voltage tap and fuse The DIN rail current transformer is a highly compact special variant with integrated voltage tap. The DIN rail current transformer comprises a terminal strip, current transformer and the voltage tap terminal with fuse. The fuse is fitted directly on the primary conductor and the unprotected part of the measurement line is therefore very short. This guarantees a high degree of intrinsic safety. The DIN rail current transformer is simple to wire, results in low installation costs and a high degree of reliability due to few connections, and is also spaceefficient and exhibits only very few connection faults. Fig.: DIN rail current transformer Installation of current transformers Installation orientation P1 P2 Determine the flow direction of the energy in the cable that you wish to measure. P1 indicates the side on which the current source is located, whilst P2 indicates the load side. Terminal block S1 S1 S2 S2 Load Terminals S1/S2 (k/l) The connections of the primary winding are designated "K" and "L" or "P1" and "P2", and the connections of the secondary winding are designated "k" and "l" or "S1" and "S2". The polarity must be established such that the "flow direction of the energy" runs from K to L. Fig.: Installation orientation Energierichtung Direction of energy Inadvertently swapping the terminals S1/S2 leads to erroneous measurement results and can also cause incorrect control behaviour with Emax and PFC systems. Wechselstrom hat keine eindeutige Richtung, sondern pendelt hin und her. AC current does not have any direction since it oscillates. Die Energie hat auch with bie Wechselstrom einen eindeutige Richtung, Bezug oder Rückspeisung. The energy does have a definite direction even at AC current, consumption or supply. Fig.: Installation orientation of current transformers I sn A s1 k s2 I I pn K P1 L P2 Energieflussrichtung Fig.: Direction of energy flow 376
377 Chapter 10 Current transformer Line length and cross-section The power consumption (in W) caused by the line losses is calculated as follows: specific resistance for CU: Ohm *mm² / m for AI: Ohm * mm² / m L = Line length in m (outward and return line) I = Current in Amperes A = Line cross-section in mm² Brief overview (power consumption copper line) for 5 A and 1 A: With every temperature change of 10 C the power consumed by the cables increases by 4 %. Power consumption in VA at 5 A Nominal cross-section 1 m 2 m 3 m 4 m 5 m 6 m 7 m 8 m 9 m 10 m 2.5 mm² mm² mm² mm² Power consumption in VA at 1 A Nominal cross-section 10 m 20 m 30 m 40 m 50 m 60 m 70 m 80 m 90 m 100 m 1.0 mm² mm² mm² mm² mm² Example of current transformer capacity and line length Secondary current = 1 A Line = 0.75 mm² Current transformer capacity / line length Secondary current = 5 A Line = 2.5 mm² Current transformer capacity / line length Class 0.5 Class 1 Class 3 Class 0.5 Class 1 Class VA / 5 m 0.5 VA / 5 m 0.25 VA / 1 m 0.5 VA / 0.7 m 0.5 VA / 0.7 m 0.5 VA / 0.7 m 1 VA / 15 m 1 VA / 15 m 0.5 VA / 5 m 1 VA / 2.1 m 1 VA / 2.1 m 1.5 VA / 3.5 m 2.5 VA / 47 m 1.5 VA / 26 m 1 VA / 15 m 2.5 VA / 6 m 2.5 VA / 6 m 2.5 VA / 6 m 5 VA / 100 m 2.5 VA / 47 m 1.5 VA / 26 m 5 VA / 13 m 5 VA / 13 m 10 VA / 205 m 5 VA / 100 m 10 VA / 27 m 10 VA / 200 m 20 VA / 55 m 20 VA / 400 m Serial connection of measuring devices to a current transformer Pv = UMG 1 + UMG P Line + P Terminals.? 377

378 S2 S1 S2 S1 S2 S1 Chapter 10 Current transformer Operation in parallel / summation current transformer If the current measurement is carried out via two current transformers, the overall transformer ratio of the current transformers must be programmed into the measuring device. Example: Both current transformers have a transformer ratio of 1,000/5A. The total measurement is carried out using a summation current transformer 5+5 / 5 A. The UMG must then be set up as follows: Fig.: UMG 508 Current measurement via summation transformer Primary current: 1,000 A + 1,000 A = 2,000 A Secondary current: 5 A Grounding of current transformers According to VDE 0414, current and voltage transformers should be secondary grounded from a series voltage of 3.6 kv. With low voltage it is possible to dispense with grounding if the current transformers do not possess large metal contact surfaces. However, common practice is to ground low voltage transformers too. Customary is grounding on S1. However, grounding can also take place on the S1(k) terminal or S2(k) terminals. Important: Always ground on the same side! Loads UMG 96RM-EL Power supply Measuring voltage Current measurement voltage N/- L/+ V1 V2 V3 VN V/400V 50Hz S2 S1 S2 S1 S2 S1 Fig.: Connection example UMG 96RM-EL Ethernet 10/100Base-T RJ45 PC L1 L2 L3 N Use of protection current transformers In the event of retrofitting a measuring device and the exclusive availability of a protective core, we recommend the use of a winding current transformer 5/5 for decoupling the protective core. 378

379 Chapter 10 Current transformer Operation of current transformers Exchanging a measuring device (short-circuiting of current transformers) The current transformer secondary circuit should never be opened when current is flowing into the primary circuit. The current transformer output constitutes a current source. With an increasing burden the output voltage therefore increases (according to the relationship U = R x I) until saturation is reached. Above saturation point the peak voltage continues to rise with increasing distortion, and attains its maximum value with an endless burden, i.e. open secondary terminals. With open transformers it is therefore possible that voltage peaks may arise, which could pose a risk of danger to persons and may also destroy measuring devices when reconnected. It is therefore the case that open operation of CTs must be avoided and unloaded current transformers must be short circuited. Current transformer terminal block with short circuit devices In order to short circuit current transformers and for the purpose of recurrent comparative measurements it is recommended that special terminal block for DIN rails be used. These comprise a cross-disconnect terminal with measuring and test equipment, insulated bridges for grounding and short circuiting of the current transformer terminals. Fig.: Current transformer terminal block Overloading of measurement CTs Primary current overloading: Primary current too high --> Saturation of the core material --> Precision declines dramatically. Nominal power overloading: Too many measuring devices or excessively long lines are connected to a transformer with its defined nominal power --> Saturation of the core material --> Precision declines dramatically. Instance of short circuit at CT secondary side In the event of a short circuit no signal is available. It is not possible to measure with the measuring device. Current transformers can (or must) be short circuited if no load is present (measuring device). 379
380 Chapter 10 Current transformer Operation with harmonics Our current transformers generally measure harmonics up to 2.5 khz (50th harmonic) and many types also measure to 3 khz and even beyond. However, with higher frequencies the eddy current losses increase and heating up is consequently also greater. If the total harmonic distortion is too high then the current transformer must be designed with thinner sheets. However, it is not possible to make a general statement regarding a threshold value of the total harmonic distortion because heating up is dependent on core size, transformer surface (cooling), ambient temperature, ratio, etc. Power requirement UMGs, energy meter, measuring devices Measuring device type Power consumption current measurement input in VA Analogue ammeter 1.1 UMG 103-CBM / 104 / 604-PRO / 605-PRO 0.2 UMG 96RM 0.2 UMG 96RM-E 0.2 UMG 508 / 509-PRO 0.2 UMG 511 / 512-PRO 0.2 ECSEM series energy meter 0.36 Power consumption UMG 96RM-E per current measurement input UMG 96RM-E 0.2 VA + 4 metre 2-wire line 2.5 mm² 1.64 VA = Gives the power consumption of the measuring equipment the CT 1.84 VA has to be rated for The special case: Larger current transformer lower current Tip: Select a current transformer that is suitable for the measurement of a nominal current of 50 A. In order to divide the normal current of a current transformer by two it is actually sufficient to run this current through the transformer twice. Current transformer 50 / 5 A, Imax = 50 A Equivalent to a transformer 100 / 5 A, Imax = 50 A 380

381 Chapter 10 Overvoltage categories Overvoltage categories Electrical distribution systems and loads are becoming increasingly complex. This also results in the likelihood of transient overvoltage increasing. Power electronic modules in particular (e.g. frequency converters, phase angle and trailing-edge control, PWM-controlled power switches) generate temporary voltage peaks in conjunction with inductive loads, which can be significantly higher than the respective nominal voltage. In order to guarantee user safety, four overvoltage categories (CAT I to CAT IV) are defined in DIN VDE 0110 / EN The measurement category indicates the permissible application ranges of measuring and test devices for electrical operating equipment and systems (e.g. voltage testers, multimeters, VDE test devices) for application in low voltage network areas. Defined categories and application purposes in IEC : The following categories and application purposes are defined in IEC : CAT I Measurements on current circuits that have no direct connection to the mains network (battery operation), e.g. devices in protection class 3 (operation with protective low voltage), battery-operated devices, car electrics CAT II Measurements on current circuits that have a direct connection by means of a plug with the low voltage network, e.g. household appliances, portable electrical appliances CAT III Measurements within the building installation (static loads with direct fixed connection, distribution connection, fixed installation appliances in the distribution system), e.g. sub-distribution. Measurements at the source of the low voltage installation (meter, main CAT IV connection, primary overcurrent protection), e.g. revenue meters, low voltage overhead lines, utility service entrance box The categories are also subdivided into the voltages 300 V / 600 V / 1,000 V. The category is particularly significant for safety during measurements, because low-resistance current circuits exhibit higher short circuit currents and / or the measuring device is also required to withstand disturbances in the form of load switching and other transient overvoltages, without the user being endangered by electric shocks, fire, sparks forming or explosions. Due to the low impedance of the public grid, short circuit currents are at their g reatest at the house infeed. Inside the home, the maximum short circuit currents are reduced through the system's series impedances. Technically, compliance with the category is ensured for example through the contact protection of plugs and sockets, insulation, sufficient clearance and creepage distances, the strain relief and kink protection of cables, as well as sufficient cable cross-sections. CAT I CAT II CAT III CAT IV Fig.: Graphic illustration of the CAT categories 381
382 Chapter 10 Overvoltage categories In practice Our experience and understanding shows that many users are not sufficiently familiar with this subject. In some applications, the subject of overvoltage categories may result in a need to change from a UMG 604-PRO with 300 V CAT-III to a UMG 508 with the overvoltage category 600 V CATIII, i.e. instead of a 4,000-V measurement voltage surge, a 50 % higher measurement voltage surge of 6,000 V is attained! However, it may also result in the shifting of the measurement point. This means additional safety for man and machine! The combination of the CAT category and the defined voltage level gives the measurement voltage surge. Rated voltages of power supply systems (networks) with various types of overvoltage limitation Voltage conductor to neutral conductor, taken from rated AC voltage or rated DC voltage up to and including Rated voltages presently in use worldwide Three-phase 4-conductor systems with grounded neutral conductor E Three-phase 3-conductor systems, ungrounded Single-phase 2-conductor systems, AC or DC voltage Single-phase 3-conductor systems, AC or DC voltage Measurement voltage surge for operating equipment Overvoltage categories V V / 208* 127 / 220 V V 115, 120, ** 110, 220 V ** I II III IV 800 1,500 2,500 4, / 380, 230 / / 415, 260 / / / 600, 380 / / 690, 417 / **, 220, 230, 240, 260, 277, 347, 380, 400, 415, ,500 2,500 4,000 6, ,500 4,000 6,000 8,000 * Conventional in the United States of America and Canada. ** Conventional in Japan. 382
383 Chapter 10 RS485 interface Communication via the RS485 interface If it is necessary to network economical measuring devices with each other, the RS485 interface with Modbus RTU protocol remains the benchmark. The simple topology configuration, the lack of sensitivity to EMC interference and the open protocol have been outstanding features of the combination of RS485 and Modbus RTU protocol for years. The full name of the RS485 standard is TIA / EIA-485-A. The most recent update was in March 1998 and the standard was confirmed in 2003 without changes. The standard only defines the electrical interface conditions of the sender and receiver, it does not say anything about the topology or the lines to be used. This information can either be found in the TSB89 "Application Guidelines for TIA / EIA-485-A" or in the application descriptions of the RS485 driver module manufacturers, such as Texas Instruments or Maxim. According to the OSI model (Open Systems Interconnection Reference Model)* only the "physical layer" and not the protocol is described. The protocol used may be selected on an arbitrary basis, e.g. Modbus RTU, Profibus, BACnet etc. The communication between the sender and receiver takes place on a wired basis via shielded, twisted pair cable. One cable pair should only ever be used here for A and B (Fig.: Image 1b). If the interface is not galvanically separated then the common connection must also be routed with it (Fig.: Image 1b). More on this later. Fig.: Image 1a Fig.: Image 1b Fig.: Image 1 The transfer of data takes place via a differential, serial voltage signal between lines [A] and [B]. Because data is transferred on the lines between sender and receiver, one also refers here to half-duplex or alternating operation. Each receiver or sender has an inverted and a non-inverted connection. The data transfer takes place symmetrically. This means that if one line has a "high" signal then the other has a "low" signal. Line A is therefore complementary to B and vice versa. The advantage of measuring the voltage difference between A and B is that common mode interference has largely no influence. Any common mode interference is coupled on both signal lines approximately equally, and due to the differential measurement it therefore has no influence on the data that is to be transferred. The sender (driver) generates a differential output voltage of at least 1.5 V at 54 Ohm load. The receiver has a sensitivity of +/-200 mv (Fig. Image 2). Fig.: Image 2 The state logic here is as follows (Fig. Image 3): A B < 0.25 V = Logic 1 A B > 0.25 V = Logic 0 The labelling of connections A / B is often not uniform. What is A with one manufacturer, may be B with the next. Why is this the case? The definition says: A = "-" = T x D- / R x D - = inverted signal B = "+" = T x D + / R x D + = non-inverted signal Furthermore, a third line "C" = "Common" is also cited. This line is for the reference ground. * Open Systems Interconnection Reference Model (OSI): Driver = Sender; Receiver = Recipient; Transceiver = Sender / Receiver Fig.: Image 3 383
384 Chapter 10 RS485 interface However, some RS485 chip manufacturers such as Texas Instruments, Maxim, Analog Devices etc. have always used an alternative designation, which has since also become commonplace: A = "+" = T x D + / R x D + = non-inverted signal B = "-" = T x D - / R x D - = inverted signal Due to this confusion, some device manufacturers have introduced their own designations: D+ = "+" = T x D + / R x D + = non-inverted signal D- = "-" = T x D - / R x D - = inverted signal Through the [+] and [-] sign after the letter [D] it is clear which line is providing the inverted and the non-inverted signal. Janitza electronics GmbH predominantly uses transceiver ICs from Texas Instruments, Analog Devices or Maxim. For this reason, all of our measuring devices utilise the following designations: A = "+" = T x D + / R x D + = non-inverted signal B = "-" = T x D - / R x D - = inverted signal The voltages are defined in the datasheets as follows: V O = Differential voltage A B V OB = Voltage between B and C V OA = Voltage between A and C V OS = Driver offset voltage Fig.: Image 4 384
385 Chapter 10 RS485 interface The voltage VCM The voltage VCM (Common Mode Voltage) is the sum of the GND potential differences between the RS485 participants (Fig.: Image 5), the driver offset voltage and the common mode noise (Vnoise), acting on the bus line. The RS485 driver manufacturers give a voltage range for VCM of -7 to 12 V. With communication problems, this voltage range - resulting from the potential differences between sender and receiver - is frequently impeded if the interface is not galvanically separated by configuration or no common line exists. Image 6 shows the calculation of the common mode voltage. V OS = V OA + V OB 2 Fig.: Image 5 V CM = V OS + V noise + V GPD Fig.: Image 6 V GPD (Ground potential differences) V GPD is the potential difference between sender and receiver here GND (PE). Potential differences between the connections (grounding) often arise with larger spatial expansion of the RS485 bus. These potential differences arise in particular with older electrical installations, because no intermeshed potential equalisation exists in many cases. Furthermore, the effects of lightening result in the potential difference between the PE connections in the distribution system approaching hundreds or thousands of volts. It is also possible under normal conditions that potential differences of a few volts may exist due to the equalisation currents of the loads. Vnoise (common mode noise) is an interference voltage that can have the following causes: 385
 Fig.")

386 Chapter 10 RS485 interface Interference voltage induced by a magnetic field on the bus line Fig.: Image 7 Capacitive coupling with system parts that are not galvanically separated ("parasitic capacities") Fig.: Image 8 Galvanic coupling Radiant coupling Electrostatic discharge Bus topology The bus is "multipoint-capable" and it is possible to connect up to 32 participants without a repeater. The best network topology here is the "daisy chain". This means that the bus cable runs directly from slave to slave. Fig.: Image 9 It is necessary to note that stub lines (branches) should be avoided in general. Stub lines cause reflections on the bus. In theory it is feasible to calculate a possible stub line depending on the transceiver used. However, this is complex in practice. The length of a possible stub line is heavily dependent on the signal rise time of the transceiver used and should be less than 1/10 of the signal rise time of the driver. The higher the possible Baud rate of the transceiver, the 386
387 Chapter 10 RS485 interface smaller the signal rise time of the driver. This means one must know which IC has been installed with the bus participants. Furthermore, the signal speed of the cable must also be applied in the calculation. For this reason, one should avoid stub lines in general. Termination A further cause of communication interruptions are bus reflections. A reflection arises if the sender signal has not been fully absorbed by the load. The source impedance should reflect the load impedance and the line surge impedance, because the full signal power is attained through this and only minimum reflections arise. Serial communication of the RS485 interface functions most efficiently when the source and load impedance are harmonised at 120 Ohm. For this reason, the RS485 standard recommends a bus line with a line surge impedance of Z 0 = 120 Ohm. In order that reflections are avoided on the bus, the bus line must be equipped with a termination resistor at the start and end, and this must reflect the line surge impedance. Fig.: Image 10 "Failsafe Bias" resistors If the receiver inputs fall within the range of -200 mv to mv, the output of the receiver module is undetermined, i.e. it is not possible for an evaluation of the RS485 signal to take place. This is the case under the following conditions: No sender active The bus line has been interrupted (e.g. line break) The bus line has short circuited (e.g. line damaged, etc.) Under these conditions the RS485 bus must be brought to a defined signal status. Some communication buses do not have this problem because only one sender exists for example, which controls the line. The sender is either active or inactive. However because the RS485 bus is multipoint-capable, multiple senders can be connected. In order that the signal status is clear under the aforementioned conditions, one generally uses a "pull up" resistor between +5 V and the signal line A and a "pull down" resistor between GND and signal line B. The resistors can theoretically be placed at an arbitrary point in the bus. However, these are generally used with a master in a potential divider group with termination resistor because readily assembled connectors exist for this purpose. 387
388 Chapter 10 RS485 interface With some manufacturers one generally only finds a recommendation to install a termination resistor at the start and end, in order that reflections can be avoided (see section on termination or bus configuration UMG 604-PRO with UMG 103-CBM). Why is this the case? In this case the manufacturers have used transceivers for the RS485 interface, which already have an integrated internal Failsafe Bias in the chip, i.e. with 0 V at the receiver input for example, the output automatically has a logical "High" state. With Maxim (as used in the UMG 604-PRO and UMG 103-CBM) the function is called "True fail-safe". An external Failsafe Bias then only remains necessary if participants are connected to the same bus, which do not possess this function. The bus load is otherwise unaffected by the "True fail-safe" function. The "common connection" or "galvanic separation" The bus participants generally obtain their supply voltage from different areas of the electrical installation. With older electrical installations in particular, it is therefore possible that considerable potential differences can arise between grounding. However, for fault-free communication the voltage Vcm can only lie within the range of -7 to +12 V, i.e. the voltage V GPD (Ground potential differences) must be as small as possible (image 11 a, image 5). If the RS485 interface is not galvanically separated from the supply voltage then the common connection must be routed with it (image 11 b). However, connection with the common connections may result in a current loop, i.e. without additional measures a higher compensation current will flow between the bus participants and ground. Developers generally prevent this by decoupling the GND of the RS485 interface from the ground with a 100-Ohm resistor (image 11 c). A better alternative is the galvanic separation of the RS485 interface from the supply voltage through an internal DC/DC converter and a signal isolator. This means that potential differences in the ground have no effect on the signal. The differential signal therefore "floats". Even better still is the galvanic separation of the RS485 interface in combination with a common connection. Image 12 shows mixed operation between participants of galvanically separated and non-galvanically separated interfaces. The participants with the galvanically separated RS485 have no common connection in the example. In this case it is necessary to ensure that the common connections of the participants are connected with each other. Despite this, communication interferences can arise due to EMC coupling capacitors. This results in the non-galvanically separated participants no longer being able to interpret the signal. In this case the bus must be separated and an additional galvanic coupling must be integrated between the participant circuits. 388
389 Chapter 10 RS485 interface Fig.: Image 11 Fig.: Image 12 Note: The screening must never be connected to the common connection of the RS485 interface. This would result in faults being directly coupled with the GND of the RS485 transceiver. 389

390 Chapter 10 Ports, protocols and connections Analysis and optimisation of RS422 and RS485 bus systems Our recommendation: MSB-RS485 Analyser The perfect combination of hardware and software analysis Independent analyser device, controlled and supplied via USB Rapid real-time signal/data processing by hardware Delivers data accurate to the microsecond regarding every line change Equipped with numerous visualisation tools, enabling a detailed insight into all RS422/485 communication Detects faults with bus enabling, timeouts or with incorrect/double addressing Variable connection types allow the complete logging of all bus activities, as well as targeted logging of the data sent by selected bus participants. OS-independent time logging of all events in 1 µs resolution Simultaneous display of the Tri-State signal level and the transferred data. Detection of inactive bus states and invalid line level Measurement and use of ALL Baud rates from MBaud Automatic detection of Baud rate, data bits and parity. Supports 9 Bit data word protocols Available from Ports, protocols and connections UMG 604-PRO / UMG 605-PRO / UMG 508 / UMG 511 Protocols Ports TFTP 1201 Modbus / TCP Modbus / UDP 502, 4 Ports DHCP 68 NTP 123 BACnet Nameservice 1200 HTTP 80 FTP 21 FTP data port 1024, 1025 FTP data port 1026, 1027 Modbus over Ethernet 8000, 1 Port Service port (telnet) 1239 SNMP 161 / 162 (TRAP) port (actual) 25 port (in preparation) 587 GridVis Protocols Ports Modbus / TCP Modbus / UDP 502 HTTP 80 FTP 21 FTP data port 1024, 1025 FTP data port 1026, 1027 Modbus / TCP 502 Modbus over Ethernet 8000 Read out telnet data port 1239 Update telnet data port 1236, port (in preparation) 25 port (in preparation) 587 UMG 103-CBM / UMG 104 Protocols The devices do not have an Ethernet connection Ports The devices do not have an Ethernet connection 390
391 Chapter 10 Ports, protocols and connections Number of TCP/UTP connections (UMG 604-PRO / 605-PRO / 508 / 511) A max. total of 24 connections are possible via the TCP group. The following applies: max. 24 connections - Port 21 (FTP): max. 4 connections - Port 25/587 ( ): max. 8 connections - Port (data port to every FTP port): max. 4 connections - Port 80 (HTTP): max. 24 connections - Port 502 (Modbus TCP/IP): max. 4 connections - Port 1239 (Debug): max. 1 connection - Port 8000 (Modbus or TCP/IP): max. 1 connection max. 4 connections max. 8 connections max. 4 connections (One FTP port requires a data port) max. 4 connections Connection-free communication via the UTP group - Port 68 (DHCP) - Port 123 (NTP) - Port 161/162 (SNMP) - Port 1200 (Nameservice) - Port 1201 (TFTP) - Port (BACnet) (Modbus or TCP/IP) max. 1 connections max. 1 connections Fig.: TCP group: max. 24 connections (queue scheduling) (UMG 604-PRO / 605-PRO / 508 / 511) The UMG 96RM-E supports the following protocols via Ethernet connection Client services DNS DHCP-Client (BootP) NTP (Client) (sending) Ports 53 (UDP / TCP) 68 (UDP) 123 (UDP) Selectable ( TCP) Server services Ping FTP HTTP NTP (only listen) SNMP Modbus TCP Device identification Telnet Modbus RTU (Ethernet encapsulated) Port (ICMP / IP) 20 (TCP)*, 21 (TCP) 80 (TCP) 123 (UDP Broadcast) 161 (UDP) 502 (UDP / TCP) 1111 (UDP) 1239 (TCP) 8000 (UDP) Fig.: UTP group: Connection-free communication (UMG 604-PRO / 605-PRO / 508 / 511) * Random port (> 1023) for data transfer, if work is taking place in PASSIVE mode The UMG 96RM-E can administrate 20 TCP connections. Client services are contacted by a device on a server via the specified ports, the server services make the device available. The following protocols are not supported. BACnet (47808 / UDP) 391
392 Chapter 10 Power factor correction Basics for power factor correction Active power If one connects an effective resistor, e.g. a heating device, in an alternating current circuit then the current and voltage are in phase. The momentary power values (P) are determined with alternating current through the multiplication of associated momentary values of current (I) and voltage (U). The course of the active power is always positive with doubled mains frequency. The AC power has the peak value P = U x I. Through area conversion it can be converted into the equivalent DC power, the so-called active power P. In the event of effective resistance, the active power is half the size of the peak power value. Fig.: Active power formula In order to determine the AC power, one always calculates using the effective values. Active and reactive power Fig.: AC power with purely ohmic load A purely ohmic load rarely arises in practice. An inductive component usually also arises. This applies to all loads, which require a magnetic field in order to function (e.g. motors, transformers, etc.). The current used, which is required in order to generate and reverse the polarity of the magnetic field, is not dissipated but flows back and forth as reactive current between the generator and the load. Phase shifting arises, i.e. the zero point transitions for voltage and current are no longer congruent. With an inductive load the current follows the voltage, with a capacitive load the relationship is precisely the opposite. If one now calculates the momentary power values (P = U x I), negative values will always arise if one of the two factors is negative. Fig.: Calculation of the effective power with ohmic and inductive load Example: Phase shifting φ = 45 (equates to an inductive cos φ = 0.707). The power curve overlaps in the negative range. Fig.: Voltage, current and power with mixed ohmic, inductive load 392
393 Chapter 10 Power factor correction Reactive power Inductive reactive power arises for example in motors and transformers without consideration to line, iron and friction losses. If the phase shifting between current and voltage is 90, e.g. with "ideal" inductance or with capacity, then the positive and negative area portions are of equal size. The effective power is then equal to the factor 0 and only reactive power arises. The entire energy shifts back and forth here between load and generator. Fig.: Voltage, current and power with pure reactive load Fig.: Determination of the inductive reactive power Apparent power The apparent power is the electrical power that is supplied to or is to be supplied to an electrical load. The apparent power S is derived from the effective values of current I and voltage U. In the event of insignificant reactive power, e.g. with DC voltage, the apparent power is the same as the active power. Otherwise this is greater. Electrical operating equipment (transformers, switchgear, fuses, electrical lines, etc.), which transfer power, must be appropriately configured for the apparent power to be transferred. S φ P Fig.: Power diagram Q I Fig.: Apparent power without phase shifting Apparent power with sinusoidal variables With sinusoidal variables the offset reactive power Q arises, if the phases of current and voltage are shifted by an angle φ. Fig.: The apparent power is the result of the geometric addition of active and reactive power. 393
394 Chapter 10 Power factor correction Power factor (cos φ and tan φ) The relationship of active power P to apparent power S is referred to as the effective power factor or effective factor. The power factor can lie between 0 and 1. With pure sinusoidal currents, the effective power factor concurs with the cosine (cos φ). It is defined from the relationship P/S. The effective power factor is a measure through which to determine what part of the apparent power is converted into effective power. With a constant effective power and constant voltage the apparent power and current are lower, the greater the active power factor cos φ. Fig.: Determination of the power factor over effective and apparent power The tangent (tan) of the phase shift angle (φ) facilitates a simple conversion of the reactive and effective unit. Fig.: Calculation of the phase shifting over reactive and effective power The cosine and tangent exist in the following relationship to each other: Fig.: Relationship to cos φ and tan φ In power supply systems the highest possible power factor is desired, in order to avoid transfer losses. Ideally this is precisely 1, although in practical terms it is around 0.95 (inductive). Energy supply companies frequently stipulate a power factor of at least 0.9 for their customers. If this value is undercut then the reactive energy utilised is billed for separately. However, this is not relevant to private households. In order to increase the power factor, systems are used for power factor correction. If one connects the capacitor loads of a suitable size in parallel then the reactive power swings between the capacitor and the inductive load. The superordinate network is no longer additionally loaded. If, through the use of PFC, a power factor of 1 should be attained, only the effective current is still transferred. φ 1 S φ 2 P Q c Q 2 Fig.: Power diagram with application of power factor correction I Q 1 The reactive power Qc, which is absorbed by the capacitor or dimensioned for this capacitor, results from the difference between the inductive reactive power Q1 before correction and Q2 after correction. The following results: Qc = Q1 Q2 Fig.: Calculation of the reactive power for the improvement of the power factor 394
395 Chapter 10 Power factor correction Calculation formula for the capacitor Capacitor output single-phase Example: 66.5 μf with 400 V / 50 Hz ² = 3,340 var = 3.34 kvar Capacitor output with delta connection Example: 3 x 57 μf with 480 V / 50 Hz ² = 12,371 var = kvar Capacitor output with star connection Example: 3 x 33.2 μf with 400 V / 50 Hz (400 / 1.73)² = 1670 var = 1.67 kvar Capacitor current in the phase conductor Example: 25 kvar with 400 V 25,000 / ( ) = 36 A Series resonant frequency (fr) and de-tuning factor (p) of de-tuned capacitors Example: p = 0.07 (7 % de-tuning) in the 50-Hz network f r = 395
396 Chapter 10 Power factor correction Required nominal capacitor output three-phase in de-tuned configuration Example: 3 x 308 μf with 400 V / 50 Hz with p = 7 % de-tuned / (1-0.07) = 50 kvar Which capacitor should be used for this? This means, for a 50-kvar stage, a 440-V-56-kvar capacitor is required. P Power factor and cos and tan conversion Conversion of the capacitor power subject of the mains voltage Determination of the reactive power Q new C is constant here. Example: Network: 400 V, 50 Hz, 3-phase Nominal capacitor data: 480 V, 70 kvar, 60 Hz, 3-phase, delta, un-choked Question: Resultant nominal capacitor power? new U new U new Q new = The resultant correction power of this 480-V capacitor connected to a 400-V-50-Hz network is just 40.5 kvar. Definition Q C Nominal capacitor power P Degree of de-tuning U C Capacitor voltage U N Nominal voltage N C Effective filter output Q new New reactive power U new New voltage f new New frequency f R Nominal frequency of the capacitor 396
397 Chapter 10 Power factor correction Cable cross-section and fuses With this table we provide general and non-binding information on standard practice. Connection cross-sections and the extent of protection are dependent not only on the nominal power of the PFC system but also on national regulations, the cable material used and the ambient conditions. The recommendation for the fuse current strength is for short circuit protection, HRC fuses are unsuitable for overload protection with power capacitors. The system installer or planning office are responsible for dimensioning and selecting the line cross-sections and fuses in individual cases. PFC cable cross-sections, fuses (with networks with 400 V / 50 Hz) Output kvar Rated current A Cable cross-section NYY-J mm x x x x x x x x x x x 35/ x 35/ x 70/ x 95/ x 120/ x 70/ x 95/ x 120/ x 150/ x 185/ HRC fuse in A Connection cross-sections only apply for the cited capacitor powers. Important information: When expanding existing systems, the busbar division must be carried out in advance! Power factor correction systems with power of over 300 kvar have two separate busbar systems and require two separate feeds. The table applies to conventional and de-tuned PFC systems. It is always necessary to observe the most recent valid specifications (e.g. DIN VDE 0298). 397
398 Chapter 10 Power factor correction cos phi Calculation of the requisite kvar PFC power This selection table has been generated for calculation of the requisite reactive power. You can determine a multiplier from the table using the actual power factor and the target power factor, and multiply this with the active power requiring correction. The result is the reactive power required for your power factor correction system. This calculation table can also be found as an MS Excel file on our homepage under cos phi selection table ACTUAL tan φ cos φ cos φ Target power factor Active power P = 100 kw ACTUAL cos φ = 0.65 TARGET cos φ = 0.95 Factor F from table = 0.84 Correction power Qc = P x (tan φ1 - tan φ2) P * F 100 x kvar Factor F


399 Chapter 10 Power factor correction Fixed PFC Selection table fixed PFC of motors Motor power in kw Capacitor power when idling in kvar (dependent on rpm) 3,000 1,500 1, Comment: Values only provide a guideline value It is essential to avoid overcorrection, in order to prevent overexcitation Guideline values for the individual correction of motors per VDEW Selection table fixed PFC of transformers Nominal Transformer power in kva Nominal capacitor power in kvar , , , , Comment: Values only provide a guideline value (with three-phase transformers with normal losses the PFC correction power is between 1 and 5 % of their nominal power depending on size) It is essential to observe regional energy supplier specifications. Ensure the appropriate back-up fuses and short circuit-proof lines 399
400 Chapter 10 Protection classes per EN Protection classes per EN Protection of electrical operating equipment Electrical operating equipment (e.g. lights, LED modules and operating devices) must belong to a certain protection class per EN according to their loading by foreign bodies and water. The protection classes are also referred to as IP codes. The abbreviation IP stands for "International Protection" or "Ingress Protection". The IP code per EN The protection class afforded by a housing is verified according to standardised test procedures. The IP code is used in order to classify this protection class. This comprises the two letters IP and a two-digit characteristic number. The protection classes refer exclusively to the protection against contact and the penetration of solid foreign bodies and dust (indicated by the first characteristic number of the IP code), as well as the harmful penetration of water (indicated by the second characteristic number of the IP code). The protection classes do not provide any information regarding the protection against external influences. Furthermore, the protection classes must not be confused with the electrical protection classes, which refer to the protective measures for the prevention of an electric shock. Important information: In addition to the protection class it is also always necessary to take into consideration the external influences and conditions. Code letters IP International Protection (Ingress Protection) Characteristic number 1 Protection against foreign bodies Protection against contact 0 No protection No protection 1 Protected against solid foreign bodies with a diameter from 50 mm Protected against access with the back of the hand 2 Protected against solid foreign bodies with a diameter from 12.5 mm Protected against access with a finger 3 Protected against solid foreign bodies with a diameter from 2.5 mm Protected against access with a tool 4 Protected against solid foreign bodies with a diameter from 1.0 mm Protected against access with a wire 5 Protected against dust in harmful quantities Full protection against contact 6 Dust-tight Full protection against contact Characteristic number 2 Protection against water 0 No protection 1 Protection against drops of water falling vertically 2 Protection against drops of water falling, if the housing is tilted up to 15 3 Protection against sprayed water falling, up to 60 from vertical 4 Protection against splash water on all sides 5 Protection against water jets (nozzle) from any angle 6 Protection against powerful water jets 7 Protection against intermittent submersion 8 Protection against continuous submersion 400
401 Chapter 10 VBI Prerequisite and confirmation for commissioning (VBI) General information The prerequisite and confirmation for commissioning (VBI) is used for the preparation and advance information for commissioning by Janitza electronics GmbH. The confirmation for correct electrical installation as well as the technical prerequisite for the installation of the software is needed prior to commissioning. Correct General information on the electrical installation of the Janitza measurement devices Incorrect Access: All devices are fully functional (auxiliary voltage, connection, etc.) and freely accessible for interface, connection and display. Interfaces: The bus connection between the devices and to the PC is correctly wired and functional. Information on the connection of the interfaces and wiring can be found in the associated operating instructions. Wiring: A stub has not been formed on the RS485 interface (see graphic). This means all devices have been connected in series to the power analyser. Bus cable: A bus cable has been used for the wiring of the RS485. The cable must be shielded and the wires (A&B) must be twisted with one another. We recommend the following bus cable: Li2YCY(TP)2x2x0.22). Terminal strip in the cabinet Device with RS485 interface (without termination resistor) Device with RS485 interface (with termination resistor on the device) Fig.: Modbus configuration Master: The following structure has been adhered to in the bus lines: The Master (UMG 507 / UMG 508 / UMG 511 / UMG 604-PRO / UMG 605-PRO / UMG 96RM-E) is the first participant on the bus. RS485: With UMG 507 / UMG 508 / UMG 511 the requisite Profibus connector has been used for the RS485 interface. The Profibus connector is essential as the RS485 interface is connected to the termination resistor. Set-up plan: A set-up plan of the bus connection of all bus-participants has been transferred beforehand per /fax to the responsible technician (support@janitza.com). Current transformer setting: The current transformer settings are implemented by the customer. If the setting of the transformer is part of the commissioning (see specification sheet), a device list with namerelated CT data must be transferred in advance to the responsible technician. 401
402 Chapter 10 VBI IP addresses: The device names and IP addresses must be defined, documented and communicated to the responsible technician prior to the commissioning. Settings: For measurement devices with an Ethernet connection, the IP addresses must be assigned. If the setting of the IP address is part of the commissioning (see specification sheet), a device list with IP address, subnet mask and gateway must be given in advance to the responsible technician. Termination resistor: A termination resistor of 120 Ohm must be placed at the beginning and end of a bus line between A and B. Devices with Profibus connectors are switched to ON. Connection: After connecting the measurement devices, the following measurement values must be checked: - The effective power of the individual phases should be positive. If this is not the case, there is a power feedback or a wrong CT connection (k and l miswired). - The cos phi of the individual phases should be above a realistic value of 0.5 (reference value). If this is not the case, the phase assignments of the current and voltage measurement must be checked. The current and voltage connection must be assigned correctly to the phases. Database: The database MySQL / MS SQL is installed and administrated. For the commissioning, it is important that a local responsible electrician / installer is present on site during the commissioning. 402
403 Chapter 10 VBI Software installation and network administration The following points show the prerequisite and properties of the GridVis evaluation and configuration software (status vers. 4) from Janitza electronics GmbH. GridVis licence: In order to activate GridVis an account is required on the Janitza licence server ( The account should be created prior to commissioning by the person responsible. For the Professional, Enterprise, Service editions, an activation code is required. The activation code can be purchased from a sales partner or from Janitza electronics. Internet access is required for the activation. Further information at: GridVis licence system in conjunction with VMware GridVis checks the licence system for the following parameters: - CPU: Key: HKLM\HARDWARE\DESCRIPTION\System\CentralProcessor\0 Values: "Identifier", "VendorIdentifier" - Machine: Key: HKLM\SOFTWARE\Microsoft\Windows NT\CurrentVersion Values: "ProductId", "CurrentVersion" DISK: Size of the root partition This value is determined by Java and can be viewed in the error report (file "SystemInfo.xml") filesystem\root\drive = hard drive name filesystem\root\totalspace = the value MAC: List of all MAC addresses (of the computer but only percentages) without a loopback and without a PointToPoint. System prerequisites: The GridVis evaluation and configuration software requires the following system prerequisites: - Up-to-date processor - Min. 4 GB RAM (standard database) - Min. 16 GB RAM (MySQL, MS SQL database) - Screen resolution min. 1,280 x 960 pixels - Installation storage space: 1 GB Supported operating systems: The following operating systems are supported by the GridVis evaluation and configuration software: - Windows XP (from Service Pack 3) - Windows Vista (from Service Pack 1) - Windows 7, Windows 8 - Windows Server (from Version 2003 R1) - Linux (x86, x64; from Java 7) (Note: no support) 403
404 Chapter 10 VBI Memory reserves: The memory capacity required for archiving the data depends on the number of measurement devices. Approx. 500 MB memory per year can be assumed for one measurement device. (Number of devices times 500 MB times the years of archiving). A precise calculation can be carried out with the following Excel sheet: GridVis -Basic: GridVis -Basic is supplied with the Derby and Janitza database as standard. A maximum of 5 devices can be integrated in the software. The installation / administration of the database MySQL / MS SQL is not a component of commissioning. The following data must be provided to the individual who commissions the system: - IP database - Port number - Name of the database - User and password GridVis license model / software variants: Description Basic Professional Service Ultimate Installations (desktop) Installations (service / virtual server) Number of measurement devices 5 not limited not limited not limited Update period not limited 1 year 1 year 1 year Telephone support not limited not limited not limited not limited Graphs *2 *2 Data base Janitza DB / Derby DB Manual reports *2 *2 Graphical programming *2 *2 Topology *2 *2 Data base support MS-SQL / MySQL *1 - Automatic reading - Virtual device - User administration - Scheduling points in time - CSV data import - RCM report - Scheduling time periods - - PQ report - - Automatic Excel export - - Generic Modbus - - Graphic programming module - - (write/read Modbus) *2 Automatic reports - - *2 *2 Online recording - - Service - - Alarm management - - REST-API - - Web visualization GridVis -Energy Item number Item number extension update per year Item number upgrade to next higher suite * 1 SQL data base is not included. * 2 This feature is only available in conjunction with the GridVis installation on the desktop. Number of devices: Max. number of simultaneously loaded devices (e.g. in the Basic version: One project with 5 devices or 5 projects with one device). Update time frame: Time frame within which the new version can be installed free of charge. Automatic reading: Device reading according to freely configurable schedules. Inputting online: Measured data from devices without memory is determined in the GridVis software. Service: The GridVis software runs in the background and will be started automatically. Devices can be readout time-independent and automatically. For configuration and data processing the desktop installation is required. 404
405 Chapter 10 VBI Supported databases: The GridVis software supports the following databases: - Derby database included in the scope of supply - Janitza DB included in the scope of supply - MySQL (optional), from Version 5 - MS SQL (optional), from 2005 no Express versions Database information: - The database users require write and read rights. - The database structure is generated by GridVis when the project is created - Ownership rights are required to create a project - The "root" or "SA" root should not be used for GridVis projects - The database structure is open and documented Standard database: - The standard Derby database can only be used locally. Multiple access is not possible. - The standard database Janitza DB can only be used locally, multiple access is only possible locally (e.g. GridVis Service in the background and GridVis Professional on one computer)! Installation directories: The installation directory and the project directory can be freely selected. If several users require access, the installation and the project must be in one directory area where access rights are granted to all users. Port information: The following communication ports are required for the transfer of data between the measurement device and the software: - HTTP 80 - FTP command port 21, (data port 1024, 1025, 1026, 1027) - Modbus/TCP 502 (4 ports) - Modbus RTU via Ethernet 8000 (1 port) - Telnet NTP 123 The following communication ports can also be used: - SNMP BaCnet Automatic ring buffer reading: The GridVis software has an automatic read function which can be activated. The GridVis software must run continuously for this function. GridVis -Service can take over the automatic reading. This feature is available from the GridVis -Professional. 405
406 Chapter 10 VBI GridVis -Service information: - The Service edition includes at least one installation for the Desktop and one for the Service. - Automatic ring buffer reading and online reading can be taken over by GridVis -Service. - One Service instance supports the management of 300 measurement instruments. - The takeover of measurement devices must take place via the web server. GridVis -Service is accessible under localhost:8080 with a web browser. - The web server port can be changed during the installation. - Service is managed by Windows and does not need a user login. When a restart is carried out, the Service is restarted. Online reading: The GridVis software provides a possibility for recording and archiving measurement values online. This function can be used for measurement devices without ring buffer (memory), for example. The polling time is not adjustable and as fast as possible. Online reading is available from the GridVis -Service Edition. Server-Client principle: Multiple access to a database depends on the database type. The standard Derby database only supports local access. MySQL and MS SQL databases support multiple accesses. The read and write right must, however, be assigned a GridVis -Desktop instance or a GridVis -Service instance. NTP time synchronisation: Measuring devices of type UMG 604-PRO, UMG 605-PRO, UMG 508, UMG 511 or UMG 96RM-E are equipped with an NTP Client for time synchronisation. The following modes are supported by the devices: - Active (IP is addressed directly) - Listen (broadcast) Time synchronisation without an NTP server can take place from GridVis - Professional Edition using the computer time. Historical evaluation: Devices with ring buffer (memory) are required for a historical evaluation (period evaluation). An alternative is the GridVis - Service edition, online recording for archiving can be used here. Administrative rights are needed for the installation during commissioning. Internet access should be available for the GridVis activation. It is advisable to have a responsible person from the on-site IT department present during the commissioning to answer any questions directly. 406
407 Chapter 10 VBI Special instructions for the electrical installation of the Janitza measurement devices If commissioning includes the ProData (consumption pulse recording) or an Emax system (peak load management), the following points must be noted: ProData special instruction : The pulse values for the ProData (consumption data recording of water/heat amounts, etc.) must be known before commissioning and must also be sent in advance to the responsible technician per . Example: ProData Digital input 1 = auxiliary building water meter = 1 m³ per pulse Digital input 2 = main building heat meter = 1 kwh per pulse etc. Emax special instruction (peak load optimisation): The system is installed fully functional and completely wired. This includes: a) For direct measurement - Connection of the voltage measurement - Connection of the current measurement - Connection of the supply voltage - Connection of the digital outputs to the switchgear (e.g. protection) - Connection of the reset pulse of the supplier for synchronisation with the applicable measurement interval (in most cases, a 15-minute measurement interval) - Optional connection of the additional switching modules (FBM) for switching channels b) For indirect measurement of quantity signals - Power pulses of the supplier on a digital input - Connection of the digital outputs to the switchgear (e.g. protection) - Connection of the reset pulse of the supplier for synchronisation with the applicable measurement interval (in most cases, a 15-minute measurement interval) - Optional connection of the additional switching modules (FBM) for switching channels The following filled-out documents are required for commissioning: ttp://download.janitza.de/download_direkt/vbi-info/emax_604_605_de_v1.1.docx 407
408 Chapter 10 VBI Instruction After commissioning, the operating personnel should be given instruction on the GridVis evaluation and configuration software. The instruction should be given on the configured computer with access to all measurement points. The instruction includes the following topics: Software navigation Configuration of the measurement devices Evaluation of the historical data (graph, reports) Creation of the topology Administration of automatic reading / time setting Contents of the commissioning (specification sheet) The commissioning tasks are clearly defined. Tasks which are not part of the standard commissioning must also be recorded in the order. The number of measurement points to be integrated as well as the number of software instances to be installed must be defined before commissioning. Number of measurement points Number of GridVis -Desktop instances Number of GridVis -Service instances Tasks of standard commissioning: Installation: Installing the latest GridVis software (creating a project, importing a project) Configuration: - Integration of all Janitza measurement points in the GridVis software (connection configuration) - Configuring the device-specific application (pulse outputs, alarm outputs) - Configuring automatic reading / online reading - Software / Firmware update Instruction on the GridVis software: - Device management - Graph function - Topology generation 408
409 Chapter 10 VBI Additional commissioning performance: Configuration: - Implement all transformer settings - Assign device addresses and IP addresses Installation: - Emax (peak load optimisation) commissioning, configuration Configuration: - Create customer-specific topology - Integrate customer-specific Jasic program - Fault-finding, support - Creation of virtual measurement points It is advisable to have the responsible local electrician / installer present during commissioning, in order to answer any questions directly. It would also be desirable if the operator of the system were present to receive instruction. To ensure the smooth running of the commissioning, all points should be completed. 409
410 Chapter 10 3-in-1-Monitoring High availability through 3-in-1-Monitoring Highly automated production systems, computer centres and systems with constant processes (e.g. food sector, cable fabrication, paper production) require a reliable power supply - often even high availability, i.e. an availability of at least 99.9%. The numerous servers, monitors, storage media and network components rarely tolerate voltage dips or other deviations in power quality from the standard (e.g. EN 50160). However, electrical energy does not only need to be reliably available for information and communication technology; this is also the case with infrastructure tasks such as air-conditioning, fire prevention, EMC, safety engineering, lighting, lifts and drives. 3-in-1 monitoring for safety and efficiency It is no wonder, with all of these applications, that the demand for a safe power supply comes even before the ubiquitous energy efficiency. Constant monitoring with corresponding integrated measuring equipment for energy management, power quality and residual current monitoring fulfils this requirement; indeed it serves both purposes. At the same time, residual current monitoring also improves preventative fire protection. However, in practice it is highly complex to acquire, evaluate and document all of the measurement data. All of this must take place extremely quickly, e.g. if one wishes to detect an insulation fault that has just arisen before a system failure occurs. Janitza - the specialist when it comes to digital measuring technology and monitoring systems in energy supply - has specially developed its new UMG 512-PRO, UMG 96RM-E and UMG 20CM ranges here, for monitoring over 3 levels (see section Monitoring solutions in practice ). Together with the GridVis software and the integrated alarm management, solutions for three areas are united within a common system environment and just one measuring device per measurement point: 3-in-1 monitoring Energy management according to ISO (acquisition of V, A, Hz, kwh, kw, kvarh, kvar ) Power quality monitoring (harmonics, flicker, voltage dips, transients, etc.) Residual current monitoring (in short RCM) 410
411 Chapter 10 3-in-1-Monitoring This consolidation of the three different functions within a single measuring device brings with it the major advantage that both the assembly and installation, as well as the remaining infrastructure (current transformer, communication lines and equipment, database, software, analysis tools and reporting software, etc.) are only required once. Furthermore, all data is logged centrally in a database and can be conveniently processed with a single software. This not only saves direct costs during purchasing but also simplifies integration: No interfaces are required between the various systems because there is just one system. This also reduces the scope of training measures and induction required, which in turn increases the acceptance amongst the electrical engineers responsible. Fig. 1: Report prior to switching off - an aim of residual current monitoring (RCM) Signal before failure A significant advantage of this integrated data acquisition is its speed and the comprehensive overview of all data. This facilitates the detection of faults, which would only be partially perceived or even entirely missed by a single system. The user is therefore able to react before fuses or residual current devices (RCD) switch off affected systems or socket power circuits. This applies in particular to quietly rising residual currents (e.g. triggered by an insulation fault), overly high operating currents and any other overloading of system parts and loads (image 1). Other sources of faults are massive grid feedback effects or resonance effects due to a growing number of non-linear electrical loads. If one detects irregular grid parameters such as excessively high harmonics or residual currents in a timely manner, it is still possible to commission repair measures before a device fails and in doing so avoid downtimes, or at least plan for these and reduce them. Universal tool RCM: Increased safety, increased system availability, reduced risk of fire As previously mentioned, RCM is playing an increasingly important role with high availability power supplies, which are now found in almost all market segments. Constant processes and especially sensitive applications such as computer centres, hospitals and semiconductor factories are depending on RCM in particular. Furthermore, RCM measurement offers a good alternative in all areas in which it is not possible to utilise insulation resistance measurements and residual current devices due to local or operational circumstances. The foresighted monitoring described also helps to reduce alarms, as required for example with alarm management according to EEMUA 191 or NAMUR NA 102. However, RCM can do even more - namely reduce the risk of fire! Residual current, triggered by defective insulation, can be treacherous. The current level is determined by the power of the supply network, the insulation fault resistance and the resistance to ground. With a sufficiently high current flow (with a dead earth short or corresponding low-resistance short) the 411
, a risk of fire exists. Residual current monitoring therefore also serves as fire prevention.")

, meaning that the current induced in the secondary circuit is also zero or close to")
. Modern RCM devices accept different threshold value settings here (image 4).")


412 Chapter 10 3-in-1-Monitoring upstream protective device disconnects the electrical consumers from the mains. However, if the residual current is too low then the protective device will not trigger. If the recorded fault power exceeds a value of approx. 60 Watt (approx. 261 ma at 230 V), a risk of fire exists. Residual current monitoring therefore also serves as fire prevention. The next section explains how RCM works in detail. RCM the functionality The basic functionality of the residual current principle is shown in image 2. Here, the phase and neutral conductor of the protected output are fed through the summation current transformer, the ground wire is left out. The image provides a better overview due to the highly simplified wiring. In practical terms, all three phases and the neutral conductor run through the summation current transformer. If the system is in fault-free condition, the summation current is zero or close to zero (within a tolerable range), meaning that the current induced in the secondary circuit is also zero or close to zero. If, however, residual current flows away to ground due to a fault, the current differential in the secondary circuit will result in a current being logged and evaluated by the RCM measuring device (image 3). Modern RCM devices accept different threshold value settings here (image 4). A static threshold value has the disadvantage that it is either too high with a part load, or too low with a full load, i.e. either insufficient protection is provided or erroneous alarms are issued, which may have negative effects on the attentiveness of the monitoring personnel over time. For this reason it is advisable to use RCM measuring devices with dynamic threshold value formation. In this case the residual current threshold value is formed on the basis of the actual load conditions and is therefore optimally aligned with the respective applicable load (image 5). Through parameterisation (i.e. stipulation of the typical residual current in GOOD condition) of the system in new condition and constant monitoring, all changes to the system state after the point of start-up can be detected. This also enables detection of creeping residual currents Fig. 2: Principle of residual current monitoring Fig. 4: (Comprehensive configuration options for RCM threshold value formation (e.g. dynamic threshold value formation) in the software GridVis ) Fig. 5: Parameters of residual and operating current monitoring Fig. 3: Defective motor insulation leads to a short circuit to ground and residual current against the PE phase. 412


413 Chapter 10 3-in-1-Monitoring New technology, new fault sources Examples of modern fault sources include collapsing polypropylene PFC capa-citors. These serve to com-pensate for reactive currents, which can be generated for example with three-phase motors. Paradoxically, a fault therefore arises due to equipment that is actually intended to improve the energy supply. With these capacitors, an overload or excessively high tempera-ture frequently results in a melting of the PP winding. The melt in turn causes a high-resistance short circuit to ground. It is not possible to shut off such short circuits to ground with conventional protection measures (HRC fuse, circuit breaker). The constant residual current usually leads in the mid-term to a dead earth short circuit and may pose a considerable risk of fire or endanger safety under certain circumstances (image 6). The residual current measurement detects such faults and enables rapid countermeasures. In this way it is possible to avoid costly and dangerous system failures. Errors such as impermissible connections between the N and PE phase also frequently arise during installation. The two are sometimes simply interchanged. Image 7 shows a typical connection error, which can easily result in a residual current of 5000 ma. With RCM, such errors are detected immediately during the installation phase and are reported via the alarm management. A further and rather more recent fault source is a large number of singlephase loads, such as switched mode power supplies from servers in computer centres or PCs in office buildings. These generate a high proportion of 3rd harmonics. These harmonic portions bring with them the significant disadvantage that they superimpose themselves on the neutral conductor rather than being nullified via the transformer windings. This can result in overloads on the N phase. Integrated measuring devices, such as the UMG 96RM-E, enable comprehensive monitoring of all phases and are therefore able to report increased neutral conductor currents in a timely manner. In this context, reference is also made to the safety specifications of the VdS (association of insurers in Germany) for electrical systems up to 1000 Volt: Fig. 6: Destroyed PP reactive power compensation capacitor: A creeping high-resistance short circuit to ground has caused a complete melting of the capacitor and a local fire Fig. 7: The N and PE have been interchanged here VdS 2046 : (11) In order to increase the safety of electrical systems in which numerous non-linear loads (such as frequency converters, phase angle-controls e.g. in lighting systems) are operated, measurement of the current in the neutral conductor should take place regularly - e.g. once annually and additionally after any significant changes to the electrical system or the type and quantity of electrical loads. If the safety of the system is at risk due to excessively high harmonic currents, measures must be implemented in order to protect the harmonics according to the publication Low-fault electrical installations (VdS 2349). 413

414 Chapter 10 3-in-1-Monitoring Challenge of high availability IT technology itself places high demands on the supply. However, particularly critical are applications in which the loss of data simply cannot be allowed to occur. BITKOM therefore writes the following in its guidelines for Operationally reliable computer centres : In computer centres the maximum availability requirements apply. The energy supply must therefore be permanently guaranteed. Therefore comprehensible is the requirement that the power supply to the computer centre itself, and to all areas in the same building to which data cables run, must be designed as a TN-S system. Essential for assured operation is permanent self-monitoring of a clean TN-S system and the issuance of signals to a permanently manned desk, e.g. in the control centre. The electrical engineer will then detect any action requirements on the basis of signals received, and can avoid damages through targeted service measures. With the Janitza solution, the safety criteria RCM residual current monitoring can be realised through this type of EMC-optimised TN-S system (image 8). Fig. 8: Constant 3-in-1 monitoring (EnMs-RCM-PQ) of an EMC-optimised TN-S system Reduced testing costs with RCM Recurrent testing, as prescribed for example in BGV A3 Electrical systems and operating equipment, is time-intensive and therefore costly. RCM monitoring systems can reduce these test costs, whilst also ensuring increased safety. Fixed electrical systems and operating equipment are considered to be monitored constantly if they are permanently maintained by electrical engineers and tested by measuring equipment within the framework of operations (e.g. monitoring of the insulation resistance). Through permanent RCM measurement, monitoring systems are able to deliver the required degree of constant testing. Particularly noteworthy here is that RCM renders the cost-intensive measurement of insulation resistances at least partially superfluous, whilst constant testing of the insulation characteristics takes place. In order to carry out conventional insulation measurements, fixed systems or loads must be switched off and the neutral conductor disconnected. Furthermore, there is a risk that the high test voltage used for the insulation measurement may damage sensitive electronic components. The test accuracy and scope can be reduced by constant monitoring. However, this must be determined on an application-specific basis. Discussions with the operator and if necessary also with experts and / or the employers liability insurance association are essential here! It is also explicitly noted at this point that the following work must be carried out despite constant RCM measurement: Visual inspection for externally visible defects Protective measures and switch-off conditions Loop resistances and testing of the continuity of ground wires Functional testing 414
.")
 point where possible.")
415 Chapter 10 3-in-1-Monitoring The association of insurers (Germany) requires RCM The VdS has said the following on the subject of harmonics / the installation of power supply systems: In the case of power supply systems with PEN phase, operational currents which may cause damage flow through the entire ground and potential equalisation system (see section 3.3). With new electrical system installations it is therefore necessary to plan TN systems as TN-S systems. In the case of existing TN-C systems, modification to a TS-S system is advised. TN-S systems must be realised from the supply (handover) point where possible. In order to guarantee the functionality of a TN-S system on a permanent basis (no conductor short between the N and PE phase, interchanging of the N and PE phase) this must be monitored by a residual current measurement device (RCM). If the set trigger value is reached, a perceivable optical and acoustic error signal must be issued, in order that the defect can be eliminated immediately. In order that signal issuance is successful, this should be sent to a manned desk where applicable. If signalling is dispensed with then the forced shutdown of the faulty current circuit is required... Fig. 9: The 3-in-1 measuring device from Janitza: UMG 512-PRO Elsewhere, with respect to the safety regulations for electrical systems up to 1000 Volt, the VdS prescribes: VdS 2046 : (11) 3.2 Compliance with proper condition In order to guarantee safety in electrical systems on a permanent basis, if it is not possible to carry out insulation resistance measurements due to local or operational circumstances then it is necessary to implement substitute measures. Such measures are described in the publication Protection with insulation faults (VdS 2349). An adequate substitute measure here is permanent RCM monitoring! Energy measurement and electrical standard parameters RCM plays a dominant role in system monitoring by the Janitza system. Despite this, the following additional points should not go unmentioned: In addition to a safe energy supply, energy efficiency is playing an increasingly significant role. A milestone was set in place here with the implementation of the ISO standard. ISO is the standardised basis for the introduction of an energy management system - whereby the focus here lies on the term management system. This is a methodology, applied in conjunction with other management systems such as ISO 9001 or ISO 14001, through which to set objectives, implement these systematically and in doing so eliminate the chance factor insofar as possible. The term objective should essentially be understood here in the sense of the route is the objective. As an example, the following is a quote from the resolution of the IT representatives council from February 2013: (Page 2, Resolution No. 2013/2, Point 2) 415

. Monitoring the power quality RCM, as well as the requirements of Bitkom and the association of insurers, were dealt with in the first two parts.")
416 Chapter 10 3-in-1-Monitoring The IT council shall continue to strive towards a high proportion of constant measurements by the end of 2013 and asks the division to continue promoting the use of permanent measuring devices with consideration to the principle of cost efficiency. With all of its UMG measuring devices and electricity meters, Janitza offers the possibility of capturing and recording standard electrical parameters, as well as power and energy consumptions (image 9). Monitoring the power quality RCM, as well as the requirements of Bitkom and the association of insurers, were dealt with in the first two parts. The final point of 3-in-1 monitoring is the power quality. The reliable operation of modern plants and systems always demands a high degree of supply reliability and good power quality. However, in modern energy supply a wide range of single and three-phase, non-linear loads are used in industrial networks right through to office blocks. These include lighting equipment such as lighting controls for headlamps or low energy bulbs, numerous frequency converters for heating, air-conditioning and ventilation systems, frequency converters for automation technology or lifts, as well as the entire IT infrastructure with the typically used regulated switched mode power supplies. Today, one also commonly finds inverters for photovoltaic systems (PV) and uninterruptible power supplies (UPS). All of these non-linear electrical loads cause grid feedback effects to a greater or lesser extent with a distortion of the original clean sinusoidal form. This results in the current or voltage waveform being distorted in the same way (image 10 and image 11). The load on the network infrastructure through the described electrical and electronic loads with grid feedback effects has increased significantly in recent years. Depending on the type of generation system and the operating equipment (mains feed with converter, generator), mains rigidity at the connection point and the relative size of the non-linear loads, varying grid feedback effects and influences arise. For safeguarded power supplies in computer centres, the power quality must reflect EN (Class 1). Fig. 10: Grid feedback effects through frequency converters Fig. 11: Critical voltage dip with production standstill With its broad palette of UMG measuring devices, Janitza offers the option of capturing and analysing the various parameters of power quality. Standardised power quality reports in the GridVis software (e.g. for EN 50160, EN and ITIC: CBEMA Curve ) facilitate report generation for conventional standards at the touch of a button. 416
417 Chapter 10 3-in-1-Monitoring Monitoring solutions in practice The aim of 3-in-1 monitoring solutions the integrated measurement of energy, power quality and RCM requires the measurement of all phases (L1, L2, L3, N) + CEP (central earth point) + RCM with a single measuring device. A high performance measuring device with 6 measuring current inputs for the 3-in-1 measurement is the UMG 96RM-E for intermediate distributors, or the UMG 512-PRO for main nodes and CEP from Janitza. The IP-based measuring devices can be easily integrated into existing communication networks via Ethernet. Numerous IP protocols, on-board homepage and SNMP protocol simplify the work of administrators. The 20-channel UMG 20CM is ideal for complex electrical installations with a large number of monitoring points. The measuring devices are able to acquire (in arbitrary combinations), constantly log and analyse residual, earth leakage and operating currents via the associated measuring current transformers (e.g. CT-6-20). Special residual current transformers in practical special designs are also suitable for cost-efficient retrofitting to existing systems, without the need to switch off electrical consumers. Alarm in the right place Alarms must never sound unheard. An acoustic signal from the switch cabinet in the main distribution is of little use in the control room. Through the integration of the RCM measuring devices in the GridVis software, with its comprehensive alarm management signalling options, it is possible to ensure that the signal quickly reaches the right recipient. With arbitrary escalation levels and logbook function, the monitoring control room has access to all the tools required for efficient monitoring. In this way it is possible for the responsible electrical engineer to detect and evaluate any residual current increases, and if necessary initiate remedial measures as quickly as possible. 417
418 Chapter 10 3-in-1-Monitoring Stray currents impair EMC Connections between the N and PE phase result in stray operating currents being distributed across the PE system, via data lines and all metal building parts. Because these currents are not equalised, they generate electromagnetic fields. Diverse currents in the electrical systems, IT networks and pipe systems of building installations are the consequence. Image 12 shows how the operating current can distribute at the PEN bridge and flow back via multiple paths, whereby the sum of the supply and return conductor current is no longer 0. This can bring the following faults with it: Change in the operating behaviour of frequency-dependent parts (e.g. capacitors draw increased current) Data transfer disturbances due to magnetic and inductive influences Transfer of lightening influences to the electrical system Corrosion of metal lines Adverse effects on personnel The supply and return conductors, also in distribution systems, must be positioned close to each other in order to minimise magnetic fields. At every node point in a current circuit the sum of the currents must be equal to zero, in order to avoid residual currents. Additionally, the sub-distribution or current circuit should be monitored by an RCM. The UMG 96RM-E is very well suited for monitoring sub-distribution or larger loads. Individual current circuits, in which no residual current circuit breakers can be used for operational reasons, can be monitored with the UMG 20CM. A signalling RCM in combination with the specialist personnel on location provides for the maximum alternative safety. Neutral conductor and CEP (Central earthing point) The neutral conductor (operating current return conductor) has become the most important phase. It is to be treated as a phase conductor. In order that the earthing system remains clean, the current-loaded N phase must be positioned far from the PE phase. No galvanic operating currents may be permitted to flow via the earthing system because these would cause inductive couplings. These measures must be implemented right to the supply source. In the TN-S system, the N phase must only be connected at a suitable point with the earthing system once at the so-called CEP (central earth point from N to PE) and monitored. Undesirable insulation faults or galvanic connections between N and PE are detected immediately with monitoring of the CEP. Deviations are reported in a timely manner and analysed with temporal dependencies. 418


419 Chapter 10 3-in-1-Monitoring It is possible to check that the TN-S system is functioning fault-free, e.g. with the UMG 512-PRO. This allows a holistic appraisal of the power quality and EMC. It is even possible to record and analyse the trigger phase of an earth short fault. The phase current increases in parallel to the CEP current in this case. The current at the CEP must always be appraised depending on the overall power of the TN-S system. On the one hand this means that operationdependent leakage currents are tolerated, whilst abnormal deviations at the CEP are reported by the RCM. Summary and outlook Increasingly high demands will continue to be placed on future power supplies, because power failures result in high costs and huge disruption! Constant RCM monitoring for high availability power supplies with high EMC demands and also for preventative fire protection is becoming increasingly established. In order to account for this trend, Janitza brought the new 20-channel UMG 20CM range to the market in 2013, and will be presenting two further products in 2014 in the form of the UMG 509-PRO and UMG 512-PRO. The aim here is RCM monitoring of the power supply across all four levels (supply [PCC], main distribution [transformer outputs], subdistribution, individual loads [e.g. server cabinets]). Fig. 12: Operating currents on earthing systems 419
420 Chapter 11 Logistics 11 Logistics information and T&Cs Logistics information and T&Cs Logistics information Standard Terms and Conditions of Janitza electronics GmbH for the Sale of Standard Software Standard Terms and Conditions of Janitza electronics GmbH for the Provision of Software Free of Charge Green delivery conditions of the ZVEI: - General Conditions for the Supply of Products and Services of the Electrical and Electronics Industry - Supplementary Clause: Extended Retention of Title Page


421 Chapter 11 Logistics information LOGISTICS INFORMATION AND T&CS 421
 Device type Number of units in package Item number Unit carton 1 85 x 180 x 145 0.3 0.4 UMG 96L / 96 1 31.01.035 Unit carton 1 85 x 180 x 145 0.5 0.6 UMG 96RM / -M / -EL, ProData 1 31.01.035 Unit carton 1 85 x 180 x 145 0.2 0.")
422 Chapter 11 Logistics information Logistics information Unit carton Type Dimensions in mm (H x W x D) Net weight of unit in kg Gross weight in kg (mailable: incl. packing and operating manual etc.) Device type Number of units in package Item number Unit carton 1 85 x 180 x UMG 96L / Unit carton 1 85 x 180 x UMG 96RM / -M / -EL, ProData Unit carton 1 85 x 180 x UMG 103-CBM Unit carton x 180 x UMG 96RM-P / -PN /-CBM / -E UMG 96-PA Unit carton x 180 x UMG 104 / UMG 604-PRO / UMG 605-PRO Unit carton x 180 x Prophi / Prophi Unit carton 2* x 180 x UMG 508 / 509-PRO / 511 / 512-PRO * 1 This packaging is not suitable for individual despatch of UMG 508, UMG 509-PRO, UMG 511 and UMG 512-PRO; this is done with covering box 1. Cardboard packaging sizes Total weight in kg with the respective device type* 3 Total weight in kg with the respective device type* 3 Type Dimensions in mm (H x W x D) Packaging weight in kg Max number of unit carton 1 (see Tab. 1) 1 2 Master carton x 315 x Master carton x 400 x Master carton x 340 x Master carton x 400 x Master carton x 440 x Master carton x 700 x Master carton x 800 x Master carton 8 on throw-away pallet* x 800 x Master carton 9 on throw-away pallet* x 1180 x UMG 96 / UMG 96L UMG 96RM / -M / -EL, ProData UMG 103-CBM Max number of unit carton 2 (see Tab. 1) UMG 96RM-P / -PN / -CBM / -E, UMG 96-PA UMG 104 / UMG 604-PRO / UMG 605-PRO Prophi / Prophi UMG 508 / UMG 509-PRO / UMG 511 / UMG 512-PRO * 2 Pallets are IPPC certified. * 3 The details of the total weight of the respective unit type is based on a single variety only. Unit carton 1 and 2 is also used inside the master cartons. 422
Power quality Harmonics up to 40th harmonic Unbalance, rotary field indication Distortion factor THD-U / THD-I
 Harmonics Temperature input Measurement accuracy 0.5 Memory 4 MByte UMG 104 Energy measurement device for DIN rails Communication Profibus (DP / V0 optional) Modbus RTU Power quality Harmonics up to 40th
Dimension diagrams All dimensions in mm. Typical connection UMG 604-PRO. Power Analyser UMG 604-PRO. Front view. Side view. Versorgungsspannung
 Dimension diagrams All dimensions in mm 73 mm 10 mm 35 mm 44 mm 90 mm 90 mm 107,5 mm 50 mm 76 mm 82 mm Front view Side view Typical connection An. In R32 RS485 Dig. I/O Versorgungsspannung Auxiliary Supply
UMG 103-CBM. Universal measurement device for DIN rails
 Universal measurement device for DIN rails Harmonics GridVis Analysis software Modbus interface Measurement accuracy 0.5 Communication Protocols: Modbus RTU / Slave Interface RS485 Accuracy of measurement
UMG 103. UMG 103 Universal measurement device for DIN rails. GridVis Analysis software. Harmonics. Measurement accuracy 0.5.
 Harmonics GridVis Analysis software Modbus interface Measurement accuracy 0.5 Universal measurement device for DIN rails Communication Protocols: Modbus RTU / Slave Interface RS485 Power quality Harmonics
Power quality Harmonics up to 40th harmonic Rotary field components Distortion factor THD-U / THD-I
 Memory 256 MB Alarm management Residual current measurement Homepage Ethernet-Modbus gateway BACnet (optional) UMG 96 RM-E Power analyser with Ethernet and RCM Communication Modbus (RTU, TCP, Gateway)
UMG 509-PRO. Multifunction power analyser with RCM
 UMG 509-PRO Multifunction power analyser with RCM Power quality RCM Residual current monitoring Ethernet connection Ethernet-Modbus gateway Graphic programming Alarm management Communication Profibus (DP/V0)
Side view View from below Rear view
 Dimension diagrams All dimensions in mm Side view View from below Rear view Cut out: 138 +0,8 x 138 +0,8 mm Typical connection SPS SPS 11 12 13 14 15 16 1 2 3 4 5 6 7 8 9 10 DSUB-9 5 4 3 2 1 8 7 6 5 4
Networks IT, TN, TT networks 3 and 4-phase networks Up to 4 single-phase networks. Measured data memory 256 MByte Flash 32 MB SDRAM
 Power quality Colour graphical display Ethernet connection Ethernet-Modbus gateway Graphic programming Alarm management UMG 508 Multifunction power analyser Communication Profibus (DP/V0) Modbus (RTU,
Catalogue 2016: Issue July. The 3-in-1 of energy measuring technology: Energy management, power quality, residual current monitoring
 Smart Energy & Power Quality Solutions Catalogue 2016: Issue July The 3-in-1 of energy measuring technology: Energy management, power quality, residual current monitoring Catalogue 2016 01 02 03 04 05
Transienten. Datenspeicher
 25. 40. 63. Grenzwertüberwachung Oberschwingungen Power quality RCM Residual current monitoring Transienten Ethernet connection Ethernet-Modbus gateway Graphic programming Alarm management 32 MB 128 MB
Smart Energy & Power Quality Solutions. Portable energy measurement devices COMPACT FLEXIBLE PRECISE
 Portable energy measurement devices COMPACT FLEXIBLE PRECISE Portable energy measurement devices COMPACT FLEXIBLE PRECISE The portable energy measurement devices from Janitza Stay flexible with the portable
UMG 96L / UMG 96. UMG 96L / UMG 96 Universal measurement device. Threshold value monitoring. Pulse outputs. Networks TN-, TT-Networks
 Threshold value monitoring Pulse outputs UMG 96L / UMG 96 Universal measurement device Measuring accuracy Energy: Class 2 Current.../1 A,.../5 A Voltage L - N: ± 1 % Networks TN-, TT-Networks 2 digital
Smart Energy & Power Quality Solutions. UMG 96RM Universal measurement instrument (EN 50160, IEEE 519, ITIC)
") Smart Energy & Power Quality Solutions UMG 96RM Universal measurement instrument (EN 50160, IEEE 519, ITIC) UMG 96RM UMG 96RM Universal measurement instrument Unrivalled in its class The UMG 96RM is a
Smart Energy & Power Quality Solutions UMG 96RM Universal measurement instrument (EN 50160, IEEE 519, ITIC) UMG 96RM UMG 96RM Universal measurement instrument Unrivalled in its class The UMG 96RM is a
Smart Energy & Power Quality Solutions. Residual current monitoring (RCM) and energy data acquisition in a single device
 and energy data acquisition in a single device") Smart Energy & Power Quality Solutions Residual current monitoring (RCM) and energy data acquisition in a single device The RCM system solution RCM Modbus GridVis Analysis software Harmonics Alarm management
Smart Energy & Power Quality Solutions Residual current monitoring (RCM) and energy data acquisition in a single device The RCM system solution RCM Modbus GridVis Analysis software Harmonics Alarm management
1 2 3 GridVis Pulse output 2 tariffs Modbus MID M-Bus
 speicher MID energy meter ECSEM series Emax 2 Tariffs GridVis 7 Tariffs 8 Tariffs 14 Tariffs 0,2 kwh Class 0,5 kwh Class 1,0 kwh Class Pulse output Tarife 2 tariffs Messgenauigkeit Modbus MID M-Bus eratureingang
Smart Energy & Power Quality Solutions. Power Quality Analyser UMG 512-PRO. Data sheet
 Smart Energy & Power Quality Solutions Power Quality Analyser Data sheet Dok.-Nr. 2.054.030.0 02/2019 DEVICE VIEWS Front view Rear view Side view Bottom view Cut-out size: 92 +0,8 mm x 92 +0,8 mm. All
Power Meter Series PM3200 Functions and characteristics
 Functions and characteristics PB108433 This PowerLogic Power meter offers basic to advanced measurement capabilities. With compact size and DIN rail mounting, the PM3200 allows mains and feeders monitoring
Fluke 1740 Series. Three-Phase Power Quality Loggers Memobox. Assess power quality and conduct long-term studies with ease
 Fluke 1740 Series Three-Phase Power Quality Loggers Memobox Technical Data Assess power quality and conduct long-term studies with ease Compact and rugged, the Fluke 1740 Series three-phase power quality
Universal tool for residual current monitoring. Smart Energy & Power Quality Solutions
 Smart Energy & Power Quality Solutions Universal tool for residual current monitoring Janitza electronics Ethernet level (TCP/IP) Server SQL database Client 1 to... Mobile Web server Grid visualisation
PEM353. Universal measuring device
 353 Universal measuring device 353_D00335_00_D_XXEN/06.2018 353 Universal measuring device Product description The digital universal measuring device 353 is used to record and display measured quantities
UMG 96RM Basic Device
 Smart Energy & Power Quality Solutions Power Analyser Basic Device Data sheet Dok.-Nr. 2.040.172.0 02/2019 DEVICE VIEWS Front view Rear view Side view Bottom view max. 6 96 91,5 104 91,5 97 42 Cut-out
METRAClip87 and 88 Clamp Multimeters
 3-349-795-03 1/7.14 Current and frequency measurement via clamp meter: METRAClip87: 1500 A AC TRMS and 1500 A DC METRAClip88: 2000 A AC TRMS and 3000 A DC Multimeter functions via connector sockets: V
RISH PQM. Power Quality Monitor. Preliminary Datasheet subject to change without notice. Individual Harmonics measurement upto 56th Harmonics
 Power Quality Monitor Individual Harmonics measurement upto 56th Harmonics True representation of Voltage & Current waveforms. Phasor Representation of All 3 phases for system analysis Real Time Clock
Fluke 1740 Series. Three-Phase Power Quality Loggers Memobox. Assess power quality and conduct long-term studies with ease
 Fluke 1740 Series Three-Phase Power Quality Loggers Memobox Technical Data Assess power quality and conduct long-term studies with ease Compact and rugged, the Fluke 1740 Series three-phase power quality
Current / residual current and voltage transformers. Current / residual current and voltage transformers
 Current / residual current and voltage transformers Current / residual current and voltage transformers 1 Overview Current transformer overview DIN rail current transformer with fuse Current transformer...
MT 560/UMT TRANSDUCER & ANALYZER
 MT 560/UMT 560 - TRANSDUCER & ANALYZER USE The MT 560/UMT 560 multi transducer and analyzer is used for a permanent analysis of electricity supply quality in compliance with the SIST EN 50160 standard.
Electrical network management. Schneider Electric. PM3200 Technical Datasheet
 Electrical network management Schneider Electric PM3200 Technical Datasheet Functions and characteristics PB108433 This PowerLogic Power meter offers basic to advanced measurement capabilities. With compact
HV / MV / LV electrical network quality analyzers Class A. Communication port: local, modem, integrated Ethernet, multi-point
 2010 MAP Range HV / MV / LV electrical network quality analyzers Class A > Network quality Analyzers PRODUCT ADVANTAGES COMPLIANT with the EN 61000-4-30 standard, Class A DETECTION of the fault LOCATION
MICROPROCESSOR-BASED METERING EQUIPMENT SECTION 16901C PART 2
 PART 1 PART 2 PRODUCTS 2.01 MANUFACTURERS A. Eaton products B.. C.. The listing of specific manufacturers above does not imply acceptance of their products that do not meet the specified ratings, features
ULTRA RAPID POWER QUALITY ANALYZER
 ULTRA RAPID POWER QUALITY ANALYZER Ultra rapid (cycle by cycle) advanced electrical network analysis Complete network harmonics analysis, up to 63 rd harmonic High visibility, 5 graphic LCD screen with
PM5000 Series. PowerLogic PM5100, PM5300 and PM5500 series
 Functions and characteristics PowerLogic PM5100, PM5300 and PM5500 series PB111776 The PowerLogic applications. It provides the measurement capailities needed to allocate energy usage, perform tenant metering
Power Quality and Energy Measurement PEM575
 Power Quality and Energy Measurement _D00016_03_D_XXEN/12.2015 Power Quality and Energy Measurement Product description The digital universal measuring device is suited for measuring and displaying electrical
METRAClip85 and 86 Clamp Multimeters
 3-349-794-03 1/8.14 Current and frequency measurement via clamp meter: 600 A AC TRMS and 900 A DC (automatic or manual switching) Multimeter functions via connector sockets: V (AC TRMS and DC) up to 1000
PQ-Box 100 Network Analyzer for Low-, Medium- and High-Voltage Networks
 GB Technical data Issue 06/2009 PQ-Box 100 Network Analyzer for Low-, Medium- and High-Voltage Networks Fault detection Evaluation of voltage quality according to EN50160 and IEC61000-2-2 Fault recorder
02/11/2015
 Modem communication plug and play solutions GSM Part number 88970119 For remote control of your application Automatic notification of alarms via SMS (GSM Modem) / email or on a PC with M3 ALARM software.
12/2 Product overview. 12/3 7KT1 14, 7KT1 53 E-counters. 12/9 7KT1 11, 7KT1 12 digital measuring devices. 12/11 7KT1 0 analog measuring devices
 BETA Measuring /2 Product overview /3 7KT1 14, 7KT1 53 E-counters /9 7KT1 11, 7KT1 digital measuring devices /11 7KT1 0 analog measuring devices / 7KT5 8 time and pulse counters /14 7KT5 5, 7KT5 6 time
Acti 9 Energy Meters. iem3000 Series. Technical data sheet
 Acti 9 Energy Meters iem3000 Series Technical data sheet 1 PB108410 b The Acti 9 iem3000 Energy Meter Series offers a cost-attractive, competitive range of DIN rail-mounted energy meters ideal for sub-billing
Digital Fault Recorder Deployment at HVDC Converter Stations
 Digital Fault Recorder Deployment at HVDC Converter Stations On line continuous monitoring at HVDC Converter Stations is an important asset in determining overall system performance and an essential diagnostic
PLA 33. Power line analyzer. User and service manual. version 2.4
 PLA 33 Power line analyzer User and service manual version 2.4 Content. Front control panel and terminal plate...3 7.2.2. System frequency setting...0 2. Device description...4 7.2.3. Password protection...0
ALPHA 50 MULTIFUNCTION METER (ALPHA SERIES)
") Alpha Series www.sifamtinsley.co.uk Multifunction Meters Transducers & Isolators Temperature Controllers Converters & Recorders Digital Panel Meters Current Transformers Analogue Panel Meters Shunts ALPHA
Alpha Series www.sifamtinsley.co.uk Multifunction Meters Transducers & Isolators Temperature Controllers Converters & Recorders Digital Panel Meters Current Transformers Analogue Panel Meters Shunts ALPHA
Power Quality and Energy Measurement PEM533
 Power Quality and Energy Measurement _D00013_02_D_XXEN/11.2014 Power Quality and Energy Measurement 0.5 S Product description The digital universal measuring device is suited for measuring and displaying
Data Sheet. RISH Master Record %THD
 Data Sheet %THD Application : measures important electrical parameters & replaces the multiple analog panel meters. It measures electrical parameters like AC current, Voltage, frequency, active energy
PowerLogic power-monitoring units. PM700 series power meter. Technical data sheet
 PowerLogic power-monitoring units PM700 series power meter Technical data sheet 2009 Functions and characteristics The PowerLogic PM700 series power meter offers all the measurement capabilities required
Introduction DIN rail mounted electricity meters
 Introduction DIN rail mounted electricity meters Modular DIN Rail Products offer a wide range of functions to be integrated in electrical installations with significant benefits for the user. DIN rail
Energy Management Energy Analyzer Type EM210 MID
 Energy Management Energy Analyzer Type Multi-use housing: for both DIN-rail and panel mounting applications MID annex MI-003 (Measuring Instruments Directive) compliant Class B (kwh) according to EN50470-3
MINI-PS AC/24DC/1.3
 Power supply unit INTERFACE Data sheet 102894_en_03 1 Description PHOENIX CONTACT 2015-11-17 Features MINI POWER power supplies for MCR technology In measurement and control technology (MCR), modular electronics
CM-MPS.11, CM-MPS-21, CM-MPS.31 and CM-MPS.41 Data sheet. UL 508, CAN/CSA C22.2 No.14 GL GOST CB scheme CCC
 2CDC 251 048 F0t08 CM-MPS.11 2CDC 251 049 F0t08 CM-MPS.21 Features Monitoring of three-phase mains for phase sequence (can be switched off), phase failure, over- and undervoltage as well as phase unbalance
MID. Energy Management Energy Meter Type EM23 DIN. Product Description. Type Selection. How to order EM23 DIN AV9 3 X O1 PF A EM23 DIN
 Energy Management Energy Meter Type EM23 DIN Certified according to MID Directive (option PF only): see how to order below Other version available (not certified, option X): see how to order on the next
RI-F200 Series. Single and Three Phase Multifunction Energy Meter. Telephone : +44 (0) Displayed Parameters
 Displayed Parameters") RI-F200 Series Single and Three Phase Multifunction Energy Meter DIN 96 panel mounted -/1A or -/5A current transformer input Single phase or three phase network compatible Programmable voltage and current
RI-F200 Series Single and Three Phase Multifunction Energy Meter DIN 96 panel mounted -/1A or -/5A current transformer input Single phase or three phase network compatible Programmable voltage and current
Acti 9 Energy Meters. iem3000 Series. Technical data sheet
 Acti 9 Energy Meters iem3000 Series Technical data sheet PB108410 b The Acti 9 iem3000 Energy Meter Series offers a cost-attractive, competitive range of DIN rail-mounted energy meters ideal for sub-billing
02/11/2015
 Modem communication plug and play solutions GSM Part number 88970119 For remote control of your application Automatic notification of alarms via SMS (GSM Modem) / email or on a PC with M3 ALARM software.
Network Analyzer for Low-, Medium- and High-Voltage Networks
 Technical data Network nalyzer for Low-, Medium- and High-Voltage Networks Model PQ-Box 150 1 Fault detection 1 Evaluation of voltage quality according to EN50160 and IEC61000-2-2 (2-4) 1 FFT nalysis up
Power Quality Monitoring:
 Power Quality Monitoring: Analyse and Improve your Energy Performance Presented by: David Bradley B.Eng (Hons), MBA, C.Eng, MIET Energy Management & Power Quality Key Drivers PART L The energy efficiency
Power Quality and Energy Measurement PEM575
 Power Quality and Energy Measurement _D00016_00_D_XXEN/06.2013 Power Quality and Energy Measurement Product description The digital universal measuring device is suited for measuring and displaying electrical
Electronic AC Load ZSAC Series. 400 W up to 21,000 W 260 V up to 440 V 3 A up to 100 A. Rev. 3.03
 Electronic AC Load Series 400 W up to 21,000 W 260 V up to 440 V 3 A up to 100 A Rev. 3.03 Electronic AC Loads, Series Interface overview RS-232 USB GPIB LAN System bus Analog / Analog isolated X X Standard
Acti 9 Energy Meters. iem3000 Series. Technical data sheet
 Acti 9 Energy Meters iem3000 Series Technical data sheet 1 PB108410 b The Acti 9 iem3000 Energy Meter Series offers a cost-attractive, competitive range of DIN rail-mounted energy meters ideal for sub-billing
INSTALLATION MANUAL. Model: Smart Analyzer Manufacturer: Smart Impulse. Power meter with consumption breakdown by use 03/12/13
 INSTALLATION MANUAL Model: Smart Analyzer Manufacturer: Smart Impulse Power meter with consumption breakdown by use 03/12/13 Table of contents Table of contents... 2 1. Introduction... 3 2. Installation
Technical Data Sheet AMIK 300 / 301
 USA SINCE 1936 RELIABILITY BEYOND MEASURE Technical Data Sheet AMIK 300 / 301 LISTED File No. E471457 AMIK AMIK 300 is a compact multifunction instrument with touch screen LCD utility which measures important
N. TEST TEST DESCRIPTION
 Multi function system for testing substation equipment such as: current, voltage and power transformers, all type of protection relays, energy meters and transducers Primary injection testing capabilities
Power Quality Solutions PQSine P-Series of Active Harmonic Filters and Power Optimizers
 EPCOS Product Brief 2017 Power Quality Solutions of Active Harmonic Filters and Power Optimizers EPCOS has been offering a comprehensive range of key components for power factor correction (PFC) and power
8V General information. 2 Order data 8V
 8V05.00-8V05.00- General information Modular mechanical design using plug-in modules Integrated line filter Integrated braking resistor All connections are made using plug-in connectors Integrated electronic
HAWK5000 Operators Manual
 HAWK5000 Operators Manual Keison Products P.O. Box 2124, Chelmsford CM1 3UP, England Tel: +44 (0) 1245 600560 Fax: +44 (0) 1245 600030 Email: sales@keison.co.uk www.keison.co.uk KANE INTERNATIONAL LIMITED
RI-D440. Three Phase easywire Multifunction DIN Rail Energy Meter. Telephone : +44 (0) Displayed Parameters
 Displayed Parameters") RI-D440 Three Phase easywire Multifunction DIN Rail Energy Meter Four module DIN rail mounted Energy pulse LED 330mV Input from easywire CTs (or -/1A and -/5A current transformer input with TAS-SCTEWA
RI-D440 Three Phase easywire Multifunction DIN Rail Energy Meter Four module DIN rail mounted Energy pulse LED 330mV Input from easywire CTs (or -/1A and -/5A current transformer input with TAS-SCTEWA
Measuring centers MC7x0 series Multifunction Meter MC740
 Measuring centers MC7x0 series Multifunction Meter MC740 o Measurements of instantaneous values of more than 130 quantities (U, I, P, Q, S, PF, PA, f, φ, THD, MD, energy, energy cost by tariffs, etc.)
PQube 3 Specifications
 PQube 3 Specifications Reference conditions for factory tests: 19~25 C, 10%~70% RH MAINS VOLTAGE MEASURING CHANNELS Measurement Channels Power Configuration/ Range of Nominal Input Voltage 3 Line to Neutral,
T/3000 T/3000. Substation Maintenance and Commissioning Test Equipment
 T/3000 Substation Maintenance and Commissioning Test Equipment MULTI FUNCTION SYSTEM FOR TESTING SUBSTATION EQUIPMENT SUCH AS: CURRENT, VOLTAGE AND POWER TRANSFORMERS, ALL TYPE OF PROTECTION RELAYS, ENERGY
ALP-UDR Universal Detection Relay user-defined protection, automation, and monitoring
 ALP-UDR Universal Detection Relay user-defined protection, automation, and monitoring The first Real-Time Protection and Automation platform that can be adapted to a wide variety of applications. While
Advantages There are many diverse advantages of a portable analyzer for the user. The most important is information.
 Portable s CIRCUTOR offers a wide range of portable analyzers designed to measure, display and/or record the most important parameters of an electrical network. With the analysis of the electrical parameters,
ALPHA 20 MULTIFUNCTION METER (ALPHA SERIES)
") Alpha Series www.sifamtinsley.co.uk Multifunction Meters Transducers & Isolators Temperature Controllers Converters & Recorders Digital Panel Meters Current Transformers Analogue Panel Meters Shunts ALPHA
Alpha Series www.sifamtinsley.co.uk Multifunction Meters Transducers & Isolators Temperature Controllers Converters & Recorders Digital Panel Meters Current Transformers Analogue Panel Meters Shunts ALPHA
D SERIES LM16. COMPACT DRIVE V/f and SLV CONTROL. LM16 COMPACT DRIVE V/f and SLV CONTROL
 D SERIES LM16 COMPACT DRIVE V/f and SLV CONTROL LM16 COMPACT DRIVE V/f and SLV CONTROL 1 2 SERIES 1 2 page 4 page 6 Introduction Fields of application 3 page 7 4 page 8 Designation Product offer 5 6 page
PQM4000RGW Class A DIN 192x144 power quality analyzer with Rogowski coils
 Class A DIN 192x144 power quality analyzer with Rogowski coils Current inputs for direct connection of Rogowski coils Harmonics and interharmonics measurement Data recording for further EN 50160 analysis
Energy Management Energy Meter Type EM340
 Energy Management Energy Meter Type EM340 Digital input (for tariff management Easy connection or wrong current direction detection Certified according to MID Directive (option PF only: see how to order
Power Meter PQM (EnerSure Enkapsis) Guide Form Specification PART 1: GENERAL
 Guide Form Specification PART 1: GENERAL") Power Meter PQM (EnerSure Enkapsis) Guide Form Specification PART 1: GENERAL 1.01 SUMMARY: The following technical specification describes the requirements of the high accuracy standalone 3 phase Power
Power Meter PQM (EnerSure Enkapsis) Guide Form Specification PART 1: GENERAL 1.01 SUMMARY: The following technical specification describes the requirements of the high accuracy standalone 3 phase Power
AMIK 200 / 201 Technical Data Sheet
 AMIK 200 / 201 Technical Data Sheet AMIK Special Features MODBUS (RS-485) Communication available only on Amik 201 On site Programmable CT/PT Ratios User selectable CT Secondary 1A/5A User selectable PT
ABB 1. Multifunctional three-phase monitoring relays. CM-MPS.11, CM-MPS-21, CM-MPS.31 and CM-MPS.41 Data sheet. Features. Approvals. Marks.
 2CDC 251 048 F0t08 CM-MPS.11 2CDC 251 049 F0t08 CM-MPS.21 2CDC 251 050 F0t08 CM-MPS.31 2CDC 251 051 F0t08 CM-MPS.41 R/T: yellow LED - relay status, timing F1: red LED - fault message F2: red LED - fault
Energy Measurement & Management
 Energy Measurement & Management Countis kwh Meters Diris Multifunction Meters Software Installation Solutions IPD Industrial Products is an Australian owned leading distributor of a wide variety of low
ABB NEW. Multifunctional three-phase monitoring relays. CM-MPS.23 and CM-MPS.43 Data sheet. Features J. Approvals. Marks.
 2CDC 251 052 F0t08 CM-MPS.23 2CDC 251 053 F0t08 CM-MPS.43 - relay status, timing - fault message - fault message Adjustment of the tripping delay t V Adjustment of the threshold value for overvoltage 6
Energy Management Energy Analyzer Type EM111
 Energy Management Energy Analyzer Type EM111 Single phase energy analyzer Class 1 (kwh according to EN62053-21 Class B (kwh according to EN50470-3 Accuracy ±0.5% RDG (current/voltage Direct current measurement
Voltage monitoring relays CM-ESS.1 for single-phase AC/DC voltages
 Data sheet Voltage monitoring relays CM-ESS.1 for single-phase AC/DC voltages For the monitoring of voltages in single-phase AC/DC systems, ABB s CM range comprises a wide selection of powerful and compact
N. TEST TEST DESCRIPTION
 Multi function system for testing substation equipment such as: current, voltage and power transformers, over-current protection relays, energy meters and transducers Primary injection testing capabilities
ABB NEW. Three-phase monitoring relays. CM-PVS.31 and CM-PVS.41 Data sheet. Features J. Approvals. Marks. Order data. Order data - Accessories
 2CDC 251 042 F0t08 CM-PVS.31 Features Monitoring of three-phase mains for phase sequence (can be switched off), phase failure, over- and undervoltage Threshold values for over- and undervoltage are adjustable
MEASURING INSTRUMENTS AND TESTERS
 MEASURING INSTRUMENTS AND TESTERS Electrical Installation Safety High Voltage Insulation / Continuity / Earth Appliance / Machine / Switchboard Safety Power Quality Analysis LAN Cabling Certification Indoor
6ES7214-1AG31-0XB0. General information Engineering with. Supply voltage 24 V DC Yes permissible range, upper limit (DC)
") 6ES7214-1AG31-0XB0 Page 1 Product data sheet 6ES7214-1AG31-0XB0 SIMATIC S7-1200, CPU 1214C, COMPACT CPU, DC/DC/DC, ONBOARD I/O: 14 DI 24V DC; 10 DO 24 V DC; 2 AI 0-10V DC, POWER SUPPLY: DC 20.4-28.8 V
6ES7214-1AG31-0XB0 Page 1 Product data sheet 6ES7214-1AG31-0XB0 SIMATIC S7-1200, CPU 1214C, COMPACT CPU, DC/DC/DC, ONBOARD I/O: 14 DI 24V DC; 10 DO 24 V DC; 2 AI 0-10V DC, POWER SUPPLY: DC 20.4-28.8 V
Energy Meters for DIN Rail Mounting Electric energy meter WS0101, WS0102,WS1102 WS0301, WS0302,WS1302
 Energy Meters for DIN Rail Mounting Electric energy meter WS0101, WS0102,WS1102 WS0301, WS0302,WS1302 Direct connection up to 65 A (WSx10x) Connection with current transformer (WSx30x) Industrial or meters
Multimeter 500CVD21 RTU500 series
 Remote Terminal Units - Data sheet Multimeter 500CVD21 RTU500 series CT/VT interface with 4 voltage and 24 current inputs for direct monitoring of 3/4 wire 0 300 V AC (line to earth), 0...500 V AC (phase
ENA33LCD. Power line analyzer. User and service manual. Obrezija 5 SI-1411 Izlake
 ENA33LCD Power line analyzer User and service manual version 2.9 (FW version 6.8 and newer) ETI, d.o.o. Obrezija 5 SI-1411 Izlake www.etigroup.eu/products-services 1. Front control panel and terminal plate
Electronic timer CT-TGD.12 Pulse generator with 1 c/o (SPDT) contact
 contact") Data sheet Electronic timer CT-TGD.12 Pulse generator with 1 c/o (SPDT) contact The CT-TGD.12 is an electronic time relay with the function pulse generator. It is from the CT-D range. With their MDRC profile
Data sheet Electronic timer CT-TGD.12 Pulse generator with 1 c/o (SPDT) contact The CT-TGD.12 is an electronic time relay with the function pulse generator. It is from the CT-D range. With their MDRC profile
Three-phase monitoring relays
 2CDC 251 046 F0t08 Features Monitoring of three-phase mains for phase sequence, phase failure, phase unbalance Threshold value for phase unbalance adjustable as absolute value Tripping delay can be adjusted
MID. Energy Management Energy Meter Type EM33 DIN. Product Description. How to order EM33 DIN AV3 3 X XS PF. Type Selection EM33 DIN
 Energy Management Energy Meter Type EM33 DIN Easy connections management Certified according to MID Directive (option PF only): see how to order below Other version available (not certified, option X):
PHOENIX CONTACT - 06/2008. Features. DANGER OF EXPLOSION! Only remove equipment when it is disconnected and not in the potentially explosive area.
 Primary-switched power supply with SFB technology, 1 AC, output current 20 A INTERFACE Data Sheet 103383_en_00 1 Description PHOENIX CONTACT - 06/2008 Features QUINT POWER power supply units highest system
Measuring and monitoring relays CM-SRS.1 Current monitoring relays, single-phase AC/DC
 2CDC 251 244 F0t05 Characteristics Monitoring of DC and AC currents: RMS measuring principle One device includes 3 measuring ranges Over- or undercurrent monitoring configurable Hysteresis adjustable from
Electronic timer CT-TGD.22
 2CDC 251 097 F0t06 a Rotary switch for the preselection of the time range of the ON time b Potentiometer with direct reading scale for the fine adjustment of the ON time c Rotary switch for the preselection
Integra 1560 and 1580 Digital Transducer Systems
 Integra 1560 and 1580 multi function transducers provide high accuracy
QUINT-PS AC/24DC/40
 Power supply unit INTERFACE Data sheet 102315_en_02 1 Description PHOENIX CONTACT 2010-04-23 Features QUINT POWER power supply units for plant and special engineering reliably start heavy loads with high
DIFFERENTIAL CURRENT GENERATOR «POCDIF» (AC/DC - 32A - 50V - 12 ranges)
") PERFORMANCES 12 ranges of AC current from 16 ma to 128 A peak AC permanent current up to 26 ARMS Nine ranges of DC permanent current from 16 ma to 12 A DC current ± 6mA or ± 10 ma stackable to AC current
PERFORMANCES 12 ranges of AC current from 16 ma to 128 A peak AC permanent current up to 26 ARMS Nine ranges of DC permanent current from 16 ma to 12 A DC current ± 6mA or ± 10 ma stackable to AC current
Installation / Monitoring Technique
 Installation / Monitoring Technique VARIMETER RCM Residual Current Monitor, Type B for AC and DC Systems IP 5883 0249633 IP 5883 ND 5018/035 ND 5018/030 According to IEC/EN 62 020, VDE 0663 For AC and
Fluke Fluke-Direct.ca. Three-Phase Power Logger. Technical Data
 Fluke 1735 Three-Phase Power Logger Technical Data Electrical load studies, energy consumption testing, and general power quality logging The Fluke 1735 Three-Phase Power Logger is the ideal electrician
Est Static Frequency Converter. SFX 10kVA - 10MVA
 Est.1968 Static Frequency Converter SFX 10kVA - 10MVA Static Frequency Converter SFX 10kVA - 10MVA A Concept Thycon Static Frequency Converters (SFX) convert supply frequency to load requirement frequency.
PRELIMINARY DATA SHEET RI-D140. Three Phase Multifunction DIN Rail Energy Meter (MID Certified) MID
 MID") RI-D140 Three Phase Multifunction DIN Rail Energy Meter (MID Certified) Four module DIN rail mounted Energy pulse LED True RMS measurement Cost effective and accurate Modbus communication -/1A or -/5A
RI-D140 Three Phase Multifunction DIN Rail Energy Meter (MID Certified) Four module DIN rail mounted Energy pulse LED True RMS measurement Cost effective and accurate Modbus communication -/1A or -/5A
Power supply CP-E 24/2.5
 2CDC 271 015 F0t06 a OUTPUT L+, L : terminals output b DC OK: terminal signalling output c INPUT L, N, PE: terminals input d OUTPUT OK: green LED output voltage OK e OUTPUT Adjust: potentiometer adjustment