Table of Contents. Chapter 3. The 843-R Power Meter Unit.. 17
|
|
|
- Doris Carroll
- 5 years ago
- Views:
Transcription

1
2 Table of Contents Chapter 1. Introduction: How to Use This Manual... 3 Chapter 2. Quick Reference Getting Started Functions with No Sensor Connected Thermal Sensors Photodiode Sensors Pyroelectric and Photodiode Energy Sensors R-USB Chapter 3. The 843-R Power Meter Unit General Description Smart Connectors Soft Keys Power Up and Shut Down R Functions that are Independent of Sensor Type R Measurement Screens Hardware Functions Chapter 4. Operation with Thermopile Absorber Sensors Thermopile Absorber Sensors Startup Configuration Power Measurement Energy Measurement Chapter 5. Operation with Photodiode Sensors
3 5.1 Photodiode Sensors Startup Configuration Power Measurement Special Cases of Power Measurement Chapter 6. Operation with Pyroelectric Sensors Pyroelectric & Photodiode Energy Sensors Startup Configuration Measuring Energy with Pyroelectric Sensors Measuring Average Power and High Energies Chapter 7. Circuit Description Analog Module Processor Board: Chapter R Power Meter Specifications System/Meter Specifications Sensor Specifications Warranty Limitation of Warranty Technical Support Contacts
4 Chapter 1. Introduction: How to Use This Manual Newport s 843-R Power Meter is a simple to use microprocessor-based Laser Power/Energy meter that operates with thermopile, pyroelectric and photodiode sensors. Based on smart connector technology, just connecting the sensor configures and calibrates the instrument. This manual tells you what you need to know to make full use of the 843-R for all your laser measurement needs. It includes a "Quick Reference", (Chapter 2) to allow you to perform basic measurements immediately, without reading the whole manual. The main measurement sections, Chapters 4, 5 and 6 include a general description and a section detailing operating options. Model 843-R-USB is functionally equivalent to the 843-R with the addition of USB communication with the PC. Unless otherwise noted, any mention of the 843-R refers to the 843-R-USB as well. 3
5 2.1 Getting Started Chapter 2. Quick Reference To connect a sensor to the 843-R Power Meter, simply insert the 15 pin D type connector of the measuring sensor cable into the socket marked "Sensor Input" on the rear panel of the 843-R Power Meter (see Figure 2.1). 12VDC AN OUT SENSOR INPUT USB OTG Figure R Rear Panel The 843-R Power Meter is equipped with "soft keys." That is, the functions of the keys change as indicated by the legend above each key (see Figure 2.2). 4
6 Figure R Front View 2.2 Functions with No Sensor Connected Turning On and Off. To switch the 843-R Power Meter on: Briefly press the on/off switch (Figure 2.2). The unit will switch on, and the display will appear. 5
7 Note: With the 843-R Power Meter, sensors are hot swappable. Even after the meter is switched on, you can remove one sensor and insert a different one. The 843-R will recognize the switch and reconfigure itself according to the settings of the new sensor. To toggle the state of the LCD backlight: The backlight for the 843-R s LCD can be toggled between 3 different levels of illumination. This toggling will be performed by briefly pressing the on/off switch after the 843-R has been switched on. To switch the 843-R off: Press the on/off switch and hold it for about 2 seconds until the display blanks Configuring the instrument. To zero instrument: 1. Make sure that the instrument is not in an electrically noisy environment and is undisturbed. 2. Verify that no sensor is connected. If one is connected, then detach before continuing. 3. Press the Zero key. This will bring you to the Zeroing screen 4. Press the Start key. When zeroing finishes press the Save key. To show or hide settings 1. Press the Down arrow until Show Settings is highlighted and press the Enter arrow. 2. Set to Yes to display sensor settings in the measurement screens. Set to No to hide the sensor settings and show a larger graph. 6
8 To set Line Frequency 1. Setting Line Frequency correctly removes electrical noise that may be introduced to the measurements. 2. Press the Down arrow until Line Frequency is highlighted and press the Enter arrow. 3. Set to 50Hz or 60Hz, depending on the electrical power grid of the area that you are in. To select Language The 843-R can be configured to one of several languages. In order to select the display language: 1. Press the Down arrow until Language is highlighted and press the Enter arrow. 2. Set to English, Japanese, Russian, or Chinese. To set Date and Time 1. Press the Down arrow until the Date and Time are highlighted and press the Enter arrow. 2. Scroll through and select Month, Day, Year, Hour, and Minutes with the Right arrow. Change the selected item with the Down arrow. Note: The present settings are automatically saved for the next time the 843-R is turned on Updating the 843-R Firmware. 1. Download the latest 843-R firmware upgrade package from the Newport website: and copy to your target directory. 2. Run the upgrade executable and follow the on screen instructions 7
9 2.3 Thermal Sensors Use of the 843-R with thermal type sensors. Most Thermopile sensors have somewhat different absorption at different wavelengths. In order to compensate for this, each sensor has been calibrated by laser at several wavelengths. When you choose the correct laser wavelength, the correction factor for that wavelength is automatically introduced. Note that the laser wavelength correction in use is displayed in the upper left corner of the display. To set type of laser being used: 1. From the measurement screen, press the Setup key. 2. Press the Down arrow until Laser is highlighted and press the Enter arrow. 3. Select the appropriate laser wavelength and press the OK key. To select a range for power measurement: 1. From the measurement screen, press the Setup key. 8
10 2. Press the Down arrow until Range is highlighted and press the Enter arrow. 3. Select the appropriate manual range or AUTO to select autoranging and press the OK key. To choose power or energy measurement: 1. In the main measurement screen, press the Mode key. 2. Select Power or Energy. 3. Press the OK key to return to the measurement screen Other Settings and Saving the Startup Configuration 1. When measuring power, you can set the period over which to Average the measurements 2. When measuring energy you can set the threshold level in order to screen out false triggers. 3. The present settings are automatically saved for the next time the 843-R is turned on Power or Single Shot Energy Measurement Warning: Do not exceed maximum sensor limits for power, energy, power density and energy density as listed in Table 5 and Error! Reference source not found. in Error! Reference source not found. Otherwise, there is a risk of damaging the absorber. To simulate an analog needle display on the 843-R: 1. Press the Display key and select Needle. 2. Press OK to continue with measurements. 9
11 To expand the graph (Bargraph or Needle) scale ±5x about the present reading: 1. Press the Zoom key. 2. Press the Zoom key again to return to the full scale graph. See Section for full details. To subtract background and set current reading to zero: 1. Press the Offset key. 2. Press the Offset key again to cancel. See Section for full details. To use the 843-R to measure laser power: 1. Press the Mode key and select Power 2. Select AUTO for autoranging or the lowest manual range whose maximum is greater than the expected power readings. 3. Power is measured 15 times per second. To use the 843-R to measure laser energy: 1. Press the Mode key and select Energy 2. Energy measurement is performed in manual ranges only. The correct range to select is the lowest one that is larger than the expected pulse energy to be measured. 3. Thermal sensors measure energy in single shot mode. When the 843-R flashes "READY," on and off, fire the laser. 2.4 Photodiode Sensors Selecting Wavelengths 1. From the measurement screen, press the Setup key. 10
12 2. Press the Down arrow until Laser is highlighted and press the Enter arrow. 3. Select the appropriate laser wavelength and press the OK key. 4. If the wavelength you want is not among the wavelengths in the six wavelengths listed press the Modify key. 5. Use the Right and Down arrows to adjust the wavelength as desired. Then press the OK key To select a range for power measurement: 1. From the measurement screen, press the Setup key. 2. Press the Down arrow until Range is highlighted and press the Enter arrow. 3. Select the appropriate manual range, AUTO to select autoranging, or dbm to display power in a logarithmic scale. Press the OK key Other Settings and Saving the Startup Configuration 1. Select Average in order to set the period over which to average the measurements 2. Select Filter to IN or OUT according to if the Filter is in place or not. 3. The present settings are automatically saved for the next time the 843-R is turned on Power Measurement Warning: Do not exceed maximum sensor limits for power, energy, power density and energy density as listed in Error! Reference source not found. in Error! Reference source not found. Sensor Specifications. Otherwise, there is a risk of damaging the sensor. 11
13 To simulate an analog needle display on the 843-R: 1. Press the Display key and select Needle. 2. Press OK to continue with measurements. To expand the graph (Bargraph or Needle) scale ±5x about the present reading: 1. Press the Zoom key. 2. Press the Zoom key again to return to the full scale graph. See Section for full details. To subtract background and set current reading to zero: 1. Press the Offset key. 2. Press the Offset key again to cancel. See Section for full details Pyroelectric and Photodiode Energy Sensors Zeroing Instrument against Sensor For the most accurate calibration, you must zero the pyroelectric sensor against the 843-R it is being used with. Proceed as follows: Make sure the sensor is in a quiet environment and not subject to pulsed radiation. Plug sensor into 843-R and turn on. Press the Setup key to enter the Setup screen. Press the Zero key to enter the Zero screen. Press the Start key. When Zeroing completed successfully appears, press the Save key and then press the Exit key. After you have done zeroing, you do not have to do it again when used with the same type of meter. If you have zeroed it against a different of meter, then a different value has been saved and when used with this 843-R again you should zero it again. 12
14 To set type of laser being used: For metallic types only: 1. From the measurement screen, press the Setup key. 2. Press the Down arrow until Laser is highlighted and press the Enter arrow. 3. Select the appropriate laser wavelength and press the OK key. 4. If the wavelength you want is not among the wavelengths in the six wavelengths listed press the Modify key. 5. Use the Right and Down arrows to adjust the wavelength as desired. Then press the OK key. For all other types 1. From the measurement screen, press the Setup key. 2. Press the Down arrow until Laser is highlighted and press the Enter arrow. 3. Select the appropriate laser wavelength and press the OK key To select a range for energy measurement: 1. From the measurement screen, press the Setup key. 2. Press the Down arrow until Range is highlighted and press the Enter arrow. 3. The correct range to select is the lowest one that is larger than the expected pulse energy to be measured. Press the OK key Other Settings and Saving the Startup Configuration 1. Select Pulse Length and choose the shortest pulse length setting longer than your laser s pulse length. Warning: Incorrect readings will result if pulse length is not set up correctly. For sensors with only one Pulse Length, N/A will be displayed. 2. For sensors with an optional diffuser, Select Diffuser and set to IN or OUT according to if the Diffuser is in place or not. For sensors without an optional diffuser, N/A will be displayed. 13
15 3. Select Threshold and set to level that will screen out erroneous readings due to false triggers. 4. Select Average in order to set the period over which to average the measurements, or set to NONE. 5. The present settings are automatically saved for the next time 843-R is turned on Energy or Average Power Measurement Warning: Do not exceed maximum sensor limits for power, energy, power density and energy density as listed in Table 5 and Table 6 in Sensor Specifications. Otherwise, there is a risk of damaging the absorber. With the pyroelectric sensor, you have been supplied a test slide with the same coating as on your pyroelectric detector. You can also obtain this slide from your dealer. You should use this slide to test the damage threshold with your laser pulses. If the slide shows damage, then either enlarge your beam or lower the laser energy until damage is no longer seen. Note: High sensitivity pyroelectric sensors (919E-200U-8-25K, 919E K) are very sensitive to vibration, and therefore might read a false trigger when operating in an acoustically non-stable environment. Set the threshold to a high enough value that false triggering does not occur. To choose Energy or Average Power Measurement 1. To measure average power, press the Mode key and select Power. 2. To measure energy pulses, press the Mode key and select Energy. 3. If the laser is pulsing at greater than 1Hz, the frequency will be shown on the screen as well. 14
16 Warning: While measuring pulsing lasers, erroneous energy reading will result if energy range, pulse length, or threshold levels are not set up correctly. See Section 6.3 for details. To simulate an analog needle display on 843-R: 1. Press the Display key and select Needle. 2. Press OK to continue with measurements. To expand the graph (Bargraph or Needle) scale ±5x about the present reading: 1. Press the Zoom key. 2. Press the Zoom key again to return to the full scale graph. See Section for full details. To subtract background and set current reading to zero: 1. Press the Offset key. 2. Press the Offset key again to cancel. See Section for full details R-USB For those customers that want to interface their power meter with the PC, we offer the 843-R-USB meter. This has all the features of the 843-R and in addition is capable of USB communication with the PC. We also supply a full range of PC software to work with the 843-R- USB including: PMManager. A fully functional software application that turns your PC into a laser power/energy meter 15
17 COM object for system integrators to integrate power measurment into their applications LabVIEW drivers. 16
18 Chapter 3. The 843-R Power Meter Unit 3.1 General Description The model 843-R laser power/energy meter represents a new level of sophistication, sensitivity, compactness and accuracy, coupled with ease of operation. It can operate with thermal and photodiode sensors. It has smart connector technology. Simply plugging in the sensor configures and calibrates the 843-R to operate with that sensor. The 843-R s large size TFT 320x240 screen enhances measurement readouts in ways that smaller displays cannot. The 843-R displays power measurements in both digital and analog form at the same time and also has a needle type display. It can be set to autorange, so you do not have to set scales; or to a manual range if you wish. It will remember what mode you were using before you turned it off and will return to that mode when turned on. You can zoom in on the present reading, or subtract background. The 843-R reads the calibration information that is stored in the sensor s smart connector and is ready to measure from the moment it s powered up. You can also zero the 843-R at the touch of a button. The 843-R s user interface is self-explanatory; you should not have to refer to this manual very often. Above all, the 843-R has advanced circuitry and digital signal processing for excellent sensitivity, signal to noise ratio, accuracy, and response time. It also has special circuitry to reject electromagnetic interference. The 843-R has all the infrastructure for field upgrading of the embedded software, should the need arise. 17

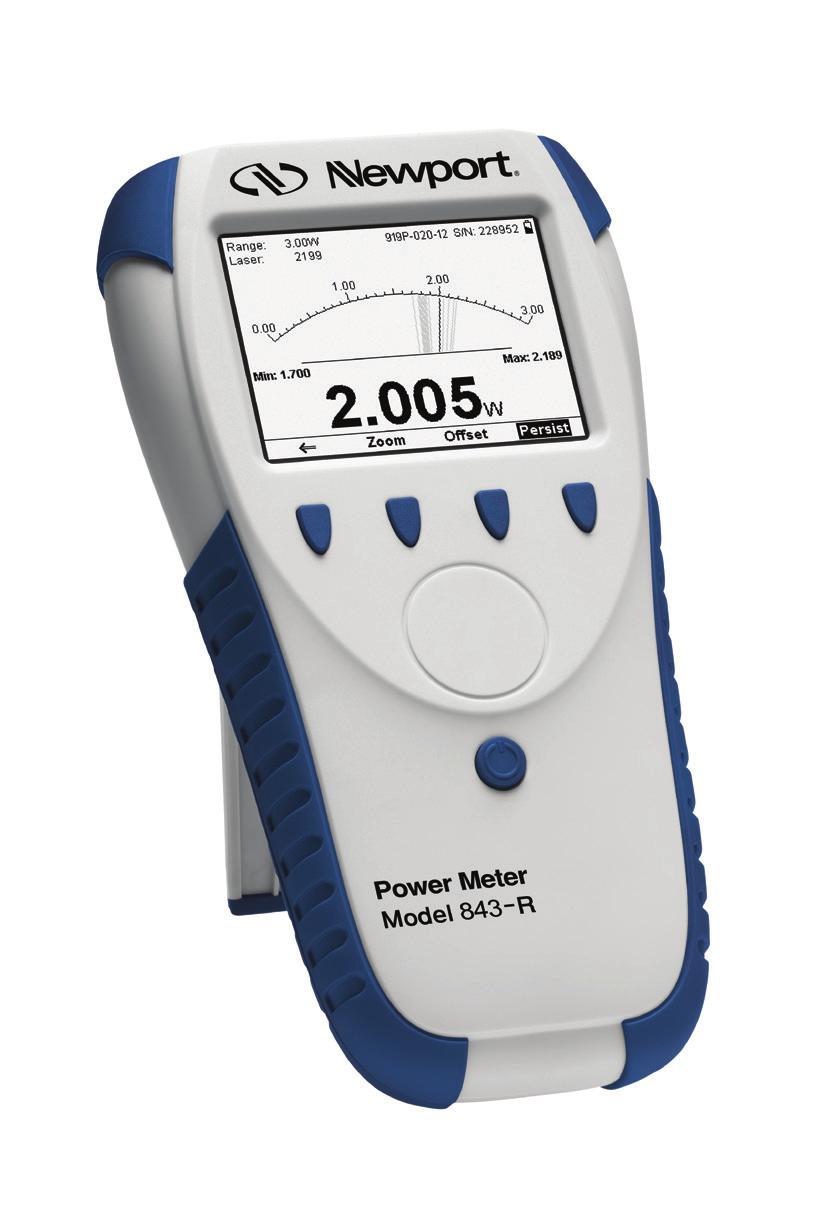
19 Figure R displaying power measured with a Thermopile sensor. Displayed in analog needle mode with persistence on. 3.2 Smart Connectors The 843-R meter is versatile and can operate with either thermal, pyroelectric or photodiode type laser measuring sensors. The sensor configuration and calibration information is stored in an EEROM in the sensor connector plug. This means that when the sensor is plugged in, the 843-R automatically identifies the sensor type, calibration and configuration. The user does not have to adjust anything. 18
20 Note: With the 843-R, sensors are hot swappable. Even after the meter is switched on, you can remove one sensor and insert a different one. The 843-R will recognize the switch and reconfigure itself according to the settings of the new sensor. When no sensor is plugged in, the 843-R meter gives the user the opportunity to hide or show settings, change the line frequency setting, and set the real time clock. It also shows the serial number of the instrument, last calibration date and firmware version. The user can also re-zero the instrument. See section Soft Keys The soft keys have functions defined by the legend above the key. The legend usually indicates what will happen when pressing the key. For example, if "Mode" appears above a key, pressing that key will open a menu to allow user to select between Power and Energy measurement modes. Some functions operate when the key is pressed and are canceled when the key is pressed again. Those keys show reverse highlighting when operational. Pressing the same key again cancels the operation and the highlighting. Key Functions The 843-R has certain conventions as to the meaning of standard key strokes and these are as follows: Highlighted item: The highlighted item is the item that is presently active. OK: Returns to the previous screen with the selected setting for immediate use and saved for next startup. 19
21 Cancel: Cancels the selection and returns to the previous screen, leaving the settings unchanged. 3.4 Power Up and Shut Down To turn the 843-R on: Briefly press the On/Off Switch. The unit will switch on, and the display will appear. If no sensor is connected, the Setup screen will appear. If a sensor is connected, the appropriate default measurement screen will appear. To toggle the state of the backlight on and off: The backlight for the 843-R s LCD can be configured to toggle between low, half, and full intensity (see Section for full details). This toggling will be performed by briefly pressing the On/Off switch after the 843-R has been switched on. To switch the 843-R off: Press the On/Off switch and hold it for about 2 seconds until the display blanks. The current measurement settings will be saved automatically for the next time the 843-R is powered up. 20
22 R Functions that are Independent of Sensor Type Figure 3.2: 843-R Setup Screen with no sensor connected. When no sensor is connected, the 843-R setup screen will be displayed. This gives the user the opportunity to hide or show settings, change the line frequency setting, and set the real time clock. It also shows the firmware version, serial number of the instrument, and last calibration date. The user can also re-zero the instrument Show or Hide Settings 1. Press the Down arrow ( ) until Show Settings is highlighted and press the Enter arrow ( ). 2. Set to Yes to display sensor settings in the measurement screens. Set to No to hide the sensor settings and show a larger graph. 3. Press the OK key to keep the new setting. 21
23 Line Frequency 1. Setting Line Frequency correctly removes electrical noise that may be introduced to the measurements 2. Press the Down arrow ( ) until Line Frequency is highlighted and press the Enter arrow ( ). 3. Set to 50Hz or 60Hz, depending on the electrical power grid of the area that you are in. 4. Press the OK key to keep the new setting Language 1. The 843-R can be configured to one of several languages. 2. Press the Down arrow ( ) until Language is highlighted and press the Enter arrow ( ). 3. Set to English, Japanese, Russian, or Chinese. 4. Press the OK key to keep the new setting. Warning: In the event that you mistakenly selected a non- English language as the 843-R startup language, the way to switch back to English is as follows: a. Disconnect the sensor from the 843-R. b. The 843-R will automatically switch to the Setup screen. c. Press the Down arrow ( ) once. d. press the Enter arrow ( ). This will open a window to select the instrument language. e. Press the Down arrow to select "English". f. Press the OK soft key. The 843-R is now configured for English. Note: The present settings are automatically saved for the next time the 843-R Power Meter is turned on. 22
24 Analog Output The 843-R Power Meter has an analog output with a fullscale output of 1 Volt. For thermal and photodiode sensors in power mode, the analog output is continually updated 15 times per second with the latest power measurement. For thermal sensors in single shot energy mode, the analog output is held fixed until the next pulse triggers Clock Settings The 843-R Power Meter is equipped with a real time clock which will show the date and time. This clock will also allow the 843-R Power Meter to query the sensor attached and notify you if the sensor is due for calibration. To set Date and Time 1. Press the Down arrow ( ) until the Date and Time are highlighted and press the Enter arrow ( ). 2. Scroll through and select Month, Day, Year, Hour, and Minutes with the Right arrow ( ). Change the selected item with the Down arrow ( ). 3. When finished, press the OK key to keep the new setting Zero Adjustments In 843-R Power Meter, all adjustments, including zeroing internal circuits, are done from the software. This ensures simple and accurate realignment. It is recommended to re-zero the 843-R Power Meter every 2 months for best performance. The simple zeroing procedure follows. To zero instrument: 1. If a sensor is connected, disconnect it. 2. Press the Zero key to enter the Zeroing screen 23
25 3. Make sure that the instrument is not in an electrically noisy environment and is undisturbed 4. Press the Start key and wait for message, "Zeroing completed successfully". 5. Press the Save key to save the new zero settings. 6. Press the Exit key to return to the Setup screen. Note (for Thermal Sensors only) For best results with thermal sensors, it may be necessary to do the procedure once with the sensor disconnected and a second time with it reconnected. After completing steps 1-6 above, Connect the sensor and make sure it is at room temperature and well shielded from any stray thermal power. It may be best advised to lay the sensor with the absorber face down on the table. 7. Connect the thermopile sensor. Ensure that is at room temperature and well shielded from any stray thermal power. It may be best advised to lay the sensor with the absorber face down on the table. Press the Zero key to enter the Zeroing screen 8. Press the Start key and wait for message, "Zeroing completed successfully". 9. Press the Save key to save the new zero settings. 10. Press the Exit key to return to the Setup screen. Note: For Pyroelectric Sensors In addition to zeroing the meter as described above, it is important to zero the meter against the sensor you are using the first time. Please see section on how to do this R Measurement Screens Bargraph The Bargraph is a ruler-like display in which the graph is filled proportionally to the reading s being a percentage 24
26 of full scale. The Bargraph display is available when measuring power or energy. Press the Zoom key to zoom in on a smaller section of the range when readings are fluctuating slightly. If you notice that noise has gotten into the measurement, you can press the Offset key to remove it from the measurement. Figure 3.3 Bargraph with Thermopile Sensor Needle A Needle graph simulates an analog display, similar to the style of an analog voltmeter or a car s speedometer. The Needle display is available when measuring power or energy. Press the Zoom key to zoom in on a smaller section of the range when readings are fluctuating slightly. If you notice that noise has gotten into the measurement, you can press the Offset key to remove it from the measurement. Press the Persist key to continue to display previous readings as well as to show the minimum and maximum measurements. 25
27 Figure 3.4 Analog Needle with Photodiode Sensor with Persistence Enabled 3.7 Hardware Functions LCD Backlight The LCD backlight is actually a set of LED s that illuminate the display from behind. Because the 843-R uses a TFT display, the backlight must be constantly on. It can be operated at full intensity for full illumination; or at low or half level to conserve power consumption. The backlight level is toggled by a short press on the On/Off switch. The 843-R backlight consumes considerably less power than competing instruments and therefore it can operate from the battery even when the charger is not plugged in. Nevertheless, since it does shorten the time between charges, it is recommended to set the backlight to less than full intensity when the instrument is operated without the charger Charging The 843-R can be operated either by the internal battery or from an AC source with the charger plugged in all the time. Plug the charger into the jack labeled "12VDC" on the back panel (see Figure 3.3). The battery will be 26
28 charged at the same rate whether the 843-R is switched on or off, and whatever the backlight level. The battery will fully recharge in around 4-5 hours. Note: The charger circuit of the 843-R is designed to allow the charger to be plugged in for an extended period without causing damage to the battery. The approximate time between charges is given in the following table for various configurations: Sensor Type Backlight Level Time Between Charges Thermopile and Low 19 hours Photodiode Thermopile and Half 17 hours Photodiode Thermopile and Full 15 hours Photodiode Pyroelectric Low 16 hours Pyroelectric Half 15 hours Pyroelectric Full 13 hours The battery charge is indicated by the icon. The battery charge is shown approximately by each segment of the icon, e.g. if 2 segments are shown the battery is ½ full. When the battery is charging, the segments turn on in sequence. When the battery is low, the charger should be plugged in Analog Output The instrument provides an analog voltage output via the 2.5mm mono jack socket on the rear panel marked AN OUT (see Figure 3.3). The 843-R is supplied with the mating adapter plug that connects to this socket. The analog output is useful for driving chart recorders and other analog devices. The voltage is proportional to the 27
29 reading on the display and scaled such that full scale equals 1.00V. The analog output is driven through an impedance of 100 ohm. For best accuracy, is recommended to limit the external load to 100K (or larger). A smaller load (down to 1K) is possible, but may result in loss of accuracy. 12VDC AN OUT SENSOR INPUT USB OTG Figure 3.5: 843-R Rear Panel View In power mode, the analog output is continually updated 15 times per second with the latest power measurement. For thermal sensors in single shot energy mode, the analog output is held fixed until the next pulse triggers Field Upgrade The 843-R has all of the necessary infrastructure for field upgrading of the embedded software, should the need arise. This is done through the USB OTG port that is found on the rear panel of the instrument. To Update the 843-R Firmware: 1. Download the latest 843-R firmware upgrade package from the Newport website: and copy to your target directory. 2. Run the upgrade executable and follow the on screen instructions 28
30 Sensor Disconnect / Connect Recognition With the 843-R, sensors are hot swappable. Even after the meter is switched on, you can remove one sensor and insert a different one. The 843-R will recognize the switch and reconfigure itself according to the settings of the new sensor USB Communication The 843-R-USB is capable of USB communication with the PC. Figure 3.6: 843-R-USB Setup Screen with no sensor connected. Notice that USB is enabled and that the USB icon is in the upper right of the screen. 29
31 Chapter 4. Operation with Thermopile Absorber Sensors Warning: Before using the sensor for power or energy measurement, check that your laser power, energy and energy density do not exceed the sensor ratings. See Tables 5 and 6 in Chapter 8. If the sensor is a water-cooled type, ensure that the cooling water is flowing at an adequate rate; see table below. Also, note that the reflectance from the absorber could be as much as 10% and with CO2 lasers, the reflected beam can be quite specular, so it is advisable to provide a beam stop for the reflected beam with the highest power lasers. Sensor Type 919P- 5KW-50 Liters per Minute At Full Power Min Pressure Bar US Gallons per Minute Table 1 Minimum Flow Rates for Water-Cooled Sensors 4.1 Thermopile Absorber Sensors When a radiant heat source, such as a laser, is directed at the absorber sensor aperture, a temperature gradient is created across the thermopile of the enclosed detector disc. This generates a voltage proportional to the incident power. 30
32 The meter s electronics amplifies this signal and indicates the power level received by the sensor. At the same time, signal processing software causes the meter to respond faster than the actual thermal rise time of the detector disc, thereby reducing the response time of the 843-R. Energy of a single pulse is measured on the 843-R by digitally integrating the pulse power over time Supported Models The 843-R Power Meter is compatible with our new line of 919P Thermal Sensors. Older models of thermal sensors are not compatible. 4.2 Startup Configuration On power up, the 843-R meter checks its own memory as well as the sensor s to decide on the measurement configuration. For example, if in the last session, the sensor was used to measure power in the Bargraph screen in autoranging with a YAG laser and averaging for 10 seconds, this will be the setup used the next time the system is powered up. These settings can all be easily changed, as will be described fully in the following sections. 4.3 Power Measurement Thermopile sensors measure power continuously at an update rate of 15 times per second. To best ensure measurement accuracy, center the laser beam carefully on the absorber surface. Power measurements can be displayed in Bargraph or Needle graphical formats. Updating measurement parameters is performed in the easy-to-reach Setup screen. 31

33 Bargraph Display Screen Layout The Bargraph is a ruler-like display in which the graph is filled proportionally to the reading s being a percentage of full scale. The Bargraph display is composed of the following components: Parameter settings, the sensor s name and serial number, and battery status indicator at the top of the screen. Large numeric display shown prominently in the middle of the screen. Bargraph displayed close to the bottom. Softkey legends at the bottom of the screen Softkey Functionality Figure 4.1 Bargraph display with first set of Softkeys Mode: Press this key to change the selected measurement mode. o Press the Up/Down arrow ( ) to set the measurement mode to Power or Energy. 32
34 o o Press OK to return to the measurement screen with the new selection. Press Cancel to ignore any changes and continue in Power measurement mode. Display: Press this key to change the graphical display. o Press the Up/Down arrow ( ) to set the display mode to Bargraph or Needle. o Press OK to return to the measurement screen with the new selection. o Press Cancel to ignore any changes and continue with the Bargraph display. Setup: Press this key to change the Power measurement parameters. This will be described in Section Power Setup Screen. Right Arrow ( ): Press this for additional Bargraph screen functions. Figure 4.2 Bargraph display with second set of Softkeys Left Arrow ( ): Press this for previous set of Bargraph functions. 33
35 Zoom: Press this key to focus the Bargraph on the present reading. The Bargraph will show 20% of the full scale centered on the present reading. Thus, if the full scale of the Bargraph is 20 watts, and your reading is 15 watts, pressing Zoom will make the Bargraph scale range between approximately 13 and 17 watts. Small fluctuations in power are more easily seen in this mode. Zoom will be reverse highlighted to show that it is active. Press the Zoom key again to return to the unexpanded Bargraph display. Offset: If the ambient environment has a thermal background, so that the 843-R shows a nonzero power reading even when there is no laser, you can subtract the background using the Offset function. For example, the 843-R display reads 0.1 Watts when the laser is blocked, and 20.5 Watts with laser power applied. In this case, the true power is = 20.4 Watts. To subtract the background, press the Offset key while the laser is blocked. The 843-R will now read zero, and the 0.1 Watt background will be subtracted from all subsequent readings. The laser power reading displayed will thus be 20.4 Watts. When active, the Offset key is reverse highlighted and the offset that is being subtracted is shown in the upper right part of the screen. To deactivate, press Offset again. If you suspect that the 843-R has a permanent zero offset, the instrument s internal zero should be reset. See Section Needle Display Screen Layout A Needle graph simulates an analog display, similar to the style of an analog voltmeter or a car s speedometer. By making use of the persistence feature, you can know what the full range of measurements actually is, including the maximum and minimum readings of the present set of measurements. 34
36 The Needle display is composed of the following components: Parameter settings, the sensor s name and serial number, and battery status indicator at the top of the screen. Needle displayed prominently in the middle of the screen. Large numeric display. Softkey legends at the bottom of the screen Softkey Functionality Figure 4.3 Needle display with first set of Softkeys Mode: Press this key to change the selected measurement mode. o Press the Up/Down arrow ( ) to set the measurement mode to Power or Energy. o Press OK to return to the measurement screen with the new selection. o Press Cancel to ignore any changes and continue in Power measurement mode. Display: Press this key to change the graphical display. o Press the Up/Down arrow ( ) to set the display mode to Bargraph or Needle. o Press OK to return to the measurement screen with the new selection. 35
37 o Press Cancel to ignore any changes and continue with the Bargraph display. Setup: Press this key to change the Power measurement parameters. This will be described in Section Power Setup Screen. Right Arrow ( ): Press this for additional Needle screen functions. Figure 4.4 Needle display with second set of Softkeys and Persistence active Left Arrow ( ): Press this for previous set of Needle functions. Zoom: Press this key to focus the Needle on the present reading. The Needle arc will show 20% of the full scale centered on the present reading. Thus, if the full scale of the Needle is 20 watts, and your reading is 15 watts, pressing Zoom will make the Needle scale range between approximately 13 and 17 watts. Small fluctuations in power are more easily seen in this mode. Zoom will be reverse highlighted to show that it is active. Press the Zoom key again to return to the unexpanded Needle display. 36
38 Offset: If the ambient environment has a thermal background, so that the 843-R shows a nonzero power reading even when there is no laser, you can subtract the background using the Offset function. For example, the 843-R display reads 0.1 Watts when the laser is blocked, and 20.5 Watts with laser power applied. In this case, the true power is = 20.4 Watts. To subtract the background, press the Offset key while the laser is blocked. The 843-R will now read zero, and the 0.1 Watt background will be subtracted from all subsequent readings. The laser power reading displayed will thus be 20.4 Watts. When active, the Offset key is reverse highlighted and the offset that is being subtracted is shown in the upper right part of the screen. To deactivate, press Offset again. If you suspect that the 843-R has a permanent zero offset, the instrument s internal zero should be reset. See Section Power Setup Screen The 843-R Power Meter can be set to various chosen settings while operating. These configuration settings are automatically saved for the next time the meter is turned on with this sensor. Figure 4.5 Setup Screen 37
39 Power Range Autorange In autorange mode, you do not have to change scales. When the reading of the meter is more than 100% of full scale of the present range, the 843-R will reconfigure itself to the next higher range. The ranges are arranged in factors of 1, 10, 100, etc. When the reading falls below 7% of full scale of the present range, the 843-R will reconfigure itself one range down. This change only occurs after a few seconds delay, thereby providing overlap (hysteresis) that limits the 843-R from flipping back and forth when reading close to the end of the scale. Manual Range There are certain disadvantages to autorange since it changes scale even if you don't want it to do so. If you want to measure in the same range all the time, it is better to use manual range. The correct range to select is the lowest one that is larger than the largest expected measurement. To Set the Power Range 1. Press the Down arrow ( ) until Range is highlighted and press the Enter arrow ( ). 2. Using the Down arrow ( ), scroll through the available ranges until you reach the one that is correct for your measurement needs. 3. Press the OK key to keep the new setting. 38
40 Laser Most Thermopile sensors have somewhat different absorption at different wavelengths. In order to compensate for this, each sensor has been calibrated by laser at several wavelengths. When you choose the correct laser wavelength, the correction factor for that wavelength is automatically introduced. Note that the laser wavelength correction in use is displayed in the upper left corner of the display. To set type of laser being used: 1. Press the Down arrow ( ) until Laser is highlighted and press the Enter arrow ( ). 2. Using the Down arrow ( ), scroll through the available lasers until you reach the appropriate laser wavelength. 3. Press the OK key Average How Averaging Works When a laser output is fluctuating or unstable, it is useful to measure the average power over a certain period. The 843-R gives you this exclusive feature, allowing averaging over periods varying from 1 second to 1 hour. As soon as the main power measurement screen (See Figure 4.2) is entered and the instrument is set to average mode, the instrument displays the average of readings over the period since the screen was entered up to the present. When the time period of the average is reached, the average becomes a running average over the average period backward in time. For instance, if the average period is 1 minute, at 30 seconds, the average is over 30 seconds, at 1 minute it is over 1 minute, at 5 minutes, it is over the period from 4 to 5 minutes (1 minute back from the present). 39
41 To Set the Average Period: 1. Press the Down arrow ( ) until Average is highlighted and press the Enter arrow ( ). 2. Using the Down arrow ( ), scroll through the list of average periods until you reach the one that is correct for your measurement needs. Set the average period to NONE to disable averaging. 3. Press the OK key to keep the new setting Other Settings Show or Hide Settings 1. Press the Down arrow ( ) until Show Settings is highlighted and press the Enter arrow ( ). 2. Set to Yes to display sensor settings in the measurement screens. Set to No to hide the sensor settings and show a larger graph. 3. Press the OK key to keep the new setting. Language 1. The 843-R can be configured to one of several languages. 2. Press the Down arrow ( ) until Language is highlighted and press the Enter arrow ( ). 3. Set to English, Japanese, Russian, or Chinese. 4. Press the OK key to keep the new setting. Line Frequency The 843-R has built-in circuitry to screen out electrical noise from the local power grid that can introduce errors to the measurements. Set Line Frequency to your power grid s frequency to screen out the noise correctly. 40
42 1. Press the Down arrow ( ) until Line Frequency is highlighted and press the Enter arrow ( ). 2. Set to 50Hz or 60Hz, depending on the electrical power grid of the area that you are in. 3. Press the OK key to keep the new setting. Clock Settings The 843-R is equipped with a real time clock which will show the date and time. This clock will also allow the 843-R to query the sensor attached and notify you if the sensor is due for calibration. To set Date and Time 1. Press the Down arrow ( ) until the Date and Time are highlighted and press the Enter arrow ( ). 2. Scroll through and select Month, Day, Year, Hour, and Minutes with the Right arrow ( ). Change the selected item with the Down arrow ( ). 3. When finished, press the OK key to keep the new setting Additional On Screen Information On the right hand side of the Setup screen the following information is provided to the user Instrument o Firmware Version o Serial Number o Date of Last Calibration Sensor o Name o Serial Number o Date of Last Calibration (if supported by the sensor 41
43 4.4 Energy Measurement Measuring Energy with Thermopile Sensors Although thermopile sensors are used primarily to measure power, they can measure single shot energy as well, where they integrate the power flowing through the disc over time and thus measure energy. Since the typical time it takes for the disc to heat up and cool down is several seconds, these thermal sensors can only measure one pulse every several seconds at most. Thus they are suitable for what is called single shot measurement. Although the response time of the sensor discs is slow, there is no limit to how short the pulses measured are since the measurement is of the heat flowing through the disc after the pulse Standard Case of Energy Measurement To measure energy of a single pulse, first set up the Energy Range, Laser, and Threshold as described in Section Energy Setup Screen. 1. Wait until READY is flashed on the screen. This indicates that the sensor is ready for a new measurement 2. Fire the laser. The display will go blank while the energy is being integrated. 3. After about 2-4 seconds (depending on the sensor), the correct energy will be displayed. 4. Return to Step 1 for the next measurement. Note: If you fire another pulse before "READY" appears, the reading may be inaccurate or may not be displayed Measuring Pulses of Very Low Energy When it is necessary to measure pulses of very low energy, i.e., less than 0.5% of the maximum range of the instrument, the following two alternative methods allow greater accuracy to be obtained. 42
44 1. A continuous train of pulses may be fired, and the average power measured using Power mode. The energy per pulse can be calculated by: Average Energy per pulse = Average power / Pulse Repetition Rate 2. A train of a known number of pulses may be fired, and the total energy measured in Energy mode. This train should not exceed 5 seconds duration. The energy per pulse can be calculated by: Average Energy per pulse = Total Energy / Number of Pulses In both of the above methods, the pulse repetition rate must exceed 3Hz. Higher rates will generally give improved accuracy, but care should be taken not to exceed maximum power ratings Measuring Energy of Rapidly Repeating Pulses With a typical thermopile sensor, the 843-R will only measure individual pulses every 5 seconds or so. You can also calculate the average energy of rapidly repeating pulses by measuring average power on the power setting and using the formula: Average Energy per Pulse = Average Power / Repetition Rate Pulse Bargraph Screen Screen Layout The Bargraph is a ruler-like display in which the graph is filled proportionally to the reading s being a percentage of full scale. The Bargraph display is composed of the following components: 43
45 Parameter settings, the sensor s name and serial number, and battery status indicator at the top of the screen. READY will be flashed on the screen to indicate that the 843-R is ready to measure the next laser pulse to be fired. Large numeric display shown prominently in the middle of the screen. Bargraph displayed close to the bottom. Softkey legends at the bottom of the screen Softkey Functionality Figure 4.6 Bargraph display with first set of Softkeys Mode: Press this key to change the selected measurement mode. o Press the Up/Down arrow ( ) to set the measurement mode to power or energy. o Press OK to return to the measurement screen with the new selection. o Press Cancel to ignore any changes and continue in Power measurement mode. Display: Press this key to change the graphical display. o Press the Up/Down arrow ( ) to set the display mode to Bargraph or Needle. 44
: Press this for additional Bargraph screen functions.")
46 o o Press OK to return to the measurement screen with the new selection. Press Cancel to ignore any changes and continue with the Bargraph display. Setup: Press this key to change the Energy measurement parameters. This will be described in Section Energy Setup Screen. Right Arrow ( ): Press this for additional Bargraph screen functions. Figure 4.7 Bargraph display with second set of Softkeys Left Arrow ( ): Press this for previous set of Bargraph functions. Zoom: Press this key to focus the Bargraph on the present reading. The Bargraph will show 20% of the full scale centered on the present reading. Thus, if the full scale of the Bargraph is 30 Joules, and your reading is 15 Joules, pressing Zoom will make the Bargraph scale range between approximately 12 and 18 Joules. Small fluctuations in energy are more easily seen in this mode. Zoom will be reverse highlighted to show that it is active. Press the Zoom 45
47 key again to return to the unexpanded Bargraph display. Offset: Unlike power, offset subtraction is not necessary to achieve accurate energy measurements. However it can be used to facilitate comparison between readings. For example, the first laser pulse is 1 Joule. To subtract this from future readings, press the Offset key. If the next pulse is actually 3 Joules, 2 Joules will be displayed on the screen, thereby indicating the difference between the two laser pulses. When active, the Offset key is reverse highlighted and the offset that is being subtracted is shown in the upper right part of the screen. To deactivate, press Offset again Needle Screen Screen Layout A Needle graph simulates an analog display, similar to the style of an analog voltmeter or a car s speedometer. By making use of the persistence feature, you can know what the full range of measurements actually is, including the maximum and minimum readings of the present set of measurements. The Needle display is composed of the following components: Parameter settings, the sensor s name and serial number, and battery status indicator at the top of the screen. READY will be flashed on the screen to indicate that the 843-R is ready to measure the next laser pulse to be fired. Needle displayed prominently in the middle of the screen. Large numeric display. Softkey legends at the bottom of the screen 46
48 Softkey Functionality Figure 4.8 Needle display with first set of Softkeys Mode: Press this key to change the selected measurement mode. o Press the Up/Down arrow ( ) to set the measurement mode to power or energy. o Press OK to return to the measurement screen with the new selection. o Press Cancel to ignore any changes and continue in Power measurement mode. Display: Press this key to change the graphical display. o Press the Up/Down arrow ( ) to set the display mode to Bargraph or Needle. o Press OK to return to the measurement screen with the new selection. o Press Cancel to ignore any changes and continue with the Bargraph display. Setup: Press this key to change the Energy measurement parameters. This will be described in Section Energy Setup Screen. 47
49 Right Arrow ( ): Press this for additional Needle screen functions. Figure 4.9 Needle display with second set of Softkeys and Persistence active Left Arrow ( ): Press this for previous set of Needle functions. Zoom: Press this key to focus the Needle on the present reading. The Needle arc will show 20% of the full scale centered on the present reading. Thus, if the full scale of the Needle is 30 Joules, and your reading is 15 Joules, pressing Zoom will make the Needle scale range between approximately 12 and 18 Joules. Small fluctuations in energy are more easily seen in this mode. Zoom will be reverse highlighted to show that it is active. Press the Zoom key again to return to the unexpanded Needle display. Offset: Unlike power, offset subtraction is not necessary to achieve accurate energy measurements. However it can be used to facilitate comparison between readings. For example, the first laser pulse is 1 Joule. To subtract this from future readings, press the Offset key. If the next pulse is actually 3 Joules, 2 Joules will be displayed on the screen, thereby indicating the difference between the two laser pulses. 48
50 When active, the Offset key is reverse highlighted and the offset that is being subtracted is shown in the upper right part of the screen. To deactivate, press Offset again Energy Setup Screen The 843-R Power Meter can be set to various chosen settings while operating. These configuration settings are automatically saved for the next time the meter is turned on with this sensor. Figure 4.10 Setup Screen Energy Range Energy measurment is always made in a set manual range. The correct range to select is the lowest one that is larger than the largest expected measurement. To Set the Energy Range 1. Press the Down arrow ( ) until Range is highlighted and press the Enter arrow ( ). 49
51 2. Using the Down arrow ( ), scroll through the available ranges until you reach the one that is correct for your measurement needs. 3. Press the OK key to keep the new setting Laser Most Thermopile sensors have somewhat different absorption at different wavelengths. In order to compensate for this, each sensor has been calibrated by laser at several wavelengths. When you choose the correct laser wavelength, the correction factor for that wavelength is automatically introduced. Note that the laser wavelength correction in use is displayed in the upper left corner of the display. To set type of laser being used: 1. Press the Down arrow ( ) until Laser is highlighted and press the Enter arrow ( ). 2. Using the Down arrow ( ), scroll through the available lasers until you reach the appropriate laser wavelength. 3. Press the OK key Minimum Energy Threshold If the 843-R is used in a noisy environment or where there is a high level of background thermal radiation, the instrument may trigger spuriously on the noise or background radiation. It would then fail to measure the intended pulse. Since there is always some degree of noise or background radiation, the instrument is designed not to respond to pulses below some preset minimum size. This "Minimum Energy Threshold" is typically set to 0.3% of full scale of the selected range. If this level is found to be too sensitive for the user's particular environment, it may be altered by the user. The threshold should not, however, be raised higher than necessary. 50
52 This will cause a degradation in the accuracy of energy measurements of pulses below about 4 times the threshold level. The factory setting of energy threshold is "Medium". If the unit triggers on noise, set the threshold to "High". If you are measuring small energies and the unit does not trigger, set the threshold to "Low". To Set the Minimum Threshold Level: 1. Press the Down arrow ( ) until Threshold is highlighted and press the Enter arrow ( ). 2. Using the Down arrow ( ), scroll through the list of threshold levels until you reach the one that is correct for your measurement needs. 3. Press the OK key to keep the new setting Other Settings Show or Hide Settings 1. Press the Down arrow ( ) until Show Settings is highlighted and press the Enter arrow ( ). 2. Set to Yes to display sensor settings in the measurement screens. Set to No to hide the sensor settings and show a larger graph. 3. Press the OK key to keep the new setting. Language 1. The 843-R can be configured to one of several languages. 2. Press the Down arrow ( ) until Language is highlighted and press the Enter arrow ( ). 3. Set to English, Japanese, Russian, or Chinese. 4. Press the OK key to keep the new setting. Line Frequency The 843-R has built-in circuitry to screen out electrical noise from the local power grid that can introduce errors to the measurements. 51
53 Set Line Frequency to your power grid s frequency to screen out the noise correctly. 1. Press the Down arrow ( ) until Line Frequency is highlighted and press the Enter arrow ( ). 2. Set to 50Hz or 60Hz, depending on the electrical power grid of the area that you are in. 3. Press the OK key to keep the new setting. Clock Settings The 843-R is equipped with a real time clock which will show the date and time. This clock will also allow the 843-R to query the sensor attached and notify you if the sensor is due for calibration. To set Date and Time 1. Press the Down arrow ( ) until the Date and Time are highlighted and press the Enter arrow ( ). 2. Scroll through and select Month, Day, Year, Hour, and Minutes with the Right arrow ( ). Change the selected item with the Down arrow ( ). 3. When finished, press the OK key to keep the new setting Additional On Screen Information On the right hand side of the Setup screen the following information is provided to the user Instrument o Firmware Version o Serial Number o Date of Last Calibration Sensor o Name o Serial Number o Date of Last Calibration (if supported by the sensor 52
54 Chapter 5. Operation with Photodiode Sensors Warning: Before using the sensor for power measurement, check that your laser power or energy and energy density does not exceed the sensor ratings. See Table 5 and Table 6 in Chapter Photodiode Sensors When a photon source, such as laser, is directed at one of the 918D or 818DB series photodiode detectors, a current is created proportional to the light intensity and dependent on the wavelength. The 843-R Power Meter amplifies this signal and indicates the power level received by the sensor. Due to the superior circuitry of the 843-R, the noise level is very low, and the 918D / 818 series sensors with the 843-R meter have a large dynamic range, from nanowatts to 2 watts. Newport s 818 and 918D series photodiode sensors come with an attenuation filter, while the 818-xx-L-FC/DB series low cost fiber optic detectors do not. Some of the 819C/D series integrating sphere detectors utilize the 918D series detector, which has an integrated filter. Please refer to their user manuals and web sites for the specifications. A general guideline is to use the filter when the power level of the source is more than a few mw, to avoid sensor saturation. When saturated, the legend "OVER" will appear on the screen. 5.2 Startup Configuration On power up, the 843-R Meter checks its own memory as well as the sensor s to decide on the measurement configuration. For example, if in the last session, the sensor was used to measure power in the Bargraph screen in autoranging with a 1064 laser and averaging for 53
55 10 seconds, this will be the setup used the next time the system is powered up. These settings can all be easily changed, as will be described fully in the following sections. 5.3 Power Measurement Photodiode sensors measure power continuously at an update rate of 15 times per second. To best ensure measurement accuracy, center the laser beam carefully on the absorber surface. Power measurements can be displayed in Bargraph or Needle graphical formats. Updating measurement parameters is performed in the easy-to-reach Setup screen Bargraph Display Screen Layout The Bargraph is a ruler-like display in which the graph is filled proportionally to the reading s being a percentage of full scale. The Bargraph display is composed of the following components: Parameter settings, the sensor s name and serial number, and battery status indicator at the top of the screen. Large numeric display shown prominently in the middle of the screen. Bargraph displayed close to the bottom. Softkey legends at the bottom of the screen. 54
56 Softkey Functionality Figure 5.1 Bargraph display with first set of Softkeys Power: With Photodiode sensors, the only measurement mode available is Power. Pressing this key will affect no change. Display: Press this key to change the graphical display. o Press the Up/Down arrow ( ) to set the display mode to Bargraph or Needle. o Press OK to return to the measurement screen with the new selection. o Press Cancel to ignore any changes and continue with the Bargraph display. Setup: Press this key to change the Power measurement parameters. This will be described in Section Power Setup Screen. Right Arrow ( ): Press this for additional Bargraph screen functions. 55
57 Figure 5.2 Bargraph display with second set of Softkeys and Zoom active Left Arrow ( ): Press this for previous set of Bargraph functions. Zoom: Press this key to focus the Bargraph on the present reading. The Bargraph will show 20% of the full scale centered on the present reading. Thus, if the full scale of the Bargraph is 20 mw, and your reading is 15 mw, pressing Zoom will make the Bargraph scale range between approximately 13 and 17 mw. Small fluctuations in power are more easily seen in this mode. Zoom will be reverse highlighted to show that it is active. Press the Zoom key again to return to the unexpanded Bargraph display. Offset: If the ambient environment has a thermal background, so that the 843-R shows a nonzero power reading even when there is no laser, you can subtract the background using the Offset function. For example, the 843-R display reads 0.1 mw when the laser is blocked, and 20.5 mw with laser power applied. In this case, the true power is = 20.4 mw. To subtract the background, press the Offset key while the laser is blocked. The 843-R will now read zero, and the 0.1 mw background will be subtracted from all subsequent readings. The laser power reading displayed will thus be 20.4 mw. 56
58 When active, the Offset key is reverse highlighted and the offset that is being subtracted is shown in the upper right part of the screen. To deactivate, press Offset again. If you suspect that the 843-R has a permanent zero offset, the instrument s internal zero should be reset. See Section Needle Display Screen Layout A Needle graph simulates an analog display, similar to the style of an analog voltmeter or a car s speedometer. By making use of the persistence feature, you can know what the full range of measurements actually is, including the maximum and minimum readings of the present set of measurements. The Needle display is composed of the following components: Parameter settings, the sensor s name and serial number, and battery status indicator at the top of the screen. Needle displayed prominently in the middle of the screen. Large numeric display. Softkey legends at the bottom of the screen. 57
59 Softkey Functionality Figure 5.3 Needle display with first set of Softkeys Power: With Photodiode sensors, the only measurement mode available is Power. Pressing this key will affect no change. Display: Press this key to change the graphical display. o Press the Up/Down arrow ( ) to set the display mode to Bargraph or Needle. o Press OK to return to the measurement screen with the new selection. o Press Cancel to ignore any changes and continue with the Bargraph display. Setup: Press this key to change the Power measurement parameters. This will be described in Section Power Setup Screen. Right Arrow ( ): Press this for additional Needle screen functions. 58
60 Figure 5.4 Needle display with second set of Softkeys and Persistence active Left Arrow ( ): Press this for previous set of Needle functions. Zoom: Press this key to focus the Bargraph on the present reading. The Bargraph will show 20% of the full scale centered on the present reading. Thus, if the full scale of the Bargraph is 20 mw, and your reading is 15 mw, pressing Zoom will make the Bargraph scale range between approximately 13 and 17 mw. Small fluctuations in power are more easily seen in this mode. Zoom will be reverse highlighted to show that it is active. Press the Zoom key again to return to the unexpanded Bargraph display. Offset: If the ambient environment has a thermal background, so that the 843-R shows a nonzero power reading even when there is no laser, you can subtract the background using the Offset function. For example, the 843-R display reads 0.1 mw when the laser is blocked, and 20.5 mw with laser power applied. In this case, the true power is = 20.4 mw. To subtract the background, press the Offset key while the laser is blocked. The 843-R will now read zero, and the 0.1 mw background will be 59

61 subtracted from all subsequent readings. The laser power reading displayed will thus be 20.4 mw. When active, the Offset key is reverse highlighted and the offset that is being subtracted is shown in the upper right part of the screen. To deactivate, press Offset again. If you suspect that the 843-R has a permanent zero offset, the instrument s internal zero should be reset. See Section Power Setup Screen The 843-R Power Meter can be set to various chosen settings while operating. These configuration settings are automatically saved for the next time the meter is turned on with this sensor. Figure 5.5 Setup Screen Power Range Autorange In autorange mode, you do not have to change scales. When the reading of the meter is more than 100% of full 60
62 scale of the present range, the 843-R will reconfigure itself to the next higher range. The ranges are arranged in factors of 1, 10, 100, etc. When the reading falls below 7% of full scale of the present range, the 843-R will reconfigure itself one range down. This change only occurs after a few seconds delay, thereby providing overlap (hysteresis) that limits the 843-R from flipping back and forth when reading close to the end of the scale. Manual Range There are certain disadvantages to autorange since it changes scale even if you don't want it to do so. If you want to measure in the same range all the time, it is better to use manual range. The correct range to select is the lowest one that is larger than the largest expected measurement. Logarithmic Scale The 843-R allows the measurement to be made in units of dbm that is a logarithmic scale. This is useful if you expect the readings to vary over several ranges and want to everything in one scale. The formula for dbm units is defined as 10 x Log (reading in mw). Therefore, at 1mW the reading will be 0 dbm, at 10mW it will be 10 dbm, at 100mW it will be 20 dbm etc. To Set the Power Range 1. Press the Down arrow ( ) until Range is highlighted and press the Enter arrow ( ). 2. Using the Down arrow ( ), scroll through the available ranges until you reach the one that is correct for your measurement needs. 3. Press the OK key to keep the new setting. 61
63 Laser Photodiode sensors have a different sensitivity at different wavelengths. Moreover, the filters used in the sensor have a different transmission at different wavelengths. In order to compensate, each sensor has a built in calibration curve (with 1nm resolution) over the entire measurement range. When you choose the correct laser wavelength, the correction factor for that wavelength is automatically introduced. To set type of laser being used: 1. Press the Down arrow ( ) until Laser is highlighted and press the Enter arrow ( ). 2. Using the Down arrow ( ), scroll through the available lasers until you reach the appropriate laser wavelength. 3. If your wavelength is listed, use the Down arrow ( ) to scroll through the wavelengths until reached and press the OK key. 4. If the wavelength you want is not among the wavelengths in the six wavelengths listed press the Modify key. 5. Use the Right ( ) and Down ( ) arrows to adjust the wavelength as desired. Then press the OK key Filter When the sensor is equipped with an attenuator filter, as is the case for the 818 or 918D series, the calibration module contains two sets of calibration data, with and without the filter on. When the Filter function is turned on, the calibration data with the filter in is used. 62
64 Warning: If a Newport photodiode sensor is used in the "Filter IN" setting and the filter is not installed or vice versa the readings will be completely incorrect. If the power of your laser exceeds the maximum for filter in, you can purchase a thermal or integrating sphere sensor for that wavelength. Consult your Newport agent for details. To choose the filter setting: 1. Press the Down arrow ( ) until Filter is highlighted and press the Enter arrow ( ). 2. Using the Down arrow ( ), toggle between OUT and IN to reach the appropriate Filter setting. 3. If you choose wish to work with filter IN, be sure to place the removable filter on the detector sensor. 4. If you choose wish to work with filter OUT, be sure to remove the removable filter from the detector sensor. 5. Press the OK key to keep the new setting. 63
65 Average How Averaging Works When a laser output is fluctuating or unstable, it is useful to measure the average power over a certain period. The 843-R gives you this exclusive feature, allowing averaging over periods varying from 1 second to 1 hour. As soon as the main power measurement screen (See Figure 5.1) is entered and the instrument is set to average mode, the instrument displays the average of readings over the period since the screen was entered up to the present. When the time period of the average is reached, the average becomes a running average over the average period backward in time. For instance, if the average period is 1 minute, at 30 seconds, the average is over 30 seconds, at 1 minute it is over 1 minute, at 5 minutes, it is over the period from 4 to 5 minutes (1 minute back from the present). To Set the Average Period: 1. Press the Down arrow ( ) until Average is highlighted and press the Enter arrow ( ). 2. Using the Down arrow ( ), scroll through the list of average periods until you reach the one that is correct for your measurement needs. Set the average period to NONE to disable averaging. 3. Press the OK key to keep the new setting Other Settings Show or Hide Settings 1. Press the Down arrow ( ) until Show Settings is highlighted and press the Enter arrow ( ). 2. Set to Yes to display sensor settings in the measurement screens. Set to No to hide the sensor settings and show a larger graph. 3. Press the OK key to keep the new setting. 64
66 Language 1. The 843-R can be configured to one of several languages. 2. Press the Down arrow ( ) until Language is highlighted and press the Enter arrow ( ). 3. Set to English, Japanese, Russian, or Chinese. 4. Press the OK key to keep the new setting. Line Frequency The 843-R has built-in circuitry to screen out electrical noise from the local power grid that can introduce errors to the measurements. Set Line Frequency to your power grid s frequency to screen out the noise correctly. 1. Press the Down arrow ( ) until Line Frequency is highlighted and press the Enter arrow ( ). 2. Set to 50Hz or 60Hz, depending on the electrical power grid of the area that you are in. 3. Press the OK key to keep the new setting. Clock Settings The 843-R is equipped with a real time clock which will show the date and time. This clock will also allow the 843-R to query the sensor attached and notify you if the sensor is due for calibration. To set Date and Time 1. Press the Down arrow ( ) until the Date and Time are highlighted and press the Enter arrow ( ). 2. Scroll through and select Month, Day, Year, Hour, and Minutes with the Right arrow ( ). Change the selected item with the Down arrow ( ). 3. When finished, press the OK key to keep the new setting. 65
67 Additional On Screen Information On the right hand side of the Setup screen the following information is provided to the user Instrument o Firmware Version o Serial Number o Date of Last Calibration Sensor o Name o Serial Number o Date of Last Calibration (if supported by the sensor 5.4 Special Cases of Power Measurement Measuring db loss using the db Offset function Since dbm is a logarithmic measurement, the ratio between two measurements will be the difference between the dbm measurements. For instance, if you want to measure the loss in a fiber optic cable where the measurement before the cable is 1mW = 0dBm and the measurement after the cable is 0.1mW = -10dBm. The ratio is then 1:10 = 0.1 and the db loss is 0 (-10) = 10dB. The db offset function allows you to easily measure this. To do so do as follows: 1. When measuring the reference value press db Offset. The value changes to 0 db (note that now the units are db, a relative value instead of dbm, an absolute value). 2. Now make your second measurement and the value of the difference in db = ratio in numerical units will be shown. Note: If there is a zero offset in the reference value, you cannot subtract this using the db offset function. Instead, before the start of the measurement, press Offset and subtract the zero offset. Then follow 66
68 steps 1 and 2 above. The zero offset subtracted when Offset was pressed will be saved in the dbm scale and you can now use the db Offset setting to measure true ratio without zero offset problems Measuring Very Low Powers When measuring very low powers, such as picowatt measurements using Newport s photodiode sensor, there will be a rather large zero offset coming from the detector as well as a considerable noise fluctuation. Nevertheless, you can measure these low values by using the average function and pressing offset to eliminate the detector zero offset. In order to measure very low powers do as follows: 1. In the Setup screen, set the appropriate Average period. Return to the measurement screen. 2. Now block the power source you wish to measure, wait for a few measurement periods and press Offset to subtract the zero offset. 3. Now unblock the power source and measure. 67
69 Chapter 6. Operation with Pyroelectric Sensors Warning: Before using the sensor for power or energy measurement, check that your laser power, energy and energy density do not exceed the sensor ratings as listed in the table with the sensor specifications. Otherwise, there is a risk of damaging the absorber. With the pyroelectric sensor, you have been supplied a test slide with the same coating as on your pyroelectric detector. You can also obtain this slide from your dealer. You should use this slide to test the damage threshold with your laser pulses. If the slide shows damage, then either enlarge your beam or lower the laser energy until damage is no longer seen. To measure pyroelectric energies properly, it is important that the sensor is not grounded to the optical bench. Make sure that the sensor is isolated electrically from the ground. The 919E sensor has been supplied with an insulating mounting post for this purpose Pyroelectric & Photodiode Energy Sensors Supported Models 843-R supports the 919E series of sensors. Older models of Pyroelectric Energy Sensors are not supported Pyroelectric sensors method of operation When a pulsed heat source, such as a laser, is directed at the detector sensor, a temperature gradient is created across the pyroelectric crystal mounted in the sensor. An electric charge is produced which is proportional to the energy absorbed. The detector sensor has sophisticated circuitry unique to Newport (patented) that determines the baseline before the pulse is received, 68
70 measures the voltage after a pre-determined interval, amplifies it and holds it for a pre-determined time. Due to this innovative circuitry, Newport pyroelectric sensors can measure very long pulses as well as short ones. They can measure low energies as well as high. They can also measure at higher repetition rates than was possible before. The 843-R meter amplifies this signal and indicates the energy received by the sensor as well as the frequency at which the laser is pulsing. Using the energy and frequency information, 843-R is also able to display average power Photodiode Energy Sensors method of operation The 919E-20U-10-20K operates in a similar fashion to the Pyroelectric-based sensors except it has a Photodiode detector instead of Pyroelectric. Because of its great sensitivity, it can operate down to about 1nJ of energy. It has complete wavelength correction over its entire measurement range of nm Startup Configuration On power up, the 843-R meter checks its own memory as well as the sensor s to decide on the measurement configuration. For example, if in the last session, the sensor was used to measure energy in the Bargraph screen in the 200uJ range with a 1064 laser with no averaging, this will be the setup used the next time the system is powered up. These settings can all be easily changed, as will be described fully in the following sections. 69
71 6.3. Measuring Energy with Pyroelectric Sensors The Pyroelectric sensor is capable of measuring pulses up to very high repetition rates on the order of kilohertz or higher. The 843-R meter will sample pulses at up to 25,000 pulses depending on the sensor. However, the display can only display at rates up to 10Hz. Energy measurements can be displayed in Bargraph or Needle graphical formats. Updating measurement parameters is performed in the easy-to-reach Setup screen Bargraph Screen Screen Layout The Bargraph is a ruler-like display in which the graph is filled proportionally to the reading s being a percentage of full scale. The Bargraph display is composed of the following components: Parameter settings, the sensor s name and serial number, and battery status indicator at the top of the screen. Large numeric display shown prominently in the middle of the screen. Frequency displayed above the energy reading, on the right side of the screen. Bargraph displayed close to the bottom. Softkey legends at the bottom of the screen. 70
72 Softkey Functionality Figure 6.1 Bargraph display with first set of Softkeys Mode: Press this key to change the selected measurement mode. o Press the Up/Down arrow ( ) to set the measurement mode to Energy or Power. o Press OK to return to the measurement screen with the new selection. o Press Cancel to ignore any changes and continue in Power measurement mode. Display: Press this key to change the graphical display. o Press the Up/Down arrow ( ) to set the display mode to Bargraph or Needle. o Press OK to return to the measurement screen with the new selection. o Press Cancel to ignore any changes and continue with the Bargraph display. Setup: Press this key to change the Energy measurement parameters. This will be described in Section Energy Setup Screen. Right Arrow ( ): Press this for additional Bargraph screen functions. 71
73 Figure 6.2 Bargraph display with second set of Softkeys Left Arrow ( ): Press this for previous set of Bargraph functions. Zoom: Press this key to focus the Bargraph on the present reading. The Bargraph will show 20% of the full scale centered on the present reading. Thus, if the full scale of the Bargraph is 20 Joules, and your reading is 15 Joules, pressing Zoom will make the Bargraph scale range between approximately 13 and 17 Joules. Small fluctuations in energy are more easily seen in this mode. Zoom will be reverse highlighted to show that it is active. Press the Zoom key again to return to the unexpanded Bargraph display. Offset: Offset can be used to facilitate comparison between readings. For example, the first laser pulse is 1 Joule. To subtract this from future readings, press the Offset key. If the next pulse is actually 3 Joules, 2 Joules will be displayed on the screen, thereby indicating the difference between the two laser pulses. When active, the Offset key is reverse highlighted and the offset that is being subtracted is shown in the upper right part of the screen. To deactivate, press Offset again. 72
74 Needle Screen Screen Layout A Needle graph simulates an analog display, similar to the style of an analog voltmeter or a car s speedometer. By making use of the persistence feature, you can know what the full range of measurements actually is, including the maximum and minimum readings of the present set of measurements. The Needle display is composed of the following components: Parameter settings, the sensor s name and serial number, and battery status indicator at the top of the screen. Needle displayed prominently in the middle of the screen. Frequency displayed above the needle, on the right side of the screen. Large numeric display. Softkey legends at the bottom of the screen Softkey Functionality Figure 6.3 Needle display with first set of Softkeys 73
75 Mode: Press this key to change the selected measurement mode. o Press the Up/Down arrow ( ) to set the measurement mode to Energy or Power. o Press OK to return to the measurement screen with the new selection. o Press Cancel to ignore any changes and continue in Power measurement mode. Display: Press this key to change the graphical display. o Press the Up/Down arrow ( ) to set the display mode to Bargraph or Needle. o Press OK to return to the measurement screen with the new selection. o Press Cancel to ignore any changes and continue with the Bargraph display. Setup: Press this key to change the Energy measurement parameters. This will be described in Section Energy Setup Screen. Right Arrow ( ): Press this for additional Needle screen functions. Figure 6.4 Needle display with second set of Softkeys and Persistence active 74
76 Left Arrow ( ): Press this for previous set of Needle functions. Zoom: Press this key to focus the Needle on the present reading. The Needle arc will show 20% of the full scale centered on the present reading. Thus, if the full scale of the Needle is 20 Joules, and your reading is 15 Joules, pressing Zoom will make the Needle scale range between approximately 13 and 17 Joules. Small fluctuations in energy are more easily seen in this mode. Zoom will be reverse highlighted to show that it is active. Press the Zoom key again to return to the unexpanded Bargraph display. Offset: Offset can be used to facilitate comparison between readings. For example, the first laser pulse is 1 Joule. To subtract this from future readings, press the Offset key. If the next pulse is actually 3 Joules, 2 Joules will be displayed on the screen, thereby indicating the difference between the two laser pulses. When active, the Offset key is reverse highlighted and the offset that is being subtracted is shown in the upper right part of the screen. To deactivate, press Offset again Energy Setup Screen The 843-R meter can be set to various chosen settings while operating. These configuration settings are automatically saved for the next time the meter is turned on with this sensor. 75

77 Energy Range Figure 6.5 Setup Screen Energy measurement with a Pyroelectric sensor is always made in a set manual range. The correct range to select is the lowest one that is larger than the largest expected measurement. To Set the Energy Range 1. Press the Down arrow ( ) until Range is highlighted and press the Enter arrow ( ). 2. Using the Down arrow ( ), scroll through the available ranges until you reach the one that is correct for your measurement needs. 3. Press the OK key to keep the new setting Laser Metallic type absorbers (continous spectral curve): The absorption of the detector coating varies somewhat with wavelength. The correction curve for the absorber is stored in the sensor EEROM. This correction curve ensures that the power reading is correct at all laser wavelengths. 76
ORION ORION LASER POWER METER USER MANUAL. OPHIR OPTRONICS
 ORION ORION LASER POWER METER USER MANUAL OPHIR OPTRONICS www.ophiropt.com/photonics Table of Contents Chapter 1 Introduction: How to Use This Manual... 2 Chapter 2 Quick Reference... 3 2.1 Getting Started...3
Gentec-EO USA. T-RAD-USB Users Manual. T-Rad-USB Operating Instructions /15/2010 Page 1 of 24
 Gentec-EO USA T-RAD-USB Users Manual Gentec-EO USA 5825 Jean Road Center Lake Oswego, Oregon, 97035 503-697-1870 voice 503-697-0633 fax 121-201795 11/15/2010 Page 1 of 24 System Overview Welcome to the
Quick Start Guide for the PULSE PROFILING APPLICATION
 Quick Start Guide for the PULSE PROFILING APPLICATION MODEL LB480A Revision: Preliminary 02/05/09 1 1. Introduction This document provides information to install and quickly start using your PowerSensor+.
IT-24 RigExpert. 2.4 GHz ISM Band Universal Tester. User s manual
 IT-24 RigExpert 2.4 GHz ISM Band Universal Tester User s manual Table of contents 1. Description 2. Specifications 3. Using the tester 3.1. Before you start 3.2. Turning the tester on and off 3.3. Main
AA-35 ZOOM. RigExpert. User s manual. Antenna and cable analyzer
 AA-35 ZOOM Antenna and cable analyzer RigExpert User s manual . Table of contents Introduction Operating the AA-35 ZOOM First time use Main menu Multifunctional keys Connecting to your antenna SWR chart
Photodiode Heads and Instruments
 Photodiode Heads and Instruments The PD-300 series heads offer spectral coverage from 193-1800nm. The power range of the series is from picowatts to 3 Watts. 20 For latest updates please visit our website:
CAST Application User Guide
 CAST Application User Guide for DX900+ Electromagnetic Multilog Sensor U.S. Patent No. 7,369,458. UK 2 414 077. Patents Pending 17-630-01-rev.b 05/24/17 1 Copyright 2017 Airmar Technology Corp. All rights
FAG PRESTO DX. FAG PRESTO-DX preliminary User Manual. FAG GRAPHIC SYSTEMS S.A. 3, rue de la Vigie CH-1003 Lausanne Switzerland
 FAG PRESTO DX FAG PRESTO-DX preliminary User Manual Table of Contents Safety Instructions... 4 DECLARATION OF CONFORMITY... Erreur! Signet non défini. PRESTO DX... 5 Pass Fail Indicator... 6 RESET and
Portable Appliance Testers. OmegaPAT MI 2140 BetaPAT MI 2141 User Manual Ver Code No
 Portable Appliance Testers OmegaPAT MI 2140 BetaPAT MI 2141 User Manual Ver. 1.2. Code No. 20 750 684 Distributor: Producer: METREL d.d. Ljubljanska 77 SI-1354 Horjul E-mail: metrel@metrel.si http://www.metrel.si
QUANTUM Qflash MODEL T OPERATING INSTRUCTIONS
 QUANTUM Qflash MODEL T OPERATING INSTRUCTIONS 1.0 DESIGNATIONS 1. Removable Reflector, two positions Normal and Wide angle. 2. Flash-tube 3. Bounce Head, Rotates 180º 4. Swivel Head, Rotates ± 90º 5. Sensor
QUANTUM Qflash T2 / X2 OPERATING INSTRUCTIONS
 QUANTUM Qflash T2 / X2 OPERATING INSTRUCTIONS 1.0 DESIGNATIONS T2 AND X2 1. Removable Reflector, two positions Normal and Wide angle. 2. Flash-tube 2A. Modeling Lamp (for Model X2 only) 3. Bounce Head,
Power Meter. Measurement Guide. for Anritsu RF and Microwave Handheld Instruments BTS Master Site Master Spectrum Master Cell Master
 Measurement Guide Power Meter for Anritsu RF and Microwave Handheld Instruments BTS Master Site Master Spectrum Master Cell Master Power Meter Option 29 High Accuracy Power Meter Option 19 Inline Peak
Mach 5 100,000 PPS Energy Meter Operating Instructions
 Mach 5 100,000 PPS Energy Meter Operating Instructions Rev AF 3/18/2010 Page 1 of 45 Contents Introduction... 3 Installing the Software... 4 Power Source... 6 Probe Connection... 6 Indicator LED s... 6
GFL-1000 User Manual Ground Fault Locator
 GFL-Series User Manual V1.1 GFL-1000 User Manual Ground Fault Locator Contents Contents... 1 1 Declaration of Conformity... 3 2 Introduction... 3 3 Equipment Information... 3 3.1 Safety Precautions...
IVI STEP TYPES. Contents
 IVI STEP TYPES Contents This document describes the set of IVI step types that TestStand provides. First, the document discusses how to use the IVI step types and how to edit IVI steps. Next, the document
OVEN INDUSTRIES, INC. Model 5C7-362
 OVEN INDUSTRIES, INC. OPERATING MANUAL Model 5C7-362 THERMOELECTRIC MODULE TEMPERATURE CONTROLLER TABLE OF CONTENTS Features... 1 Description... 2 Block Diagram... 3 RS232 Communications Connections...
impact VC-500LR Monolight INSTRUCTIONS
 impact lighting equipment and accessories VC-500LR Monolight INSTRUCTIONS Congratulations on your purchase of the Impact VC-500LR Monolight. We feel that it will contribute much to your photographic skill
MAGNETIC FIELD METER Operator s Manual
 Edition 4.4 September 2011 MAGNETIC FIELD METER 3000 Operator s Manual The MFM 3000 is a professional magnetic field instrument To make the best use of the instrument we recommend that you read this manual
LVTX-10 Series Ultrasonic Sensor Installation and Operation Guide
 LVTX-10 Series Ultrasonic Sensor Installation and Operation Guide M-5578/0516 M-5578/0516 Section TABLE OF CONTENTS 1 Introduction... 1 2 Quick Guide on Getting Started... 2 Mounting the LVTX-10 Series
OEM Solutions POWER PROBES OEM SOLUTIONS USB/RS232 SENSORS MONITORS & SW
 OEM Solutions POWER PROBES OEM SOLUTIONS USB/RS232 MONITORS & SW Via Burona, 51 - Vimodrone (Milano) - ITALY 95 OEM and Custom Products POWER PROBES OEM SOLUTIONS USB/RS232 MONITORS & SW A customer-driven
Operating Instructions
 CMYX Color mark sensor Operating Instructions CAUTIONS AND WARNINGS SET-UP DISTANCE ADJUSTMENT: As a general rule, the sensor should be fixed at a 15 to 20 angle from directly perpendicular to the target
INDEX. Accessories and Components System Unit and Joystick Assembly and Charging the Battery Using with LED System...
 USER GUIDE INDEX Accessories and Components... 4 System Unit and Joystick... 6 Assembly and Charging the Battery... 9 Using with LED System... 11 What is Ground Setting and How It Is Done... 14 Ground
Revision 1.8 II WARANTY
 Revision 1.8 II ARANTY First Year arranty The Gentec-EO thermal power detectors carry a one-year warranty (from date of shipment) against material and /or workmanship defects when used under normal operating
Revision 1.4 II. Warranty
 Revision 1.4 II arranty First Year arranty The Gentec-EO thermal power detectors carry a one-year warranty (from date of shipment) against material and /or workmanship defects when used under normal operating
Pyroelectric, Photodiode and RP Heads for Repetitive Energy Measurements
 Pyroelectric, Photodiode and RP Heads for Repetitive Energy Measurements Pyroelectric and Photodiode Heads RP Heads For latest updates please visit our website: www.ophiropt.com 1 Pyroelectric and Photodiode
CL900. True RMS 1000V 2000A 60MΩ ENGLISH. INSTRUCTION MANUAL 2000A Digital Clamp Meter. Measurement Technology
 ENGLISH INSTRUCTION MANUAL 2000A Digital Clamp Meter True RMS Measurement Technology NON-CONTACT VOLTAGE TESTING INRUSH CURRENT LOW IMPEDANCE DATA HOLD RANGE HOLD AUDIBLE CONTINUITY DIODE TEST CAPACITANCE
PAMS. User s Manual. Portable Attenuation Measurement System. The solution for making easy shielding effectiveness measurements.
 PAMS Portable Attenuation Measurement System User s Manual The solution for making easy shielding effectiveness measurements. 310-010042-001 TABLE OF CONTENTS Warranty Statement 1 Chapter 1 General Information
R PROFLAME Instruction Book Collection
 9.956.028 R00 584 PROFLAME Instruction Book Collection 4-17 18-29 584 PROFLAME System 30-39 Appendix: DIP SWITCH NUMBER (0=ON 1=OFF) 40-41 4-17 Fig. 1 The SIT is a device that allows, in conjunction with
U S E R S M A N U A L
 U S E R S M A N U A L T H E R M O R E G U L A T O R T R 5 0 0 / T R 5 0 1 S E R I E S HUNDREDTHS VERSION ENGLISH V.1.2 TABLE OF CONTENTS -1- Introduction... page 2-2- Technical specifications -3- Description
T6+ Analog I/O Section. Installation booklet for part numbers: 5/4-80A-115 5/4-90A-115 5/4-80A /4-90A-1224
 T and T+ are trade names of Trol Systems Inc. TSI reserves the right to make changes to the information contained in this manual without notice. publication /4A115MAN- rev:1 2001 TSI All rights reserved
Handbook Ref No. IH001/Issue D File Ref: PR203-v5D.doc
 Handbook Ref No. IH001/Issue D File Ref: PR203-v5D.doc 1. Introduction 2. Specification 3. Operation 4. Spectral Irradiance Measurements 5. Cosine Angular Response 6. Calibration Description 7. Care and
APPLICATION NOTE. Computer Controlled Variable Attenuator for Lasers. Technology and Applications Center Newport Corporation
 APPLICATION NOTE Computer Controlled Variable Attenuator for Lasers 31 Technology and Applications Center Newport Corporation Computer Controlled Variable Attenuator for Lasers This application note describes
3 AXIS RF ELECTROMAGNETIC FIELD METER
 50 MHz to 3 GHz Radio Frequency Radiation Meters Electromagnetic Field strength measurement 3 AXIS RF ELECTROMAGNETIC FIELD METER Model : EMF-819 Your purchase of this RF EMF METER marks a step forward
Instruction Manual. Model USB Wattmeter
 Instruction Manual Model 81041 USB Wattmeter TABLE OF CONTENTS Specifications and Leading Particulars. 2 General Description 1. Purpose and Application 3 2. Description. 3 3. Theory of Operation... 4
EULAMBIA ADVANCED TECHNOLOGIES LTD. User Manual EAT-EOM-CTL-2. Alexandros Fragkos
 EULAMBIA ADVANCED TECHNOLOGIES LTD User Manual Alexandros Fragkos (alexandros.fragkos@eulambia.com) 11/28/2016 28/11/2016 User Manual User Manual 28/11/2016 Electro-Optic Modulator Bias Control Unit v2.0
Metaphase ULC-2. Technologies ULC. Metaphase. Technologies Version 6.2 June 12, 2013 USER MANUAL. metaphase-tech.com. pg. 1
 ULC Version 6.2 June 12, 2013 USER MANUAL pg. 1 Overview Universal LED Controller () provides independent true constant-current or voltage control of two LED loads from 0.02 to 4 Amps continuous (DC) with
Reference Guide Brief explanations for routine operations
 Reference Guide Brief explanations for routine operations DCP-T30 DCP-T50W DCP-T70W Brother recommends keeping this guide next to your Brother machine for quick reference. Online User's Guide For more
MM700. True RMS ENGLISH. INSTRUCTION MANUAL Auto-Ranging. Measurement Technology
 INSTRUCTION MANUAL Auto-Ranging Digital Multimeter er True RMS Measurement Technology MM700 DATA & RANGE HOLD LOW IMPEDANCE AUDIBLE CONTINUITY MIN / MAX / RELATIVE TEMPERATURE DIODE TEST CAPACITANCE &
UCE-DSO212 DIGITAL OSCILLOSCOPE USER MANUAL. UCORE ELECTRONICS
 UCE-DSO212 DIGITAL OSCILLOSCOPE USER MANUAL UCORE ELECTRONICS www.ucore-electronics.com 2017 Contents 1. Introduction... 2 2. Turn on or turn off... 3 3. Oscilloscope Mode... 4 3.1. Display Description...
Changing settings in the BlueSolar MPPT Charge Controllers
 2016-11-21 07:40 1/14 Changing settings in the BlueSolar MPPT Charge Controllers Changing settings in the BlueSolar MPPT Charge Controllers DEPRECATED: Use VictronConnect instead of mpptprefs We recommend
Magic Wand Portable Scanner with Auto-Feed Dock. PDSDK-ST470-VP-BX2 User Manual
 Magic Wand Portable Scanner with Auto-Feed Dock PDSDK-ST470-VP-BX2 User Manual Table of Contents 1. KEY FEATURES... 2 2. FUNCTIONAL PARTS... 2 3. EXPLANATION OF THE STATUS ICONS... 4 4. GETTING STARTED...
TT7000R4. DS Instruments. D text. RF Power Meter, Signal Generator, Frequency Counter. -Key Features-
 -Key Features- DS Instruments Power Meter 50 to 7000MHz Frequency Counter 100 to 7000MHz R4 RF Power Meter, Signal Generator, Frequency Counter Signal Generator 300 to 9600MHz Internal 31dB Step Attenuator
Happy Link Software INSTRUCTION MANUAL
 Happy Link Software INSTRUCTION MANUAL 101001E-3 HAPPY Contents Regarding this software Normal Operation -------------------------------------------------------------------------------------------------
Optical Power Meter Basics
 Optical Power Meter Basics Introduction An optical power meter measures the photon energy in the form of current or voltage from an optical detector such as a semiconductor, a thermopile, or a pyroelectric
RigExpert AA-170 Antenna Analyzer (0.1 to 170 MHz) User s manual
 User s manual") RigExpert AA-170 Antenna Analyzer (0.1 to 170 MHz) User s manual Table of contents 1. Description... 3 2. Specifications... 4 3. Precautions... 5 4. Operation... 6 4.1. Preparation for use... 6 4.2. Turning
RigExpert AA-170 Antenna Analyzer (0.1 to 170 MHz) User s manual Table of contents 1. Description... 3 2. Specifications... 4 3. Precautions... 5 4. Operation... 6 4.1. Preparation for use... 6 4.2. Turning
SL300 Snow Depth Sensor USL300 SNOW DEPTH SENSOR. Revision User Manual
 USL300 SNOW DEPTH SENSOR Revision 1.1.2 User Manual 1 Table of Contents 1. Introduction... 3 2. Operation... 3 2.1. Electrostatic Transducer... 4 2.2. SL300 Analog Board... 4 2.3. SL300 Digital Circuit
BATTERY MONITOR User Manual
 BATTERY MONITOR User Manual Manual Version: BM-2016-1 TABLE OF CONTENTS 1 INTRODUCTION... 1 1.1 Product Description... 1 1.2 Key Features... 1 1.3 Versioning... 1 2 PRODUCT OVERVIEW... 2 2.1 Battery Monitor
Instruction Manual ABM HART Gateway Software. Instruction Manual Revision A.1
 Instruction Manual ABM HART Gateway Software Instruction Manual Revision A.1 Table of Contents Section 1: Getting Started... 3 1.1 Setup Procedure... 3 1.2 Quick Setup Guide for Ultrasonic Sensors... 11
PIN/PINLESS DEEP SENSING MOISTURE METER WITH SPHERICAL SENSOR AND REMOTE PROBE
 99 Washington Street Melrose, MA 02176 Phone 781-665-1400 Toll Free 1-800-517-8431 Visit us at www.testequipmentdepot.com PIN/PINLESS DEEP SENSING MOISTURE METER WITH SPHERICAL SENSOR AND REMOTE PROBE
FieldMaster GS. Power/Energy Analyzer User Manual
 FieldMaster GS Power/Energy Analyzer User Manual FieldMaster GS Power/Energy Analyzer User Manual Software Version 2.10 Manual Part Number 0217-378-00 EA 2002, Coherent, Inc. 1 2 FieldMaster GS Contents
( F L O W I Z F A M I L Y )
") THE MOST ACCURATE BATTERY POWERED SYSTEM ( F L O W I Z F A M I L Y ) E l e c t r o m a g n e t i c c o n v e r t e r p o w e r e d b y b a t t e r i e s, s o l a r p a n e l o r D C p o w e r w i t h 4
THE MOST ACCURATE BATTERY POWERED SYSTEM ( F L O W I Z F A M I L Y ) E l e c t r o m a g n e t i c c o n v e r t e r p o w e r e d b y b a t t e r i e s, s o l a r p a n e l o r D C p o w e r w i t h 4
EXPERIMENT NUMBER 2 BASIC OSCILLOSCOPE OPERATIONS
 1 EXPERIMENT NUMBER 2 BASIC OSCILLOSCOPE OPERATIONS The oscilloscope is the most versatile and most important tool in this lab and is probably the best tool an electrical engineer uses. This outline guides
MODEL 3 MONO AMPLIFIER OWNER S MANUAL
 MODEL 3 MONO AMPLIFIER OWNER S MANUAL TABLE OF CONTENTS Introduction Features Unpacking Instructions Installation * Space requirements * A.C. connections Input Impedance Selection Adjustable Gain Signal
Mach 5 User s Manual Revision 2.2 1
 1 2 WARRANTY The Gentec-EO MACH 5 Meter carries a one-year warranty (from date of shipment) against material and/or workmanship defects, when used under normal operating conditions. The warranty does not
DXXX Series Servo Programming...9 Introduction...9 Connections HSB-9XXX Series Servo Programming...19 Introduction...19 Connections...
 DPC-11 Operation Manual Table of Contents Section 1 Introduction...2 Section 2 Installation...4 Software Installation...4 Driver Installastion...7 Section 3 Operation...9 D Series Servo Programming...9
VMS-4000 Digital Seismograph System - Reference Manual
 VMS-4000 Digital Seismograph System - Reference Manual This equipment should be installed, maintained and operated by technically qualified personnel. Any errors or omissions in data or it s interpretations,
FlatPack Ultrasonic Sensors
 FlatPack Ultrasonic Sensors Installation & Operation Guide May 23, 2017 The FlatPack Sensor product line listed in the introduction of this manual complies with the European Council EMC Directive 2004/108/EC
Medidores de vibración salida RS232 Datalogger VT-8204 LUTRON manual ingles
 English usermanual VT-8204 Vibration Tachometer Your purchase of this VIBRATION TACHOMETER marks a step forward for you into the field of precision measurement. Although this VIBRATION TACHOMETER is a
WE-525T Antenna Analyzer Manual and Specification
 WE-525T Antenna Analyzer Manual and Specification 1.0 Description This product is designed to speed and ease the testing and tuning of antenna systems. Graphical displays of SWR, Return loss, Distance
APPLICATION NOTE. Computer Controlled Variable Attenuator for Tunable Lasers. Technology and Applications Center Newport Corporation
 APPLICATION NOTE Computer Controlled Variable Attenuator for Tunable Lasers 30 Technology and Applications Center Newport Corporation Computer-Controlled Variable Attenuator for Tunable Lasers This application
ALM473 DUAL MONO \ STEREO AUDIO LEVEL MASTER OPERATION MANUAL IB
 ALM473 DUAL MONO \ STEREO AUDIO LEVEL MASTER OPERATION MANUAL IB6408-01 TABLE OF CONTENTS GENERAL DESCRIPTION 2 INSTALLATION 2,3,4 CONNECTION AND SETUP 4,5,6,7 FUNCTIONAL DESCRIPTION 8,9 MAINTENANCE 9
MD-5060 DIGITAL MEGOHMMETER
 DIGITAL MEGOHMMETER ( M98126501-03 / 04A ) TECHNICAL SPECIFICATIONS OPERATING INSTRUCTIONS DESCRIPTION The CIRCUTOR model MD-5060 digital electronic ohmmeter is a versatile, robust and easy-to-use equipment.
Compact Autoranging Clamp Meters. Models (400 A AC), (400 A AC/DC)
, (400 A AC/DC)") User Manual Compact Autoranging Clamp Meters with NIST-Traceable Calibration Models 20250-55 (400 A AC), 20250-56 (400 A AC/DC) THE STANDARD IN PRECISION MEASUREMENT 1065DGMAN_20250-55,-56 DS Clamp Meter
User Manual Compact Autoranging Clamp Meters with NIST-Traceable Calibration Models 20250-55 (400 A AC), 20250-56 (400 A AC/DC) THE STANDARD IN PRECISION MEASUREMENT 1065DGMAN_20250-55,-56 DS Clamp Meter
T25-35SA Subaudible Tone Decoder
 T25-35SA Subaudible Tone Decoder The Mueller Broadcast Design T25-35SA subaudible tone decoder provides a simple and reliable way to detect the 25 and 35 Hz control tones sent by many satellite-delivered
Signal Generators for Anritsu RF and Microwave Handheld Instruments
 Measurement Guide Signal Generators for Anritsu RF and Microwave Handheld Instruments BTS Master Spectrum Master Tracking Generator Option 20 Vector signal Generator Option 23 Anritsu Company 490 Jarvis
Lab 15: Lock in amplifier (Version 1.4)
") Lab 15: Lock in amplifier (Version 1.4) WARNING: Use electrical test equipment with care! Always double-check connections before applying power. Look for short circuits, which can quickly destroy expensive
Lab 15: Lock in amplifier (Version 1.4) WARNING: Use electrical test equipment with care! Always double-check connections before applying power. Look for short circuits, which can quickly destroy expensive
Metaphase ULC-2. Technologies ULC. Metaphase. Technologies Version 7.X August 2015 USER MANUAL. metaphase-tech.com. pg. 1
 ULC Version 7.X August 2015 USER MANUAL pg. 1 Overview Universal LED Controller () provides independent true constant-current or voltage control of two LED loads from 0.02 to 4 Amps continuous (DC) with
ADI-100 Interrupter. Operator s Manual. 526 S. Seminole Bartlesville, OK /
 ADI-100 Interrupter Operator s Manual 526 S. Seminole Bartlesville, OK 74003 918/336-1221 www.sescocp.com ADI - 100 Interrupter FEATURES Clock Accuracy 100% during GPS lock Clock Drift 30 µsec per degree
Model # PCYFC-10kW-250A PCYFC-20kW-250A PowerCycle Battery Conditioner Operation Manual
 Model # PCYFC-10kW-250A PCYFC-20kW-250A PowerCycle Battery Conditioner Operation Manual MAN-000014-00 REV. B TABLE OF CONTENTS SPECIFICATIONS... 1 CYCLER CONTROLS AND USER INTERFACE... 3 OPERATING PROCEDURE...
MM700. INSTRUCTION MANUAL Auto-Ranging Digital Multimeter True RMS
 INSTRUCTION MANUAL Auto-Ranging Digital Multimeter True RMS Measurement Technology MM700 DATA & RANGE HOLD LOW IMPEDANCE AUDIBLE CONTINUITY MIN / MAX / RELATIVE TEMPERATURE DIODE TEST CAPACITANCE & FREQUENCY
HP 33120A Function Generator / Arbitrary Waveform Generator
 Note: Unless otherwise indicated, this manual applies to all Serial Numbers. The HP 33120A is a high-performance 15 MHz synthesized function generator with built-in arbitrary waveform capability. Its combination
Fits Tiger 320 Series UNIVERSAL FREQ/COUNTER INPUT MODULE
 Fits Tiger 320 Series UNIVERSAL /ER INPUT MODULE Sensor. Magnetic, Namur, Source, Sink. De-coupling. 0.02 Hz high pass filter. Signal Type., (mv) or digital logic. Input Connector. Freq. Input (CH) Up/Down
USER S MANUAL Operating Manual SB Series Multi-Heads E-Series DM Series K Series
 USER S MANUAL Operating Manual SB Series Multi-Heads E-Series DM Series K Series 1. THIS IS AN INSTRUCTION FOR SAFE USE OF AUTOMATIC EMBROIDERY MACHINES. READ THOROUGHLY BEFORE USE. 2. CONTENTS IN THIS
IXIAN TM class V 1.5. EC Transmitter This is an evolving document. EC Transmitter IXIAN TM. Features
 class V 1.5 EC Transmitter This is an evolving document check back for updates. Features 4 20mA output Reads conductivity from 0.07µs to 100,000µs Accuracy +/- 2% Calibrate remotely through a PLC or directly
5008 Dual Synthesizer Configuration Manager User s Guide (admin Version) Version valontechnology.com
 Version valontechnology.com") 5008 Dual Synthesizer Configuration Manager User s Guide (admin Version) Version 1.6.1 valontechnology.com 5008 Dual Synthesizer Module Configuration Manager Program Version 1.6.1 Page 2 Table of Contents
5008 Dual Synthesizer Configuration Manager User s Guide (admin Version) Version 1.6.1 valontechnology.com 5008 Dual Synthesizer Module Configuration Manager Program Version 1.6.1 Page 2 Table of Contents
WaveAce 1000 and 2000 Oscilloscopes
 1000 and 2000 Oscilloscopes 40 MHz 300 MHz Key Features Sample rates up to 2 GS/s 1 Mpts/ch memory, 2 Mpts interleaved 7" color display on all models 32 automatic measurements Multi-language user interface
Instruction Notes for 108A L Sensor Input
 Operation Manual Instruction Notes for 108A L14-1800 Digital Control Module ON/OFF Main Power Switch Alarm Limits/ Cycle Switch Load Outlet (x2) General Description Sensor Input This temperature control
VBRC 5. Radio Communicator. Installer Manual
 VBRC 5 Radio Communicator Installer Manual 10 / 10 / 2013 CONTENT 1. INTRODUCTION...3 2. SYSTEM STRUCTURE...3 3. SYSTEM PROGRAMMING WITH PC SOFTWARE...5 4. TROUBLESHOOTING...6 5. FIRMWARE UPGRADE...7 6.
Digital Function Generator
 Digital Function Generator 13654-99 PHYWE Systeme GmbH & Co. KG Robert-Bosch-Breite 10 37079 Göttingen Germany Tel. +49 (0) 551 604-0 Fax +49 (0) 551 604-107 E-mail info@phywe.de Operating Instructions
Model 77 Series IV. Digital Multimeter. Users Manual
 Model 77 Series IV Digital Multimeter Users Manual Model 77 Series IV Digital Multimeter The Fluke Model 77 Series IV is a battery-powered, average responding-rms indicating multimeter (hereafter "the
MC450/MC650 (MC750) OPERATING INSTRUCTIONS
 OPERATING INSTRUCTIONS") MC450/MC650 (MC750) OPERATING INSTRUCTIONS MC 2 AUDIO Ltd., Units 6 & 7 Kingsgate, Heathpark Industrial Estate, HONITON, Devon EX14 1YG England Tel: ++(0)1404.44633 Fax: ++(0)1404.44660 www.mc2-audio.co.uk
MC450/MC650 (MC750) OPERATING INSTRUCTIONS MC 2 AUDIO Ltd., Units 6 & 7 Kingsgate, Heathpark Industrial Estate, HONITON, Devon EX14 1YG England Tel: ++(0)1404.44633 Fax: ++(0)1404.44660 www.mc2-audio.co.uk
English. Money Counter. Coin and banknote counter. DEUTsCH. Manual
 ITALIANO ESPAÑOL FRANçAIS NEDERLANDS English Money Counter DEUTsCH Coin and banknote counter Manual Money Counter for Coins and Banknotes Introduction Thank you for choosing the Money Counter series. The
Agilent U1273A/U1273AX Handheld Digital Multimeter. Quick Start Guide
 Agilent U1273A/U1273AX Handheld Digital Multimeter Quick Start Guide Verify that you received the following items in the shipment of your multimeter: One pair of red and black test leads One pair of 4
Alternate Button Functions
 Model ST-122 Owner's Manual Front Panel The front panel of the ST122 is shown below. The buttons have dual functions, selected the by Alt key in the lower right. The upper diagram shows the primary functions,
Contents 1. General instructions. 1.1 Precautions safety measures Protection mechanisms. 2. Description. 2.1 Instrument Familiarization. 2.
 Contents 1. General instructions. 1.1 Precautions safety measures... 1.2 Protection mechanisms. 2. Description. 2.1 Instrument Familiarization. 2.2 LCD Display 2.3 Keypad. 3. Function description. 3.1
MCU Software Configuration and System Calibration
 Analox Ltd. 15 Ellerbeck Court, Stokesley Business Park North Yorkshire, TS9 5PT, UK T: +44 (0)1642 711400 F: +44 (0)1642 713900 W: www.analox.net E: info@analox.net List of Contents 1 Introduction...
APX Mobile and Portable Automated Test and Alignment
 APX Mobile and Portable Automated Test and Alignment Software Updates First things first! Be sure to check that you are running the latest software versions for the 8800SX and its applications. Visit the
LYRA 501 USER S MANUAL
 LYRA 501 USER S MANUAL D O R A D O e n e r g y Belgrade, February 2005 1 GENERAL DESCRIPTION 1.1. IMPORTANT NOTICE 2 TECHNICAL SPECIFICATIONS CONTENTS 2.1. INPUT (MAINS) 2.2. OUTPUT 2.3. ENVIROMENTAL CONDITIONS
Installation and Operating Instructions. Power IT Power Factor Controller RVC
 Installation and Operating Instructions Power IT Power Factor Controller RVC Table of contents Page 1. Read this first... 3 About this Instruction Manual... 3 Safety... 3 Electromagnetic compatibility...
ServoDMX OPERATING MANUAL. Check your firmware version. This manual will always refer to the most recent version.
 ServoDMX OPERATING MANUAL Check your firmware version. This manual will always refer to the most recent version. WORK IN PROGRESS DO NOT PRINT We ll be adding to this over the next few days www.frightideas.com
Suitable firmware can be found on Anritsu's web site under the instrument library listings.
 General Caution Please use a USB Memory Stick for firmware updates. Suitable firmware can be found on Anritsu's web site under the instrument library listings. If your existing firmware is older than v1.19,
UCE-DSO210 DIGITAL OSCILLOSCOPE USER MANUAL. FATIH GENÇ UCORE ELECTRONICS REV1
 UCE-DSO210 DIGITAL OSCILLOSCOPE USER MANUAL FATIH GENÇ UCORE ELECTRONICS www.ucore-electronics.com 2017 - REV1 Contents 1. Introduction... 2 2. Turn on or turn off... 3 3. Oscilloscope Mode... 3 3.1. Display
Earth 2/3 MI 2126 Instruction Manual Version 1.0, Code No
 Earth 2/3 MI 2126 Instruction Manual Version 1.0, Code No. 20 750 190 Distributor: Manufacturer: METREL d.d. Ljubljanska cesta 77 1354 Horjul Slovenia web site: http://www.metrel.si e-mail: metrel@metrel.si
audionet amp II G2 Owner's Manual Mono - Amplifier
 audionet amp II G2 Mono - Amplifier Owner's Manual Owner's manual The Audionet-Team would like to congratulate you to purchasing the Audionet AMP II G2! Your Audionet AMP II G2 is designed for absolutely
TV SIGNAL LEVEL METER USER MANUAL
 TV SIGNAL LEVEL METER USER MANUAL - 0 - 1. Overview (1) (1) RF input (2) (3) A D E B C (2) Speaker (3) LCD display (4) Charger indicator (5) RS232 communication port (6) DC-IN port F G A. The battery icon
SMART TWEEZERS Model ST-1 User s Manual Version 1.0
 SMART TWEEZERS Model ST-1 User s Manual Version 1.0 Patent Pending TABLE OF CONTENTS Notice The contents of this document is believed to be accurate, but is not guaranteed by Excelta Corporation. The information
PULSAR-EQUAL v 1.10 Art.No.: 1126
 PULSAR-EQUAL v 1.10 Art.No.: 1126 10.12.2011 The Pulsar-EQUAL is a professionally designed and built, micro processor controlled balancer/equalizer and tester. The Pulsar-EQUAL is able to equalize the
Micromate User Manual
 Microcoin Table of Contents Page Essential Information 2 1.0 Connection and Configuration 3 1.1 Connection 3 1.2 Switch On 4 1.3 Configuration for Use 4 2.0 Check the Configuration of a Validator 5 2.1
The Interfit S1. AC/DC Powered TTL/HSS Flash. Instruction Manual.
 The Interfit S1 AC/DC Powered TTL/HSS Flash Instruction Manual www.interfitphotographic.com Interfit S1 Battery Powered TTL/HSS Flash Unit What s cool about the Interfit S1? The S1 is the world s first
Changes or modifications not expressly approved by the party responsible for compliance could void the user's authority to operate the equipment.
 WARNING: This equipment generates, uses and can radiate radio frequency energy and, if not installed and used in accordance with the instruction manual, may cause interference to radio communications.