Technology, Workforce and the DFW Business Climate: A Review and Critique of Recent Assessments
|
|
|
- Leon Cannon
- 5 years ago
- Views:
Transcription
1 Technology, Workforce and the DFW Business Climate: A Review and Critique of Recent Assessments Prepared for the North Texas Commission By Bernard L. Weinstein, Ph.D. and Terry L. Clower, Ph.D. Center for Economic Development and Research University of North Texas P.O. Box Denton, TX January 2000
2 Executive Summary Preparing rankings and ratings of states, metropolitan areas and cities has become a major undertaking by the media, business groups, consulting firms, and non-profit organizations. Nearly every week, it seems, an article appears in a newspaper or magazine titled The Best States for Business or The Best Places to Live. Though most of the studies and surveys comparing states or cities are based on subjective evaluative criteria, they nonetheless receive widespread attention in the domestic and international press and often focus attention on a particular state, city or metro area. Texas and the Dallas-Fort Worth Metroplex are fortunate in that we generally score high in these surveys. For instance, in December 1999 Dallas was designated the Best North American City for Business by Fortune Magazine. In January 1999, a survey conducted by Plant Sites and Parks identified Texas as the most desirable state for new manufacturing facilities. The North Texas Commission retained the University of North Texas Center for Economic Development and Research to summarize, evaluate and critique 18 business climate and quality of life surveys that were released in In particular, we were asked to identify data or perceptions from theses studies that might be helpful to the Commission in formulating strategies for either capitalizing on the region s assets or dealing with its shortcomings. Recognizing that the Metroplex is part of Texas, and that perceptions of the state business climate may influence the prospects for DFW, we first evaluated five state-tostate comparisons prepared by national organizations. In terms of business vitality, Texas
3 scores high in several surveys and is also deemed well-positioned to capitalize on the New Economy. However, two studies fault the state for its human capital deficiencies, especially as regards educational attainment levels, its deteriorating air quality, and its slowness in bringing technology into the classroom. In the 12 city-to-city comparisons, Dallas and/or the DFW region receive high marks in most cases. Forbes Magazine ranks Dallas the 3 rd best business location in the U.S. while Fortune ranks us number one. Sprint Business concludes the Dallas metropolitan area is the most productive in the country while PricewaterhouseCoopers ranks DFW fifth in the nation for internet venture capital. The Metroplex ranks 6 th in the nation in terms of internet penetration, and the Milken Institute rates Dallas as the second strongest Tech-Pole in the nation, after San Jose, due to the high concentration of information technology industries in both manufacturing and services. The surveys and studies reviewed in this report paint a predominantly positive picture of the Metroplex and its preparedness for the new millennium. Among the nation s largest urbanized regions, DFW can boast the strongest, most diversified and most promising economy because of our broad range of fast-growing and competitive industries. Still, there are two puzzling dimensions to these studies. First, what factors cause Austin to score higher than Dallas or Dallas-Forth Worth on many of the rankings? Is Austin doing something the Metroplex isn t? Probably not. Austin is really a startup economy, which is now just coming into its own. It s much easier for a relatively small community to post high growth rates than a larger one. Though Austin s percentage gains in population, employment, high-tech startups and the like have been impressive, in absolute numbers the Dallas-Forth Worth area overwhelms Austin. 2
4 The second puzzling dimension to these surveys is Fort Worth s frequently lower rankings relative to Dallas. We believe the separation of the two intertwined metro areas in most of the studies reviewed below makes absolutely no economic sense. Tens of thousands of Metroplex residents commute between Dallas, Fort Worth and their suburbs each day for work, shopping, recreation and air travel. If Dallas is the best city in North America for business, then Fort Worth must be too. Like other major metropolitan regions, the Metroplex faces many problems and challenges, including under-performing public schools, rising traffic congestion, deteriorating air quality and maintaining a skilled workforce. These are all issues that must be addressed if the region is to continue prospering. In particular, we must ensure that the region s human capital, as well as its physical infrastructure, is maintained and improved. The twin problems of worker shortages and workforce training demand renewed attention, and resources must be made available to meet these and other challenges facing the Metroplex in the 21 st century. 3
5 I. Introduction Over the past year, a number of research institutes and private firms have released a bewildering array of surveys and studies purporting to rank states, metropolitan areas and cities in terms of their quality of life or business vitality. Each of these reports has been publicized in the local and national media, and several have received widespread attention in the international press. In some of these studies, the state of Texas and the Dallas-Fort Worth Metroplex rank very high, but in others our region does not score favorably compared with other metropolitan areas. Some of the surveys and studies are based solely on impressions; i.e., how does a group of respondents feel about the livability or business climate of a state or city. Others claim to be more objective i.e., they base their rankings on measurable indicators. In some cases, the ranking of Texas or the Metroplex is clearly a function of the types of questions asked. Whether or not these studies attract or discourage companies from locating or expanding in Texas and the Metroplex is unknown, and perhaps even unknowable. But a more important issue for the North Texas Commission and other area business leaders is whether they contain information or perceptions that may be helpful in either capitalizing on the region s assets or dealing with its shortcomings. To that end, we have reviewed and critiqued 18 of these studies and surveys with an eye towards determining, on balance, what they tell us about the comparative strengths and weaknesses of Texas and the Metroplex. And because quality of life is often included as an element in a state or region s business climate, we have examined both types of studies. 4
6 II. State-to-State Comparisons Because the Dallas-Fort Worth is the largest and most dynamic metropolitan area in the state of Texas, perceptions and evaluations of Texas are important to the region. Thus, we begin our assessment by looking at several studies that compare states in terms of business climate and quality of life. A. Plant Sites and Parks Annual Survey of the Most Favored Business Locations PS&P is a monthly magazine mailed to industrial location specialists, and it derives its revenues from ads placed by state and local economic development agencies. The magazine s focus is manufacturing, warehousing and distribution. Each January, it publishes a special Hot Spots issue that rates state business climates. Actually, PS&P prepares two rankings: one based on new facilities and expansions during the previous year and another based on a readers survey. In the January 1999 New Facilities survey, Texas was ranked 6 th in the nation behind Michigan, New York, North Carolina, Ohio, and California (see Table 1). A new facility is defined as one creating 20 or more jobs, utilizing a minimum of 20,000 square feet of new space, or entailing a capital investment of at least $1 million. In the Reader s Choice survey, which is based on a telephone interviews with a sample of PS&P subscribers, Texas was ranked number one in the country. The Reader s Choice survey asks respondents where they would locate if they were to choose a site for a new project. PS&P argues the survey is a leading indicator of future investment behavior. 5
7 In essence we have two rankings, one objective and one subjective, which paint Texas in a positive light as a business location. In fact, Texas has been among PS&P s top ten for the past decade. 1 B. Site Selection Magazine s State and Metro Scoreboard Each year, Site Selection Magazine publishes an industrial expansion scoreboard. This is a simple count of the number of new facilities and expansions in each state, and it naturally tends to favor the largest ones. In 1998, Texas, with 926 new manufacturing facilities or expansions, ranked 6 th in the nation behind Michigan, California, Ohio, North Carolina and New York (see Table 2). Among the nation s metro areas, Dallas ranked number nine. In its report, Site Selection calls Dallas the Lone Star State s hot spot. By this measure, it would appear that Texas the nation s second most populous state isn t attracting its fair share of new manufacturing businesses. But the survey probably isn t counting small businesses, software companies, and start-ups that have been so important in the state s economic growth. The Dallas ranking would seem about right, since the Metroplex is the nation s ninth largest metropolitan area. C. CFED Development Report Card for the States For more than ten years, the Corporation for Enterprise Development in Washington, DC has published an annual economic report card grading the various states on a number of benchmarks. The CFED is a non-profit organization, though much is its financial support comes from organized labor. It uses a wide range of economic, demographic and social statistics in calculating its grades, and these are grouped into subcategories each of which received a grade. The CFED then assigns three final grades 1 The January 2000 issue, released after this study was completed, rated Texas #1 in the readers survey and #5 in new facilities. 6
8 in the following categories: (1) performance, (2) business vitality, and (3) development capacity. In their just-released 1999 report, Texas received an F in performance, a B in business vitality, and a C in development capacity (see Table 3 and Figure 1). The F in performance was based on the following criteria: Despite ranking 8 th in the nation in job growth and 1 st in wage growth, Texas recorded comparatively high unemployment (35 th ), a high number of layoffs (49 th ), poor employer health coverage (43 rd ), large numbers of working poor (46 th ), and high poverty (43 rd ). Texas also ranked near the bottom on a number of social indicators. Texas B grade for business vitality was based in improved competitiveness, new capital investment, a large number of fast-growing companies, and the secondhighest number of IPOs in the nation. But the state ranked 41 st in new business job growth. The grade of C awarded for development capacity supposedly reflects Texas future potential for economic and social development. The CFED finds the state s math and reading proficiencies relatively high (5 th and 15 th ) but marks us down for high school graduation rates (43 rd ) and educational attainment levels (47 th ). Texas also ranks low in its digital infrastructure (40 th ) and in its air quality (44 th ). Top performers in the CFED report card are listed alphabetically in Table 4 with the top-performing states, Colorado and Utah, receiving straight As. According to CFED, what boosts these states grades is a reduction in income inequality, improvements in job quality, attention to sustainable development and the environment, and an abundance of innovation assets. 7
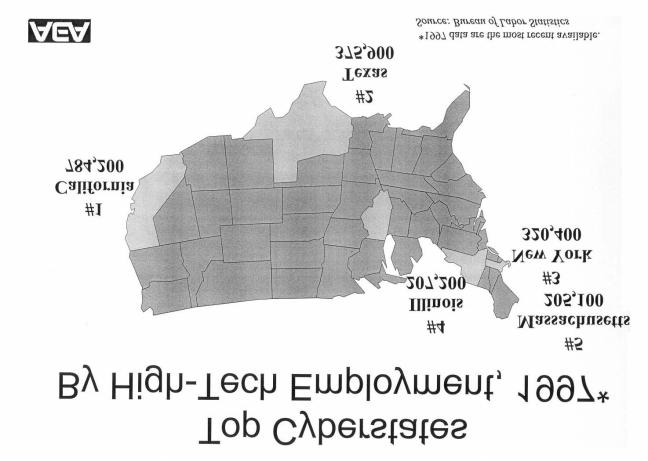
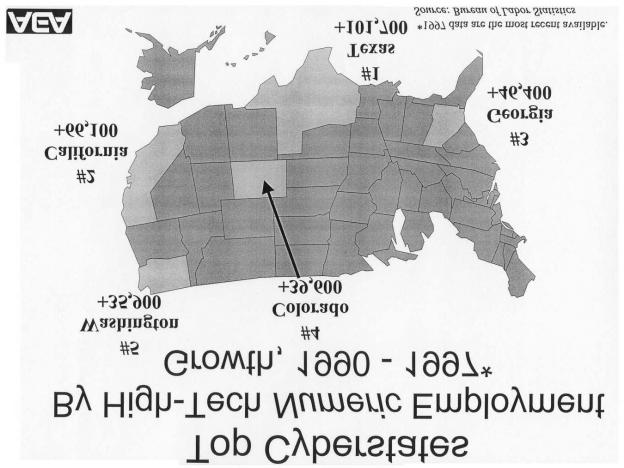
9 Though the CFED has been preparing state report cards for many years, this is not a widely read or widely disseminated publication. And it certainly doesn t appear to be influencing the flow of capital and entrepreneurial talent among the states. Nonetheless, it does highlight some of Texas endemic human capital deficiencies, which are slowly being addressed by the state s business and political leadership. As with the rest of Texas, the Metroplex needs to improve the graduations rates and skill levels of its young residents because they represent the bulk of tomorrow s workforce. Improving air quality is another challenge facing the Metroplex. The consequences of not doing so have been well publicized. D. American Electronics Association Cyberstates and Cyber Education Reports August of 1999, the American Electronics Association (AEA) released two reports dealing with the status and outlook for high-tech industries in the United States. It found that high-tech industries employed nearly 5 million workers and that the ranks of cyberworkers had increased by more than 1 million in the previous five years. Texas ranked second to California in the number of high tech-jobs and was the second fastest growing state in high-tech employment after Georgia (see Table 5 and Figure 2). Significantly, Texas ranked first in the number of new high-tech jobs between 1990 and 1997, gaining nearly twice as many as California (see Table 6 and Figure 3). Within the state of Texas, Dallas was by far the leader in high-tech employment, though Austin s growth rate has been more than three times that of Dallas (see Table 7). Still, in 1996 Dallas could boast three times as many high-tech jobs as Austin. Texas and Dallas-Fort Worth appear quite competitive when high-tech salaries are compared with those paid in other states and cities (see Tables 8 and 9). Texas boasts the 8
10 lowest average hi-tech wages among the large Cyber States, and Dallas and Fort Worth salaries are well below the averages paid in San Jose and Boston. The competitive wage structure is no doubt one reason hi-tech firms have flocked to Texas and the Metroplex. In its Cyber Education report, the AEA expresses concern at the slow growth in the number of high-tech degrees being earned in engineering, science, and businesses information systems. Nationally, high-tech degrees awarded fell five percent between 1990 and In Texas, by contrast, the number of degrees awarded increased eight percent during the same period (see Table 10). But the number of high-tech jobs grew 25 percent during the same period. What s more, interest among undergraduates in pursuing technical degrees is slipping, which does not bode well for the long-term. Because the Metroplex is the epicenter of Texas information technology industries, we need to be concerned about future shortages of degreed technology workers. The North Texas Commission has already recognized this problem as is working with local universities and other training institutions to upgrade the education and skill levels of the local workforce and to build bridges to area industries. E. The State New Economy Index In July 1999, the Washington-based Progressive Policy Institute issued a report examining the various states postures with reference to the so-called New Economy. The New Economy is defined as a knowledge and idea-based economy where the keys to wealth and job creation are the extent to which ideas, innovation, and technology are embedded in all sectors of the economy. The report identifies 17 key indicators that are divided into five categories that capture the parameters of the New Economy: 9
11 1. Knowledge jobs. Separate indicators measure jobs in offices; jobs held by managers, professionals and technicians; and the educational attainment of the workforce. 2. Globalization. These indicators measure the export orientation of manufacturing and foreign direct investment. 3. Economic dynamism and competition. Here the focus is on the number of jobs in fast-growing companies (those with sales growth of 20 percent or more for four straight years); the rate of economic churn (a product of new business start-ups and existing business failures); and the value of initial public stock offerings (IPOs) by companies. 4. The transformation to a digital economy. This category includes such measures as the percentage of adults online; the number of dot.com domain name registrations; technology in schools; and the degree to which state and local governments use information technologies to deliver services. 5. Technological innovation capacity. These indicators include the number of high-tech jobs; the number of scientists and engineers in the workforce; the number of patents issued; industry investment in research and development; and venture capital activity. 2 Overall, Texas ranks number 17 among the 50 states, a curious result considering the state added more high-tech jobs than any other during the 1990 to 1996 period (see Table 11 and Figure 4). We score high in such items as export focus in manufacturing 2 The authors use a convoluted methodology to generate scores for each state upon which the rankings are then based. Each state s final score in each category is expressed as a percentage of the total score a state would have achieved if it had finished first in every category. In addition, the indicators are weighted so that closely correlated ones don t bias the results. 10
12 (#4), venture capital (#9) and high-tech jobs as a share of total employment (#11) (see Table 12). But Texas overall rank is pulled down by managerial, professional and technical jobs as a share of the total workforce (#47), scientists and engineers as a percent of the workforce (#33), digital technology in state government (#31), private sector R&D (#26), and technology in schools (#25). Some of these measures of new economy readiness are questionable, and the DFW region by itself would probably score much higher in such a ranking. For example, according to the U.S. Bureau of Labor Statistics, managerial, technical and professional workers comprise 23.5 percent of the DFW workforce, which is comparable to the national average. Still, the study suggests several areas deserving attention by the region s business and political leadership, particularly with reference to technology in the classroom and boosting DFW s R&D activities. III. City-to City Comparisons Ranking cities and/or metropolitan areas in terms of business climate or quality of life has become a popular pastime. There are literally dozens of comparisons made annually by the media, business groups, consulting firms, university research centers and other groups purporting to show that some place is better or worse than some other place based on selected criteria. As with the state-to-state comparisons, many of these evaluations are either highly subjective or extremely arbitrary in terms of the indicators that are compiled. A dozen of the most prominent ones are discussed below. 11
13 A. Forbes Magazine Best Places to Live In its May 31, 1999 issue, Forbes Magazine ranked the nation s 162 biggest metropolitan areas with a focus on jobs and business. The following criteria were used to come up with the rankings: 1. Average wage and salary increase 1993 to to 1997 average wage and salary increase vs. the average 1993 to 1997 increase to 1998 job growth rate to 1998 job growth vs. average 1993 to 1998 rate. 5. Number of technology clusters in 13 different areas. 6. Overall concentration of technology activity relative to national average. 7. Technology output growth 1990 to Technology output growth 1996 to Using these measures, Dallas was ranked the 3 rd best business location in the country after Seattle and Austin (see Table 13). Fort Worth-Arlington came in 35 th. Not surprisingly, all of the top choices in the Forbes calculation are located in the Sunbelt. The worst cities are found mainly in the Northeast and Midwest. B. Sprint Business Most Productive Cities in America In January 1999, Sprint Business released a study on the most productive cities (metropolitan areas) in the country. Dallas came in first among the 313 MSAs examined, followed by San Francisco, San Jose, Houston and Atlanta. Fort Worth-Arlington was ranked 20 th (see Table 14). Eight criteria were used for determining each metro area s productivity index: 12
14 1. Employment rates. 2. Growth rates in population and employment. 3. Average real per capita income adjusted for the cost of living in metropolitan areas. 4. Educational attainment and workforce training. 5. Output per worker. 6. Business sector diversity, including growth of business establishments; earnings differences between manufacturing and services sectors; and earnings per capita and growth rates for each sector. 7. Per capita income and earnings growth rate. 8. Air transportation accessibility. Dallas top ranking in the Sprint survey was based on the area s diverse and vibrant economic climate, including a 17 percent growth in the number of business establishments in recent years. Dallas also scored well because of the presence of fastgrowing industries in technology, communications, professional services, banking and financial services. The Dallas metro area ranked highest among the top five most productive cities in terms of per capita income and employee earnings growth. Dallas skilled workforce and transportation infrastructure also helped it achieve the number one ranking in the Sprint survey. C. Outlook Magazine Top Choice Cities Outlook Magazine, published in Dallas by World Economic Development Alliance a business location consulting firm is mailed six times a year to CEOs and senior level executives around the world. It has a circulation of about 30,000. Each year, 13
15 it publishes a list of the top 25 top cities for business expansion or relocation. Top Choice Cities are those which surpass threshold levels for a number of variables. Outlook considers factors such as quality of life, cultural amenities, work force availability, crime and public safety, job creation, pro-business attitudes, taxes, transportation and educational opportunities. Dallas-Fort Worth was among the 25 cities selected in a January 1999 survey. The predominance of high-tech companies, a large health care industry, short commutes, DFW Airport, and a wide array of culture venues were the factors cited in the DFW write-up. In November 1999, another survey was published in which Dallas and Fort Worth weren t even mentioned (see Table 15). A call to the publisher revealed that the magazine had changed its weighting criteria and was now putting more emphasis on crime and traffic congestion. Dallas and Fort Worth didn t make the cut because of comparatively high crime rates and worsening traffic. For that matter, no other large cities made the November 1999 list either. D. P.O.V. s Best American Cities to Start a Business P.O.V. Magazine is a guidebook for young professional men and has a circulation of about 300,000. Its focus is more on style and sex than business, but each year it publishes a list of the best cities for business startups. The criteria for selection include coolness and quality of life, whatever that means, and general business concerns. Of the 75 cities selected, Dallas-Fort Worth was ranked number 12 while Austin came in second (see Table 16). The publication provides no further description of the methodology employed to rate the cities. 14
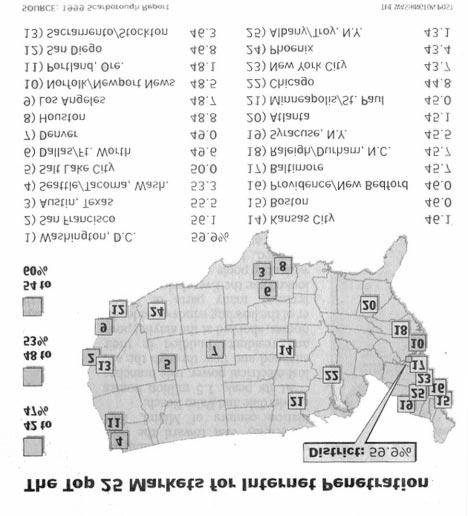
16 E. PricewaterhouseCoopers Money Tree Survey PricewaterhouseCoopers publishes a quarterly survey of venture capital invested in internet-related companies. Since 1997, Dallas-Fort Worth has ranked fifth in this survey behind Silicon Valley, New York City, Los Angeles/Orange County and Austin (see Table 17). The only surprise in this ranking is that Austin, which is one-fifth the size of the Metroplex, is attracting nearly twice as much venture capital for internet startups. Because DFW is a major financial, technology and trading center, the region is well-positioned to exploit the economic potential of the internet. As more and more business-to-business and business-to-consumer commerce is conducted over the internet, venture capitalists and other investors should become even more focused on the Dallas- Fort Worth region. F Scarborough Report Scarborough Research of New York, a service of the Arbitron Company, conduced a survey of internet usage among 170,000 adults in 64 major markets between February 1998 and February In October 1999, they released the survey of the Top 25 Markets for Internet Penetration, and Dallas-Fort Worth came in 6 th with a 49.6 percent adult penetration rate (see Figure 5). Washington, D.C. was first, followed by San Francisco, Austin, Seattle/Tacoma, and Salt Lake City. There are no real surprises in this ranking, though again Austin beats out DFW. The Metroplex is currently one of the nation s most wired communities, and given the area s industrial structure, we re likely to stay ahead of the pack. 15
17 G. The Wall St. Journal s 13 Hottest Places on the New High-Tech Map A series of lengthy articles in the November 23, 1999 issue of the Wall St. Journal identified and discussed the 13 hottest high-tech regions in the U.S. The Journal did not rank the 13 regions but simply listed them with witty names like Billville for Seattle- Redmond and Roboburgh for Pittsburgh. Perhaps fortunately, they were unable to come up with a clever appellation for the Metroplex, so we just appear as Dallas though the article mentions Ft. Worth as well (see Figure 6). In citing Dallas as one of the nation s hot spots for high-tech, the Journal mentions semiconductors, telecommunications, defense electronics, computer services, and entertainment software as well as Dallas being the home of the first internet broadcaster. The recent jump in venture capital flowing to the Metroplex is also mentioned. However, the article also makes the point that in the first half of 1999, Austin accounted for more high-tech investment than Dallas and Houston combined. H. Cushman & Wakefield Best Cities to Work Cushman & Wakefield is a New York-based real estate services firm. In November 1999, they released the results of survey in which 2,000 professionals and top executives with college degrees were asked to name the city where they d most like to work. Of the 20 cities studied, Dallas came in 8 th and Houston 13 th (see Table 18). Denver came in first and Detroit last. In terms of recreational and leisure resources, Dallas was ranked in the first tier of cities. Dallas was also cited, along with New York and Chicago, as a preferred location for marketing, finance and business services. 16
18 I. Money Magazine Best Places to Live In November 1999, Money Magazine published its annual ranking of best places to live. San Francisco was named the best big city and Rochester, Minnesota the best small city. Runners-up were New York, Boulder, Austin and Columbia, Missouri. In addition, Money rated the nation s 300 largest metropolitan areas and posted the results on their website: Once again, Austin is reviewed more favorably that Dallas in a national survey that is highly publicized. It was picked as one of the six best places to live because of its rapid job growth, low unemployment rate, and affordable cost of living as well its cultural and recreational amenities. Table 19 compares San Francisco, Austin and Dallas on each of the factors ranked by Money. In addition to economic performance, Austin beats out Dallas on air and water quality and also shows lower crime rates. Commutation times and median housing costs are more favorable in Austin, while the overall cost of living is marginally lower. Dallas outranks Austin in arts and culture, professional sports, and municipal bond rating. It bears keeping in mind that the Money ranking is not an assessment of an area s business climate but, rather, factors that are deemed important to educated professionals when assessing the desirability of communities. Dallas as the perennial runner-up to Austin should also be viewed skeptically because of a number of unique factors. Austin is really a start-up economy, which is just now coming into its own. What s more, it s much easier for a small community to post high growth rates than a larger one. Though Austin s percentage gains in population, employment, high-tech start-ups and the like 17
19 have been impressive, in absolute numbers the Dallas-Fort Worth Area is much larger and showing very robust growth. J. Fortune Magazine s Best Cities for Business Since 1989, Fortune Magazine has prepared an annual ranking of the Best Cities for Business. Dallas-Fort Worth was ranked number one in 1989, when the Fortune survey began, and remained in the top 10 in 1990 and Absent from the list from 1992 through 1994, DFW reappeared in 1995 and In 1997 and 1998, DFW didn t make the cut. (Austin came in first in 1998). But this year ten years after receiving its last crown Dallas was once again designated the Best City for Business in the U.S. (see Table 20). Fortune worked in partnership with the Business Location Practice of Arthur Andersen in compiling the annual list of best cities. Andersen relied on three sources for evaluating cities: (1) a survey of business executives worldwide; (2) a survey of economic development organizations for 160 cities, and (3) independent research done by Andersen. The information was analyzed to select cities that satisfied critical businesslocation needs, in particular the ability to recruit and retain managerial and professional talent. Fortune made the final ranking decisions, incorporating the results of Arthur Andersen s work with information and analysis supplied by writers and researchers. Fortune cited Dallas infrastructure, including DFW Airport, the region s comparatively low cost of living, civic and cultural activities, and a rapidly growing economy in selecting it as the top North American city for business. The article also mentions that Dallas has more restaurants per capita than New York City. According to 18
20 Fortune s editors, this year s evaluations considered Ft. Worth separately from Dallas, and that city did not make the top ten. Being designated number one by Fortune is a signal achievement, mainly because of the wide-ranging (and free) publicity the area will receive over the next year. But like all such surveys and studies, this one has serious flaws. First, how can Dallas be the best and Fort Worth not make the list, when we re all part of the same economy? Second, how can the Metroplex not even make the top-ten list in 1997 and 1998 and yet jump to number one in 1999? Have we had an amazing turnaround in the past year? The fact is, the regional economy was actually growing faster in 1998 than in Third, the Fortune editors change their evaluation criteria somewhat every year. In sum, the Fortune survey tells us what we already know that the Metroplex is one of the most dynamic major metropolitan economies in the world with a fine airport, a hospitable climate, and lots of good restaurants. It doesn t tell us what we need to do to keep the economy humming and the quality-of-life improving in the decades to come. K. Milken Institute Tech-Pole Ranking The Milken Institute is a privately-funded economic policy think tank in Santa Monica, California. In July 1999, the Institute published a study entitled America s High-Tech Economy: Growth, Development and Risks for Metropolitan Areas. The report argues that the high-tech sector is boosting the long-term potential growth trajectory of the U.S. economy and is also determining the relative success of metropolitan areas around the country. Table 21 lists the industries defined as hightech in the Milken report. 19
21 The study ranks all of the nation s 315 metropolitan areas on three different scales: (1) the value of high-tech output as a share of total output in a metro area relative to the same percentage for the United States. This ratio is called the location quotient; (2) the percentage of the nation s total high-tech output coming from that particular metropolitan area; and (3) the metro area s growth in output of high-tech industries as compared to the national growth rate in high tech between 1990 and Both Dallas and Fort Worth-Arlington rank favorably on the three scales (see Tables 22, 23 and 24). By the relative share, or location quotient measure, Dallas ranks #18 and Fort Worth #64. On the percent of national real output measure, Dallas ranks #6 and Fort Worth #34. Using the high-tech growth rate measure, Dallas ranks #26 and Fort Worth # 130. The Institute then calculates a Tech-Pole ranking by combining the location quotient with the share of national high-tech output in a multiplicative fashion. These areas are Tech-Poles in the sense of the relative technology gravitation pull they exert. By the composite measure, Dallas ranks as the second strongest Tech-Pole in the nation after San Jose (Silicon Valley) (see Table 25). Dallas diversified high-tech base seven industries out of a possible 14 are more concentrated than the national average coupled with the presence of six of the nation s 20 largest telecommunication services companies helped the region achieve the next-to-the highest ranking as a Tech- Pole. What s more, as the report points out, Dallas remains the center of Texas electronic components industry, with 4,200 more workers than Austin and output more than 20 percent greater than Austin s. Fort Worth-Arlington came in 41 st in the Tech- Pole rankings. 20
22 Of all the studies reviewed in this report, the Milken Institute s is without doubt the most objective because it is based entirely on quantitative measures. It is not a business climate study or a quality of life study; instead, it makes the indisputable case that high-technology drives the DFW economy. This is the same conclusion reached in an independent study conducted by the UNT Center for Economic Development and Research for the North Texas Commission two years ago. The Milken report is also useful because it conveys a plethora of information about the structure of the Metroplex economy and how we compare with our principal high-tech competitors. There is a sobering side to the Milken Institute study as well. The authors point out that high-tech industries, especially those engaged in manufacturing, are among the most volatile in the economy. Metropolitan economies dominated by the technology sector may experience other dislocations such as: (1) widening income disparities along educational attainment levels, (2) lower job security and job tenure, and (3) a higher probability of unemployment among workers in their 50s. In short, having a high-tech economic base doesn t mean a region will be insulated from a national business downturn. A simulation conducted as part of the Milken study found that among the 15 top Tech Poles, San Jose would have the greatest exposure to a future recession (see Table 26). Dallas, with a greater share of its high-tech employment in the service sectors, would be less exposed to a future recession. The Milken report concludes with a discussion of the factors that matter in the inception, growth and fortification of regional high-tech industries (see Table 27). Not surprisingly, skills, education and training along with research institutions are 21
23 considered critical variables in the high-tech growth formula. Less important factors include transportation and proximity to markets. Finally, the report argues against a heavy hand of government intervention in regional high-tech development: State and local governments, public policies, and the interaction between private and public sectors are crucial for the genesis, the expansion, and the fortification phases of high-tech development. Nonetheless, due to the unique characteristics of high-tech industries, government s role is also limited. Overly active government intervention and public policy may be counterproductive and harmful to the long-term development of high-tech industries. L. Cognetics Startup Business Rankings Cognetics, Inc. is a Cambridge, Mass. research and consulting firm. For years, they have published an annual ranking of the best cities for starting and growing a new business. Cognetics bases its rankings on data from Dun & Bradstreet showing the birth and growth rates of small businesses in recent years. Of the 50 large metropolitan areas analyzed in 1999, Dallas-Fort Worth was ranked number 9 (see Table 28). Cognetics conducted a second ranking of 25 smaller metropolitan areas, and Austin came in number two behind Las Vegas. Cognetics says the best locales for entrepreneurs require dynamic universities, ample skilled labor, a major airport, and a good quality of life. They point out, however, that only about two percent of rapidly growing small companies make high-tech products. IV. Conclusion The surveys and studies reviewed above paint a generally positive picture about the economy of the Metroplex and its preparedness for the new millennium. Among the 22
24 nation s largest urbanized regions, DFW arguably boasts the strongest, most diversified, and most promising economy because we are fortunately endowed with a broad range of fast-growing and competitive industries, especially in the information technology sector. Entrepreneurial activity is strong and venture capital increasingly available. What s more, as the Milken Report points out, we appear to have the right stuff for prospering in the high-tech new economy. One puzzling dimension to these studies is why Austin generally scores higher than Dallas or Dallas-Fort Worth. Certainly, Austin has received lots of hype and attention in recent years with the growth of Dell, Motorola and other high-tech companies in the region. And Austin is a nice place to live, with easy access to recreational amenities and a new, modern airport. But is Austin doing something the Metroplex isn t? Are there lessons to be learned from the Austin experience that can enhance the prospects for high-tech development in DFW? Probably not. As discussed above, Austin s explosive growth is partly a consequence of its relatively small size. DFW s growth rates may trail Austin s, but the Metroplex overwhelms Austin in terms of the absolute numbers of high-tech workers and the total economic impact of the information technology sector. The DFW economy is booming, the region continues to attract and nurture new industry both high-tech and traditional and the business outlook remains extremely positive for at least the next decade. What about Fort Worth, which seems to lag behind Dallas in most of the ratings and rankings? The separation of the two metro areas for descriptive or analytic purposes makes no economic sense. Tens of thousands of Metroplex residents travel each day 23
25 from one MSA to the other for work, for shopping, and for recreation. If Dallas is the best city in North America for business, then Ft. Worth is too! Like other large metropolitan regions, the Metroplex faces many problems and challenges, including under-performing public schools, rising traffic congestion, and deteriorating air quality. These are all issues that must be addressed forthrightly if the region is to continue along its growth trajectory. In particular, we must ensure that the region s human capital, as well as its physical capital, is maintained and improved. The twin problems of worker shortages and workforce training must receive renewed attention. Finally, the Metroplex s business and political leaders must join forces with leaders in other regions to counter the nation s drift toward protectionism and antiglobalism. The recent failure of the World Trade Organization to agree on an agenda for future talks on further liberalizing trade does not bode well for export-oriented economies like that of the Metroplex. A slowdown in world trade, more than any other development, stands the best chance of de-railing DFW s economic engine. 24
26 TABLES AND FIGURES
27 Top States Reader s Choice Bizsites Monitor Sept. Oct Survey 10/1/97 6/30/98 1. Texas 1. Michigan 2. California 2. New York 3. North Carolina 3. North Carolina 4. Georgia 4. Ohio 5. Pennsylvania 5. California 6. Arizona 6. Texas 7. Tennessee 7. Florida 8. Illinois 8. Virginia 9. South Carolina 9. Tennessee 10. Michigan 10. Georgia 11. Ohio Pennsylvania 12. Florida Table 1 Source: Plant Sites & Parks
28 Table s Top 10 States New Facilities/Expansions 1. Michigan 1, California 1, Ohio 1, North Carolina 1, New York 1, Texas Virginia Illinois Florida Minnesota 402 Source: Site Selection Magazine Online
29 Table Report Card Grades Business Vitality Grade Development Capacity Grade Performance State Grade Alabama D C C Alaska C F D Arizona D C C Arkansas D D F California D A A Colorado A A A Connecticut A B B Delaware B A B Florida D C C Georgia C C C Hawaii D F C Idaho C C D Illinois C A B Indiana B C C Iowa B D B Kansas B B C Kentucky C C D Louisiana F C F Maine A C D Maryland C A A Massachusetts B A A Michigan B B B Minnesota A B A Mississippi F D F Missouri B C C Montana C F D Nebraska A D C Nevada C D D New Hampshire A A C New Jersey B B A New Mexico F D D New York D C B North Carolina C B C North Dakota B D D Ohio C B B Oklahoma D C D Oregon B A B Pennsylvania C A A Rhode Island C D B South Carolina C D F South Dakota C F D Tennessee D C C Texas F B C Utah A A A Vermont A C C Virginia C B B Washington A B A West Virginia F F F Wisconsin A C A Wyoming C D B Source: 1999 Development Report Card
30 CFED Top Performers Performance Business Vitality Development Capacity Colorado A A A Delaware B A B Massachusetts B A A Michigan B B B Minnesota A B A New Jersey B B A Utah A A A Washington A B A Table 4 Source: Corporation for Enterprise Development
31 Table 5 High-Tech Employment by State 1997 Rank State Employment 1. California 784, TEXAS 375, New York 320, Illinois 207, Massachusetts 205, Florida 193, New Jersey 179, Pennsylvania 159, Virginia 154, Georgia 132,524 Source: American Electronics Association Cybersstates 3.0 Survey
32 High-Tech Job Scorecard 1990 vs Ranking 90 Ranking States # Change % Change United States 3,972,573 4,566, , % 1 1 California 718, ,151 66,121 9% 2 3 Texas 274, , ,737 37% 3 2 New York 350, ,410-30,169-9% 4 5 Illinois 181, ,201 25,786 14% 5 4 Massachusetts 221, ,091-16,550-7% Table Florida 169, ,559 23,933 14% 7 6 New Jersey 171, ,528 7,832 5% 8 8 Pennsylvania 142, ,952 17,909 13% 9 9 Virginia 121, ,712 33,004 27% Georgia 86, ,524 46,405 54% *1997 data are the most recent available. Source: U.S. Bureau of Labor Statistics
33 Texas High-Tech Metropolitan Scorecard by Employment 1990 vs Ranking States # Change % Change United States 4.0 million 4.3 million +288,000 +7% Texas 274, ,075 68,900 25% 1 Dallas 125, ,900 26,500 21% 2 Houston 44,600 57,500 12,900 29% 3 Austin 33,600 56,100 22,500 67% 4 Fort Worth 14,600 18,500 3,800 26% 5 San Antonio 12,000 17,600 5,600 46% Table 7 Boston 241, ,700-18,700-8% San Jose 196, ,300 24,500 12% *1996 data are the most recent available. Source: U.S. Bureau of Labor Statistics
34 High-Tech Wage Scorecard 1997* Ranking (by wage) State Av. High-Tech Wage Av. Private Sector Wage % Difference United States $53,145 $30,053 77% 1 Washington $81,375 $30, % 2 California $62,771 $32,982 90% 3 New Jersey $62,589 $37,015 69% 4 Washington, D.C. $61,862 $42,667 45% 5 Massachusetts $59,622 $35,661 67% Table 8 6 Connecticut $58,165 $38,959 49% 7 New York $57,319 $38,675 48% 8 Virginia $56,757 $28,848 97% 9 Maryland $54,976 $30,473 80% 10 Colorado $54,528 $29,774 83% 11 Texas $53,778 $30,102 79% *1996 data are the most recent available. Source: U.S. Bureau of Labor Statistics
35 Texas High-Tech Metropolitan Scorecard by Wages 1990 vs Ranking States # Change % Change United States $43,800 $49,600 $5,800 13% Texas $43,100 $50,000 $6,900 16% 1 Houston $46,500 $53,800 $7,300 16% 2 Dallas $45,000 $53,700 $8,600 19% 3 Austin $45,900 $51,800 $5,900 13% 4 Fort Worth $35,200 $41,500 $6,200 18% 5 San Antonio $37,000 $39,300 $2,300 6% Table 9 San Jose $55,600 $71,900 $16,200 29% Boston $47,700 $55,300 $7,600 16% *1996 data are the most recent available. Adjusted for inflation to 1996 dollars. Source: U.S. Bureau of Labor Statistics
36 Table 10 Texas High-Tech Degrees Conferred 1990 vs % Change Associate 3,355 3,225-4% Bachelor 1,948 1,805-7% Master 1,877 2,202 17% Doctor % Total High-Tech 12,058 12,991 8% Source: American Electronics Association
37 The State New Economy Index The Rankings - Overall Scores Table 11 STATES BY RANK ALPHABETICALLY Rank State Score State Rank Score 1 Massachusetts Alabama California Alaska Colorado Arizona Washington Arkansas Connecticut California Utah Colorado New Hampshire Connecticut New Jersey Delaware Delaware Florida Arizona Georgia Maryland Hawaii Virginia Idaho Alaska 57.7 Illinois Minnesota Indiana Oregon 56.1 Iowa New York Kansas Texas Kentucky Vermont Louisiana New Mexico Maine Florida Maryland Nevada Massachusetts Illinois Michigan Idaho Minnesota Pennsylvania Mississippi Georgia Missouri Hawaii Montana Kansas 45.8 Nebraska Maine Nevada Rhode Island New Hampshire North Carolina New Jersey Tennessee New Mexico Wisconsin New York Ohio North Carolina Michigan North Dakota Missouri Ohio Nebraska Oklahoma Indiana Oregon South Carolina Pennsylvania Kentucky 39.4 Rhode Island Oklahoma South Carolina Wyoming South Dakota Iowa Tennessee South Dakota Texas Alabama Utah North Dakota Vermont Montana Virginia Louisiana Washington West Virginia West Virginia Arkansas Wisconsin Mississippi Wyoming U.S. Average Source:
38 Table 12 The State New Economy Index - Texas Indicator Rank Score Overall Aggregated Knowledge Jobs Scores Office Jobs Jobs in offices as a share of the total number of jobs in each state. Managerial, Professional, and Technical Jobs Managers, professionals, and technicians as a share of the total workforce. Workforce Education A weighted measure of the educational attainment of the workforce (advanced degrees, bachelor s degrees, associate s degrees, or some college course work). Aggregated Globalization Scores % 19.50% Export Focus of Manufacturing The share of jobs in manufacturing companies dependent upon exports. Foreign Direct Investment The percentage of each state s workforce employed by foreign companies. Aggregated Economic Dynamism Scores % 3.50% 7.8 "Gazelle" Jobs Jobs in gazelle companies (companies with annual sales revenue that has grown 20 percent or more for four straight years) as a share of total employment. Job Churning The number of new start-ups and business failures, combined, as a share of all companies in each state. Initial Public Offerings The value of the initial public stock offerings of companies as a share of gross state product. Aggregated Digital Economy Scores % 2.80% 0.63% 6.13 Online Population The percentage of adults with Internet access in each state. Commercial Internet Domain Names The number of commercial Internet domain names (".com") per firm. Technology in Schools A weighted measure of the percentage of classrooms wired for the Internet, teachers with technology training, and schools with more than 50 percent of teachers having schoolbased accounts. Digital Government A measure of the utilization of digital technologies in state governments. Aggregated Innovation Capacity Scores % High-Tech Jobs Jobs in high-tech electronics manufacturing, software and computer-related services, and telecommunications as a share of total employment. Scientists and Engineers Civilian scientists and engineers as a percentage of the workforce. Patents The number of patents issued to companies or individuals per 1,000 workers. Industry Investment in R&D % 0.34% % Private sector investment in research and development as a share of Gross State Product. Venture Capital Venture capital invested as a percentage of Gross State Product % Source:
39 Best & Worst Locations The Top 10 The Bottom 10 Rank Location Score Rank Location Score 1. Seattle, WA Johnson City, TN Austin, TX Spokane, WA Dallas, TX Honolulu, HI Ventura, CA Reading, PA Oakland, CA Buffalo, NY Somerset, NJ Gary-Hammond, IN Denver, CO Asheville, NC San Jose, CA Atlantic City, NJ Houston, TX Akron, OH Atlanta, GA Shreveport, LA Fort Worth- Arlington, TX Table 13 Source: Forbes, May 31, 1999
40 Top 10 Most Productive Cities Economic Productivity Composite Index Metropolitan Statistical Area (US Average = 100) 1. Dallas San Francisco San Jose, CA Houston Atlanta Provo-Orem, UT Boise City, ID Sioux Falls, SD Nashville, TN Salt Lake City-Ogden, UT Fort Worth 120 Source: Sprint Business Table 14
41 Table 15 OVERALL RANKINGS MANUFACTURING RANKINGS 1 Sunnyvale 1 Costa Mesa 2 Raleigh NC 2 Irving TX 3 Madison WI 3 Greensboro NC 4 Seattle WA 4 Manchester NH 5 Alexandria VA 5 Sioux Falls SD 6 Lincoln NE 6 Lincoln NE 7 Tallahasee FL 7 Cedar Rapids IA 8 Costa Mesa CA 8 Charlotte NC 9 Arden-Arcade CA 9 Reno NV 10 Overland Park KS 10 Sunnyvale CA 11 Torrance CA 11 Wichita KS 12 Springfield IL 12 Orange CA 13 Boise City ID 13 Des Moines IA 14 Tempe AZ 14 Huntington Beach CA 15 Stamford CT 15 Torrance CA 16 Reno NV 16 Anaheim CA 17 Honolulu HI 17 Portland OR 18 Ann Arbor MI 18 Livenia MI 19 Portland OR 19 San Buena Ventura CA 20 Durham NC 20 Fullerton CA 21 Scottsdale AZ 21 Green Bay WI 22 Arlington VA 22 Arvada CO 23 Greensboro NC 23 Fremont CA 24 Little Rock AK 24 Hollywood CA 25 Minneapolis MN 25 Omaha NE Source: (Nov/Dec 99)
42 P.O.V. s Best Cities to Start a Business 1. Seattle 14. Sioux Falls, SD 2. Austin 15. Colorado Springs, CO 3. Las Vegas 16. Madison, WI 4. Denver 17. Nashville, TN 5. Burlington, VT 18. Jackson, MS 6. Salt Lake City 19. Portland, OR 7. Raleigh-Durham 20. Chicago 8. Orlando, FL 21. Phoenix 9. Atlanta 22. Baton Rouge, LA 10. Jacksonville, FL 23. Houston 11. Boston 24. San Francisco 12. Dallas-Fort Worth 25. Santa Fe, NM 13. Charleston, S.C. Table 16 Source: P.O.V. Magazine
43 Venture-Capital Dollars Invested in Internet-Related Companies in millions Region Silicon Valley $117.9 $579.4 $1,067.4 $1,509.1 $4,443.2 New York metro area Los Angeles/ Orange County Table 17 Austin Dallas/Fort Worth Source: PricewaterhouseCoopers MoneyTree Survey
44 Overall Desirability Rating of Dallas Versus Other Markets Very Desirable Desirability Not Desirable 7 6 5, Total Denver 4% 21% 55% 20% 4.5 Atlanta 9% 14% 51% 26% 4.4 Phoenix 6% 20% 48% 26% 4.4 San Francisco 9% 16% 48% 27% 4.3 Seattle 8% 22% 41% 29% 4.3 Portland, Oregon 5% 14% 53% 28% 4.3 Tampa/St. Petersburg 5% 16% 50% 29% 4.3 Dallas 4% 9% 53% 34% 4.0 Minneapolis/St. Paul 4% 9% 49% 38% 3.9 Boston 5% 11% 47% 37% 3.9 Chicago 8% 9% 39% 44% 3.8 New York City 10% 8% 34% 48% 3.6 Houston 3% 6% 46% 45% 3.6 Las Vegas 5% 10% 38% 47% 3.6 Philadelphia 3% 8% 43% 36% 3.5 Washington, DC 6% 8% 33% 53% 3.4 Los Angeles 5% 8% 27% 60% 3.2 Detroit 2% 2% 26% 70% 2.7 Table 18 A majority of workers from the fastest growing professions requiring education or experience rated Dallas very desirable 7/6 or desirable 5/4 and relatively low percent rated it undesirable 1-3. Its mean rating was 4.0, the eighth best rating of any market. Source: Cushman & Wakefield, Best Cities Study, October 14, 1999
45 Table 19 Money Magazine s City Rankings Category San Francisco Austin Dallas POLLUTION EPA watershed rating (100 is best; 0 is worst) 8.6 (261) 95.6 (13) 69.2 (36) Air quality rating (200 is best; 0 is worst) 175 (8) 140 (73) 75 (294) CRIME Property crime yearly per 100,000 people 4,240 (119) 5,414 (215) 5,470 (222) Violent crime yearly per 100,000 people (215) (131) (221) ECONOMY Cost of living index (average=100) 184 (295) 96.5 (81) (153) Recent unemployment rate 2.3% (35) 2.2% (26) 3.0% (46) Job growth since % (211) 5.46% (7) 3.79% (29) Forecast job growth to % (248) 33.19% (3) 19.66% (64) Municipal bond rating AA- (92) AA (30) AAA (1) HOUSING Median price for 3-bedroom home $360,000 (298) $160,000 (198) $193,310 (269) Change in average home value since % (200) 9.71% (16) 6.05% (97) Utility costs (average for an 1,800 sq. ft. home) $120 (234) $89.3 (57) $97.9 (105) QUALITY OF LIFE Average commute time (mins) 24.9 (283) 21.4 (227) 24.4 (281) Pro sports index (100 is best; 0 is worst) 94 (36) 26 (228) 98 (25) Arts & culture index (100 is best; 0 is worst) 100 (1) 47 (88) 81 (29) WEATHER Sunny days (number of days per year with clear or partly clear weather) Average July high (degrees Fahrenheit) Average January low (degrees Fahrenheit) Average annual rainfall (inches) Average annual snowfall (inches) Source: Money Magazine
46 Table 20 The Top 10 Fortune magazine s Best Cities for Business in the United States: 1. DALLAS 2. San Jose 3. Austin 4. New York City 5. Atlanta 6. Seattle 7. San Francisco 8. Denver 9. Boston 10. Chicago Source: Fortune magazine; Arthur Andersen
47 Table 21 High-Tech Industries High-Tech Manufacturing Industries SIC Industry Definition 283 Drugs 357 Computer & Office Equipment 366 Communications Equipment 367 Electronic Components & Accessories 376 Guided Missiles, Space Vehicles & Parts 381 Search, Detection, Navigation, Guidance, Aeronautical Nautical Systems, Instruments, & Equipment 382 Laboratory Apparatus and Analytical, Optical, Measuring, & Controlling Instruments 384 Surgical, Medical, & Dental Instruments & Supplies High-Tech Service Industries SIC Industry Definition 481 Telephone Communications Services 737 Computer Programming, Data Processing, & Other Computer Related Services 781 Motion Picture Production & Allied Services 871 Engineering, Architectural, & Surveying Services 873 Research, Development, & Testing Services Source: Milken Institute
48 Table 22 Top 50 High-Tech Metros, by Concentration Total High-Tech Real Output, 1998 Metro* Location Quotient** Output (Bill., 1992$) % of MSA Total Output % of U.S. Industry Total Empl. (Thou.) 1 Rochester, MN San Jose, CA Albuquerque, NM Lubbock, TX Cedar Rapids, IA Boulder-Loogmont, CO Boise City, ID Kalamazoo-Battle Creek, MI Richland-Kennewick-Pasco, WA Middlesex-Somerset-Hunterdon, NJ Seattle-Bellevue-Everett, WA Melbourne-Titusville-Palm Bay, FL Raleigh-Durham-Chapel Hill, NC Pocatello, ID Albany, GA South Bend, IN Burlington, VT Dallas, TX Wichita, KS Flagstaff, AZ-UT Colorado Springs, CO Tucson, AZ Huntsville, AL Atlantic-Cape May, NJ Sherman-Denison, TX Binghamton, NY Austin-San Marcos, TX Boston, MA Provo-Orem, UT Phoenix-Mesa, AZ Washington, DC-MD-VA-WV Oakland, CA Orange County, CA Denver, CO San Diego, CA Atlanta, GA Williamsport, PA Rocky Mount, NC Los Angeles-Long Beach, CA Newark, NJ Monmouth-Ocean, NJ Santa Cruz-Watsonville, CA Portland-Vancouver, OR-WA Mansfield, OH Indianapolis, IN Ventura, CA Dutchess County, NY Glens Falls, NY Elkhart-Goshen, IN Trenton, NJ *Each metro must contain either a place with a minimum population of or a Census Bureau defined urbanized area and total population of at least 100,000 ( in New England). A metro comprises one or more counties. **The Location Quotient (LQ) equals % output in metro divided by % output in the U.S. If LQ > 1.0. the industry is more concentrated in the metro area than in the U.S. on average. Sources: Milken Institute; RFA
49 Table 23 Top 50 High-Tech Metros, by Size Percent of National High-Tech Real Output, 1998 Metro* Percent 1 San Jose, CA Los Angeles-Long Beach, CA New York. NY Boston, MA Chicago, IL Dallas, TX Washington, DC-MD-VA-WV Atlanta, GA Seattle-Bellevue-Everett, WA Philadelphia, PA Orange County, CA Houston, TX Phoenix-Mesa, AZ Oakland, CA Middlesex-Somerset-Hunterdon, NJ San Francisco, CA SanDiego, CA Albuquerque, NM Newark, NJ Denver, CO Detroit, MI Minneapolis-St. Paul, MN-WI Austin-San Marcos, TX New Haven-Bridgeport-Stamford, CT Portland-Vancouver, OR-WA Nassau-Suffolk, NY St. Louis, MO-IL Raleigh-Durham-Chapel, Hill, NC Kansas City, MO-KS Indianapolis, IN Orlando, FL Sacramento, CA Pittsburgh, PA Fort-Worth-Arlington, TX Tampa-St. Petersburg-Clearwater, FL Bergen-Passaic, NJ Baltimore, MD Boise City, ID San Antonio, TX Cincinnati, OH-KY-IN Columbus, OH Charlotte-Gastonia-Rock Hill, NC-SC Cleveland-Lorain-Elyria, OH Hartford, CT Salt Lake City-Ogden, UT Monmouth-Ocean, NJ West Palm Beach-Boca Raton, FL Kalamazoo-Battle Creek, MI Fort Lauderdale, FL Milwaukee-Waukesha, WI 0.40 *Each metro must contain either a place with a minimum population of 50,000 or a Census Bureau defined urbanized area and total population of at least ( in New England). A metro comprises one or more counties. Sources: Milken Institute; RFA
50 Table 24 Top 50 High-Tech Metros, by Growth Relative High-Tech Real Output Growth, 1990 to 1998 Metro* Relative Growth** 1 Albuquerque, NM Pocatello, ID Boise City, ID Cedar Rapids, IA Harrisburg-Lebanon-Carlisle, PA Columbus, GA-AL Merced, CA Richland-Kennewick-Pasco, WA Yuma, AZ Austin-San Marcos, TX Eugene-Springfield, OR Albany, GA Yolo, CA Tyler, TX Flint, MI Portland-Vancouver, OR-WA Killeen-Temple, TX Iowa City, IA Phoenix-Mesa, AZ New London-Norwich, CT Little Rock-North Little Rock, AR Texarkana, TX-AR San Antonio, TX Waco, TX Clarksville-Hopkinsville, TN-KY Dallas, TX Kenosha, WI Colorado Springs, CO Waterloo-Cedar Falls, IA Lancaster, PA Lynchburg,VA Tallahassee, FL Atlanta, GA Brazoria, TX Sacramento, CA Houston, TX Grand Forks, ND-MN Denver, CO Springfield, MO Longview-Marshall, TX Lubbock, TX Greeley, CO Bismarck, ND Lafayette, LA Johnstown, PA San Luis Obispo-Atascadero, CA Boulder-Longmont, CO Goldaboro, NC Vallejo-Fairfield-Napa, CA San Jose, CA 1.36 *Each Metro must contain either a place with a minimum population of 50,000 or a Census Bureau defined urbanized area and total population of at least 100,000 (75,000 in New England). A metro cumprises one or more counties. **Relative growth in high-tech real output is equivalent to metro output indexed to 1900 then divided by U.S. index. A metro with a value of >1 grew faster than the nahonal average from 1990 to Sources: Milken Institute; RFA
51 Table 25 Top 50 Milken Institute Tech-Poles Composite Index, 1998 Tech-Poles Composite Index* Number of High-Tech LQs Over 1** 1 San Jose, CA Dallas, TX Los Angeles-Long Beach, CA Boston, MA Seattle-Bellevue-Everett, WA Washington, DC-MD-VA-WV Albuquerque, NM Chicago, IL New York, NY Atlanta, GA Middlesex-Somerset-Hunterdon, NJ Phoenix-Mesa, AZ Orange County, CA Oakland, CA Philadelphia, PA Rochester, MN San Diego, CA Raleigh-Durham-Chapel Hill, NC Denver, CO Newark, NJ Austin-San Marcos, TX San Francisco, CA Houston, TX Boise City, ID New Haven-Bridgeport-Stamford, CT Portland-Vancouver, OR-WA Boulder-Longmont, CO Kalamazoo-Battle Creek, MI Indianapolis, IN Nassau-Suffolk, NY Kansas City, MO-KS Minneapolis-St. Paul, MN-WI Lubbock, TX St. Louis, MO-IL Cedar Rapids, IA Orlando, FL Sacramento, CA Detroit, MI Wichita, KS Tucson, AZ Fort Worth-Arlington, TX Colorado Springs, CO Monmouth-Ocean, NJ Bergen-Passaic, NJ Melbourne-Titusville-Palm Bay, FL San Antonio, TX Pittsburgh, PA Atlantic-Cape May, NJ West Palm Beach-Boca Raton, FL Huntsville, AL *Composite Index is equivalent to the percent of national high-tech real output multiplied by the high-tech real output location quotient for each metro. **The Location Quotient (LQ) equals % output tn metro divided by % output in the U.S If LQ> 1.0, the industry is more concentrated in the metro area than in the US on average Sources: Milken Institute, RFA
52 Table 26 Tech-Poles Sensitivity to Recession Ranked by Index Percent Decline, Peak to Trough Percent Decline, Cycle Relative to Trend Composite Tech-Pole Index* 1 San Jose, CA Dallas, TX Los Angeles-Long Beach, CA Boston, MA Seattle-Bellevue-Everett, WA Washington, DC-MD-VA-WV Albuquerque, NM Chicago, IL New York, NY Atlanta, GA Middlesex-Somerset-Hunterdon, NJ Phoenix-Mesa, AZ Orange County, CA Oakland, CA Philadelphia, PA Rochester, MN San Diego, CA Raleigh-Durham-Chapel Hill, NC Denver, CO Newark, NJ Austin-San Marcos, TX San Francisco, CA Houston, TX Boise City, ID New Haven-Bridgeport-Stamford, CT Portland-Vancouver, OR-WA Boulder-Longmont, CO Kalamazoo-Battle Creek, MI Indianapolis, IN Nassau-Suffolk, NY Kansas City, MO-KS Minneapolis-St. Paul, MN-WI Lubbock, TX St. Louis, MO-IL Cedar Rapids, IA Orlando, FL Sacramento, CA Detroit, MI Wichita, KS Tucson, AZ Fort Worth-Arlington, TX Colorado Springs, CO Monmouth-Ocean, NJ Bergen-Passaic, NJ Melbourne-Titusville-Palm Bay, FL San Antonio, TX Pittsburgh, PA Atlantic-Cape May, NJ West Palm Beach-Boca Raton, FL Huntsville, AL *Composite Index is equivalent to the percent of national high-tech real output multiplied by the high-tech real output location quotient for each metro. Sources: Milken Institute; RFA
53 Table 27 Factors in Regional High-Tech Development Inception Growth Fortification Public Policy Tax Incentives Public Investment Commercialization of Ideas Comparative Location Benchmarking Cost Factors Research Institutions Skilled or Educated Labor Force Transportation Center Proximity to Supplies & Markets Social Infrastructure Developments Attending Changing Needs Re-education & Training Facilities Establishing Trade Groups & Affiliations Housing, Zoning & Quality of Life Critical Very Important Important Source: Milken Institute
54 Table 28 Cognetics Top Metro Areas for Startups One research firm s ranking of the top ten large metropolitan areas for starting and growing a company: 1. Phoenix 2. Salt Lake City-Provo 3. Atlanta 4. Raleigh-Durham, NC 5. Indianapolis 6. Washington 7. Memphis, TN 8. Orlando, FL 9. Dallas-Fort Worth, TX 10. Nashville, TN Source: Cognetics, Inc.
55 Texas 1999 Report Card Performance Employment Earnings and Job Quality Equity Quality of Life Resource Efficiency Business Vitality Competitiveness of Existing Businesses Entrepreneurial Energy Structural Diversity Development Capacity Human Resources Financial Resources Infrastructure Resources Amenity Resources and Natural Capital Innovation Assets Performance Despite excellent long-term job growth (8th), the nation s best wage growth (1st), and high average pay (13th), Texas earned an F in Performance. Comparatively high unemployment (35th), high layoffs (49th), poor employer health coverage (43rd), large numbers of working poor (46th), and high poverty (43rd) contributed to the failing grade, as did a highly unequal income distribution (47th), and high disparity between urban and rural residents (47th). Although the Lone Star state scored well in net migration (12th) and infant mortality (17th), it led the nation in the proportion of low-income children lacking insurance (50th) and had the poorest performance in the use of renewable energy sources (50th). Texas also performed near the bottom of all states in teen pregnancy (47th), homeownership (44th), voting rates (49th), energy consumption (47th), and toxic releases (42nd). Business Vitality Despite poor economic Performance, Texas scored well in Business Vitality, improving its grade to a B. The state s businesses improved their Competitiveness outside the state (2nd), and also invested in manufacturing capital at a comparatively high rate (8th). Even though job growth created by new businesses was lacking (41st), the state performed well in the number of fast-growing gazelle companies (16th), technology companies (11th), and initial public offerings (2nd). Development Capacity Development Capacity in Texas has not changed over the past five years and could be best described as average. Even though math (5th) and reading (15th) proficiencies were high, high school graduation (43rd) and attainment (41st) rates were in the bottom-fifth of all states. A poor score in loans to deposits (47th) was offset by an excellent mark in commercial and industrial loans to total loans (6th). The Lone Star State could work to improve its digital infrastructure (40th) and air quality (44th). Texas scored only moderately in nearly all Innovation measures. A B C D F Texas' Five Year Grade Trends Source: 1999 Development Report Card, CFED F C C D F F B B B C C C C B D C Performance Bus. Vitality Devel. Cap. Figure 1 Rankings Measure by Measure PERFORMANCE Employment Long-Term Employment Growth 8 Short-Term Employment Growth 20 Unemployment Rate 35 Mass Layoffs 49 Earnings and Average Annual Pay 13 Job Quality Average Annual Pay Growth 1 Employer Health Coverage 43 Working Poor 46 Involuntary Part-Time Employment 34 Equity Poverty Rate 43 Income Distribution 47 Income Distribution Change 42 Rural/Urban Disparity 47 Quality of Life Net Migration 12 Infant Mortality 17 Uninsured Low Income Children 50 Teen Pregnancy 47 Heart Disease 29 Homeownership Rate 44 Charitable Giving 35 Voting Rate 49 Crime Rate 35 Resource Per Capita Energy Consumption 47 Efficiency Renewable Energy 50 Toxic Releases 42 Business Vitality Competitiveness Traded Sector Strength 13 Of Existing Change in Traded Sector Strength 2 Businesses Business Closings 37 Sector Competitiveness 29 Manufacturing Capital Investment 8 Structural Sectoral Diversity 21 Diversity Dynamic Diversity 32 Entrepreneurial New Companies 30 Energy Change in New Companies 27 New Business Job Growth 41 Gazelles 16 Technology Companies 11 Initial Public Offerings 2 Development Capacity Human Basic Educational Proficiency Reading 15 Resources Basic Educational Proficiency Math 5 Average Teacher Salary 29 K-12 Education Expenditures 26 High School Graduation 43 High School Attainment 41 College Attainment 23 Financial Commercial Bank Deposits 37 Resources Loans to Deposits 47 Loans to Equity 35 Commercial and Industrial Loans 29 Comm. And Indus. Loans to Total Loans 6 Venture Capital Investments 14 SBIC Financing 15 Infrastructure Highway Deficiency 14 Resources Bridge Deficiency 26 Urban Mass Transit 19 Sewage Treatment Needs 14 Digital Infrastructure 40 Amenity Energy Cost 22 Resources Urban Housing Costs 35 And National Health Professional Shortage Areas 30 Capital Tourism Spending 30 Conversion of Cropland to Other Uses 19 Air Quality 44 Innovation Ph.D. Scientist and Engineers 34 Assets Science/Engineering Grad. Students 23 Households with Computers 24 University Research and Development 29 Federal Research and Development 16 Private Research and Development 24 SBIR Grants 26 Royalties and Licenses 20 Patents Issued 23 University Spin-Outs th 40 th 30 th 20 th 10 th 1 st
56 Figure 2
57 Figure 3

58 The State New Economy Index Overall Scores Figure 4 Source:
59 Figure 5

60 The New Map of High Tech From Billville to Silicon Alley, The 13 Hottest Regions in America Figure 6 Source: Wall Street Journal
2012 ACCE Industry Advisory Board Best Practices Positioning Your Firm After the Great Recession
 2012 ACCE Industry Advisory Board Best Practices Positioning Your Firm After the Great Recession 2012 FMI Corporation 0 The Great Recession 2012 FMI Corporation 1 FMI Corporation 2010 1 Market Truths You
Government of Puerto Rico Department of Labor and Human Resources Bureau of Labor Statistics BUSINESS EMPLOYMENT DYNAMICS: FOURTH QUARTER
 Government of Puerto Rico Department of Labor and Human Resources Bureau of Labor Statistics BUSINESS EMPLOYMENT DYNAMICS: FOURTH QUARTER 2011 TABLE OF CONTENTS Introduction.1 Business Employment Dynamics:
BUSINESS EMPLOYMENT DYNAMICS THIRD QUARTER
 The Commonwealth of Puerto Rico Department of Labor and Human Resources Bureau of Labor Statistics BUSINESS EMPLOYMENT DYNAMICS THIRD QUARTER 2012 TABLE OF CONTENTS Introduction.1 Business Employment
Toward A Stronger and More Resilient
 Toward A Stronger and More Resilient U.S.- Relationship 1 The unshakable U.S.- Alliance is the cornerstone of peace, prosperity, and freedom in the Asia-Pacific region. [The leaders of and the States]
State Capitals Directions:
 State Capitals Directions: Using the word bank of state capitals below, match the capitals to their state. Hint: Use a map of the United States to help you locate the capitals. State Capitals Albany -
Regional Innovation Ecosystems:
 Regional Innovation Ecosystems: The Role of the University in Fostering Economic Growth Ross DeVol Chief Research Officer Milken Institute Caltech Giant High Level Forum, Leading Innovation Ecosystems
Recommended Citations
 Recommended Citations Entire set Kunkel, K., R. Frankson, J. Runkle, S. Champion, L. Stevens, D. Easterling, and B. Stewart (Eds.), 2017: State Climate Summaries for the United States. NOAA Technical Report
Characteristics of Competitive Places: Changing Models of Economic Dynamism
 Characteristics of Competitive Places: Changing Models of Economic Dynamism IEDC/IASP 2009 Conference Technology-Led Economic Development World Science and Technology Park Research Triangle Park, NC June
Index Public Library Funding & Technology Access Study,
 Index Public Library Funding & Technology Access Study, 2010-2011 Discussions of urban, suburban, or rural libraries in the summary sections are indexed. Additional data for all types of metropolitan status
Polling Question 1: What is the most important issue for job creation in California?
 Polling Question 1: What is the most important issue for job creation in California? 1. Improving state s regulatory climate 2. Increasing access to credit for small businesses 3. Retaining talent / developing
Taking the Measure of St. Louis
 Taking the Measure of St. Louis The views expressed here are those of the speakers and do not necessarily represent the views of the Federal Reserve Bank of St. Louis or of the Federal Reserve System.
Is the scanned image stored as a color, grayscale, or black and white image? If applicable, what resolution is used?
 Topic: Trademarks, Trade names, Service marks Question by: Mandy Harlan/LA s IT staff Jurisdiction: Louisiana Date: 25 August 2010 Jurisdiction Question(s) Manitoba Corporations Canada Alabama Alaska Arizona
: Geocode File - Census Tract, Block-Group and Block. Codebook
 196815: Geocode File Census Tract, BlockGroup and Block Codebook Number of Variables 15 Friday June 17 8:49 AM 196815: Geocode File Census Tract, BlockGroup and Block RLS1 "RELEASE NUMBER" NUM(1.) Release
Birding in the United States: A Demographic and Economic Analysis
 U.S. Fish & Wildlife Service Birding in the United States: A Demographic and Economic Analysis Addendum to the 2006 National Survey of Fishing, Hunting, and Wildlife-Associated Recreation Report 2006-4
Insight: Measuring Manhattan s Creative Workforce. Spring 2017
 Insight: Measuring Manhattan s Creative Workforce Spring 2017 Richard Florida Clinical Research Professor NYU School of Professional Studies Steven Pedigo Director NYUSPS Urban Lab Clinical Assistant Professor
2O2O WOMEN ON BOARDS GENDER DIVERSITY INDEX
 2O2O WOMEN ON BOARDS GENDER DIVERSITY INDEX 2018 Progress of Women Corporate Directors by Company Size, State and Industry Sector BOARDROOM DIVERSITY: A STRATEGIC IMPERATIVE WHAT IS THE GENDER DIVERSITY
Completeness of Birth Registration
 Vol. 33 A,S Completeness of Birth Registration in the United States in 1940 ROBERT F. LENHART, M.S.P.A. Chief, Vital Statistics Consulting Service, Division of Vital Statistics, Bureau of the Census, Suitland,
PUBLICATION 1978 A Reprint from Tierra Grande. Creation is Critical
 OCTOBER 2011 Texas Economy PUBLICATION 1978 A Reprint from Tierra Grande ENTREPRENEURSHIP, the process of new business creation, is an essential component of economic growth and development in free market
Entropy Based Measurement of Geographic. Concentration in U.S. Hog Production. Bryan J. Hubbell FS January 1997
 Entropy Based Measurement of Geographic Concentration in U.S. Hog Production Bryan J. Hubbell FS-97-02 January 1997 Bryan Hubbell is an Assistant Professor in the Department of Agricultural and Applied
Size of California s economy US$ trillions, 2009
 Size of California s economy US$ trillions, 2009 Rank Country Gross domestic product 1 United States 14 2 Japan 5.1 3 China 4.9 4 Germany 3.3 5 France 2.6 6 United Kingdom 2.2 7 44 Italy 2.1 8 California
A Compendium of National Statistics on Women-Owned Businesses in the U.S. Executive Summary and Data Report
 A Compendium of National Statistics on Women-Owned Businesses in the U.S. Executive Summary and Data Report Prepared for National Women s Business Council September 2001 Table of Contents Introduction...1
p(s) = P(1st significant digit is s) = log )
 = P(1st significant digit is s) = log )") Math 3070 1. Treibergs Benfords Law: Counting Frequencies and Chi-Squared Test of Proportion. Name: Example June 27, 2011 This example is pure numerology! You may suspend your credulity for this one! If
Math 3070 1. Treibergs Benfords Law: Counting Frequencies and Chi-Squared Test of Proportion. Name: Example June 27, 2011 This example is pure numerology! You may suspend your credulity for this one! If
State Profiles of America s High- Growth Companies
 The Ascent of America s High-Growth Companies State Profiles of America s High- Growth Companies State-by-state analysis of Inc. 500 firms over thirty years Yasuyuki Motoyama and Brian Danley September
Be Counted, America! The Challenge Ahead An analysis of mail-in participation in the 2010 Census as door-to-door enumeration begins
 May 3, 2010 Be Counted, America! The Challenge Ahead An analysis of mail-in participation in the 2010 Census as door-to-door enumeration begins On April 28, the U.S. Census Bureau announced that the nation
2019 OXFORD EWE LAMB FUTURITY (Sponsored by the American Oxford Sheep Association, Inc.)
") 2019 OXFORD EWE LAMB FUTURITY (Sponsored by the American Oxford Sheep Association, Inc.) The American Oxford Sheep Association, Inc. ( AOSA ) is sponsoring its 10th annual ewe lamb youth futurity program
2019 OXFORD EWE LAMB FUTURITY (Sponsored by the American Oxford Sheep Association, Inc.) The American Oxford Sheep Association, Inc. ( AOSA ) is sponsoring its 10th annual ewe lamb youth futurity program
2008 Statistics and Projections to the Year Preliminary Data
 2008 Statistics and Projections to the Year 2025 2009 Preliminary Data Presented at the 92nd Annual Convention Honolulu, Hawaii August 4-7, 2010 Updated October 2010 Prepared by: Market Research & Statistics
THE 3905 CENTURY CLUB, INC POINT AWARD APPLICATION (AND SUBSEQUENT 1000-POINT INCREMENTS) (EACH BAND/MODE SEPARATELY) (NOT ENDORSABLE)
 (EACH BAND/MODE SEPARATELY) (NOT ENDORSABLE)") THE 3905 CENTURY CLUB, INC. 2000-POINT AWARD APPLICATION (AND SUBSEQUENT 1000-POINT INCREMENTS) (EACH BAND/MODE SEPARATELY) (NOT ENDORSABLE) The requirements for the 2000-Point Award are simple. You just
THE 3905 CENTURY CLUB, INC. 2000-POINT AWARD APPLICATION (AND SUBSEQUENT 1000-POINT INCREMENTS) (EACH BAND/MODE SEPARATELY) (NOT ENDORSABLE) The requirements for the 2000-Point Award are simple. You just
ECONOMIC SNAPSHOT. A Summary of the San Diego Regional Economy UNEMPLOYMENT
 A Summary of the San Diego Regional Economy Brought to you by analyzes key economic metrics that are important to understanding the regional economy and San Diego s standing relative to other major metropolitan
STATE AGENCIES FOR SURPLUS PROPERTY
 SUPP 1 DoD 4160.21-M STATE AGENCIES FOR SURPLUS PROPERTY ALABAMA CALIFORNIA Surplus Division California State for 4401 Northern By-Pass Surplus P.O. BOX 210487 701 Burning Tree Road Montgomery, AL 36121-0487
American Community Survey: Sample Design Issues and Challenges Steven P. Hefter, Andre L. Williams U.S. Census Bureau Washington, D.C.
 American Community Survey: Sample Design Issues and Challenges Steven P. Hefter, Andre L. Williams U.S. Census Bureau Washington, D.C. 20233 Abstract In 2005, the American Community Survey (ACS) selected
Venture Impact. The Economic Importance of Venture Capital Backed Companies to the U.S. Economy. Third Edition
 Venture Impact The Economic Importance of Venture Capital Backed Companies to the U.S. Economy Third Edition ABOUT GLOBAL INSIGHT Global Insight is a privately held company formed from the two most respected
Employer Location file. Codebook
 232 Employer Location file Codebook Number of Variables 2 Wednesday July 8 28 :9 PM 232 Employer Location file EMPV "RELEASE NUMBER" NUM(.) Release number Release : 7/28, SAS proc geocode and proc ginside
California Public-Safety Radio Association
 Association Orientation Note: This slide presentation is timed to run automatically. Or, you may press the Left or Right arrow keys to change slides. Thank You! CPRA is the Southern California chapter
Pamela Amick Klawitter, Ed.D. Author
 Editor Eric Migliaccio Managing Editor Ina Massler Levin, M.A. Editor-in-Chief Sharon Coan, M.S. Ed. Illustrator Ken Tunell Cover Artist Lesley Palmer Art Coordinator Kevin Barnes Imaging Ralph Olmedo,
Event History Calendar (EHC) Between-Wave Moves File. Codebook
 Between-Wave Moves File. Codebook") 2325 Event History Calendar (EHC) BetweenWave Moves File Codebook Number of Variables 23 Thursday July 2 28 4:5 PM 2325 Event History Calendar (EHC) BetweenWave Moves File EHCV "RELEASE NUMBER" NUM(.)
2325 Event History Calendar (EHC) BetweenWave Moves File Codebook Number of Variables 23 Thursday July 2 28 4:5 PM 2325 Event History Calendar (EHC) BetweenWave Moves File EHCV "RELEASE NUMBER" NUM(.)
Birding in the United States: A Demographic and Economic Analysis
 U.S. Fish & Wildlife Service Birding in the United States: A Demographic and Economic Analysis Addendum to the 2011 National Survey of Fishing, Hunting, and Wildlife-Associated Recreation Report 2011-1
Population Studies. Steve Davis Department of Family Medicine, Box G Brown University Providence, RI
 Population Studies The Hooded Merganser A Preliminary Look at Growth in Numbers in the United States as Demonstrated in the Christmas Bird Count Database Steve Davis Department of Family Medicine, Box
ECONOMIC SNAPSHOT. A Summary of the San Diego Regional Economy UNEMPLOYMENT
 A Summary of the San Diego Regional Economy UNEMPLOYMENT San Diego Regional EDC analyzes key economic metrics that are important to understanding the regional economy and San Diego's standing relative
A domestic address must contain the following data elements:
 ADDRESS EDITS FOR FILE MAINTENANCE ATTACHMENT TO SERVICE REQUEST #16941 FINAL 1.0 INTRODUCTION There are minimal edits in the Payroll/Personnel System (PPS) for employee address formatting which is causing
THE 2016 STATE OF WOMEN-OWNED BUSINESSES REPORT
 THE 2016 STATE OF WOMEN-OWNED BUSINESSES REPORT Commissioned by American Express OPEN A Summary of Important Trends, 2007-2016 INTRODUCTION This publication marks our sixth annual exploration and analysis
California s Business Climate: Is It Getting Better?
 California s Business Climate: Is It Getting Better? Polling Questions What s the most important factor in making California become a more business friendly state? 1. Pass reforms to reduce health care,
Lowndes County by the Numbers
 Lowndes County by the Numbers How Do We Compare With Peer and Aspirant Communities? 2015 Report This report has been prepared for the Valdosta-Lowndes County Chamber of Commerce by the Center for Business
Saving Lives and Saving Money: Transforming Health in the 21 st Century to Achieve 100% Insurance Coverage
 Saving Lives and Saving Money: Transforming Health in the 21 st Century to Achieve 100% Insurance Coverage Newt Gingrich Founder The Center for Health KEYS TO REAL CHANGE Doing more of what you are already
Lowndes County by the Numbers
 Lowndes County by the Numbers How Do We Compare With Peer and Aspirant Communities? 2011 Report DRAFT 05/06/2011 Insert a collage of blended pictures from around Valdosta This report has been prepared
UNITED STATES. United We Stand Flag Stamp EDNA FERBER DIE CUT X ON 34 C. Washington. Self-Adhesive Booklet Stamps
 United We Stand Flag Stamp Distinguished Americans SELF-ADHESIVE BOOKLET STAMP DIE CUT 10.50 X 10.75 ON 2 OR 3 SIDES EDNA FERBER 83 C Regular Stamp Washington Self-Adhesive Booklet Stamps PERFORATED 11.25
Economic engine of the midwest st. louis, missouri
 Economic engine of the midwest st. louis, missouri Advantage doing business here competitive St. Louis, Missouri is the dynamic, low-cost place to grow your business. From starting small to growing globally,
2018 Indiana VENTURE REPORT
 218 Indiana VENTURE REPORT Content Overview................................ 2 Indiana s Growing Economy................. 3 Indiana s Value for Business................. 3 National Venture Capital Trends..............
North Carolina Heads The Best States For Business 2017
 North Carolina Heads The Best States For Business 2017 Kurt Badenhausen, FORBES STAFF I cover sports business with rare dips in education & local economies Bibikow/Getty Images Walter North Carolina has
Dynamic Cities and Creative Clusters
 Dynamic Cities and Creative Clusters Weiping Wu Associate Professor Urban Studies, Geography and Planning Virginia Commonwealth University, USA wwu@vcu.edu Presented at the Fourth International Meeting
COLUMBUS 2020 A REGIONAL GROWTH STRATEGY FOR CENTRAL OHIO
 COLUMBUS 2020 A REGIONAL GROWTH STRATEGY FOR CENTRAL OHIO Vision To achieve the strongest decade of growth in the Columbus Region s history Mission To strengthen the economic base of the 11-county Columbus
The Localization of Innovative Activity
 The Localization of Innovative Activity Characteristics, Determinants and Perspectives Giovanni Peri (University of California, Davis and NBER) Prepared for the Conference Education & Productivity Seattle,
Intentionality: Competing in the 21 st Century
 Intentionality: Competing in the 21 st Century America s First Road Trip Horatio Nelson Jackson, Sewall K. Crocker & Bud 1-2 December 2009 Source: www.pbs.org Six Converging Forces Globalization Environmental
Folly Rd. - Former Roller Rink Retail / Warehouse / Land Lease / BTS
 Folly Rd. - Former Roller Rink Retail / Warehouse / Land Lease / BTS 1523 Folly Rd. Charleston, SC 29412 Sq Ft: 16,000 Price: $5.99 PSF (Annual) NNN Lease TRAFFIC COUNT: 24,100 VPD DEMOGRAPHICS 1 Mile
Building on Innovation
 Building on Innovation America s First Road Trip Horatio Nelson Jackson, Sewall K. Crocker & Bud 1-2 December 2009 Source: www.pbs.org Sweeping Away the Old Rules Globalization Technology Demographics
Display Advertising Networks - National Rate Sheet
 Alabama 2x2 $1,000 127 893,708 Monday, 5pm North 2x2 $400 46 393,125 Central 2x2 $400 40 302,717 South 2x2 $400 41 197,866 2x2-2 regions $750 Retail Network 2x3: 1 region $600, 2 regions, $1,100, statewide
Rising to the Innovation Challenge
 Rising to the Innovation Challenge G. Wayne Clough, President Georgia Institute of Technology Metro Atlanta Chamber of Commerce June 17, 2004 The challenge The U.S. is not graduating the volume of scientists
ECONOMIC SNAPSHOT. A Summary of the San Diego Regional Economy UNEMPLOYMENT
 A Summary of the San Diego Regional Economy Brought to you by San Diego Regional EDC analyzes key economic metrics that are important to understanding the regional economy and San Diego s standing relative
ECONOMIC SNAPSHOT. A Summary of the San Diego Regional Economy UNEMPLOYMENT
 A Summary of the San Diego Regional Economy Brought to you by San Diego Regional EDC analyzes key economic metrics that are important to understanding the regional economy and San Diego s standing relative
Dr. Jeffrey Michael. Executive Director, Center for Business and Policy Research University of the Pacific
 2019 San Joaquin County Economic Outlook Dr. Jeffrey Michael Executive Director, Center for Business and Policy Research University of the Pacific Outline Population Growth and Migration California and
ECONOMIC SNAPSHOT. A Summary of the San Diego Regional Economy UNEMPLOYMENT
 A Summary of the San Diego Regional Economy Brought to you by San Diego Regional EDC analyzes key economic metrics that are important to understanding the regional economy and San Diego s standing relative
Epinephrine Salts Medicinal Nitroglycerine P & U Listed Syringe Waste. Epinephrine Salts. Medicinal Nitroglycerine
 Epinephrine Salts Medicinal Nitroglycerine P & U Listed Syringe Waste Following is a list of each state and whether or not they are consistent with the EPA s stance on Epinephrine Salts, Medicinal Nitroglycerine
Capital Street Business News Institutional Investors. FIG Media Corporation Institutional Investors
 Capital Street Business News Institutional Investors FIG Media Corporation Institutional Investors European and United States Investment Banker Limited Partner Shareholder Contracts Hiram R. Davis Founding
Moving Ahead. Third-quarter Technology venture capital investment increased 33 percent yearover-year. percent quarter-over-quarter.
 Moving Ahead Third-quarter Technology venture capital investment increased 33 percent yearover-year but decreased 6 percent quarter-over-quarter October 2 PwC US venture capital funding for the Technology
Contents. Illustrations
 Copyright IDSA 2001 Contents Executive Summary 3 1.0 Introduction 4 2.0 Direct Effects of Consumer Demand for Computer and Video Games 6 2.1 Sectors and Industries Directly Affected and Included 6 Information
THE TOP 100 CITIES PRIMED FOR SMART CITY INNOVATION
 THE TOP 100 CITIES PRIMED FOR SMART CITY INNOVATION Identifying U.S. Urban Mobility Leaders for Innovation Opportunities 6 March 2017 Prepared by The Top 100 Cities Primed for Smart City Innovation 1.
The Danish-American Entrepreneurship Summit
 The Danish-American Entrepreneurship Summit Insights Into the US Venture Capital Markets How to Create A Winning Strategy? Clare Fairfield Do Innovation Development Systems Matter? In 2003, venture backed
High Tech Industry in Georgia
 High Tech Industry in Georgia presentation to the General Assembly Budgetary Responsibility Oversight Committee Georgia Tech President G. Wayne Clough January 24, 2003 High-Tech Drives the Economy Compound
Competing in the 21 st Century
 Competing in the 21 st Century America s First Road Trip Horatio Nelson Jackson, Sewall K. Crocker & Bud 1-2 December 2009 Source: www.pbs.org Six Converging Forces Globalization Environmental Technological
F O U R T H Q U A R T E R
 FOURTH QUARTER 2018 U.S. TRENDLINES 5-Year Trend Current Quarter UNEMPLOYMENT RATE 3.9% Strongest quarter for job gains in 2018 RETAIL SALES All signs GROWTH point to continued growth More tenants seeking
Adopted March 17, 2009 (Ordinance 09-15)
") ECONOMIC ELEMENT of the PINELLAS COUNTY COMPREHENSIVE PLAN Prepared By: The Pinellas County Planning Department as staff to the LOCAL PLANNING AGENCY for THE BOARD OF COUNTY COMMISSIONERS OF PINELLAS COUNTY,
ECONOMIC ELEMENT of the PINELLAS COUNTY COMPREHENSIVE PLAN Prepared By: The Pinellas County Planning Department as staff to the LOCAL PLANNING AGENCY for THE BOARD OF COUNTY COMMISSIONERS OF PINELLAS COUNTY,
III. THE REGIONAL FRAMEWORK
 THE SAN DIEGO REGIONAL ECONOMY III. THE REGIONAL FRAMEWORK The San Diego region, comprised solely of San Diego County, is one of California s most dynamic regions. The efforts of the University within
Get it On in Rochester, NY
 April 2015 Get it On in Rochester, NY Greater Rochester Enterprise s Mission Finger Lakes Region Population: 1,219,672 Total Workforce: 602,000 Geographic Size: Comprised of 9 counties in Upstate New York:
Click here for PIF Contacts (national, regional, and state level) The Partners in Flight mission is expressed in three related concepts:
 The Partners in Flight mission is expressed in three related concepts:") [Text Links] Partners in Flight / Compañeros en Vuelo / Partenaires d Envol was launched in 1990 in response to growing concerns about declines in the populations of many land bird species. The initial
[Text Links] Partners in Flight / Compañeros en Vuelo / Partenaires d Envol was launched in 1990 in response to growing concerns about declines in the populations of many land bird species. The initial
MERGENT PRINT PRODUCTS
 2019 Print Catalog Table of Contents Mergent Print Products...Page 2 Hoover s Print Products.....Page 6 Harris Print Products....Page 7 Nielsen Print Products....Page 10 Dun & Bradstreet Print Products...Page
2017 Print Catalog. Table of Contents
 2017 Print Catalog Table of Contents Mergent Print Products Hoover s Print Products. Harris Print Products.. Nielsen Print Products Dun & Bradstreet Print Products.. Dun & Bradstreet Regionals.. Dun &
Basics of DMR Codeplug Programming A Primer for Ham Radio Operators new to the DMR world.
 Basics of DMR Codeplug Programming A Primer for Ham Radio Operators new to the DMR world. Table of Contents Introduction... 3 Step 1: Create your Contacts list... 3 Step 2: Add your Private Contacts...
State Population Yes No.Alabama 4,822,023 2 Alabama: Sessions (R-AL), Nay.Alaska 731,449 2 Alaska: Begich (D-AK), Nay.Arizona 6,553, Arizona:
, Nay.Alaska 731,449 2 Alaska: Begich (D-AK), Nay.Arizona 6,553, Arizona:") State Population Yes No.Alabama 4,822,023 2 Alabama: Sessions (R-AL), Nay.Alaska 731,449 2 Alaska: Begich (D-AK), Nay.Arizona 6,553,255 1 1 Arizona: Flake (R-AZ), Nay.Arkansas 2,949,131 2 Arkansas: Boozman
State Population Yes No.Alabama 4,822,023 2 Alabama: Sessions (R-AL), Nay.Alaska 731,449 2 Alaska: Begich (D-AK), Nay.Arizona 6,553,255 1 1 Arizona: Flake (R-AZ), Nay.Arkansas 2,949,131 2 Arkansas: Boozman
Profile of the British Columbia High Technology Sector: 2013 Edition
 Profile of the British Columbia High Technology Sector: 2013 Edition PREPARED FOR THE MINISTRY OF TECHNOLOGY, INNOVATION AND CITIZENS SERVICES BY BC STATS APRIL 2014 Authors: Dan Schrier, Lillian Hallin
Intentionality: Competing in the 21 st Century
 Intentionality: Competing in the 21 st Century America s First Road Trip Horatio Nelson Jackson, Sewall K. Crocker & Bud 1-2 December 2009 Source: www.pbs.org Six Converging Forces Globalization Environmental
CareerSource Florida Board Meeting October 25, 2017
 CareerSource Florida Board Meeting October 25, 2017 Welcome and Remarks Kevin Doyle Chairman, Strategic Policy & Performance Council Chairman s Remarks Kevin Doyle Chairman, Strategic Policy & Performance
VECTOR SURVEILLANCE IN NEW JERSEY EEE and WNV CDC WEEK 23: June 1 to June 7, 2008
 VECTOR SURVEILLANCE IN NEW JERSEY EEE and WNV CDC WEEK 3: June 1 to June 7, Prepared by Lisa M. Reed, Scott Crans and Dina Fonseca at the Center for Vector Biology, Rutgers University. Supported by funding
VTT TECHNOLOGY STUDIES. KNOWLEDGE SOCIETY BAROMETER Mika Naumanen Technology Studies VTT Technical Research Centre of Finland
 KNOWLEDGE SOCIETY BAROMETER Mika Naumanen Technology Studies VTT Technical Research Centre of Finland Knowledge society barometer Economic survey -type of tool to assess a nation s inclination towards
Innovation. Key to Strengthening U.S. Competitiveness. Dr. G. Wayne Clough President, Georgia Institute of Technology
 Innovation Key to Strengthening U.S. Competitiveness Dr. G. Wayne Clough President, Georgia Institute of Technology PDMA Annual Meeting October 23, 2005 Innovation Key to strengthening U.S. competitiveness
Greater Binghamton, New York
 Presentation: COLLABORATING FOR OUR FUTURE Greater Binghamton, New York www.angeloueconomics.com Angelos G. Angelou July 25, 2006 PROGRAM 1. Greater Binghamton Today 2. Target Industries 3. What it Takes
SAN DIEGO S QUARTERLY ECONOMIC SNAPSHOT
 SAN DIEGO S QUARTERLY ECONOMIC SNAPSHOT November 2017 SAN DIEGO HIGHLIGHTS IN THIS ISSUE Every quarter San Diego Regional EDC analyzes key economic indicators that are important to understanding the regional
1
 www.icomamerica.com 1 Welcome to the World of Ham Radio! Thank you for your interest in The Adventures of Zack and Max - The Odyssey Begins. This is your first step in discovering the excitement of amateur
The Florida Turnaround Story
 The Florida Turnaround Story In 2010, Florida was in a free fall. Florida lost more than 800,000 jobs, the real estate market had collapsed and tourism was on the decline. State debt had grown by about
Silicon Valley Venture Capital Survey Second Quarter 2018
 fenwick & west Silicon Valley Venture Capital Survey Second Quarter 2018 Full Analysis Silicon Valley Venture Capital Survey Second Quarter 2018 fenwick & west Full Analysis Cynthia Clarfield Hess, Mark
Guidelines: Logos & Taglines L O G O S & G U I D E L I N E S
 L O G O S & G U I D E L I N E S Guidelines: Logos & Taglines 2018 This guide will help you learn how to leverage the Smithsonian brand by using the Smithsonian Affiliate logos and taglines. In addition
Economic Recovery in the Rocky Mountain West: Metro Trends and Bottom-up Responses
 Lectures/Events (BMW) Brookings Mountain West 2-15-2011 Economic Recovery in the Rocky Mountain West: Metro Trends and Bottom-up Responses Mark Muro Brookings Institution, mmuro@brookings.edu Follow this
Dowel Bar Standardization. NC^2 Spring Meeting Savannah, GA
 Dowel Bar Standardization NC^2 Spring Meeting Savannah, GA Dowel Bar Task Force Maria Masten, Minnesota DOT Mark Snyder, ACPA Pennsylvania Matt Zeller, Concrete Paving Association of Minnesota Tom Cackler,
DELAWARE S FUTURE IN THE NEW ECONOMY
 DELAWARE S FUTURE IN THE NEW ECONOMY A REVIEW OF THE KAUFFMAN FOUNDATION S 2012 NEW ECONOMY INDEX REPORT Ken Anderson Director Entrepreneurial and Small Business Development Delaware Economic Development
Click to edit Master title style The State of the Venture Capital Industry Click to edit Master text styles
 The State of the Venture Capital Industry Bobby Franklin President Third & level CEO of NVCA Southeast Venture Conference March 16 Overview Click Venture to edit capital Master stats text at-a-glance styles
any questions I had after the job was done, they didn't just vanish after the bill was paid. To edit this sidebar, go to admin backend's.
 Cal painters quizno santa monica california Best Painters in Santa Monica, CA - Dream Painter Santa Monica, Steve Roddey Painting & Decorating, Casa Painting Services, CertaPro Painters of Santa. Hire
THE POLITICAL ECONOMY OF FINANCIAL REGULATION: EVIDENCE FROM U.S. STATE USURY LAWS IN THE 19TH CENTURY
 THE POLITICAL ECONOMY OF FINANCIAL REGULATION: EVIDENCE FROM U.S. STATE USURY LAWS IN THE 19TH CENTURY Efraim Benmelech, Harvard Economics and NBER Tobias J. Moskowitz, University of Chicago GSB and NBER
SAN DIEGO S QUARTERLY ECONOMIC SNAPSHOT
 SAN DIEGO S QUARTERLY ECONOMIC SNAPSHOT August 2017 highlights in THIS ISSUE Every quarter Regional EDC analyzes key economic indicators that are important to understanding the regional economy and the
STATE TECHNOLOGY AND SCIENCE INDEX
 2012 STATE TECHNOLOGY AND SCIENCE INDEX Enduring Lessons for the Intangible Economy April 2013 Kevin Klowden and Michael Wolfe State Technology and Science Index 2012 Enduring Lessons for the Intangible
SAN DIEGO S QUARTERLY ECONOMIC SNAPSHOT
 SAN DIEGO S QUARTERLY ECONOMIC SNAPSHOT December 2018 SAN DIEGO HIGHLIGHTS IN THIS ISSUE Every quarter San Diego Regional EDC analyzes key economic indicators that are important to understanding the regional
DATA EXPRESSION AND ANALYSIS
 NAME Lab Day DATA EXPRESSION AND ANALYSIS LABORATORY 1 OBJECTIVES Understand the basis of science and the scientific method. Understand exponents and the metric system. Understand the metric units of length,
Industrial Conference 2013 Thursday, November 14, 2013
 Goldman Sachs Industrial Conference 2013 Thursday, November 14, 2013 SINGLE SOURCE INTERMODAL DEDICATED FINAL MILE TRUCKLOAD LESS THAN TRUCKLOAD REFRIGERATED FLATBED EXPEDITED Disclosure This presentation