BUSINESS EMPLOYMENT DYNAMICS THIRD QUARTER
|
|
|
- Annis Atkinson
- 5 years ago
- Views:
Transcription
1 The Commonwealth of Puerto Rico Department of Labor and Human Resources Bureau of Labor Statistics BUSINESS EMPLOYMENT DYNAMICS THIRD QUARTER 2012
2
3 TABLE OF CONTENTS Introduction.1 Business Employment Dynamics: Third Quarter Trends in Gross Job Gains and Job Losses.3 Rates of Gross Job Gains and Gross Job Losses..3 Number of Establishments Gaining and Losing Employment 4 Establishments Births and Deaths. 5 Technical Notes...6 Summary of Major Differences between QCEW, BED, and CES Employment Measures..7 Unit of Analysis, Concepts and Methodology Private sector gross job gains and losses, Seasonally adjusted (Table 1) Private sector gross job gains and losses by industry, Seasonally adjusted (Table 1A) Private sector gross job gains and losses as a percent of employment Seasonally adjusted (Table 2) Number of private sector establishments by direction of employment change, Seasonally adjusted (Table 3) Private sector establishments by direction of employment change, As a percent of total establishments, seasonally adjusted (Table 4) Private sector establishment births and deaths, seasonally, adjusted Puerto Rico (Table 5)...16 Private sector gross jobs gains and losses by state, seasonally adjusted.(table 6) Private sector gross jobs gains as a percent of total employment by state, Seasonally adjusted (Table 7)...18
4
5 INTRODUCTION Business Employment Dynamics (BED) data is a product of a federal-state cooperative program known as Quarterly Census of Employment and Wages (QCEW), or ES-202 program. BED data is compiled by the U.S. Bureau of Labor Statistics (BLS) from existing quarterly state unemployment insurance (UI) records. Employers in P.R. are required to file quarterly reports regarding worker employment and wages covered by UI laws, and to pay quarterly UI taxes. Quarterly UI reports are sent by the Puerto Rico Department of Labor (PR DOL) to the BLS, and form the basis of the Bureau's establishing a universe sampling frame. These reports are also used to produce QCEW data, on total employment and wages, as well as the longitudinal BED data on gross job gains and losses. In the BED program, quarterly UI records are linked across quarters to provide a longitudinal history for each establishment. The linkage process allows the tracking of net employment changes at the establishment level. This in turn allows the estimation of jobs gained at opening and expanding establishments, and jobs lost at closing and contracting establishments. (See Technical notes for differences between QCEW, CES, and BED). 1
6 COMMONWEALTH PUERTO RICO BUSINESS EMPLOYMENT DYNAMICS: THIRD QUARTER 2012 From July to September 2012 in Puerto Rico, gross job gains represented 6.1 percent of the private sector employment, and gross job losses represented 6.3 percent of the private sector employment, according to preliminary data released by the Bureau of Labor Statistics of the U.S. Department of Labor. This was less than the national rate of gross job gains (6.2 percent) and more than the job losses (6.0 percent). The number of job gains from opening and expanding establishments was 41,896 and the number of job losses from closing and contracting establishments was 43,256. Expanding and contracting establishments accounted for most of the jobs gained and lost. The change over time in the employment level is the net result of increases and decreases in employment that occur at all business in the economy. Business Employment Dynamics statistics track these changes in employment, at private business units, from the third month of one quarter to the third month of the next. In this data series, gross job gains are defined as increases in employment resulting from expansions of employment at existing establishments, or from the opening of establishments. Gross job losses are defined as declines in employment at existing establishments, or from the closing of establishments. The difference between the number of gross jobs gained and the number of gross jobs lost is the net change in employment. The data series on Business Employment Dynamics are derived from the Quarterly Census of Employment and Wages (QCEW), also known as the ES-202 program. This program is a quarterly census of all establishments covered under state and federal unemployment insurance programs, representing about 98 percent of employment in nonfarm payrolls. All data referred to in the text are seasonally adjusted. (See Technical Note for more information.) The BED data series include gross job gains and gross job losses at the establishment level, by major industry sector, and for the 50 states, District of Columbia, Puerto Rico, and the Virgin Island. 2
7 Trends in Gross Job Gains and Job Losses Opening and expanding private sector business establishments in Puerto Rico gained 41,896 jobs in the third quarter of This represents a decrease of 3,502 from the previous quarter. Over the quarter, expanding establishments added 33,964 jobs, while opening establishments added 7,932. Gross job losses totaled 43,256 in the third quarter of 2012, an increase of 4,372 from the second quarter in This was the third increase in gross job losses since June of In the third quarter of 2012, contracting establishments lost 36,219 jobs, while closing establishments accounted for a loss of 7,037 jobs (See table A). Puerto Rico presents some data by industry sectors. By now, we are including Retail Trade, and Education and Health Services. In the near future we hope to add more sectors. From the months of July to September 2012, Retail Trade lost more jobs than Education and Health Services. Retail Trade increased its net employment by 2,314 and Education and Health Services decreased by (See table 1A.) Table A. Three-month private sector gross job gains and losses, seasonally adjusted Category Sept. Dec. March June Sept Gross job gains 44,263 45,535 41,000 45,398 41,896 At expanding establishments 37,158 37,295 33,457 38,467 33,964 At opening establishments 7,105 8,240 7,543 6,931 7,932 Gross job losses 38,359 38,101 41,093 38,884 43,256 At contracting establishments 31,441 30,186 34,114 31,569 36,219 At closing establishments 6,918 7,915 6,979 7,315 7,037 Net employment change 5,904 7, , The net employment change is the difference between total gross job gains and total gross job losses. See the Technical Note for further information. Rates of Gross Job Gains and Gross Job Losses (3 months ended) From July to September 2012, gross job gains represented 6.1 percent of private sector employment. Over the quarter, gross job gains at expanding establishments represented 4.9 percent of private sector employment, and gross job gains at opening establishments represented 1.2 percent. Nationally, this 3
8 quarter gross job gains at expanding establishments represented 5.0 percent of private sector employment, and at opening establishments represented 1.2 percent. For the same period, gross job losses represented 6.3 percent of private sector employment. Gross job losses at contracting establishments represented 5.3 percent of private sector employment, which was more than the national rate at contracting establishments (4.9 percent). The rate of gross job losses at closing establishments was 1.0 for Puerto Rico, and 1.1 percent for the United States. (See table B). Table B. Three-month private sector gross job gains and losses as percent of employment, seasonally adjusted (3 months ended) Category Sept. Dec. March June Sept Rates (percent) Total Private for Commonwealth of Puerto Rico Gross job gains At expanding establishments At opening establishments Gross job losses At contracting establishments At closing establishments Net employment change Rates (percent) Total Private for United States as a whole Gross job gains At expanding establishments At opening establishments Gross job losses At contracting establishments At closing establishments Net employment change The net employment change is the difference between total gross job gains and total gross job losses. See the Technical Note for further information. Number of Establishments Gaining and Losing Employment Another way to observe the dynamics of employment change is to count the number of establishments that opened, closed, expanded, or contracted during the quarter. Out of 46,334 active private sector establishments, a total of 9,543 gained jobs from July to September 2012 (See table C). Of these, 7,920 were expanding establishments and 1,623 were opening establishments. During the third quarter of 2012, 9,043 establishments showed some job lost. Of these, 7,633 were contracting establishments and 1,410 were closing establishments. 4
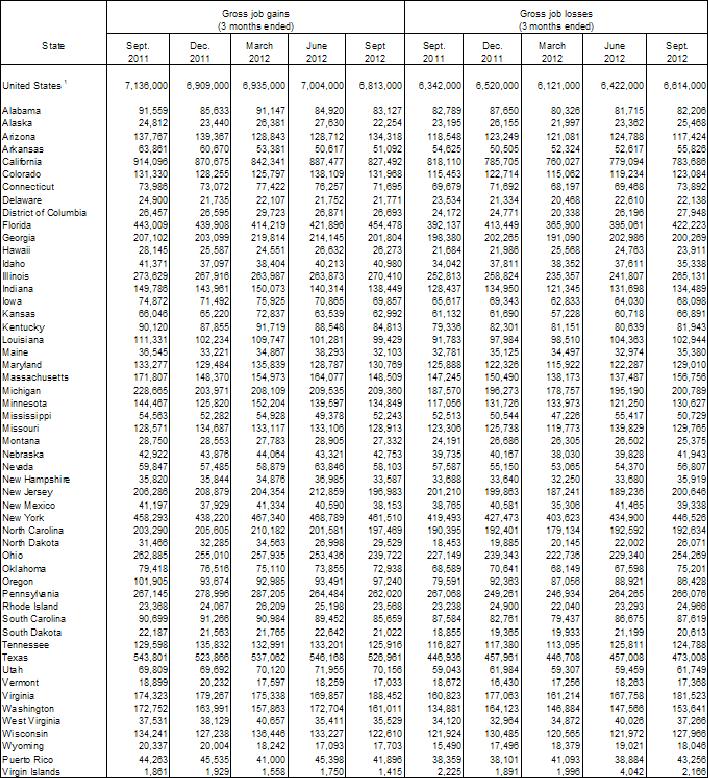
9 Table C. Number of private sector establishments by direction of employment change, seasonally adjusted Category 3 months ended Sept Dec Mar-12 Jun-12 Sept Establishments gaining jobs... 8,988 9,842 8,584 9,522 9,543 Expanding establishments... 7,491 8,212 7,143 8,110 7,920 Opening establishments.... 1,497 1,630 1,441 1,412 1,623 Establishments losing jobs ,133 8,472 10,187 8,989 9,043 Contracting establishments... 7,608 7,114 8,584 7,504 7,633 Closing establishments... 1,525 1,358 1,603 1,485 1,410 Net establishment change The net establishment change is the difference between the number of opening establishments and the number of closing establishments. See the Technical Note for further information. Establishment Births and Deaths Gross Job Gains and Losses by State From July to September 2012, a total of 1,134 new private sector, non-farm businesses created 6,149 jobs. This represented an increase of 131 establishment births from prior quarter and an increase of 814 jobs. The jobs gain by these new establishments represented 0.9 percent of total births employment. The historical time series of birth data shows that the number of establishment births has remained around 1,000 every quarter, while employment from births dropped from 52,610 in the fourth quarter 2003 to 6,149 in the third quarter of 2012 (See Table 5). In the third quarter of 2012, gross job gains exceeded gross job losses in 29 states, the District of Columbia, and Puerto Rico. Texas had the largest net employment gain of 53,953 jobs, followed by California with 43,806 jobs, and Florida with 32,255 jobs. (See table 6.) Alaska had the highest rate of gross job gains as a percent of employment at 9.0 percent, well above the U.S. total gross job gains rate of 6.2 percent. Hawaii had the lowest rate of gross job losses as a percent of employment at 5.0 percent, below the U.S. rate of 6.0 percent. (See table 7.) More Information Additional information on gross job gains and gross job losses are available online at This information includes data on the levels and rates of gross job gains and 5
10 gross job losses by firm size; the not seasonally adjusted data and other seasonally adjusted time series not presented in this release; charts of gross job gains and gross job losses by industry and firm size, and frequently asked questions on firm-size data. Additional information about Business Employment Dynamics data can be found in the Technical Note of this release or may be obtained by ing Technical Note Business Employment Dynamics (BED) data is a product of a federal-state cooperative program known as Quarterly Census of Employment and Wages (QCEW). BED data is compiled by the U.S. Bureau of Labor Statistics (BLS) from existing quarterly state unemployment insurance (UI) records. Most employers in the U.S. are required to file quarterly reports on employment and wages of workers covered by UI laws, and pay quarterly UI taxes. Quarterly UI reports are sent by the State Employment Security Agencies (SESAs) to the BLS and form the basis for the Bureau s establishment sampling frame universe. These reports are also used to produce the quarterly QCEW data on total employment and wages and the longitudinal BED data on gross job gains and losses. Other important uses for the Bureau s UI reports are published by the Current Employment Statistics (CES) program. In the BED program, quarterly UI records are linked across quarters to provide a longitudinal history of each establishment. The linkage process allows for the establishment level, which in turn allows for the estimation of jobs gained at opening, expanding units, and jobs lost at closing and contracting units. Differences between QCEW, BED, and CES employment measures The Bureau publishes three different establishment-based employment measures for any given quarter. Each of these measures--qcew, BED, and CES--makes use of the quarterly UI employment reports in producing data. However, each measure has a somewhat different universe coverage, estimation procedure, and publication product. Differences in coverage and estimation methods can result in somewhat different measures of over-the-quarter employment change. It is important to understand program differences as well as the intended uses of the program products. (See table below.) Additional information about each program can be obtained from the program Web sites shown in the table in the following page. 6
11 Summary of Major Differences between QCEW, BED, and CES Employment Measures Source QCEW BED CES --Count of longitudinallylinked UI administrative records submitted by 6.8 million private sector employers --Count of UI administrative records submitted by 9.2 million employers nationally --Sample survey: 486,000 establishments Coverage --UI and UCFE coverage: all employers subject to state and federal UI Laws --UI Coverage, excluding: government, private households, and establishments with zero employment Nonfarm wage and salary jobs: --UI Coverage, excluding agriculture, private households, and selfemployed --Other employment, including railroads, religious organizations, and other non-ui-covered jobs Publication frequency --Quarterly -7 months after the end of each quarter --Quarterly -8 months after the end of each quarter --Monthly -First Friday of each month Use of UI file --Directly summarizes and publishes each new quarter of UI data --Links each new UI quarter to longitudinal database and directly summarizes gross job gains and losses --Uses UI file as a sampling frame and annually realigns (benchmarks) sample estimates to first quarter UI levels Principal products Principal uses --Provides a quarterly and annual universe count of establishments, employment, and wages at the county, MSA, state, and national levels by detailed industry --Major uses include: -Detailed locality data -Periodic universe counts for bench marking sample survey estimates -Sample frame for BLS establishment survey --Provides quarterly employer dynamics data on establishment openings, closings, expansions, and contractions at the national level by NAICS super sectors and by size of firms, and at the state private-sector total level. --Future expansions will include data with greater industry details and data at the county and MSA level. --Major uses include: -Business cycle analysis -Analysis of employer dynamics underlying economic expansions and contractions -Analysis of employment expansion and contraction by size of firm --Provides current monthly estimates of employment, hours, and earnings at the MSA, state, and national level by industry --Major uses include: -Principal national economic indicator -Official time series for employment change measures -Input into other major economic indicators Program websites Coverage Employment and wage data for workers covered by state UI and Unemployment Compensation for Federal employees (UCFE) laws are compiled from quarterly contribution reports submitted to the SESAs by employers. In addition to the quarterly contribution reports, employers who operate multiple establishments within a state 7 complete a questionnaire, called the "Multiple Worksite Report," which provides detailed information on the location of their establishments. These reports are based on place of employment rather than place of residence. UI and UCFE coverage is broad and basically comparable from state to state.
12 Major exclusions from UI coverage are selfemployed workers, religious organizations, most agricultural workers on small farms, all members of the Armed Forces, elected officials in most states, most employees of railroads, some domestic workers, most student workers at schools, and employees of certain small nonprofit organizations. Gross job gains and gross job losses in this release are derived from longitudinal histories of over 6.8 million private sector employer reports out of 9.2 million total reports of employment and wages submitted by States to BLS in the first quarter of Gross job gains and gross job losses data in this release do not report estimates for government employees or private households (NAICS ), and do not include establishments with zero employment over three quarters. Data from Puerto Rico and the Virgin Islands (49,972) units rounded to 0.0 million) are also excluded from the National data. As an illustration, the table below shows, in millions of establishments, the number of establishments excluded from the gross job gains and gross job losses data in the first quarter 2012: Number of active establishments included in Business Employment Dynamics data at the National Level... Millions Total establishments QCEW program Excluded: Public sector Private households Zero employment Establishments in Puerto Rico and the Virgin Islands Total establishments included in Business Employment Dynamics data Unit of analysis Establishments are used in the tabulation of BED statistics by industry, and firms are used in the tabulation of the BED size class statistics. An establishment is defined as an economic unit that produces goods or services, usually at a single physical location, and engages in one or predominantly one activity. A firm s legal business, either corporate or otherwise, may consist of several establishments. Firm-level data are compiled based on an aggregation of establishments under common ownership by a corporate parent using employer tax identification numbers. The firm level aggregation which is consistent with the role of corporations as the economic decision makers are used for the measurement of BED data elements by size class. Because of the difference in the unit of analysis, total gross job gains, and gross job losses by size class are lower than total gross job gains and gross job losses by industry, as some establishments gains and loose within a firm are offset during the aggregation process. The total net changes in employment are the same for not seasonally adjusted data, but are similar for seasonally adjusted data. Concepts and methodology Business Employment Dynamics data measures the net change in employment at the establishment level. These changes come about in one of four ways. A net increase in employment can come from either opening or expanding establishments. A net decrease in employment can come from either closing establishments or contracting establishments. Gross job gains include the sum of all jobs added at either opening or expanding establishments. Gross job losses include the sum of all jobs lost in either closing or contracting establishments. The net change in employment is the difference between gross job gains and gross job losses. The formal definitions of establishment-level employment changes are as follows: Openings. These are either establishments with positive third month employment for the first time in the current quarter, with no links to the prior quarter; or with positive third month employment in the current quarter following zero employment in the previous quarter. Expansions. These are establishments with positive employment in the third month in both the previous and current quarters, with a net increase in employment over this period. Closings. These are either establishments with positive third month employment in the previous quarter, with no employment or zero employment reported in the current quarter. Contractions. These are establishments with positive employment in the third month in both the previous and current quarters, with a net decrease in employment over this period. Births. These are units with positive third month employment for the first time in the current quarter with no links to the prior quarter, or units with positive third month employment in the current quarter and zero employment in the third month four quarters. Births are a subset of openings not including reopening of seasonal businesses. 8
13 Deaths. These are units with no employment or zero employment reported in the third month for four consecutive quarters following the last quarter with positive employment. Deaths are a subset of closings not including temporary shutdowns of seasonal businesses. A unit that closes during the quarter may be a death, but we wait three quarters to determinate whether it is a permanent closing or a temporary shutdown. Therefore, there is a lag of three quarters for the final publication of death statistics. All employment changes are measured from the third month of each quarter. Not all establishments change their employment levels. These establishments count toward estimates of total employment, but not for levels of gross job gains or gross job losses. Gross job gains and gross job losses are expressed in rates by dividing their levels by the average of employment in the current and previous quarters. This provides a symmetric growth rate. Rates are calculated for the components of gross job gains and gross job losses, and then added to form their respective totals. These rates can be added and subtracted just as their levels can. For instance, the difference between a gross job gain rate and gross job loss rate is the net growth rate. Establishment Births and Deaths For the purpose of BED statistics, births are defined as establishments that appear in the longitudinal database for the first time, with positive employment in the third month of a quarter; or showed four consecutive quarters of zero employment in the third month followed by a quarter in which it shows positive employment in the third month. Similarly, deaths are defined as establishments that either drop out of the longitudinal database, or an establishment that had positive employment in the third month of a given quarter followed by four consecutive quarters of showing zero employment in the third month. Although the data for establishment births and deaths are tabulated independently from the data for openings and closings, the concepts are not mutually exclusive. An establishment that is defined as a birth in a given quarter is necessarily an opening as well; and an establishment defined as a death in a quarter must also be a closing. Since openings include seasonal, and other re-openings and closings include temporary shutdowns, the not seasonally adjusted values for births and deaths must be less than those for openings and closings. However, because some BED series do not have many re-openings or temporary shutdowns, as well as the fact that births and deaths are independently seasonally adjusted from openings and closings, there may be instances when the seasonally adjusted value of the former is greater than the latter. Linkage methodology Prior to the measurement of gross job gains and gross job losses, QCEW records are linked across two quarters. The linkage process matches establishments unique SESA identification numbers (SESA-ID) between 95 to 97 percent of establishments identified as continuous from quarter to quarter. The rest are linked in one of three ways. The first method uses predecessor and successor information, identified by the states, which relate records with different Puerto Rico Department of Labor -IDs across quarters. Predecessor and successor relations can come about for a variety of reasons, including a change in ownership, a firm restructuring, or a UI account restructuring. If a match cannot be attained in this manner, a probability-based match is used. This match attempts to identify two establishments with different Puerto Rico Department of Labor -IDs as continuous. The match is based upon comparisons such as the same name, address, and phone number. Third, an analyst examines unmatched records individually and makes a possible match. In order to ensure the highest possible quality of data, the Puerto Rico Department of Labor verifies with employers and updates, if necessary, the industry, location, and ownership classification of all establishments on a 4-year cycle. Changes in establishment classification codes, resulting from the verification process, are introduced with the data reported for the first quarter of the year. Changes resulting from improved employer reporting are also introduced in the first quarter. Sizing methodology The method of dynamic sizing is used in calculations of the BED size class data series. Dynamic sizing allocates each firm s employment gain or loss during a quarter to each respective size class in where the change occurred. For example, if a firm grew from 2 employees in quarter 1 to 38 employees in quarter 2, then, of the 36-employee increase, 2 would be allocated to the first size class, 5 to the size class 5 to 9, 10 to size class 10 to 19, and 19 to size class 20 to 49. Dynamic sizing provides symmetrical firm size estimates and eliminates any systematic effects that may be caused by the transitory and reverting changes in firm sizes over time. Additionally, it allocates each job gain or 9
14 loss to the actual size class where it occurred. Seasonal adjustment Over the course of a year, the levels of employment and associated job flows undergo sharp fluctuations due to such seasonal events as changes in the weather, reduced or expanded production, harvests, major holidays, and the opening and closing of schools. The effect of such seasonal variation can be very large. Because these seasonal events follow a more or less regular pattern each year, their influence can be eliminated by adjusting the statistics from quarter to quarter. These adjustments make nonseasonal developments, such as declines in economic activity, easier to recognize. For example, the large number of youths taking summer jobs is likely to obscure other changes that have taken place in June relative to March, making it difficult to determine if the level of economic activity has risen or declined. Because the effect of student finishing school is known previously a year before, statistics for the current year can be adjusted to allow for a comparable change. The adjusted figures provide a more useful tool with which to analyze changes in economic activity. The employment data series for opening, expanding, closing, and contracting establishments are independently seasonally adjusted. Net changes are calculated based on the difference between gross job gains and gross job losses. Similarly, the establishment data series for opening, expanding, closing, and contracting establishments are independently adjusted, and net changes are calculated based on the difference between the number of opening and closing establishments. Additionally, establishment and employment levels are independently, seasonally adjusted to calculate seasonally adjusted rates. Concurrent seasonal adjustment is run using X-12 ARIMA. The net over-the-quarter change derived by adding the BED component series will differ from the net employment change estimated from the seasonally adjusted, total private employment series from the CES program. The intended use BED statistics is to show labor market dynamic changes that underlie the net employment change statistic. As such, data users particularly interested in net employment change and not in gross job flows underlying this change should refer to CES data for overthe-quarter net employment changes. Reliability of the data Since the data series in Business Employment Dynamics is based on administrative rather than sample data, there are no issues related to sampling errors. Nonsampling error, however, still exists. Nonsampling errors can occur for many reasons, such as the employer submitting corrected employment data after the end of the quarter, or typographical errors made by businesses when providing information. Such errors, however, are likely to be distributed randomly throughout the dataset. Changes in administrative data sometimes create complications for the linkage process. This can result in overstating opening and closings while understating expansions and contractions. BLS continues to refine methods for improving the linkage process and alleviate the effects of these complications. Additional statistics and other information Several other programs within BLS produce closely related information. The QCEW program, also known as the ES- 202 program, provides both quarterly and annual estimates of employment by state, county, and detailed industry. News releases on quarterly county employment and wages, and average annual pay by state and industry are available upon request from the Division of Administrative Statistics and Labor Turnover, Bureau of Labor Statistics, U.S. Department of Labor, Washington, DC 20212; telephone ; ( ( QCEWInfo@bls.gov). The CES program produces monthly estimates of employment, its net change, and earnings by detailed industry. These estimates are part of the Employment Situation report put out monthly by the BLS. The Job Openings and Labor Turnover Survey (JOLTS) program provides monthly measures of job openings, as well as employee hires and separations. 10
15 Table 1 Private sector gross job gains and losses, seasonally adjusted (In Thousands) Gross job gains Gross job losses Year 3 months ended Net change(1) Total Expanding Opening Total Contracting Closing establishments establishments establishments establishments 2002 March -5,343 50,022 42,823 7,199 55,365 44,757 10,608 June -5,665 47,455 41,294 6,161 53,120 44,175 8,945 September -3,408 46,900 43,225 3,675 50,308 39,176 11,132 December 5,637 50,157 42,644 7,513 44,520 36,635 7, March -10,767 46,035 40,766 5,269 56,802 43,505 13,297 June -3,563 48,298 44,677 3,621 51,861 42,920 8,941 September -3,048 44,550 41,421 3,129 47,598 39,349 8,249 December 54,777 95,823 40,428 55,395 41,046 35,953 5, March ,947 45,488 7,459 52,274 42,986 9,288 June 12,584 59,628 46,321 13,307 47,044 40,644 6,400 September 2,308 53,133 43,111 10,022 50,825 44,047 6,778 December 5,251 54,706 47,784 6,922 49,455 38,999 10, March ,819 42,130 13,689 55,915 45,190 10,725 June ,679 42,372 12,307 55,278 43,897 11,381 September 1,158 51,750 42,284 9,466 50,592 42,329 8,263 December 6,975 50,538 43,702 6,836 43,563 37,457 6, March -3,140 50,790 43,487 7,303 53,930 43,801 10,129 June -6,448 48,844 38,902 9,942 55,292 47,105 8,187 September -7,032 49,409 41,811 7,598 56,441 44,729 11,712 December 6,303 54,665 45,762 8,903 48,362 38,185 10, March -8,786 47,249 38,586 8,663 56,035 46,305 9,730 June ,859 39,086 11,773 50,393 40,418 9,975 September ,863 40,596 10,267 51,604 42,706 8,898 December ,021 40,971 7,050 48,254 39,464 8, March -10,925 43,952 33,594 10,358 54,877 44,588 10,289 June -4,779 46,239 35,519 10,720 51,018 41,526 9,492 September -7,260 42,891 35,619 7,272 50,151 40,793 9,358 December -6,951 44,758 36,453 8,305 51,709 41,644 10, March -17,946 38,749 30,056 8,693 56,695 46,106 10,589 June -11,105 39,038 30,939 8,099 50,143 42,148 7,995 September -5,363 39,884 30,911 8,973 45,247 38,033 7,214 December 4,472 45,649 36,248 9,401 41,177 32,257 8, March -5,787 38,829 31,762 7,067 44,616 37,696 6,920 June -5,207 37,420 31,172 6,248 42,627 35,143 7,484 September -1,309 40,365 32,771 7,594 41,674 34,189 7,485 December 8,435 45,678 38,154 7,524 37,243 29,655 7, March -3,440 37,509 31,839 5,670 40,949 35,014 5,935 June -3,795 38,424 32,198 6,226 42,219 34,154 8,065 September 5,904 44,263 37,158 7,105 38,359 31,441 6,918 December 7,434 45,535 37,295 8,240 38,101 30,186 7, March ,000 33,457 7,543 41,093 34,114 6,979 June 6,514 45,398 38,467 6,931 38,884 31,569 7,315 September -1,360 41,896 33,964 7,932 43,256 36,219 7,037 (1) Net change is the difference between total gross job gains and total gross job losses. 11
16 12
17 Table 2. Private sector gross job gains and losses, as a percent of employment(1), seasonally adjusted (Percent) Gross job gains Gross job losses Year 3 months ended Net change(2) Total Expanding Opening Total Contracting Closing establishments establishments establishments establishments 2002 March June September December March June September December March June September December March June September December March June September December March June September December March June September December March June September December March June September December March June September December March June September (1) The rates measure gross job gains and gross job losses as a percentage of the average of the previous and current quarter employment levels. (2) See footnote 1, table 1. 13
18 Table 3. Number of private sector establishments by direction of employment change, seasonally adjusted Puerto Rico Establishments gaining jobs Establishments losing jobs Year 3 months ended Net change(1) Total Expanding Opening Total Contracting Closing establishments establishments establishments establishments 2002 March ,098 7, ,009 7,721 1,288 June ,405 7, ,434 8,048 1,386 September ,212 7, ,990 7,511 1,479 December ,176 7, ,455 7,343 1, March ,716 7, ,824 7,629 1,195 June -1,113 7,639 7, ,750 7,457 1,293 September -1,289 7,561 7, ,544 6,996 1,548 December 7,313 14,632 7,077 7,555 7,224 6, March 207 9,453 8,269 1,184 9,383 8, June ,568 8,377 2,191 9,511 8,369 1,142 September ,129 8,474 1,655 9,971 8,735 1,236 December ,237 8,950 1,287 9,234 7,936 1, March ,170 8,460 1,710 10,280 8,946 1,334 June ,686 8,995 1,691 10,169 8,839 1,330 September ,492 8,800 1,692 10,549 9,140 1,409 December ,339 9,103 1,236 9,952 8,656 1, March ,840 8,592 1,248 10,850 9,339 1,511 June 136 9,752 8,257 1,495 11,231 9,872 1,359 September -1,313 10,306 8,922 1,384 11,990 9,293 2,697 December ,359 9,460 1,899 10,709 8,475 2, March ,075 8,278 1,797 11,725 9,602 2,123 June 21 10,423 8,398 2,025 11,344 9,340 2,004 September ,463 8,411 2,052 11,040 9,206 1,834 December ,590 8,952 1,638 10,340 8,459 1, March ,573 7,579 1,994 11,995 9,786 2,209 June -57 9,831 7,828 2,003 11,318 9,258 2,060 September ,215 7,844 1,371 10,776 9,055 1,721 December ,071 8,396 1,675 10,374 8,368 2, March ,284 6,527 1,757 11,934 9,617 2,317 June ,707 7,037 1,670 10,559 8,714 1,845 September 246 9,221 7,353 1,868 10,179 8,557 1,622 December ,789 8,081 1,708 9,401 7,551 1, March ,381 6,903 1,478 10,787 8,959 1,828 June ,675 7,362 1,313 10,084 8,341 1,743 September ,975 7,492 1,483 9,651 8,007 1,644 December ,914 8,456 1,458 8,834 7,186 1, March ,703 7,298 1,405 10,375 8,725 1,650 June ,695 7,307 1,388 9,684 7,935 1,749 September -28 8,988 7,491 1,497 9,133 7,608 1,525 December 272 9,842 8,212 1,630 8,472 7,114 1, March ,584 7,143 1,441 10,187 8,584 1,603 June -73 9,522 8,110 1,412 8,989 7,504 1,485 September 213 9,543 7,920 1,623 9,043 7,633 1,410 (1) Net change is the difference between the number of opening establishments and the number of closing establishments. 14
19 Table 4. Private sector establishments by direction of employment change, as a percent of total establishments(1), seasonally adjusted. (Percent) Establishments gaining jobs Establishments losing jobs Year 3 months ended Net change(2) Total Expanding Opening Total Contracting Closing establishments establishments establishments establishments 2002 March June September December March June September December March June September December March June September December March June September December March June September December March June September December March June September December March June September December March June September December March June September (1) The rates measure establishments gaining or losing jobs as a percentage of the average of the previous and current quarter total number of establishments. (2) See footnote 1, table 3. 15
20 16
21 17
22 Table 7. Private sector gross job gains as a percent of total employment by state, seasonally adjusted. Gross job gains as a percent of employment Gross job losses as a percent of employment (3 months ended) (3 months ended) State Sept. Dec. March June Sept Sept. Dec. March June Sept United States Alabama Alaska Arizona Arkansas California Colorado Connecticut Delaware District of Columbia Florida Georgia Hawaii Idaho Illinois Indiana Iowa Kansas Kentucky Louisiana Maine Maryland Massachusetts Michigan Minnesota Mississippi Missouri Montana Nebraska Nevada New Hampshire New Jersey New Mexico New York North Carolina North Dakota Ohio Oklahoma Oregon Pennsylvania Rhode Island South Carolina South Dakota Tennessee Texas Utah Vermont Virginia Washington West Virginia Wisconsin Wyoming Puerto Rico Virgin Islands NOTE: Totals for the United States do not include data for Puerto Rico or the Virgin Island. 18
23 Prepared by: Yilda Rivera Rosado Economist IV QCEW Program Research and Statistics Division Prudencio Rivera Martínez Building Muñoz Rivera Ave. 505 San Juan PR Phone. (787) ext Fax. (787) Technical Information: (202) Media Contact: (202)
Government of Puerto Rico Department of Labor and Human Resources Bureau of Labor Statistics BUSINESS EMPLOYMENT DYNAMICS: FOURTH QUARTER
 Government of Puerto Rico Department of Labor and Human Resources Bureau of Labor Statistics BUSINESS EMPLOYMENT DYNAMICS: FOURTH QUARTER 2011 TABLE OF CONTENTS Introduction.1 Business Employment Dynamics:
BUSINESS EMPLOYMENT DYNAMICS
 BUSINESS EMPLOYMENT DYNAMICS First Quarter 2018 Office of Research Kurt Westby, Commissioner Andrew Condon, Director of Research WETHERSFIELD, November 7th, 2018 - (BED) data published quarterly by the
: Geocode File - Census Tract, Block-Group and Block. Codebook
 196815: Geocode File Census Tract, BlockGroup and Block Codebook Number of Variables 15 Friday June 17 8:49 AM 196815: Geocode File Census Tract, BlockGroup and Block RLS1 "RELEASE NUMBER" NUM(1.) Release
Is the scanned image stored as a color, grayscale, or black and white image? If applicable, what resolution is used?
 Topic: Trademarks, Trade names, Service marks Question by: Mandy Harlan/LA s IT staff Jurisdiction: Louisiana Date: 25 August 2010 Jurisdiction Question(s) Manitoba Corporations Canada Alabama Alaska Arizona
Completeness of Birth Registration
 Vol. 33 A,S Completeness of Birth Registration in the United States in 1940 ROBERT F. LENHART, M.S.P.A. Chief, Vital Statistics Consulting Service, Division of Vital Statistics, Bureau of the Census, Suitland,
A Compendium of National Statistics on Women-Owned Businesses in the U.S. Executive Summary and Data Report
 A Compendium of National Statistics on Women-Owned Businesses in the U.S. Executive Summary and Data Report Prepared for National Women s Business Council September 2001 Table of Contents Introduction...1
2012 ACCE Industry Advisory Board Best Practices Positioning Your Firm After the Great Recession
 2012 ACCE Industry Advisory Board Best Practices Positioning Your Firm After the Great Recession 2012 FMI Corporation 0 The Great Recession 2012 FMI Corporation 1 FMI Corporation 2010 1 Market Truths You
THE 3905 CENTURY CLUB, INC POINT AWARD APPLICATION (AND SUBSEQUENT 1000-POINT INCREMENTS) (EACH BAND/MODE SEPARATELY) (NOT ENDORSABLE)
 (EACH BAND/MODE SEPARATELY) (NOT ENDORSABLE)") THE 3905 CENTURY CLUB, INC. 2000-POINT AWARD APPLICATION (AND SUBSEQUENT 1000-POINT INCREMENTS) (EACH BAND/MODE SEPARATELY) (NOT ENDORSABLE) The requirements for the 2000-Point Award are simple. You just
THE 3905 CENTURY CLUB, INC. 2000-POINT AWARD APPLICATION (AND SUBSEQUENT 1000-POINT INCREMENTS) (EACH BAND/MODE SEPARATELY) (NOT ENDORSABLE) The requirements for the 2000-Point Award are simple. You just
Recommended Citations
 Recommended Citations Entire set Kunkel, K., R. Frankson, J. Runkle, S. Champion, L. Stevens, D. Easterling, and B. Stewart (Eds.), 2017: State Climate Summaries for the United States. NOAA Technical Report
American Community Survey: Sample Design Issues and Challenges Steven P. Hefter, Andre L. Williams U.S. Census Bureau Washington, D.C.
 American Community Survey: Sample Design Issues and Challenges Steven P. Hefter, Andre L. Williams U.S. Census Bureau Washington, D.C. 20233 Abstract In 2005, the American Community Survey (ACS) selected
Event History Calendar (EHC) Between-Wave Moves File. Codebook
 Between-Wave Moves File. Codebook") 2325 Event History Calendar (EHC) BetweenWave Moves File Codebook Number of Variables 23 Thursday July 2 28 4:5 PM 2325 Event History Calendar (EHC) BetweenWave Moves File EHCV "RELEASE NUMBER" NUM(.)
2325 Event History Calendar (EHC) BetweenWave Moves File Codebook Number of Variables 23 Thursday July 2 28 4:5 PM 2325 Event History Calendar (EHC) BetweenWave Moves File EHCV "RELEASE NUMBER" NUM(.)
Employer Location file. Codebook
 232 Employer Location file Codebook Number of Variables 2 Wednesday July 8 28 :9 PM 232 Employer Location file EMPV "RELEASE NUMBER" NUM(.) Release number Release : 7/28, SAS proc geocode and proc ginside
Entropy Based Measurement of Geographic. Concentration in U.S. Hog Production. Bryan J. Hubbell FS January 1997
 Entropy Based Measurement of Geographic Concentration in U.S. Hog Production Bryan J. Hubbell FS-97-02 January 1997 Bryan Hubbell is an Assistant Professor in the Department of Agricultural and Applied
2019 OXFORD EWE LAMB FUTURITY (Sponsored by the American Oxford Sheep Association, Inc.)
") 2019 OXFORD EWE LAMB FUTURITY (Sponsored by the American Oxford Sheep Association, Inc.) The American Oxford Sheep Association, Inc. ( AOSA ) is sponsoring its 10th annual ewe lamb youth futurity program
2019 OXFORD EWE LAMB FUTURITY (Sponsored by the American Oxford Sheep Association, Inc.) The American Oxford Sheep Association, Inc. ( AOSA ) is sponsoring its 10th annual ewe lamb youth futurity program
2008 Statistics and Projections to the Year Preliminary Data
 2008 Statistics and Projections to the Year 2025 2009 Preliminary Data Presented at the 92nd Annual Convention Honolulu, Hawaii August 4-7, 2010 Updated October 2010 Prepared by: Market Research & Statistics
Toward A Stronger and More Resilient
 Toward A Stronger and More Resilient U.S.- Relationship 1 The unshakable U.S.- Alliance is the cornerstone of peace, prosperity, and freedom in the Asia-Pacific region. [The leaders of and the States]
Birding in the United States: A Demographic and Economic Analysis
 U.S. Fish & Wildlife Service Birding in the United States: A Demographic and Economic Analysis Addendum to the 2006 National Survey of Fishing, Hunting, and Wildlife-Associated Recreation Report 2006-4
UNITED STATES. United We Stand Flag Stamp EDNA FERBER DIE CUT X ON 34 C. Washington. Self-Adhesive Booklet Stamps
 United We Stand Flag Stamp Distinguished Americans SELF-ADHESIVE BOOKLET STAMP DIE CUT 10.50 X 10.75 ON 2 OR 3 SIDES EDNA FERBER 83 C Regular Stamp Washington Self-Adhesive Booklet Stamps PERFORATED 11.25
Index Public Library Funding & Technology Access Study,
 Index Public Library Funding & Technology Access Study, 2010-2011 Discussions of urban, suburban, or rural libraries in the summary sections are indexed. Additional data for all types of metropolitan status
California Public-Safety Radio Association
 Association Orientation Note: This slide presentation is timed to run automatically. Or, you may press the Left or Right arrow keys to change slides. Thank You! CPRA is the Southern California chapter
Population Studies. Steve Davis Department of Family Medicine, Box G Brown University Providence, RI
 Population Studies The Hooded Merganser A Preliminary Look at Growth in Numbers in the United States as Demonstrated in the Christmas Bird Count Database Steve Davis Department of Family Medicine, Box
Click here for PIF Contacts (national, regional, and state level) The Partners in Flight mission is expressed in three related concepts:
 The Partners in Flight mission is expressed in three related concepts:") [Text Links] Partners in Flight / Compañeros en Vuelo / Partenaires d Envol was launched in 1990 in response to growing concerns about declines in the populations of many land bird species. The initial
[Text Links] Partners in Flight / Compañeros en Vuelo / Partenaires d Envol was launched in 1990 in response to growing concerns about declines in the populations of many land bird species. The initial
Birding in the United States: A Demographic and Economic Analysis
 U.S. Fish & Wildlife Service Birding in the United States: A Demographic and Economic Analysis Addendum to the 2011 National Survey of Fishing, Hunting, and Wildlife-Associated Recreation Report 2011-1
State Capitals Directions:
 State Capitals Directions: Using the word bank of state capitals below, match the capitals to their state. Hint: Use a map of the United States to help you locate the capitals. State Capitals Albany -
Guidelines: Logos & Taglines L O G O S & G U I D E L I N E S
 L O G O S & G U I D E L I N E S Guidelines: Logos & Taglines 2018 This guide will help you learn how to leverage the Smithsonian brand by using the Smithsonian Affiliate logos and taglines. In addition
Volume Title: Producer Dynamics: New Evidence from Micro Data. Volume Author/Editor: Timothy Dunne, J. Bradford Jensen, and Mark J.
 This PDF is a selection from a published volume from the National Bureau of Economic Research Volume Title: Producer Dynamics: New Evidence from Micro Data Volume Author/Editor: Timothy Dunne, J. Bradford
Pamela Amick Klawitter, Ed.D. Author
 Editor Eric Migliaccio Managing Editor Ina Massler Levin, M.A. Editor-in-Chief Sharon Coan, M.S. Ed. Illustrator Ken Tunell Cover Artist Lesley Palmer Art Coordinator Kevin Barnes Imaging Ralph Olmedo,
STATE AGENCIES FOR SURPLUS PROPERTY
 SUPP 1 DoD 4160.21-M STATE AGENCIES FOR SURPLUS PROPERTY ALABAMA CALIFORNIA Surplus Division California State for 4401 Northern By-Pass Surplus P.O. BOX 210487 701 Burning Tree Road Montgomery, AL 36121-0487
p(s) = P(1st significant digit is s) = log )
 = P(1st significant digit is s) = log )") Math 3070 1. Treibergs Benfords Law: Counting Frequencies and Chi-Squared Test of Proportion. Name: Example June 27, 2011 This example is pure numerology! You may suspend your credulity for this one! If
Math 3070 1. Treibergs Benfords Law: Counting Frequencies and Chi-Squared Test of Proportion. Name: Example June 27, 2011 This example is pure numerology! You may suspend your credulity for this one! If
Display Advertising Networks - National Rate Sheet
 Alabama 2x2 $1,000 127 893,708 Monday, 5pm North 2x2 $400 46 393,125 Central 2x2 $400 40 302,717 South 2x2 $400 41 197,866 2x2-2 regions $750 Retail Network 2x3: 1 region $600, 2 regions, $1,100, statewide
A domestic address must contain the following data elements:
 ADDRESS EDITS FOR FILE MAINTENANCE ATTACHMENT TO SERVICE REQUEST #16941 FINAL 1.0 INTRODUCTION There are minimal edits in the Payroll/Personnel System (PPS) for employee address formatting which is causing
2019 Calendar of Important Dates for Broadcasters 1
 1800 M S TREET, NW S UITE 800N W ASHINGTON, DC 20036 T EL 202.783.4141 F AX 202.783.5851 WWW. W BKLAW. COM January 30, 2019 2019 Calendar of Imptant Dates f Broadcasters 1 Another year has begun, though
The Representation of Young Children in the American Community Survey
 The Representation of Young Children in the American Community Survey William P. O Hare The Annie E. Casey Foundation Eric B. Jensen U.S. Census Bureau ACS Users Group Conference May 29-30, 2014 This presentation
Manufacturing by the Numbers
 Manufacturing by the Numbers A Profile of New York s Manufacturing Sector by Jobs, Wages and Regional Impact By Ken Pokalsky, Vice President The Business Council of New York State, Inc. November 2018 Manufacturing
VECTOR SURVEILLANCE IN NEW JERSEY EEE and WNV CDC WEEK 23: June 1 to June 7, 2008
 VECTOR SURVEILLANCE IN NEW JERSEY EEE and WNV CDC WEEK 3: June 1 to June 7, Prepared by Lisa M. Reed, Scott Crans and Dina Fonseca at the Center for Vector Biology, Rutgers University. Supported by funding
PENTRUDER 8-20 HF 22KW/30HP WALL SAW (MAX BLADE DIAMETER - 79, WILL TAKE 39 BLADE OUT OF CUT) PART NUMBER DESCRIPTION DETAILS MSRP
 PART NUMBER DESCRIPTION DETAILS MSRP") PENTRUDER 8-20 HF 22KW/30HP WALL SAW (MAX BLADE DIAMETER - 79, WILL TAKE 39 BLADE OUT OF CUT) 582090 8-20 HF 30 HP WALL SAW BASE PACKAGE $97,745.00 8-20 HF WALL SAW BASE PACKAGE INCLUDES THE FOLLOWING
PENTRUDER 8-20 HF 22KW/30HP WALL SAW (MAX BLADE DIAMETER - 79, WILL TAKE 39 BLADE OUT OF CUT) 582090 8-20 HF 30 HP WALL SAW BASE PACKAGE $97,745.00 8-20 HF WALL SAW BASE PACKAGE INCLUDES THE FOLLOWING
A Hiring Engine: A Breakdown of the Job Openings in Manufacturing
 A Hiring Engine: A Breakdown of the Job Openings in By Chad Moutray, Ph.D., CBE In many ways, manufacturing in America has never been doing better. The National Association of Manufacturers quarterly Manufacturers
Transitional Collection
 Fabrics Our 100% nylon jacquard woven fabric is constructed for dependability and includes the perfect color choices for your office environment. Transitional Collection Tan Brown Red Cordovan GSA Contract
Our 100% nylon jacquard woven fabric is constructed for dependability and includes the perfect color choices for your office environment.
 Fabrics Our 100% nylon jacquard woven fabric is constructed for dependability and includes the perfect color choices for your office environment. Collection Tan Brown Red Cordovan GSA Contract #: GS-03F-BA014
Census Records. P. J. Smith
 Census Records P. J. Smith What is a census? Regularly occurring and official count of a particular population Apportioning Congressional representatives Apportioning taxes Provides statistics for planning
Basics of DMR Codeplug Programming A Primer for Ham Radio Operators new to the DMR world.
 Basics of DMR Codeplug Programming A Primer for Ham Radio Operators new to the DMR world. Table of Contents Introduction... 3 Step 1: Create your Contacts list... 3 Step 2: Add your Private Contacts...
Capital Street Business News Institutional Investors. FIG Media Corporation Institutional Investors
 Capital Street Business News Institutional Investors FIG Media Corporation Institutional Investors European and United States Investment Banker Limited Partner Shareholder Contracts Hiram R. Davis Founding
American Community Survey Accuracy of the Data (2014)
") American Community Survey Accuracy of the Data (2014) INTRODUCTION This document describes the accuracy of the 2014 American Community Survey (ACS) 1-year estimates. The data contained in these data products
American Community Survey Accuracy of the Data (2014) INTRODUCTION This document describes the accuracy of the 2014 American Community Survey (ACS) 1-year estimates. The data contained in these data products
Missouri Economic Indicator Brief: Manufacturing Industries
 Missouri Economic Indicator Brief: Manufacturing Industries Manufacturing is a major component of Missouri s $293.4 billion economy. It represents 13.1 percent ($38.5 billion) of the 2015 Gross State Product
DATA EXPRESSION AND ANALYSIS
 NAME Lab Day DATA EXPRESSION AND ANALYSIS LABORATORY 1 OBJECTIVES Understand the basis of science and the scientific method. Understand exponents and the metric system. Understand the metric units of length,
any questions I had after the job was done, they didn't just vanish after the bill was paid. To edit this sidebar, go to admin backend's.
 Cal painters quizno santa monica california Best Painters in Santa Monica, CA - Dream Painter Santa Monica, Steve Roddey Painting & Decorating, Casa Painting Services, CertaPro Painters of Santa. Hire
Dowel Bar Standardization. NC^2 Fall Meeting St. Louis, MO
 Dowel Bar Standardization 2001 Universal Basket Continuation of discussion from NC^2 Spring meeting Results of Dowel Bar Questionnaire Results of Dowel Bar Questionnaire Dowel Bar Diameters 6.0" 6.5" 7.0"
2O2O WOMEN ON BOARDS GENDER DIVERSITY INDEX
 2O2O WOMEN ON BOARDS GENDER DIVERSITY INDEX 2018 Progress of Women Corporate Directors by Company Size, State and Industry Sector BOARDROOM DIVERSITY: A STRATEGIC IMPERATIVE WHAT IS THE GENDER DIVERSITY
2008 Great Lakes Dunes
 2008 Great Lakes Dunes Red Fox Spotted Sandpiper Tiger Beetle White-footed Mouse Red Admiral Butterfly 2008 Great Lakes Dunes Vesper Sparrow Piping Plover Eastern Hognose Snake Common Mergansers Piping
Saving Lives and Saving Money: Transforming Health in the 21 st Century to Achieve 100% Insurance Coverage
 Saving Lives and Saving Money: Transforming Health in the 21 st Century to Achieve 100% Insurance Coverage Newt Gingrich Founder The Center for Health KEYS TO REAL CHANGE Doing more of what you are already
Practice - Simulations with a Random Digit Table Answers 1. A club contains 33 students and 10 faculty members. The students are: Aisen DuFour
 Practice - Simulations with a Random Digit Table Answers 1. A club contains 33 students and 10 faculty members. The students are: Aisen DuFour Kittaka May Rokop Thyen Albrecht Dwivedi Kuhn MacDonald Sommer
U.S. OIN. Digest. quarters. A Guide to Current Market Values
 C U.S. OIN Digest quarters A Guide to Current Market Values Copyright 2017 F+W Media, Inc. Published by Krause Publications, a division of F+W Media, Inc. F+W, a content + ecommerce company, strives to
State Profiles of America s High- Growth Companies
 The Ascent of America s High-Growth Companies State Profiles of America s High- Growth Companies State-by-state analysis of Inc. 500 firms over thirty years Yasuyuki Motoyama and Brian Danley September
Size of California s economy US$ trillions, 2009
 Size of California s economy US$ trillions, 2009 Rank Country Gross domestic product 1 United States 14 2 Japan 5.1 3 China 4.9 4 Germany 3.3 5 France 2.6 6 United Kingdom 2.2 7 44 Italy 2.1 8 California
Epinephrine Salts Medicinal Nitroglycerine P & U Listed Syringe Waste. Epinephrine Salts. Medicinal Nitroglycerine
 Epinephrine Salts Medicinal Nitroglycerine P & U Listed Syringe Waste Following is a list of each state and whether or not they are consistent with the EPA s stance on Epinephrine Salts, Medicinal Nitroglycerine
American Heritage Library and Museum
 American Heritage Library and Museum ons of the Revolution Building 600 outh Central Avenue, Glendale, CA 91204 (818) 240-1775 TIP FOR UING THE LIBRARY The American Heritage Library, in Glendale, California,
TRAFFIC SYSTEM OPERATOR BASIC FAMILIARIZATION
 TRAFFIC SYSTEM OPERATOR BASIC FAMILIARIZATION Training for REACT Traffic System Operators and Users This is a new REACT course designed to provide basic information needed by members who volunteer to serve
Your Ancestors War Story From Beginning to End RootsTech 201. Anne Gillespie Mitchell
 Your Ancestors War Story From Beginning to End RootsTech 201 Anne Gillespie Mitchell Which wars were your ancestors in? It is not enough to find the record Build the Framework Use census records and vital
Profile of the British Columbia High Technology Sector: 2013 Edition
 Profile of the British Columbia High Technology Sector: 2013 Edition PREPARED FOR THE MINISTRY OF TECHNOLOGY, INNOVATION AND CITIZENS SERVICES BY BC STATS APRIL 2014 Authors: Dan Schrier, Lillian Hallin
RESOURCE DIRECTORY. ALABAMA / Alabama 811 / Website:
 Informational purposes only. Information and laws are subject to change. Consult your local One Call Center website for updated information. Infrastructure Resources, LLC attempted to verify all information
State Population Yes No.Alabama 4,822,023 2 Alabama: Sessions (R-AL), Nay.Alaska 731,449 2 Alaska: Begich (D-AK), Nay.Arizona 6,553, Arizona:
, Nay.Alaska 731,449 2 Alaska: Begich (D-AK), Nay.Arizona 6,553, Arizona:") State Population Yes No.Alabama 4,822,023 2 Alabama: Sessions (R-AL), Nay.Alaska 731,449 2 Alaska: Begich (D-AK), Nay.Arizona 6,553,255 1 1 Arizona: Flake (R-AZ), Nay.Arkansas 2,949,131 2 Arkansas: Boozman
State Population Yes No.Alabama 4,822,023 2 Alabama: Sessions (R-AL), Nay.Alaska 731,449 2 Alaska: Begich (D-AK), Nay.Arizona 6,553,255 1 1 Arizona: Flake (R-AZ), Nay.Arkansas 2,949,131 2 Arkansas: Boozman
THE POLITICAL ECONOMY OF FINANCIAL REGULATION: EVIDENCE FROM U.S. STATE USURY LAWS IN THE 19TH CENTURY
 THE POLITICAL ECONOMY OF FINANCIAL REGULATION: EVIDENCE FROM U.S. STATE USURY LAWS IN THE 19TH CENTURY Efraim Benmelech, Harvard Economics and NBER Tobias J. Moskowitz, University of Chicago GSB and NBER
THE 2016 STATE OF WOMEN-OWNED BUSINESSES REPORT
 THE 2016 STATE OF WOMEN-OWNED BUSINESSES REPORT Commissioned by American Express OPEN A Summary of Important Trends, 2007-2016 INTRODUCTION This publication marks our sixth annual exploration and analysis
Getting Started on HF
 Getting Started on HF Part 3 Contesting Al Walters K5NOF k5nof@arrl.net Director Kendall Amateur Radio Society 2/8/2019 KARS 1 Contesting Contesting in General Why? To improve operator proficiency and
Law Firm Schedule-at-a-Glance
 Law Firm Schedule-at-a-Glance Tuesday February 20 6:00 p.m. 7:30 p.m. Alston & Bird Welcome Reception Wednesday February 21 7:30 a.m. 5:30 p.m. Registration 8:30 a.m. 10:45 a.m. Law Firm Pro Bono 101 11:00
The Unexpectedly Large Census Count in 2000 and Its Implications
 1 The Unexpectedly Large Census Count in 2000 and Its Implications Reynolds Farley Population Studies Center Institute for Social Research University of Michigan 426 Thompson Street Ann Arbor, MI 48106-1248
Contents. Illustrations
 Copyright IDSA 2001 Contents Executive Summary 3 1.0 Introduction 4 2.0 Direct Effects of Consumer Demand for Computer and Video Games 6 2.1 Sectors and Industries Directly Affected and Included 6 Information
Technology, Workforce and the DFW Business Climate: A Review and Critique of Recent Assessments
 Technology, Workforce and the DFW Business Climate: A Review and Critique of Recent Assessments Prepared for the North Texas Commission By Bernard L. Weinstein, Ph.D. and Terry L. Clower, Ph.D. Center
Lowndes County by the Numbers
 Lowndes County by the Numbers How Do We Compare With Peer and Aspirant Communities? 2011 Report DRAFT 05/06/2011 Insert a collage of blended pictures from around Valdosta This report has been prepared
MERGENT PRINT PRODUCTS
 2019 Print Catalog Table of Contents Mergent Print Products...Page 2 Hoover s Print Products.....Page 6 Harris Print Products....Page 7 Nielsen Print Products....Page 10 Dun & Bradstreet Print Products...Page
Aggregates & Finishes for Spun Cast Concrete Poles
 ggregates & Finishes for Spun Cast Concrete Poles We offer a variety of pole designs and styles in an assortment of shapes, colors, textures and finishes that are perfect for any application or environment.
ITEM 1981 PRICE OCTOBER 2007 % CHANGE
 Volume 24 No. 4 2007 C.W. Publications December 2007 Is Inflation Back? The Declining Dollar A Taxing Weekend Politics and Money Career Corner The last major inflationary spiral in the United States was
VITAL STATISTICS OF THE UNITED STATES: MORTALITY, 1999 TECHNICAL APPENDIX ACKNOWLEDGMENTS
 ACKNOWLEDGMENTS The technical appendix preparation was coordinated by Sherry L. Murphy in the Division of Vital Statistics under the general direction of Harry M. Rosenberg, Special Assistant for International
Visit AGFS Website at http//:
 MUNICIPAL SECURITIES EXPERIENCE HIGHLIGHTS Visit Website at http//:www.agfs.com/ Robert Doty provides municipal bond expert witness and litigation consulting services. Mr. Doty is President and Proprietor
Taking the Measure of St. Louis
 Taking the Measure of St. Louis The views expressed here are those of the speakers and do not necessarily represent the views of the Federal Reserve Bank of St. Louis or of the Federal Reserve System.
Fairfax County: Five Major Forces Shaping Its Economic Evolution
 Fairfax County: Five Major Forces Shaping Its Economic Evolution Stephen S. Fuller, Ph.D. The Dwight Schar Faculty Chair and University Professor Director, The Stephen S. Fuller Institute Schar School
HUMAN FERTILITY DATABASE DOCUMENTATION: U.S.A
 HUMAN FERTILITY DATABASE DOCUMENTATION: U.S.A Authors: Ward Kingkade 1201 Belle View Boulevard, Alexandria, Virginia, 22307, USA E-mail: WWardKingkade@gmail.com Aiva Jasilioniene Max Planck Institute for
Dowel Bar Standardization. NC^2 Spring Meeting Savannah, GA
 Dowel Bar Standardization NC^2 Spring Meeting Savannah, GA Dowel Bar Task Force Maria Masten, Minnesota DOT Mark Snyder, ACPA Pennsylvania Matt Zeller, Concrete Paving Association of Minnesota Tom Cackler,
State. Alabama Best Companies to Work for in Alabama Registration Month: March
 State Alabama Best Companies to Work for in Alabama www.bestcompaniesal.com Arizona CareerBuilder Top Companies to Work for in Arizona www.topcompaniesarizona.com Arkansas Best Places to Work in Arkansas
I _j<l _xl --x2- -^ -^ - XJL --
 Name 2 3 4 5 6 Score Multiplication Facts: Factors 0-9 Tast 7 x t 9 4 3 A _x_l ->
Removing Duplication from the 2002 Census of Agriculture
 Removing Duplication from the 2002 Census of Agriculture Kara Daniel, Tom Pordugal United States Department of Agriculture, National Agricultural Statistics Service 1400 Independence Ave, SW, Washington,
b2b 2013 cylinders 1 jars 2-3 containers 4-8 votives 9 lids 10 hydration/diffusers 11 customizing processes 12 special production index 15-16
 B2B contents b2b 2013 cylinders 1 jars 2-3 containers 4-8 votives 9 lids 10 hydration/diffusers 11 customizing processes 12 special production 13-14 index 15-16 ALL PRODUCT NAMES, CONFIGURATIONS AND ITEM
2017 Print Catalog. Table of Contents
 2017 Print Catalog Table of Contents Mergent Print Products Hoover s Print Products. Harris Print Products.. Nielsen Print Products Dun & Bradstreet Print Products.. Dun & Bradstreet Regionals.. Dun &
Ensuring an Accurate Count of the Nation s Latinos in Census 2020
 Ensuring an Accurate Count of the Nation s Latinos in Census 2020 February 15, 2018 Arturo Vargas Executive Director NALEO Educational Fund ARTICLE I, SECTION 2 Representatives and direct Taxes shall be
FEDERAL CENSUSES Collection title Number of records Year Site Comments 1790 United States Federal Census 406, MyHeritage
 FEDERAL CENSUSES Collection title Number of records Year Site Comments 1790 United States Federal Census 406,419 1790 MyHeritage US Census 1790 1790 FindMyPast United States Census, 1790 408,505 1790 FamilySearch
State. Indiana Best Places to Work in Indiana Registration Month: November
 State Alabama Best Companies to Work for in Alabama www.bestcompaniesal.com Arizona CareerBuilder Top Companies to Work for in Arizona www.topcompaniesarizona.com Arkansas Best Places to Work in Arkansas
Culiseta melanura and Eastern Equine Encephalitis. Current Weekly Mean. Historic Mean
 VECTOR SURVEILLANCE IN NEW JERSEY EEE, WNV, SLE and LAC Prepared by Lisa M. Reed, Scott Crans and Mark Robson Center for Vector Biology, Rutgers University CDC WEEK 26: June 26 to July 2, 2011 Data Downloaded
Italian Americans by the Numbers: Definitions, Methods & Raw Data
 Tom Verso (January 07, 2010) The US Census Bureau collects scientific survey data on Italian Americans and other ethnic groups. This article is the eighth in the i-italy series Italian Americans by the
KETs: A Competitive Advantage for Europe Presentation to IMCO Committee EP, Brussels, 20 March 2012
 KETs: A Competitive Advantage for Europe Presentation to IMCO Committee EP, Brussels, 20 March 2012 Gabriel M. Crean, VP for Technology, CEA Technology, CEA Chair HLG KET Sherpa Group 1 Outline Message
Valley View Coins & Collectibles
 Cat Vol 20 #6 Vol 21 #1-3_new 10/27/2017 3:20 PM Page 1 AG G VG F VF XF 1857 14.95 29.50 44.75 47.50 57.50 154.50 1858SL 14.95 29.50 44.75 56.50 62.50 154.50 1858LL 14.95 29.50 46.50 56.50 62.50 159.50
Land That I Love by Krista Hamrick / #80083 / 54 Designs
 by Krista Hamrick / #80083 / 54 Designs Note: Some designs in this collection may have been created using unique special stitches and/or techniques. To preserve design integrity when rescaling or rotating
New Approaches and Methods for the 1950 Census of Agriculture
 6 AGRICULTURAL ECONOMICS RESEARCH A Journal of Economic and Statistical Research in the Bureau of Agricultural Economics and Cooperating Agencies Volume III OCTOBER 1951 Number 4 New Approaches and Methods
Brown Sugar: Deriving Satisfaction through Data Analysis
 Brown Sugar: Deriving Satisfaction through Data Analysis By: Anirban Basu Sage Policy Group, Inc. August 16 th, 2018 On Behalf of The Association of Union Constructors Summer Summit Disclaimer: Any resemblance
Polling Question 1: What is the most important issue for job creation in California?
 Polling Question 1: What is the most important issue for job creation in California? 1. Improving state s regulatory climate 2. Increasing access to credit for small businesses 3. Retaining talent / developing
Quick Reference Guide
 U.S. Census Bureau Revised 07-28-13 Quick Reference Guide Demographic Program Comparisons Decennial Census o Topics Covered o Table Prefix Codes / Product Types o Race / Ethnicity Table ID Suffix Codes
Department of Veterans Affairs Technology Transfer Program. John J. Kaplan, PhD, JD Director, Technology Transfer Program
 Department of Veterans Affairs Technology Transfer Program John J. Kaplan, PhD, JD Director, Technology Transfer Program Technology Transfer The commercialization of inventions and discoveries made by
NEWS RELEASE FOR WIRE TRANSMISSION: 8:30 A.M. EDT, FRIDAY, APRIL 17, William Zeile: (202) BEA 09-14
 BEA 09-14") NEWS RELEASE FOR WIRE TRANSMISSION: 8:30 A.M. EDT, FRIDAY, APRIL 17, 2009 William Zeile: (202) 606-9893 BEA 09-14 Summary Estimates for Multinational Companies: Employment, Sales, and Capital Expenditures
NEWS RELEASE FOR WIRE TRANSMISSION: 8:30 A.M. EDT, FRIDAY, APRIL 17, 2009 William Zeile: (202) 606-9893 BEA 09-14 Summary Estimates for Multinational Companies: Employment, Sales, and Capital Expenditures
Pick 3 Lottery 7 DAY NUMBERS-18. Numbers Good for the Week of Jan 17 Jan 23 (2016) AANewYork
 AANewYork") 1 Pick 3 Lottery 7 DAY NUMBERS-18 Numbers Good for the Week of Jan 17 Jan 23 (2016) AANewYork There were 47 Summary Report hits in Book 18. I thought it would be very interesting to see where these hits
1 Pick 3 Lottery 7 DAY NUMBERS-18 Numbers Good for the Week of Jan 17 Jan 23 (2016) AANewYork There were 47 Summary Report hits in Book 18. I thought it would be very interesting to see where these hits
KETs: A Competitive Advantage for Europe
 KETs: A Competitive Advantage for Europe and its Regions Seminar on Smart Specialisation Lisbon, 19 April 2012 Gabriel M. Crean, VP for Technology, CEA Technology, CEA 1 Outline Message 1 KETs are crucial
1 NOTE: This paper reports the results of research and analysis
 Race and Hispanic Origin Data: A Comparison of Results From the Census 2000 Supplementary Survey and Census 2000 Claudette E. Bennett and Deborah H. Griffin, U. S. Census Bureau Claudette E. Bennett, U.S.