Summer 2007 I2T2 Process Page 2.
|
|
|
- Melina Marsh
- 5 years ago
- Views:
Transcription


1
2 Summer 2007 I2T2 Process Page 2. PR1 Virtual Manipulatives... 3 Grapher... 4 Color Chip Subtraction... 5 Algebra Balance Scale... 6 Function Machine... 7 Algebra Tiles... 8 PR2 TI Connect... 9 IT Website How to Get Real Data Into An Excel File IBM Version Data Editor TI Connect Sending List variables to the device TI Connect For OSX MAC To Update Your Calculator To Add an application manually Typing into a list Screen Capture with TI Device Explorer PR3 & PR4 CBR Activities Transformation Application fro the TI-83 or TI The Bouncing Ball WALK THE LINE Ball Bounce Ratio Activity PR5 High School Apps Transferring Items from TI 83+ & TI 84 Using a Unit-to-Unit Link Cable Inequalities APPS Transformation APPS APPS Probability Simulation Conics APPS Algebra APPS Test Guard Finance Apps PR6 GAMES WITH STRINGS The String Game String Game Analysis # String Game Analysis # String Game Analysis # Game Pieces and String Cards The String Game with Numbers (Version C) Three Strings The String Game with Special Scoring Rules (Version D) PR7 Middle School Apps Between a Rock and a Hard Place Can You Find my Marbles? Using the Probability Simulation APP: Can You Find my Marbles? PR8 Math Websites PR9 Problem Solving on the TI
3 Summer 2007 I2T2 Process Page 3. PR1 Virtual Manipulatives Virtual Manipulatives Circle O: challenging game where you try to make everything add up to zero; good adding integer practice Factor Tree: you complete a factor tree and find GCF and LCM Fraction Adding: adding fraction practice Fraction Comparing: comparing and ordering fractions Fraction Equivalent: finding equivalent fractions Grapher: good demonstration of slope and y-intercept (I have included a little worksheet my students use with this.) Number Line Bounce: uses arrow diagrams to practice adding and subtraction integers. (Good to use after numline on the TI-73) Percentage: helps you compute the part, whole, or percent with a visual representation Sieve of Eratoshenes: can be used to find multiples of numbers or the prime numbers from 1 to 200 Spinner: creates spinners Turtle: allows you to draw diagrams like the old LOGO programs Algebra Tiles: multiplies polynomials Function Machine: practice with patterns Transformations-Dilations: allows you to create a shape and an image and change both size and position Transformations-Reflection: demonstrates the properties of reflections Transformations-Rotation: shows rotation of figures Box Plot: allows you to demonstrate how a data entry changes a box plot or to create box plots from data Scatterplot: allows you to plot points and creates a line of best fit
4 Summer 2007 I2T2 Process Page 4. Grapher Use the National Library of Virtual Manipulatives to do this activity. Under Grades 6 8, open Grapher by clicking on the icon. Next to f(x) = enter 2x, then hit enter or the graph button on the screen Click on the functions tab. Click on g(x) Enter g(x) = 2x + 3, graph it Click h(x) Enter h(x) = 2x - 1, graph it Complete these questions on a lined sheet of paper. 1. At the value for x = 0, find f(x), g(x), and h(x)? 2. Examine the 3 graphs carefully. Describe what is similar about the 3 lines? What is different about them? 3. Change the coefficient of 2 in each line to -1 and graph these 3 lines. Do the relationships you observed in the first set of graphs still hold? Explain. Now create the graphs for x + 3, 3x + 3, and -2x At the value for x = 0, find f(x), g(x), and h(x)? 5. Examine the 3 graphs carefully. Describe what is similar about the 3 lines? Different? 6. Change the number 3 in each line to -2 and graph these 3 lines. What do you think the -2 in this set and the 3 in the previous set indicate? 7. What does the coefficient of each function represent?
5 Summer 2007 I2T2 Process Page 5. Color Chip Subtraction Use the National Library of Virtual Manipulatives to complete this activity. Under Grades 6 8, open Color Chip Subtraction by clicking on the icon. You will have create, record, and solve 10 integer subtraction problems using this application A. Describe the situations where the absolute values of the numbers given were added together. B. Describe the situations where the absolute values of the numbers given were subtracted from each other. C. Write a rule or a set of rules to help you subtract integers without using color chips.
6 Summer 2007 I2T2 Process Page 6. Algebra Balance Scale Your goal in this lesson is to discover the value for x in each equation and to discover some helpful procedures. Use the National Library of Virtual Manipulatives to complete this activity. Under Grades 6 8, open Algebra Balance Scale by clicking on the icon. 1. Create the problem given on the scale than click continue. 2. Use the 4 functions to help isolate the variable. (Get your answer in the form x = a number.) 3. Write down the original equation and the steps you preformed. 4. Repeat these steps for a total of 5 equations. 5. Answer the following questions about your work. a. Why are the negatives represented as balloons? b. When you placed all negatives on the left side of the scale, which side was heavier? c. How did the scale appear when the equation was in balance? d. When you preformed the same operations to both sides of the equation, what happened to the balance? e. Did you and/or your group discover any steps, procedures, or short cuts that helped you complete the task? Explain.
7 Summer 2007 I2T2 Process Page 7. Function Machine Use the National Library of Virtual Manipulatives to complete this activity. Under Grades 6 8, open Function Machine by clicking on the icon. Drag the numbers 1 to 4 into the function machine. Record the results in the tables below. Look for patterns then fill in the remainder of the table. Complete the following questions. 1. State the patterns you observed. 2. Write the equations for the functions or explain how to generate your table of values. In Out In Out In Out In Out
8 Summer 2007 I2T2 Process Page 8. Algebra Tiles Use the National Library of Virtual Manipulatives to complete this activity. Under Grades 6 8, open Algebra Tiles by clicking on the icon. Use the algebra tile model by placing the factors to the problem on the outside of the rectangular work area. Fill in the correct rectangular array to represent the product. Record your product below. 1. (x + 1)(x + 2) = 2. (x + 3)(x + 5) = 3. (x + 2)(x + 2) = 4. (x + 2)(x + 3) = 5. Examine your products and describe any patterns you observe. Continue to use the model, but this time place the product into the center area as a rectangular away. Find the factors. 6. x 2 + 4x + 3 = 7. x 2 + 6x + 8 = 8. x 2 + 6x + 5 = 9. x 2 + 7x + 12 =
9 Summer 2007 I2T2 Process PR2 TI Connect Page 9.


10 Summer 2007 I2T2 Process Page 10.
11 Summer 2007 I2T2 Process Page 11.

12 Summer 2007 I2T2 Process Page 12.
13 Summer 2007 I2T2 Process Page 13.
14 Summer 2007 I2T2 Process Page 14.
15 Summer 2007 I2T2 Process Page 15. IT Website Steps: 1. Go to 2. Top click on Materials


16 Summer 2007 I2T2 Process Page 16. Materials by NYSED MST Standards by Workshop Schedule Past Projects Useful Websites Calculators 3. click by NYSED MST Standards ostate.edu/~it/materials/pr oba bility/ Materials List Uncertainty(Probability and Statistics) Students use ideas of uncertainty to illustrate that mathematics involves more than exactness when dealing with everyday situations. Estimation and probability are the major topics found in the key idea of uncertainty. Most probability concepts are found in this key idea as well as procedures for calculating probabilities. Although estimation includes number sense, estimating can be used as a problem-solving strategy. 4. Click Uncertainty(Probability and Statistics) html
17 Summer 2007 I2T2 Process Page 17. Statistics Real Life Data How to Converting Data on the Internet to an Excel File Data for Cities Activity Cimate Data Workshop 5. Choose any data you would like to transfer to your calculator from the Statistics Menu. Statistical Data for the Classroom U.S. Census Bureau This site has a listing of frequently requested tables. Uncle Sam's Reference Table This site has a statistical abstract of the United States. How to Get Real Data Into An Excel File IBM Version In your Browser, go to Excel Files Choose Real Life Data. Find some information. If the file has.xls at the end then it is an Excel file.


18 Summer 2007 I2T2 Process Page 18. It should look like a excel worksheet 1. Copy the data. 2. Open up excel and paste the data into your spreadsheet. 3. Adjust the columns and fix the data the way you wish the calculator to receive it. 4. Only copy numerical data no letters. 5. You must save this as an Excel file CVS file. Data Editor TI Connect 1. Open Data Editor in TI Connect. 2. Press new document. 3. Then a menu Variable Properties will pop up Select Calculator List L1 4. Open your excel worksheet and copy data from column.


19 Summer 2007 I2T2 Process Page Continue with steps 3 4 selecting L2, etc. until you have everything you want Sending List variables to the device To send one or more List variables to a device 1. Click the column header of the List you want to send to the device. Press and hold ctrl to select multiple Lists. 2. Click Actions > Send Selected Items. TI DataEditor sends the selected List(s) to the device connected to your computer. 3. To send all open List variables at one time Click Actions > Send All Lists. or Click Actions > Send All Open Items. Send All Lists sends only all open Lists. Caution: Do not unplug a USB cable during a transfer. Note: If you open your List from TI DeviceExplorer, you may receive an Out of Memory message when you try to send it back to the device. This occurs because the device was at its memory limit and the List data size became larger when it was loaded into the TI DataEditor.

20 Summer 2007 I2T2 Process Page 20. TI Connect For OSX MAC To Update Your Calculator You need a Free TI Account for this. Click on TI Update Click on SHOW FREE

21 Summer 2007 I2T2 Process Page 21. The blue is showing me that my operating system is out of date. If you see this you must do this first. Choose any applications you want to add and check the update and then click on the update button..


22 Summer 2007 I2T2 Process Page 22. To Add an application manually Start Device Explorer.. Drag the application you want to install into this window. This also works for lists, programs and any other TI objects.

23 Summer 2007 I2T2 Process Page 23. Typing into a list Double Click on the List you want to edit. You will get the message to bring up Data Editor. This is the program where you can edit information. This is the same for Matrices, Programs or any other TI Connect object. Click OK. Choose the Number of cell you want, and type in the entries.


24 Summer 2007 I2T2 Process Page 24. If you want to paste a number of entries in from and Excel sheet enter the number of cells then place the cursor in the first cell and do edit paste. Close the window by clicking on the red button, And choose the save option. It is saved to you calculator.


25 Summer 2007 I2T2 Process Page 25. Screen Capture with TI Device Explorer Click in the screen capture button and Choose Edit -> Copy as shown, Go to Word Choose : Edit-> Paste. Click on the picture to expose boxes to resize to your liking.

26 Summer 2007 I2T2 Process Page 26. PR3 & PR4 CBR Activities Using EasyData for CBL/CBR Apps The TI Exploration Series for CBR or CBL/CBR books, are all written for the old CBL/CBR Application. Now we can use an easier program call EasyData. New Instructions: 1. Run the EasyData Applications 2. Press Setup 3. 1:Dist here is where you change units from meter to feet. Notice most programs are written in meters. 4. Setup a. If you see Ball Bounce then choose number 4 or Distance Match choose 3 b. If you don t see Distance Match or Ball Bounce then pick Time Graph i. If the instructions say SET DEFAULTS then the program is needs to have 15 seconds. You need to Press Edit and change your Sample Interval (s): and Number of Samples: to the settings below. ii. If you see 1: SETUP/SAMPLE You must look at the time and adjust your Time Graph Setting: Choose 2. Note: (The Sample Interval) times (Number of Samples) = the needed Number of seconds for Experiment Length. Press Edit 1. Sample Interval (s) {usually anything from.1 to.05} 2. Number of Samples: {usually anything from 20 to 200} Examples for experiments given the Time below MAIN MENU REALTIME: 2 seconds 3 seconds 4 seconds 5 seconds NO TIME (S): 4 DISPLAY: DIS BEGIN ON: [ENTER] SMOOTHING: LIGHT UNIT: METERS START NOW Then say OK and press Start when you are ready to start the experiment
27 Summer 2007 I2T2 Process Page 27. Transformation Application fro the TI-83 or TI-84 Steps for Transformation Apps 1. Go to your APPS and select Transfrm. Use the upperward button to get to the end of the list. Press ENTER and you will see the following screen. Press ENTER and select 2:Install. 2. Press ENTER again and you will go back to the home screen. Press Y =, you will see the follow screen. Now when you press Y =, you will see that the left margin of this screen has changed. This change is so that you know that you are in Transformation APPS. You can only do one equation in this application. You must go back to Transformation APPS and 1:Uninstall Type in an equation in y1. Use Apha keys to type in the coefficients. 3. Press Window to show that this screen has changed as well. Arrow up to settings and use the down arrow until the cursor is flashing on A and then ENTER a value such as 1. Scroll down again until the cursor is flashing on B and ENTER a value such as 1. The step should be equal to how much you want each value to change each time. I used step =.2 4. Press the right or left cursor keys and watch the values of A and B change by each step value. Now you can match your equation to your data. 5. What did the changes do? By changing the values of A and B you change the slope and y-intercept and show how these changes make the graph of the line change. 6. The second row arrow are set up to do an animated slide show. You can set the increments and the number of slides you wish to show the movement of the function.
28 Summer 2007 I2T2 Process Page 28. The Bouncing Ball If a ball is dropped from a given height, what does a Height-Time graph look like? How does the velocity change as the ball rises and falls? What affects the shape of the graphs of both the height and the velocity? In this activity, you will graph the height of a ball versus time after it is dropped from some height. You will then examine one ball bounce and investigate the parameters that affect the shape of the graph. You will also explore the relationship between the height of the ball and the velocity. The relationship is expressed mathematically as: y = ax 2 + bx + c or y = a(x h) 2 + k YOU NEED: 1 CBR Unit or CBL and Motion Detector CBL/CBR APPS Transformation APPS Racquet ball
29 Summer 2007 I2T2 Process Page 29. Instructions: APPS application CBL/CBR. 1. Connect the Ranger to the Calculator 2. Go to APPS and find the EASYDATA 3. Setup 1:Dist here is where you change units from meter to feet. Notice most programs are written in meters. Choose Ball Bounce then choose number 4 4. When you are satisfied with your data, sketch a Distance-Time plot below. Your graph should have a minimum of five bounces. If you are not satisfied with the results of your experiment, press Start, and try again. When you have a good graph go to the Data Collection sheet and graph your graph. 5. Once you have good data appearing on the calculator. Exit the program by pressing QUIT. 6. Turn your plot on. Press 2 nd y = then zoom Now you need to select a parabola to analyze. a. With the plot displayed, press 2 nd Stat (List) > OPS and select 8:SELECT( b. ENTER where you want to store the selected data. To use L3 and L4, press 2 nd L3, 2 nd L4 ) ENTER a. b. 8. To actually select a part of the graph you will use, press arrow to move the left end of the data you want to keep. Press ENTER. This sets the left bound. Press arrow to move the right end of the data you want. Press ENTER. The selected data will be placed in L3, L4 and then this data will be displayed.
30 Summer 2007 I2T2 Process Page The CBL/CBR program leaves the data connected, press 2 nd STAT PLOT 1:PLOT1 and select the unconnected scatterplot option. 10. Go to your APPS and select Transfrm. Use the upward button to get to the end of the list. Press ENTER and you will see the following screen. Press ENTER and select 2:Install. 11. Press ENTER again and you will go back to the home screen. Press Y =, you will see the follow screen. Type in an equation in y1 (Note: the Transformation APPS can not use any other letters in the equation except A, B, C, D. Letter B = H and C = K in the original equation y = a(x h) 2 + k. ) 12. Go to window and settings and set A= -1 B = 0 C = 1 Step = Go back to the graph and change the A and B. You can use the right and left mouse arrows. You can always just go to the A or B or C and type in different values. 14. Once you have figured out A, B, and C go back to Transform APPS and uninstall the program.
31 Summer 2007 I2T2 Process Page 31. Name Data Collection Graph. 1. Graph your first graph of 5 or more bounces. Label your axis QUESTIONS: 1. The goal is to capture the data of one parabola. Use the TRACE-Right Arrow key to a point near the vertex of the single parabola you selected. Record this point in the table below. X coordinate = B value Vertex Y coordinate = C value 2. The ball bounced straight up and down beneath the detector, yet the plot seems to depict a ball that is bouncing sideways. Explain why this is so. 3. The model for the distance vs. time data is quadratic. Fit your data with a quadratic function in standard form: y = a( x b) 2 + c ( or y = a(x h) 2 + k ). Where b is the x-coordinate of the vertex, c is the y-coordinate of the vertex, and a is the constant. (Hint: the value is equal to the g value, which comes from the physics formula: s(t) = - ½g t 2 + v 0 t + s 0 where g = 32 feet per second or g = 9.8 in meters per second. Remember we choose feet in the ranger APPS) 4. Write and equation of the form y = A(x B) 2 + C. a. For the B value type in your x-coordinate from the vertex. b. For the C value type in your y-coordinate from the vertex. c. Now you need to find a constant A to experiment until you get the best fit. Equation: A= B = C =
32 Summer 2007 I2T2 Process Page Use the information obtained in # 4 above to write the equation in the form of y = ax 2 + bx + c (Remember to use foil) Equation: 6. To check your work, place both equation. a. Clear out the equation and type in y1 = type in your answer from question 4 b. In y2 = type in your answer from question 5 and go to the front of Y2 and change the type of graph to 0. This will show you the path of the equation and leave a trail. 7. The TI-83 or TI-84 has a built in feature that allows you to compute the best fitting quadratic equation through a set of data. This procedure is called a quadratic regression. The values you found for A and B can be tested using a built-in feature of the TI 83 that allows it to compute the best-fitting line through a set of data. To perform a quadratic regression on the data you collect, press STAT and select QuadReg to copy the command to the home screen. On the home screen type in L3, L4, vars then y vars then y2 Home screen: QuadReg L3, L4, Y3 Write your results here and make sure the diagnostic is turned on. Answers should be given in 4 decimal places. QuadReg Y = ax 2 + bx + c a = b = c = Go to the y = menu and in front of Y3 change the type of graph to 0 this will show the graph going over the plot. How do they compare the a, b and c in #5 from above? 8. Explain the role of the a in the equation y = ax 2 + bx + c.
33 Summer 2007 I2T2 Process Page 33. EXTENSION: Use the entire graph created at the beginning of the lab and curve fit piece-wise functions to the lab. Draw the graph and record your equation below. Check your work by graphing your restrictions. Y1 = Y2 = Y3 = Y4 = Y5 =
34 Summer 2007 I2T2 Process Page 34. WALK THE LINE When one quantity changes at a constant rate with respect to another, we say they are linearly related. Mathematically, we describe this relationship by defining a linear equation. In real-world applications, many quantities are linearly related and can be represented by using a straight-line graph. In this activity, you will create constant speed distance versus time plots using a CBR (CBL and motion detector), and then develop linear equations to describe these plots mathematically. YOU NEED: 1 CBR Unit or CBL and Motion Detector CBL/CBR APPS Transformation APPS

: and Number of Samples: to the settings below. 5. When you are satisfied with your data, sketch a Distance-Time plot below.")
35 Summer 2007 I2T2 Process Page 35. Instructions: APPS application CBL/CBR. 1. Connect the Ranger to the Calculator 2. Go to APPS and find the EASYDATA 3. Setup 1:Dist here is where you change units from meter to feet. Notice most programs are written in meters. 4. Choose Time Graph number 2 If the instructions say SET DEFAULTS then the program is needs to have 15 seconds. You need to Press Edit and change your Sample Interval (s): and Number of Samples: to the settings below. 5. When you are satisfied with your data, sketch a Distance-Time plot below. Your graph should have a section of straight line. If you are not satisfied with the results of your experiment, press Start, and try again. When you have a good graph go to the Data Collection sheet and graph your graph. 6. Once you have good data appearing on the calculator. Exit the program by pressing QUIT. 7. Turn your plot on. Press 2 nd y = then zoom 9. (a) In Plot 1, choose ON (b) Type: SCATTERPLOT (choice 1) (c) Xlist: L1 (d) Ylist L2 (e) Mark: 8. Go to your APPS and select Transfrm. Use the upward button to get to the end of the list. Press ENTER and you
36 Summer 2007 I2T2 Process Page 36. will see the following screen. Press ENTER and select 2:Install. 9. Press ENTER again and you will go back to the home screen. Press Y =, you will see the follow screen. Type in an equation in y1 10. Go to window and settings and set A= 0 B = 0 Step = Go back to the graph and change the A and B. You can use the right and left mouse arrows. Remember that downward slope is negative and upward slope is positive. You can always just go to the A or B and type in different values. 12. Once you have figured out A and B go back to Transform APPS and uninstall the program.
37 Summer 2007 I2T2 Process Page 37. Name Data Collection Graph your data and label your axis QUESTIONS: 1. The slope-intercept form of a liner equation is y = MX + B Where M is the slope or steepness of the line and B is the intercept or starting value. In this activity, the control variable, X, represents time and Y represents distance. Press TRACE and use the arrow keys on your calculator to move the cursor along your Distance versus Time plot. Identify the starting value (the Y-value when X = 0 ) and record this below as the intercept, B. B = 2. Go to the y = and type in y1 = Ax + B. A is equal to M the slope. You should see and A= number and B = number along with your graph. In the B= type in the number from question one. Now change the number in A until the line matches the graph of distance versus time. A = (slope) Write the equation in the form of slope intercept form y = mx + b (y = Ax + B) Equation Turn off the Transformation APPS. a. Go to the APPS menu and Transfrm then ENTER and then 1:Uninstall b. Clear out the equation and type in y1 = type in your answer from question 2 c. Check your answer compared to your graph.
38 Summer 2007 I2T2 Process Page Go to y = and turn the y1 equation off. (un-highlight the equals ) Press TRACE. Move along the plot with the arrow keys and identify two points (x1, y1) and (x2, Y2) and record them below. Try to pick the points so that they are not too close together. X1 Y1 X2 Y2 When the coordinates of two points on the dame line are know, the slope of the line can be Computed by finding the difference in y values divided by the difference of x values. y2! y1 slope = x! x below. 2 1 Use this formula to compute the slope of the linear plot and record the result Slope = How does this value compare with the value of A you found experimentally in question 2? 4. The values you found for A and B can be tested using a built-in feature of the TI 83 that allows it to compute the best-fitting line through a set of data. This procedure is called linear regression. To perform a linear regression on the data you collect, press STAT and select LinReg (ax + b) to copy the command to the home screen. On the home screen type in L1, L2, vars then y vars then y2 Home screen: LinReg (ax + b) L1, L2, Y2 Write your results here and make sure the diagnostic is turned on LinReg Y = ax + b a = b = r = Go to the y = menu and in front of Y2 change the type of graph to 0 this will show the graph going over the plot.
39 Summer 2007 I2T2 Process Page 39. Write your results from the A and B from question one and two to the a and b from this question. 5. Remember, slope is defined as change in y-values divided by change in x-values. Complete the following statement about slope for the linear data set you collected. In this activity, slope represents a change in by divided a change in. Based on this statement, what are the units of measurement for slope in this activity? 6. As mentioned earlier, the intercept value, B, can be interpreted as the starting position or the starting distance from the motion detector (ranger). What does the value of M represent physically? Hint: think about the units of measurement fro the slope you described in question 5. Lab was modified using Real World Math with Hands-On Look at Algebra Functions, CBL System and High School CBR books from Texas Instruments.
40 Summer 2007 I2T2 Process Page 40. Ball Bounce Ratio Activity See following pages
41 Summer 2007 I2T2 Process Page 41. PR5 High School Apps Transferring Items from TI 83+ & TI 84 Using a Unit-to-Unit Link Cable
42 Summer 2007 I2T2 Process Page 42. Inequalities APPS What is Inequality Graphing? You Can: Enter Inequalities using relation symbols Graph Inequalities and shade the union and interested regions Enter Inequalities (vertical lines only) in the x- editor Trace points interest between relations Store (x, y) coordinate pairs to lists for viewing and optimizing function for linear programming Here s your problem! A manufacturer makes widgets and gadgets. At least 500 widgets and 700 gadgets are to meet minimum daily demands. The machinery can produce no more than 1200 widgets and 1400 gadgets per day. The combined number of widgets and gadgets that the packaging department can handle is 2300 per day. If the company sells widgets for 40 cents each and gadgets for 50 cents each, how many of each item should be produced for maximum daily income? What is the maximum daily income? Let s Get Started 1. Press APPS to display the list of applications 2. Select Inequality APPS 3. The Y = editor screen is displayed (Placing the cursor on the = for any Y- variable displays the new relation symbols at the bottom of the screen) 4. Press the ALPHA and the soft keys [ F1 ] thur [ F5 ] to insert a relation symbol. Solving the widgets and gadgets
43 Summer 2007 I2T2 Process Page 43. Let x = widgets Let y = gadgets The constraints are: x! 700 y! 500 x! 1200 y! 1400 x + y! 2300 Note maximum profit: P( x, y ) = 0.40x y Lets Graph 1) Equation Editor a) Go to the top of the graphing screen using the arrow key to highlight the x editor and the equation editor for X= comes up. b) With the cursor on the = change the sign using the soft keys ALPHA F5 and enter 700 ( x! 700 ) c) Now put all the other equations in the equation editor x! 1200 y! 500 y! 1400 x + y! ) Setting the window a) Set the your window to match the diagram at right
 Graph a) To restrict the shading press ALPHA F1 and b) Choose 1 Ineq intersection press")
 Press APPS and press 2: Quit")
44 Summer 2007 I2T2 Process Page 44. 3) Graph a) To restrict the shading press ALPHA F1 and b) Choose 1 Ineq intersection press ALPHA F3 c) To determine the points of intersection press ALPHA F3 d) Store the list press stor> This will store the intersection points in the lists e) Press APPS and press 2: Quit Inequal Which point is Maximum Profit using equation P( x, y ) = 0.4x + 0.5y?
45 Summer 2007 I2T2 Process Page 45. 1) Using Stat Lists a) Press STAT then press 1: EDIT b) Arrow over until you find the lists INEQX and INEQY 2) Highlight L11 and type in equation =.4*INEQX +.5*INEQY a) To get INEQX press 2 nd LIST and pick up the names b) What is the Maximum Profit? Resources: TI 83 Plus Inequality Guidebook Old Math Textbook
46 Summer 2007 I2T2 Process Page 46. Transformation APPS How Many Drivers? Investigating the Slope-Intercept Form of a Line Introduction Any line can be expressed in the form y = mx + b. This form is called the slopeintercept form. In this activity, you will be able to fit a line to data by selecting values for m and b using the guess-and-check method. How Many Drivers are there in USA? In most states in the United States, an individual needs to be at least 16 years old to get a driver s license. This table shows the population from the 2000 census and the number of licensed drivers in selected states. State Population (in millions) Licensed Drivers (in millions) California Florida Georgia Illinois Michigan Montana New Mexico New York Pennsylvania Texas Source: Census 2000 data at U.S. Department of Transportation, Federal Highway Administration

47 Summer 2007 I2T2 Process Page 47. Directions: Create a scatter plot for these data to look for a relationship or pattern between the population and the number of licensed drivers. 1. Create a list of data as shown at the right a. Press y=, to select 1:Plot1 and press ENTER. Turn the plot on and enter the settings as shown at the right. (For Xlist and Ylist, be sure to use the list numbers in which your data were entered.) b. Press ZOOM to select 9:ZoomStat and display the plot using the data in the lists. Since some of the data in your lists exceeds the limits of the standard viewing window, you can let the handheld determine the window dimensions using the data in the lists. (For Xlist and Ylist, be sure to use the list numbers in which your data were entered.) c. Lets fix the window to the diagram at the right. What do you notice about the data? Is there a consistent trend in the relationship between each state s population and the number of licensed drivers in that state? Give an estimated value for the slope and the y-intercept of a linear model to represent the data. Slope: y-intercept:
48 Summer 2007 I2T2 Process Page 48. Using the Transformation Graphing App, you will find a line that represents an approximate fit of the data. Using the Transformation Graphing App to Investigate m and b To investigate the effects of m and b, you will use a graphing handheld with the Transformation Graphing application. You must have the application installed and running on your graphing handheld to complete this activity. To start the Transformation Graphing App: 1. Press APPS Select Transfrm. (This may have a number or letter in front of it depending on the number of applications you have loaded.) 2. Press any key (except 2nd or ALPHA) to install the application. If the application is already running, select Continue To graph the example: 1. Press Y=. Make sure the Y= editor is clear of all equations. 2. For Y1, enter AX+B. Use ALPHA key for letters except X Note: You entered Y=AX+B in place of Y=MX+B, which is the form commonly found in textbooks, because the Transformation Graphing App uses only the coefficients A, B, C, and D
49 Summer 2007 I2T2 Process Page Press WINDOW to display the SETTINGS screen. If necessary, moves the cursor until you highlight > and press ENTER. The app is now set for Play-Pause mode. a. Set the other SETTINGS as pictured. To make these selections, press These settings define the starting values for the coefficients and the increment by which the coefficients will change. 4. Press GRAPH. If A= is not highlighted (the equal sign will be highlighted), press until the A= is highlighted. a. Press to increase or to decrease the value of B. Hint start with B= first to get your y intercept. Then play with A= b. Adjust the values for A and B until you have a reasonable visual model with A and B values estimated to the tenths place. What are your values for A and B in your model? A (slope): B(y intercept): 5. Uninstall the Transform APPS Answer approximately: y =.6x +.5 Recourses: Modified: Exploring Mathematics with the Transformation Graphing Application 2004 Texas Instruments Incorporated Activity 1
50 Summer 2007 I2T2 Process Page 50. APPS Probability Simulation See following pages

51 Summer 2007 I2T2 Process Page 51. Conics APPS Conics: This application is where you can graph Circles, Ellipses, Hyperbolas, and Parabolas. All equations are in standard form. The benefit to this program is that you can trace on the function. To get back to the home screen press Quit [Mode key] and ESC when you see it.


52 Summer 2007 I2T2 Process Page 52. Algebra APPS Chapter 1 4 Start up: Overview The Overview introduces the topics covered in Observations and Activities. Overview permits to recall prior knowledge and proper vocabulary. Scroll through the Overview using > (< to review, if necessary). Press Quit [Mode key] to return to main menu {once or twice} Observations The Observations illustrate number sense concepts relating to the set of integers. Scroll through the Observations.


53 Summer 2007 I2T2 Process Page 53. Activities The Activities help you practice integer concepts. You can select from two different activities What is My Sign? and Integer Smash. Follow the steps. What is My Sign? Integer Smash

54 Summer 2007 I2T2 Process Page 54. Test Guard Make sure that you have new Operating System OS Go to the APPS key and start TestGuard 2. Start with a password a. b. c. 3. Set up what you want to reset. You will do both APPS and RAM a. b. 4. Now you are ready to start resetting students calculators. You will press again with every calculator.
55 Summer 2007 I2T2 Process Page 55. Finance Apps Objective: To learn how to use the finance apps on TI 83 Materials: Steps: TI83 Finance Apps A) B)
56 Summer 2007 I2T2 Process Page 56. Example 1: A new truck can be purchased for $28,000 from a local dealer which offers the following options Option A 1. Type in the following information: Cash back: $ 2,000 and 4.5% financing for 48 months N (Time): 48 I (Annual % rate): 4.5 PV (Purchase Price) = PMT = what we are looking for FV (future value) = 0 P/Y = 12 C/Y = Now press ALPHA ENTER Find the Payment per month (PMT) = 3. Find the Finance Amount = ( PMT * Time) Purchase Price - cash back Option B 1. Type in the following information: Cash back: $0 but 1.9% financing for 36 months N (Time): 36 I (Annual % rate): 1.9 PV (Purchase Price) = PMT = what we are looking for FV (future value) = 0 P/Y = 12 C/Y = Now press ALPHA ENTER Find the Payment per month (PMT) = 3. Find the Finance Amount = ( PMT * Time) original amount Answer: Option 48


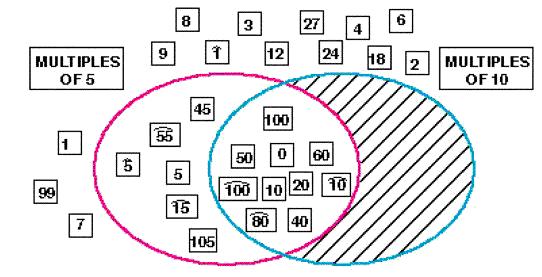
57 Summer 2007 I2T2 Process Page 57. PR6 GAMES WITH STRINGS Exercise 1 Put a string picture on the board, as shown here. Suggest that students copy and label a similar string picture on their papers. You may use a generic blackline to make copies of a string picture for students to color and label. To one side of the string picture, draw a team board with the indicated numbers on the respective sides of the board. You may prefer to use three or four teams and divide the numbers accordingly. Prepare the class to play a game with teams. T:We are going to play a string game with these numbers. During your turn, you will have only one chance to put a number into the string picture. The first team to place all the numbers from its side of the board correctly in the string picture wins. Alternating teams, call on students to locate numbers in the picture and to write them in chalk. If a number is correctly placed in the picture, erase it from the team board; if a number is incorrectly placed, erase it from the string picture. The game should proceed quickly. Individual students can follow the play of the game by placing numbers in their string pictures. This illustration shows the correct placement of all the numbers from both sides of the team board.

58 Summer 2006 I2T2 Process Page 58. When one team has won the game, consider any numbers not yet placed in the picture from the other team's side of the board. Let students discuss how they know where various numbers belong in the picture. The following questions will focus on various ways to locate numbers in the picture. Where does three times any integer go in the picture? (In the red string) Which multiples of 3 are in the intersection? (Three times any multiple of 5) Which multiples of 3 are in the red string but outside the blue string? (Three times any integer which is not a multiple of 5) Where does five times any integer go in the picture? (In the blue string) Which multiples of 5 are in the intersection? (Five times a multiple of 3) Which multiples of 5 are in the blue string but outside the red string? (Five times a number that is not a multiple of 3) Which numbers are outside both strings? (Numbers which are neither multiples of 3 nor multiples of 5) Repeat this activity for the situation pictured below, or invite students to locate the numbers individually or with a partner. This illustration shows the correct placement of all the numbers from both sides of the team board. Exercise 2 For the remainder of the lesson, play The String Game. (Appendix D: The String Game, Version C.) A possible game is suggested below.
59 Summer 2006 I2T2 Process Page 59. The String Game Materials Prepare a chart showing all of the attributes to be used in the game and prepare a card for each attribute to form a "face-down" set. Prepare game pieces, one Or each of the numbers that are listed below. Put magnetic material or loops of masking tape on the pieces and the string cards so that they will adhere to the board.
60 Summer 2006 I2T2 Process Page 60. Preparation Draw two (or three) large overlapping strings on the board using two (or three) different colors. Next to each string attach a string card face-down. Place an even number (two or four) of the game pieces correctly in the string picture to provide a basis.(other than guessing) for plays early In the game. Divide the rest of the game, pieces evenly into two sets, one for each of the competing teams. The illustration below shows a sample set-up for a game; bubbles indicate the hidden labels. Object of the game Each team tries to place its game pieces correctly in the string picture according to the face-down string cards. The winning team is the one that identifies the facedown cards correctly after playing according to the rules. Rules of the game 1) The students play the game in silence. Each student should have the opportunity to analyze the game alone. Infringement of this rule by anyone is penalized by the talker's team losing its next turn. 2) The teams alternate and the members take turns within each team. A player comes to the board and selects a. piece from the team's collection to place in one of the regions of the string picture.
61 Summer 2006 I2T2 Process Page 61. 3) You are the judge. If the piece is correctly placed, say "yes". The piece remains an the string picture and the player immediately has a second turn (no player may have more than two consecutive turns). If the* piece is in correctly placed, say "no". The player returns the piece to the team's unplayed collection and play passes to the other team. As an aid in judging, prepare a crib-sheet showing the correct position of each game piece. if at any time you discover that you have made an error, say so immediately and rectify the mistake. Either move -an incorrectly placed piece whose position you had approved to its correct region or replace on the string picture a correctly placed piece that-you-had-rejected because you had disapproved its position... 4) When a team has correctly placed all of its pieces, the player who placed the last piece may thereupon attempt to Identify each of the string cards. There are two levels of acceptability dependent on the experience of the students In playing the game. In the first case, accept and verify a correct Identification. of a string and continue the game until the other, string or strings are identified. In the second stage, require all of the strings be identified correctly at once. If a team has exhausted its stock, of game pieces and the strings have not been identified, then the team continues on its turn to attempt to identify the -strings, while the other team works to place its game pieces. Analysis Sheets on next Page.
62 Summer 2006 I2T2 Process Page 62.
63 Summer 2006 I2T2 Process Page 63.
64 Summer 2006 I2T2 Process Page 64.
65 Summer 2006 I2T2 Process Page 65.
, one to the left of the red string and one to the right of the blue string.")
66 Summer 2006 I2T2 Process Page 66. Exercise 1 Before the lesson begins, prepare your board as illustrated below. Bubbles indicate what is on the hidden labels. Display two Numerical String Game posters (included in the Numerical String Game kit), one to the left of the red string and one to the right of the blue string. String Game Analysis #1 T: We are going to play The String Game today, but first let's look at what information we get from some clues. This can help us be better players. Playing the game is like solving a detective story; we want to find out what labels the red and blue strings have, and each piece that is played is a clue. Let's play a game together. Our first clue is that 9 is in the center region; 9 is inside both strings. What information does this clue give us about the strings? S: The red string cannot be for MULTIPLES OF 2, because 9 is not a multiple of 2. T: Could the blue string be for MULTIPLES OF 2? S: No, because 9 is also inside the blue string. Encourage students to eliminate as many labels as they can from both lists (posters). Each time they suggest crossing out a label on one list because the corresponding string cannot have that label, they should see that the same label should be crossed out on the other list- a number in the center region gives the same information about both strings. Do not allow a label to be crossed out until an adequate explanation has been given. For example: S: The red (blue) string cannot be for POSITIVE DIVISORS OF 12, because 9 is not a positive divisor of 12.

67 Summer 2006 I2T2 Process Page 67.


68 Summer 2006 I2T2 Process Page 68.

69 Summer 2006 I2T2 Process Page 69. T: My third clue is that N15 is outside of both strings. (Place N15 correctly in the string picture.) What new information does this clue give us? S: The red string cannot be for ODD NUMBERS, because N15 is odd and it is outside of the red string. S: The blue string cannot be for MULTIPLES OF 3, because N15 is a multiple of 3 and it is outside of the blue string. These three clues determine the red string, and there are two possibilities remaining for the blue string. T: Now we know that the red string is for numbers GREATER THAN N10. There are still two possibilities for the blue string. We need another clue. Can someone suggest a number to play? I'll put it in the correct place. Try to choose a number so that once we know where it belongs in the picture, we can determine the blue string. This problem is difficult; allow students to make several trials, if necessary. If a student chooses M100, N80, N55, N10, B5, B1, 0, 1, 3, 4, 7, 8, 10, 12, 20, 24, 40, 45, 50, 60, 99, 100, or 105, ask him or her to place it. Where these numbers belong in the picture is already determined, so playing any one of them gives no new information. If someone chooses 2, 6, 18, or 27, place the number correctly yourself. If, after several trials, the class does not see that 2, 6, 18, or 27 are the only numbers that can determine the blue string, suggest one of these numbers yourself.


70 Summer 2006 I2T2 Process Page 70. The following dialogue assumes that 27 is placed correctly in the string picture. S: The blue string cannot be for POSITIVE DIVISORS OF 27, because 27 is outside of the blue string. So the blue string must be for POSITIVE DIVISORS OF 18. Exercise 2 Repeat Exercise 1 with the situation below. You can move more quickly by encouraging one student to eliminate several similar labels simultaneously. These are the labels that can be crossed out after the first clue. Note: The same labels are crossed out on both lists because this clue gives the same information about both strings; 20 is outside of both strings. 'If Exercise 1 took more than half of your class time, you may wish to skip this exercise and go onto Exercise 3, playing The String Game in the time that remains.

71 Summer 2006 I2T2 Process Page 71. These are the labels that can be crossed out after the second clue. Note: Of the possibilities remaining after the first clue, those that get crossed out on one list do not get crossed out on the other; 12 is inside one string and outside of the other. These three clues determine both the red string and the blue string.
72 Summer 2006 I2T2 Process Page 72. Exercise 3 Distribute String Game analysis sheets to students, and point out that now they have their own lists of possibilities for the red and blue strings. Suggest that students try to use these lists during the game to help discover the string labels. Prepare to play The String Game in the usual way. The illustration below shows a possible game with two pieces placed correctly as starting clues. In order to give students time to do some of their own analysis between plays, you may pause briefly between turns. Such pauses in the game should encourage students to use the clues to cross out labels on their individual lists.


73 Summer 2006 I2T2 Process Page 73. String Game Analysis #2 Exercise 1 Distribute String Game analysis sheets to students. Using two Numerical String Game posters from the Numerical String Game kit, prepare your board as illustrated below. Bubbles indicate what is on the hidden labels. T: Today we are going to play The String Game. First, let's play together as a class and see how quickly we can discover the strings' labels. The first clue is that 4 is in the center region. What information does this give us about the strings? S: The red string cannot be for MULTIPLES OF 3 because 4 is not a multiple of 3. S: Also, the blue string cannot be for MULTIPLES OF 3. Cross out labels from the two lists as they are mentioned. Encourage students to recognize that the same labels are crossed out on both lists because 4 is inside both strings, thus giving the same information about both strings. This clue eliminates all but seven possibilities on each list. L45

74 Summer 2006 I2T2 Process Page 74. Place 18 in the picture as you announce a second clue. T: The second clue is that 18 is in the outside region. What new information does this clue give us about the strings? S: The red string cannot be for MULTIPLES OF 2, because 18 is a multiple of 2 and it is outside of the red string. S: Also, the blue string cannot be for MULTIPLES OF 2. Again, cross out labels from the two lists as they are mentioned. Encourage students to recognize again that this clue gives the same information about both strings; 18 is outside of both strings. After using information from this clue, only four possibilities remain for each of the strings. T: Now, let's play the game together in the usual way and see now quickly we can discover the strings' labels. Who would like to make a first play? Call on students to make plays, keeping count of how many plays are made. Accept any play, answering "yes" if the piece is played correctly and "no" if it is played incorrectly. Whenever a piece is played correctly, stop and analyze what new information is obtained. Cross out the appropriate labels on the two lists. Whenever a piece is played incorrectly, record the information in the picture. For example, if 8 is played in the center, indicate on your picture that it was put in the wrong region (see picture below). Caution: Students might suggest that this play tells them that the red string cannot, for example, be for POSITIVE DIVISORS OF 24. Remind the class that they still do not know where 8 belongs; it could still be inside the blue string, inside the red string, or outside of both strings.
75 Summer 2006 I2T2 Process Page 75. Worksheets L9*,, ***, and **** are available for individual work.


76 Summer 2006 I2T2 Process Page 76.


77 Summer 2006 I2T2 Process Page 77. String Game Analysis #3 Exercise 1 Using two Numerical String Game posters, prepare your board as illustrated below. Bubbles indicate what is on the hidden labels. In this situation the clues do, in fact, determine the string labels. T: What information do these clues give us about the strings? Let students suggest labels to cross out on the lists. Each time, ask for an explanation as to why a label can be crossed out. For example: S: The red string cannot be for numbers LESS THAN 50 because N80 is less than 50 and it is outside of the red string. S: The blue string cannot be for positive divisors of any number because N80 is negative. On the two lists, cross out the labels that the strings cannot have as verified by students. All labels except one on each list should be crossed out. That is, these clues determine the strings; the red string is for ODD NUMBERS and the blue string is for numbers LESS THAN N10.


78 Summer 2006 I2T2 Process Page 78. Exercise 2 Prepare your board for The String Game, again taping Numerical String Game posters near the strings. Distribute String Game analysis sheets to students. Start with two clues as shown here. Direct students to cross out as many labels as they can on their lists. After a few minutes, collectively do the analysis with these clues. The class should find that there are two remaining possibilities for the red string and that the blue string is determined. T: Now we know that the red string is for either POSITIVE DIVISORS OF 18 or for POSITIVE PRIME NUMBERS. We also know that the blue string is for MULTIPLES OF 4. Let's see which numbers we can put in the picture correctly even though we are not yet sure what label the red string has. Let students place as many of The String Game numbers as they can. This activity should allow everyone a chance to participate. Encourage discussion about why, for example, you are sure that 10 is in the outside region (10 is not a positive divisor of 18 and not a positive prime number, and 10 is not a multiple of 4); or why you are sure that 3 is inside the red string but outside the blue string (3 is a positive divisor of 18 and a positive prime number, but 3 is not a multiple of 4); and so on. Students should put all of the string game numbers except 1, 5, 6, 7, 9, and 18 in the picture.

79 Summer 2006 I2T2 Process Page 79. Discuss possibilities for the numbers 1, 5, 6, 7, 9, and 18. Each of these numbers could be in the outside region, or inside the red string and outside of the blue string. T: Do you see a region that could be hatched because it is empty? S: The center region. T: Why? S: No number is both a positive divisor of 18 and a multiple of 4, and no number is both prime and a multiple of 4. T: Suppose it is your turn to play in The String Game, and you would like to determine the red string as quickly as possible. Which piece would you play? Give students a few minutes to think about what play would be helpful. They should, after some trial and error, find that playing any of the numbers 1,5,6,7,9, or 18 would give them the necessary information (as long as they did not make a careless play). For example, if S were played in the outside region and given a "no" answer, then it would be certain that 5 belonged inside the red string. So the red string would be for POSITIVE PRIME NUMBERS. If S were played in the outside region and given a "yes" answer, then it would be certain that the red string was for the POSITIVE DIVISORS OF 18. A similar analysis applies to each of the numbers 1,6,7,9, and 18. Let students make one of these plays to determine the red string.
80 Summer 2006 I2T2 Process Page 80. Students may be concerned about where 1 belongs in the picture. Ask someone to locate 1 (inside the red string but outside the blue string). Emphasize that 1 is a divisor of any number, but 1 is not a prime number. S: 3 could be in the box (only positive divisors are 1 and 3). S: 9 (only positive divisors are 1, 3, and 9). S: 27 (only positive divisors are 1, 3, 9, and 27). Check suggested possibilities with the picture. Soon students should make other observations, such as an even number cannot be in the box (otherwise 2 would be a divisor and 2 is a prime number). They may observe a pattern in the list of possibilities, especially if it is presented in numerical order, i.e., start the list with 3 and multiply by 3 each time to find the next number (3,9,27, 81,...). Exercise 3 Prepare to play The String Game with numbers by setting up a team board and taping the Numerical String Game poster above it. Divide the class into teams and distribute the game pieces on the team board. The illustration below shows a possible game with one piece from each side of the team board placed correctly as starting clues. Note: If you decide to play the game with three or more teams, create a team board with sections for more teams.
81 Summer 2006 I2T2 Process Page 81. The following illustration shows correct placement of all 30 numbers and may be used by you as a crib sheet during the play of the game. You may like students to take lesson notes on some, most, or even all their math lessons. The "Lesson Notes" section in the Notes to the Teacher gives suggestions and refers to forms in the Blacklines you may provide to students for this purpose. In this lesson, for example, students may note several facts and patterns about numbers with a specific number of divisors, about numbers that have a particular prime number as a divisor, or about numbers with particular odd numbers as divisors. Suggest that parents work with their child to make a list of numbers that have exactly three or exactly six positive divisors.
82 Summer 2006 I2T2 Process Page 82. Exercise 3 Prepare to play The String Game with numbers. The illustration below shows a possible game with two pieces placed correctly as starting clues. The following illustration shows correct placement of all 30 numbers and may be used by you as a crib sheet during the play of the game. If time permits, play a second game such as the one illustrated below.

83 Summer 2006 I2T2 Process Page 83. Game Pieces and String Cards One set of game pieces and string cards is needed for each version of the game. A poster list of the string cards should be posted above the team board-it is a constant reminder during the game of the possible labels for the strings. Game pieces, string cards, and the poster of the string cards can be found in the corresponding String Game kit, (A-Blocks or Numerical). a) Magnetic: You can magnetize the game pieces (A-blocks or number cards) by sticking a small piece of magnetic material to the back of each one. (Magnetic material is included in The String Game kits, or it is available in many stores, in the hobby or notions departments.) Similarly, you can magnetize string cards by sticking a small piece of magnetic material to the front of each card, taking care not to obscure what is written on it. b) Non-magnetic: Game pieces can be attached to the team board using loops of masking tape stuck to the backs. A string card should have a loop of masking tape stuck to the front in such a way that what is written on the card is not obscured. With this type of equipment, be prepared to make necessary repairs by having masking tape on hand so that if a loop of tape loses its stickiness it can be replaced on the spot. As an alternative, use a small wad of a plastic caulking compound (Rope Caulk or Mortite, for example) in place of the loop of masking tape. Preparation for the Game Draw two (or three, depending on which variation you are using) large, overlapping strings on the playing board using two (or three) different colors. Next to each of these strings attach one string card facedown. Place the team board conveniently nearby. Randomly distribute the game pieces among the sections of the team board. Divide the class into teams using whatever method is acceptable to your class, and assign each team a section of the team board. Before any student takes a turn, correctly place an equal number (at least one) of each team's game pieces in the string picture. This eliminates the necessity of beginning the game on the basis of pure guesswork. You can influence how long the game will take by the number of pieces you place in the string picture before the game begins.

 You are the judge. If the piece is correctly placed, say yes.")
84 Summer 2006 I2T2 Process Page 84. Object of the Game Each team tries to place all of its game pieces correctly (according to the facedown string cards) in the string picture. The winning team is the one that places all of its game pieces correctly and identifies the facedown cards correctly first. Rules of the Game 1) The teams alternate making plays, and the members take turns within each team. A player comes to the board and selects a piece from his or her team's collection to place in one of the regions of the string picture. 2) You are the judge. If the piece is correctly placed, say yes. The piece then remains in the string picture and the player immediately has a second (bonus) turn (no player may have more than two consecutive turns). If the piece is incorrectly placed, say no. The player returns the piece to the team's unplayed collection and play passes to the next team. As an aid in judging, prepare a crib sheet showing the correct position of each game piece or at least reminding you of what is on the facedown cards. If at any time you discover that you have made an error, say so immediately and rectify the mistake. Then, either move an incorrectly placed piece to its correct region or replace a correctly placed piece that has been removed. 3) When a team has correctly placed all of its pieces, the player who placed the last piece may then attempt to identify the string cards. If he or she is correct, the team wins. If a mistake is made (even if it is only in the case of one of the string cards), simply indicate that the identification is incorrect and let the game continue. 4) If a team has exhausted its stock of game pieces and the strings have not been identified, that team continues to attempt to identify the strings on its turn, while the other team(s) works to place its game pieces. The String Game with A-Blocks (Version A) This simplest version of the game uses 24 A-blocks as game pieces and only nine string cards. This list of string cards should be attached above the team board. Below are several crib sheets for variations of the game with two and with three strings. Example 1: No empty regions TWO STRINGS
 This version of the game uses 30 number cards as game pieces and 16 string cards as described earlier in the section on equipment.")
85 Summer 2006 I2T2 Process Page 85. The String Game with Numbers (Version C) This version of the game uses 30 number cards as game pieces and 16 string cards as described earlier in the section on equipment. Note that The Numerical String Game kit contains three sets of string cards. This allows you to give the same label to more than one string. Example 7 played with two strings and Example 1 played with three strings show this option; however, before using such a game players should have an understanding that this is a possibility. Below are several crib sheets for variations of the game with two and with three strings. TWO STRINGS Example 1: No Empty Regions Example 2: No Empty Regions Example 3: No Empty Regions


86 Summer 2006 I2T2 Process Page 86. Example 4: One Empty Region Example 5: One Empty Region Example 6: One Empty Region Example 7: Two Empty Regions

87 Summer 2006 I2T2 Process Page 87. Three Strings Caution: The jump in difficulty from a two-string game to a three-string game is much greater in The String Game with numbers than it was in The String Game with A-blocks. Hence you should not expect to proceed to three-string games as rapidly as you might have with A-blocks. Example 1: One Empty Region Example 2: Five Empty Regions
88 Summer 2006 I2T2 Process Page 88. The String Game with Special Scoring Rules (Version D) In this version of the game, we introduce special scoring rules to determine the winning team. Both The String Game with numbers and with shapes can be played with these scoring rules; however, in the lessons of this book only The String Game with numbers is played this way. Scoring Each student is given a list of possible string labels from The String Game analysis pad. One round of the game is completed by having one player from each team take a turn. After each round, the students have an opportunity to privately identify the facedown string cards. They do this by circling on their Red and Blue lists what they believe is on the hidden tags and submitting it to the judge (teacher). However, each student has just one chance to make a private identification. If a player correctly identifies the string cards after a particular round, then points are added to the player's team score according to the following schedule. Round points Round points Round 5-50 points Round points Round 4-75 points Round 6-25 points After Round 6, play out the game without further private identifications. Additional points cannot be scored by a team until the end of the game. The team that correctly identifies the string cards at the end of the game scores an additional 100 points, plus 5 points for each unplayed game piece the opposing team has left on the game board. The winning team is the one with the greater total score. Comments 1) Allow about two to three minutes before the start of Round 1 for students to analyze the starting clues (correctly placed game pieces). 2) Keep count of the rounds played so that both you and the students know which round has just been completed. 3) After each round, give the students time (perhaps 15 to 30 seconds) to study the picture, to mark their lists, and to submit them, if desired. 4) On each list submitted, write the round after which it was turned in, and sort them by teams. Do not return lists to students. You can total the team scores at the end of the game. Do not tell the students whether their identifications are correct or incorrect, but encourage them to write their findings on a separate sheet of paper for recollection when they play. They should continue to check their identifications during the remainder of the game. 5) It may be even more important to insist on silence during this kind of game because an individual can have more influence on a team's winning or losing. Purpose Scoring rules should not be imposed on The String Game until students have become very familiar and experienced in the play of the game. Many students already will be playing strategically, analyzing the clues given by correctly played game pieces. Others may still be playing in a random way. The introduction of scoring rules obviously will favor the better players and perhaps challenge them in a way the usual game no longer does. It provides them the opportunity to more dramatically affect their teams' chances of winning. For many students the scoring rules may provide incentive to begin analyzing the game and thinking about what information is given by a correctly played game piece.

89 Summer 2006 I2T2 Process Page 89. We suggest that you do not play The String Game too often with these scoring rules. They do impose complication and give perhaps too much advantage to the better players. After playing the game with scoring rules a couple of times, you should find that many students have become significantly better players. Returning to the usual way of playing the game, most students will continue to play more thoughtfully. One advantage of using scoring rules when you play The String Game with only a small amount of time available is that you can stop the game before the end and have a reasonable way to determine the winning team. The winning team will be the one with the larger total number of points from identification of string cards. Exercise 3 Play The String Game in the usual way. The illustration below shows a possible game with starting clues. Encourage students to use their lists (String Game analysis sheet) to eliminate possibilities for string labels during the game.


90 Between a Rock and a Hard Place PR7 Middle School Apps 1. Start the Number Line application by pressing APPS. 2. Press 2 to choose the fraction line. 3. Set the window as shown. 4. Press graph to see the number line interval. 5. Press DRAW and then 1 to choose DrawLabel.
91 Summer 2007 I2T2 Process Page Player 1 enters a fraction between 0 and Press enter to see the location of the fraction. Player 2 enters another fraction between 0 and 1. This fraction may be on either side of the first fraction. From this point on, a player must enter a fraction between the two most recent fractions. For example Player 1 can now enter any fraction between 1/4 and 3/5. In this example, Player 1 entered 1/2. Player 2 must now enter a fraction between 1/2 and 3/5. The game continues until one player fails to place a fraction between the two previous fractions. If the screen becomes too cluttered, change the window settings to show only the two most recent fractions as the minimum and maximum values.
92 Summer 2007 I2T2 Process Page 92 Can You Find my Marbles? Your bag should contain 80 total marbles. There are 3 different colors of marbles. Divide your 80 marbles among the 3 colors however you like. Fill in the table and find the probability of each color being selected. What is the sum of the 3 probabilities? Marble Color Number in Bag Probability A B C Total Switch calculators with your partner. Use the Prob Sim Application to pick 115 marbles from your partner s bag. When you have 115 marbles, use the right arrow to fill in your results below. Marble Color Number Chosen (115 total) Prediction of Number in Bag (80 total) Actual Number in Bag Probability A B C Total What is the sum of the 3 probabilities?

 APP")

93 Summer 2007 I2T2 Process Page 93 Using the Probability Simulation APP: Can You Find my Marbles? 1. Start the Probability Simulation (Prob Sim) APP and get to the main menu. 2. Choose 3: Pick Marbles 3. Chose SET by pressing the [ZOOM] key. 4. Change Types to 3 since there will be three colors of marbles.
![Summer 2007 I2T2 Process Page 94 5. Chose ADV by pressing the [WINDOW] key. 6. Enter the number of marbles for each color. Be sure the total number of marbles is 80. 7.](/docs-images/82/85877826/images/94-0.jpg "Press [GRAPH] for OK twice. If the screen says This will clear all trials from memory. Are you sure you want to continue?, press [y=] to choose Yes.")
![You should now be back at the screen showing the bag. 8. Exchange calculators with your partner. 9. Your partner should now press [WINDOW] to pick the first marble.](/docs-images/82/85877826/images/94-1.jpg "Marbles can now be picked one at a time (press [WINDOW] for +1), ten at a time (press [ZOOM] for +10) or fifty at a time (press [TRACE] for +50).")
94 Summer 2007 I2T2 Process Page Chose ADV by pressing the [WINDOW] key. 6. Enter the number of marbles for each color. Be sure the total number of marbles is Press [GRAPH] for OK twice. If the screen says This will clear all trials from memory. Are you sure you want to continue?, press [y=] to choose Yes. You should now be back at the screen showing the bag. 8. Exchange calculators with your partner. 9. Your partner should now press [WINDOW] to pick the first marble. Marbles can now be picked one at a time (press [WINDOW] for +1), ten at a time (press [ZOOM] for +10) or fifty at a time (press [TRACE] for +50). Remember you must end up with 115 marbles, so plan ahead.
Summer 2006 I2T2 Process Page 2.
 Summer 2006 I2T2 Process Page 2. PR1 Virtual Manipulatives...3 Virtual Manipulatives...3 Grapher...4 PR2 TI Connect...5 IT Website... 13 How to Get Real Data Into An Excel File... 15 IBM Version... 15
6.1.2: Graphing Quadratic Equations
 6.1.: Graphing Quadratic Equations 1. Obtain a pair of equations from your teacher.. Press the Zoom button and press 6 (for ZStandard) to set the window to make the max and min on both axes go from 10
5 Day Unit Plan. Algebra/Grade 9. JenniferJohnston
 5 Day Unit Plan Algebra/Grade 9 JenniferJohnston Geometer s Sketchpad Graph Explorer Algebra I TI-83 Plus Topics in Algebra Application Transform Application Overall Objectives Students will use a variety
CHM 109 Excel Refresher Exercise adapted from Dr. C. Bender s exercise
 CHM 109 Excel Refresher Exercise adapted from Dr. C. Bender s exercise (1 point) (Also see appendix II: Summary for making spreadsheets and graphs with Excel.) You will use spreadsheets to analyze data
Physics 253 Fundamental Physics Mechanic, September 9, Lab #2 Plotting with Excel: The Air Slide
 1 NORTHERN ILLINOIS UNIVERSITY PHYSICS DEPARTMENT Physics 253 Fundamental Physics Mechanic, September 9, 2010 Lab #2 Plotting with Excel: The Air Slide Lab Write-up Due: Thurs., September 16, 2010 Place
Assignment 5 due Monday, May 7
 due Monday, May 7 Simulations and the Law of Large Numbers Overview In both parts of the assignment, you will be calculating a theoretical probability for a certain procedure. In other words, this uses
TImiddlegrades.com. Science. Watt s The Deal
 Watt s The Deal ID: 13435 Time required: 1 class period Suggested Grade Levels: 7 8 Activity Overview In this activity, students will use the CBL to collect data on the brightness of different light bulbs
Appendix 3 - Using A Spreadsheet for Data Analysis
 105 Linear Regression - an Overview Appendix 3 - Using A Spreadsheet for Data Analysis Scientists often choose to seek linear relationships, because they are easiest to understand and to analyze. But,
Lesson 17. Student Outcomes. Lesson Notes. Classwork. Example 1 (5 10 minutes): Predicting the Pattern in the Residual Plot
: Predicting the Pattern in the Residual Plot") Student Outcomes Students use a graphing calculator to construct the residual plot for a given data set. Students use a residual plot as an indication of whether the model used to describe the relationship
Student Outcomes Students use a graphing calculator to construct the residual plot for a given data set. Students use a residual plot as an indication of whether the model used to describe the relationship
Math 165 Section 3.1 Linear Functions
 Math 165 Section 3.1 Linear Functions - complete this page Read the book or the power point presentations for this section. Complete all questions on this page Also complete all questions on page 6 1)
7.1 Solving Quadratic Equations by Graphing
 Math 2201 Date: 7.1 Solving Quadratic Equations by Graphing In Mathematics 1201, students factored difference of squares, perfect square trinomials and polynomials of the form x 2 + bx + c and ax 2 + bx
Math Labs. Activity 1: Rectangles and Rectangular Prisms Using Coordinates. Procedure
 Math Labs Activity 1: Rectangles and Rectangular Prisms Using Coordinates Problem Statement Use the Cartesian coordinate system to draw rectangle ABCD. Use an x-y-z coordinate system to draw a rectangular
Physics 131 Lab 1: ONE-DIMENSIONAL MOTION
 1 Name Date Partner(s) Physics 131 Lab 1: ONE-DIMENSIONAL MOTION OBJECTIVES To familiarize yourself with motion detector hardware. To explore how simple motions are represented on a displacement-time graph.
Laboratory 1: Motion in One Dimension
 Phys 131L Spring 2018 Laboratory 1: Motion in One Dimension Classical physics describes the motion of objects with the fundamental goal of tracking the position of an object as time passes. The simplest
ACTIVITY 6. Intersection. You ll Need. Name. Date. 2 CBR units 2 TI-83 or TI-82 Graphing Calculators Yard stick Masking tape
 . Name Date ACTIVITY 6 Intersection Suppose two people walking meet on the street and pass each other. These motions can be modeled graphically. The motion graphs are linear if each person is walking at
Determine if the function is even, odd, or neither. 1) f(x) = 8x4 + 7x + 5 A) Even B) Odd C) Neither
 f(x) = 8x4 + 7x + 5 A) Even B) Odd C) Neither") Assignment 6 Name MULTIPLE CHOICE. Choose the one alternative that best completes the statement or answers the question. Determine if the function is even, odd, or neither. 1) f(x) = 8x4 + 7x + 5 1) A)
Assignment 6 Name MULTIPLE CHOICE. Choose the one alternative that best completes the statement or answers the question. Determine if the function is even, odd, or neither. 1) f(x) = 8x4 + 7x + 5 1) A)
Appendix C: Graphing. How do I plot data and uncertainties? Another technique that makes data analysis easier is to record all your data in a table.
 Appendix C: Graphing One of the most powerful tools used for data presentation and analysis is the graph. Used properly, graphs are an important guide to understanding the results of an experiment. They
Scatter Plots, Correlation, and Lines of Best Fit
 Lesson 7.3 Objectives Interpret a scatter plot. Identify the correlation of data from a scatter plot. Find the line of best fit for a set of data. Scatter Plots, Correlation, and Lines of Best Fit A video
Section 2.3 Task List
 Summer 2017 Math 108 Section 2.3 67 Section 2.3 Task List Work through each of the following tasks, carefully filling in the following pages in your notebook. Section 2.3 Function Notation and Applications
Products of Linear Functions
 Math Objectives Students will understand relationships between the horizontal intercepts of two linear functions and the horizontal intercepts of the quadratic function resulting from their product. Students
Experiment P01: Understanding Motion I Distance and Time (Motion Sensor)
") PASCO scientific Physics Lab Manual: P01-1 Experiment P01: Understanding Motion I Distance and Time (Motion Sensor) Concept Time SW Interface Macintosh file Windows file linear motion 30 m 500 or 700 P01
PASCO scientific Physics Lab Manual: P01-1 Experiment P01: Understanding Motion I Distance and Time (Motion Sensor) Concept Time SW Interface Macintosh file Windows file linear motion 30 m 500 or 700 P01
AutoCAD Tutorial First Level. 2D Fundamentals. Randy H. Shih SDC. Better Textbooks. Lower Prices.
 AutoCAD 2018 Tutorial First Level 2D Fundamentals Randy H. Shih SDC PUBLICATIONS Better Textbooks. Lower Prices. www.sdcpublications.com Powered by TCPDF (www.tcpdf.org) Visit the following websites to
Patterns and Graphing Year 10
 Patterns and Graphing Year 10 While students may be shown various different types of patterns in the classroom, they will be tested on simple ones, with each term of the pattern an equal difference from
AutoCAD LT 2009 Tutorial
 AutoCAD LT 2009 Tutorial Randy H. Shih Oregon Institute of Technology SDC PUBLICATIONS Schroff Development Corporation www.schroff.com Better Textbooks. Lower Prices. AutoCAD LT 2009 Tutorial 1-1 Lesson
MANIPULATIVE MATHEMATICS FOR STUDENTS
 MANIPULATIVE MATHEMATICS FOR STUDENTS Manipulative Mathematics Using Manipulatives to Promote Understanding of Elementary Algebra Concepts Lynn Marecek MaryAnne Anthony-Smith This file is copyright 07,
AutoCAD LT 2012 Tutorial. Randy H. Shih Oregon Institute of Technology SDC PUBLICATIONS. Schroff Development Corporation
 AutoCAD LT 2012 Tutorial Randy H. Shih Oregon Institute of Technology SDC PUBLICATIONS www.sdcpublications.com Schroff Development Corporation AutoCAD LT 2012 Tutorial 1-1 Lesson 1 Geometric Construction
Student Exploration: Quadratics in Factored Form
 Name: Date: Student Exploration: Quadratics in Factored Form Vocabulary: factored form of a quadratic function, linear factor, parabola, polynomial, quadratic function, root of an equation, vertex of a
CPM Educational Program
 CC COURSE 2 ETOOLS Table of Contents General etools... 5 Algebra Tiles (CPM)... 6 Pattern Tile & Dot Tool (CPM)... 9 Area and Perimeter (CPM)...11 Base Ten Blocks (CPM)...14 +/- Tiles & Number Lines (CPM)...16
Chapter 0 Getting Started on the TI-83 or TI-84 Family of Graphing Calculators
 Chapter 0 Getting Started on the TI-83 or TI-84 Family of Graphing Calculators 0.1 Turn the Calculator ON / OFF, Locating the keys Turn your calculator on by using the ON key, located in the lower left
CHM 152 Lab 1: Plotting with Excel updated: May 2011
 CHM 152 Lab 1: Plotting with Excel updated: May 2011 Introduction In this course, many of our labs will involve plotting data. While many students are nerds already quite proficient at using Excel to plot
Solving Equations and Graphing
 Solving Equations and Graphing Question 1: How do you solve a linear equation? Answer 1: 1. Remove any parentheses or other grouping symbols (if necessary). 2. If the equation contains a fraction, multiply
The learner will understand and use linear relations and functions.
 The learner will understand and use linear relations and functions. Notes 5and textbook 5.01 Develop an understanding of function. a) Translate among verbal, tabular, graphic, and algebraic representations
Lab 4 Projectile Motion
 b Lab 4 Projectile Motion Physics 211 Lab What You Need To Know: 1 x = x o + voxt + at o ox 2 at v = vox + at at 2 2 v 2 = vox 2 + 2aΔx ox FIGURE 1 Linear FIGURE Motion Linear Equations Motion Equations
Moving Man Introduction Motion in 1 Direction
 Moving Man Introduction Motion in 1 Direction Go to http://www.colorado.edu/physics/phet and Click on Play with Sims On the left hand side, click physics, and find The Moving Man simulation (they re listed
Learning Guide. ASR Automated Systems Research Inc. # Douglas Crescent, Langley, BC. V3A 4B6. Fax:
 Learning Guide ASR Automated Systems Research Inc. #1 20461 Douglas Crescent, Langley, BC. V3A 4B6 Toll free: 1-800-818-2051 e-mail: support@asrsoft.com Fax: 604-539-1334 www.asrsoft.com Copyright 1991-2013
SDC. AutoCAD LT 2007 Tutorial. Randy H. Shih. Schroff Development Corporation Oregon Institute of Technology
 AutoCAD LT 2007 Tutorial Randy H. Shih Oregon Institute of Technology SDC PUBLICATIONS Schroff Development Corporation www.schroff.com www.schroff-europe.com AutoCAD LT 2007 Tutorial 1-1 Lesson 1 Geometric
with MultiMedia CD Randy H. Shih Jack Zecher SDC PUBLICATIONS Schroff Development Corporation
 with MultiMedia CD Randy H. Shih Jack Zecher SDC PUBLICATIONS Schroff Development Corporation WWW.SCHROFF.COM Lesson 1 Geometric Construction Basics AutoCAD LT 2002 Tutorial 1-1 1-2 AutoCAD LT 2002 Tutorial
Sect 4.5 Inequalities Involving Quadratic Function
 71 Sect 4. Inequalities Involving Quadratic Function Objective #0: Solving Inequalities using a graph Use the graph to the right to find the following: Ex. 1 a) Find the intervals where f(x) > 0. b) Find
VISUAL ALGEBRA FOR COLLEGE STUDENTS. Laurie J. Burton Western Oregon University
 VISUAL ALGEBRA FOR COLLEGE STUDENTS Laurie J. Burton Western Oregon University Visual Algebra for College Students Copyright 010 All rights reserved Laurie J. Burton Western Oregon University Many of the
MATHEMATICAL FUNCTIONS AND GRAPHS
 1 MATHEMATICAL FUNCTIONS AND GRAPHS Objectives Learn how to enter formulae and create and edit graphs. Familiarize yourself with three classes of functions: linear, exponential, and power. Explore effects
Page 21 GRAPHING OBJECTIVES:
 Page 21 GRAPHING OBJECTIVES: 1. To learn how to present data in graphical form manually (paper-and-pencil) and using computer software. 2. To learn how to interpret graphical data by, a. determining the
Up and Down or Down and Up
 Lesson.1 Assignment Name Date Up and Down or Down and Up Exploring Quadratic Functions 1. The citizens of Herrington County are wild about their dogs. They have an existing dog park for dogs to play, but
Comparing Across Categories Part of a Series of Tutorials on using Google Sheets to work with data for making charts in Venngage
 Comparing Across Categories Part of a Series of Tutorials on using Google Sheets to work with data for making charts in Venngage These materials are based upon work supported by the National Science Foundation
Graphs of linear equations will be perfectly straight lines. Why would we say that A and B are not both zero?
 College algebra Linear Functions : Definition, Horizontal and Vertical Lines, Slope, Rate of Change, Slopeintercept Form, Point-slope Form, Parallel and Perpendicular Lines, Linear Regression (sections.3
Building Concepts: Fractions and Unit Squares
 Lesson Overview This TI-Nspire lesson, essentially a dynamic geoboard, is intended to extend the concept of fraction to unit squares, where the unit fraction b is a portion of the area of a unit square.
Making Middle School Math Come Alive with Games and Activities
 Making Middle School Math Come Alive with Games and Activities For more information about the materials you find in this packet, contact: Sharon Rendon (605) 431-0216 sharonrendon@cpm.org 1 2-51. SPECIAL
Environmental Stochasticity: Roc Flu Macro
 POPULATION MODELS Environmental Stochasticity: Roc Flu Macro Terri Donovan recorded: January, 2010 All right - let's take a look at how you would use a spreadsheet to go ahead and do many, many, many simulations
Honors Chemistry Summer Assignment
 Honors Chemistry Summer Assignment Page 1 Honors Chemistry Summer Assignment 2014-2015 Materials needed for class: Scientific or Graphing Calculator Mrs. Dorman ldorman@ringgold.org Notebook with folder
Exploring the Pythagorean Theorem
 Exploring the Pythagorean Theorem Lesson 11 Mathematics Objectives Students will analyze relationships to develop the Pythagorean Theorem. Students will find missing sides in right triangles using the
TEKSING TOWARD STAAR MATHEMATICS GRADE 6. Student Book
 TEKSING TOWARD STAAR MATHEMATICS GRADE 6 Student Book TEKSING TOWARD STAAR 2014 Six Weeks 1 Lesson 1 STAAR Category 1 Grade 6 Mathematics TEKS 6.2A/6.2B Problem-Solving Model Step Description of Step 1
Year 11 Graphing Notes
 Year 11 Graphing Notes Terminology It is very important that students understand, and always use, the correct terms. Indeed, not understanding or using the correct terms is one of the main reasons students
HANDS-ON ACTIVITY 4 BUILDING SERIES AND PARALLEL CIRCUITS BACKGROUND WIRING DIRECTIONS
 ACTIVITY 4 BUILDING SERIES AND PARALLEL CIRCUITS BACKGROUND Make sure you read the background in Activity 3 before doing this activity. WIRING DIRECTIONS Materials per group of two: one or two D-cells
Excel Lab 2: Plots of Data Sets
 Excel Lab 2: Plots of Data Sets Excel makes it very easy for the scientist to visualize a data set. In this assignment, we learn how to produce various plots of data sets. Open a new Excel workbook, and
Use Linear Regression to Find the Best Line on a Graphing Calculator
 In an earlier technology assignment, you created a scatter plot of the US Student to Teacher Ratio for public schools from the table below. The scatter plot is shown to the right of the table and includes
Algebra/Geometry. Slope/Triangle Area Exploration
 Slope/Triangle Area Exploration ID: 9863 Time required 60 90 minutes Topics: Linear Functions, Triangle Area, Rational Functions Graph lines in slope-intercept form Find the coordinate of the x- and y-intercepts
15 TUBE CLEANER: A SIMPLE SHOOTING GAME
 15 TUBE CLEANER: A SIMPLE SHOOTING GAME Tube Cleaner was designed by Freid Lachnowicz. It is a simple shooter game that takes place in a tube. There are three kinds of enemies, and your goal is to collect
Laboratory 2: Graphing
 Purpose It is often said that a picture is worth 1,000 words, or for scientists we might rephrase it to say that a graph is worth 1,000 words. Graphs are most often used to express data in a clear, concise
Sketch-Up Guide for Woodworkers
 W Enjoy this selection from Sketch-Up Guide for Woodworkers In just seconds, you can enjoy this ebook of Sketch-Up Guide for Woodworkers. SketchUp Guide for BUY NOW! Google See how our magazine makes you
Land use in my neighborhood Part I.
 Land use in my neighborhood Part I. We are beginning a 2-part project looking at forests and land use in your home neighborhood. The goal is to measure trends in forest development in modern Ohio. You
A Quick Spin on Autodesk Revit Building
 11/28/2005-3:00 pm - 4:30 pm Room:Americas Seminar [Lab] (Dolphin) Walt Disney World Swan and Dolphin Resort Orlando, Florida A Quick Spin on Autodesk Revit Building Amy Fietkau - Autodesk and John Jansen;
Getting Started with Algebra 2. Perimeter and Area Models ID: 9837
 Perimeter and Area Models ID: 9837 By Holly Thompson Time required 30 minutes Activity Overview Students will look at data for the perimeter and area changes of a rectangle and triangle as their dimensions
A graph is an effective way to show a trend in data or relating two variables in an experiment.
 Chem 111-Packet GRAPHING A graph is an effective way to show a trend in data or relating two variables in an experiment. Consider the following data for exercises #1 and 2 given below. Temperature, ºC
Graphing Techniques. Figure 1. c 2011 Advanced Instructional Systems, Inc. and the University of North Carolina 1
 Graphing Techniques The construction of graphs is a very important technique in experimental physics. Graphs provide a compact and efficient way of displaying the functional relationship between two experimental
CPM Educational Program
 CC COURSE 1 ETOOLS Table of Contents General etools... 4 Algebra Tiles (CPM)... 5 Pattern Tile & Dot Tool (CPM)... 8 Area and Perimeter (CPM)...10 +/- Tiles & Number Lines (CPM)...13 Base Ten Blocks (CPM)...15
CALCULATING SQUARE ROOTS BY HAND By James D. Nickel
 By James D. Nickel Before the invention of electronic calculators, students followed two algorithms to approximate the square root of any given number. First, we are going to investigate the ancient Babylonian
Experiment 2: Electronic Enhancement of S/N and Boxcar Filtering
 Experiment 2: Electronic Enhancement of S/N and Boxcar Filtering Synopsis: A simple waveform generator will apply a triangular voltage ramp through an R/C circuit. A storage digital oscilloscope, or an
Scratch Coding And Geometry
 Scratch Coding And Geometry by Alex Reyes Digitalmaestro.org Digital Maestro Magazine Table of Contents Table of Contents... 2 Basic Geometric Shapes... 3 Moving Sprites... 3 Drawing A Square... 7 Drawing
Advanced Excel. Table of Contents. Lesson 3 Solver
 Advanced Excel Lesson 3 Solver Pre-reqs/Technical Skills Office for Engineers Module Basic computer use Expectations Read lesson material Implement steps in software while reading through lesson material
Algebra. Teacher s Guide
 Algebra Teacher s Guide WALCH PUBLISHING Table of Contents To the Teacher.......................................................... vi Classroom Management..................................................
MicroLab 500-series Getting Started
 MicroLab 500-series Getting Started 2 Contents CHAPTER 1: Getting Started Connecting the Hardware....6 Installing the USB driver......6 Installing the Software.....8 Starting a new Experiment...8 CHAPTER
Algebra 1 B Semester Exam Review
 Algebra 1 B 014 MCPS 013 014 Residual: Difference between the observed (actual) value and the predicted (regression) value Slope-Intercept Form of a linear function: f m b Forms of quadratic functions:
Star Defender. Section 1
 Star Defender Section 1 For the first full Construct 2 game, you're going to create a space shooter game called Star Defender. In this game, you'll create a space ship that will be able to destroy the
Existing and Design Profiles
 NOTES Module 09 Existing and Design Profiles In this module, you learn how to work with profiles in AutoCAD Civil 3D. You create and modify profiles and profile views, edit profile geometry, and use styles
Chapter 4 Number Theory
 Chapter 4 Number Theory Throughout the study of numbers, students Á should identify classes of numbers and examine their properties. For example, integers that are divisible by 2 are called even numbers
COMPUTING CURRICULUM TOOLKIT
 COMPUTING CURRICULUM TOOLKIT Pong Tutorial Beginners Guide to Fusion 2.5 Learn the basics of Logic and Loops Use Graphics Library to add existing Objects to a game Add Scores and Lives to a game Use Collisions
Actual testimonials from people that have used the survival guide:
 Algebra 1A Unit: Coordinate Plane Assignment Sheet Name: Period: # 1.) Page 206 #1 6 2.) Page 206 #10 26 all 3.) Worksheet (SIF/Standard) 4.) Worksheet (SIF/Standard) 5.) Worksheet (SIF/Standard) 6.) Worksheet
Making Middle School Math Come Alive with Games and Activities
 Making Middle School Math Come Alive with Games and Activities For more information about the materials you find in this packet, contact: Chris Mikles 916-719-3077 chrismikles@cpm.org 1 2 2-51. SPECIAL
Graphing with Excel. Data Table
 Graphing with Excel Copyright L. S. Quimby There are many spreadsheet programs and graphing programs that you can use to produce very nice graphs for your laboratory reports and homework papers, but Excel
10 GRAPHING LINEAR EQUATIONS
 0 GRAPHING LINEAR EQUATIONS We now expand our discussion of the single-variable equation to the linear equation in two variables, x and y. Some examples of linear equations are x+ y = 0, y = 3 x, x= 4,
Math 65A Elementary Algebra A Exam II STUDY GUIDE and REVIEW Chapter 2, Sections 3 5, and Chapter 3, Sections 1-3
 Exam II STUDY GUIDE and REVIEW Chapter 2, Sections 5, and Chapter, Sections 1 - Exam II will be given on Thursday, April 10. You will have the entire class time for the exam. It will cover Chapter 2, Sections
Summer Work th Grade Skills that are necessary for success in 7 th grade and beyond:
 Summer Work 208 6 th Grade Math to 7 th Grade Math 6 th Grade Skills that are necessary for success in 7 th grade and beyond: - ability to add subtract, multiply and divide decimals and fractions - solve
Relationship to theory: This activity involves the motion of bodies under constant velocity.
 UNIFORM MOTION Lab format: this lab is a remote lab activity Relationship to theory: This activity involves the motion of bodies under constant velocity. LEARNING OBJECTIVES Read and understand these instructions
Block: Date: Name: REVIEW Linear Equations. 7.What is the equation of the line that passes through the point (5, -3) and has a slope of -3?
 and has a slope of -3?") Name: REVIEW Linear Equations 1. What is the slope of the line y = -2x + 3? 2. Write the equation in slope-intercept form. Block: Date: 7.What is the equation of the line that passes through the point
Name: REVIEW Linear Equations 1. What is the slope of the line y = -2x + 3? 2. Write the equation in slope-intercept form. Block: Date: 7.What is the equation of the line that passes through the point
PROPORTIONAL VERSUS NONPROPORTIONAL RELATIONSHIPS NOTES
 PROPORTIONAL VERSUS NONPROPORTIONAL RELATIONSHIPS NOTES Proportional means that if x is changed, then y is changed in the same proportion. This relationship can be expressed by a proportional/linear function
Lab 4 Projectile Motion
 b Lab 4 Projectile Motion What You Need To Know: x x v v v o ox ox v v ox at 1 t at a x FIGURE 1 Linear Motion Equations The Physics So far in lab you ve dealt with an object moving horizontally or an
GREATER CLARK COUNTY SCHOOLS PACING GUIDE. Algebra I MATHEMATICS G R E A T E R C L A R K C O U N T Y S C H O O L S
 GREATER CLARK COUNTY SCHOOLS PACING GUIDE Algebra I MATHEMATICS 2014-2015 G R E A T E R C L A R K C O U N T Y S C H O O L S ANNUAL PACING GUIDE Quarter/Learning Check Days (Approx) Q1/LC1 11 Concept/Skill
Standing Waves. Miscellaneous Cables and Adapters. Capstone Software Clamp and Pulley White Flexible String
 Partner 1: Partner 2: Section: Partner 3 (if applicable): Purpose: Continuous waves traveling along a string are reflected when they arrive at the (in this case fixed) end of a string. The reflected wave
Excel Tool: Plots of Data Sets
 Excel Tool: Plots of Data Sets Excel makes it very easy for the scientist to visualize a data set. In this assignment, we learn how to produce various plots of data sets. Open a new Excel workbook, and
Table of Contents. Table of Contents 1
 Table of Contents 1) The Factor Game a) Investigation b) Rules c) Game Boards d) Game Table- Possible First Moves 2) Toying with Tiles a) Introduction b) Tiles 1-10 c) Tiles 11-16 d) Tiles 17-20 e) Tiles
Sect Linear Equations in Two Variables
 99 Concept # Sect. - Linear Equations in Two Variables Solutions to Linear Equations in Two Variables In this chapter, we will examine linear equations involving two variables. Such equations have an infinite
The 21 st Century Wireless Classroom Network for AP Calculus
 The 21 st Century Wireless Classroom Network for AP Calculus In this exploratory hands-on workshop, we will be solving Calculus problems with the HP Prime Graphing Calculator and the HP Wireless Classroom
Educator s Guide to Graphing y = mx + b
 Educator s Guide to Graphing y = mx + b Overview: Using an ipad and Sketchpad Explorer, students will graph a linear equation using the y intercept and slope. Grades and Subject Areas: High School Algebra
Lesson 2.1 Linear Regression
 Lesson 2.1 Linear Regression Activity 1 Line of Best Fit The scatterplot shows the area, E, of the Amazon rain forest remaining, in thousands of square kilometers, > years after 1980. > E 6 3745 8 3724
Try what you learned (and some new things too)
") Training Try what you learned (and some new things too) PART ONE: DO SOME MATH Exercise 1: Type some simple formulas to add, subtract, multiply, and divide. 1. Click in cell A1. First you ll add two numbers.
Training Try what you learned (and some new things too) PART ONE: DO SOME MATH Exercise 1: Type some simple formulas to add, subtract, multiply, and divide. 1. Click in cell A1. First you ll add two numbers.
Excel 2003: Discos. 1. Open Excel. 2. Create Choose a new worksheet and save the file to your area calling it: Disco.xls
 Excel 2003: Discos 1. Open Excel 2. Create Choose a new worksheet and save the file to your area calling it: Disco.xls 3. Enter the following data into your spreadsheet: 4. Make the headings bold. Centre
Getting Started. with Easy Blue Print
 Getting Started with Easy Blue Print User Interface Overview Easy Blue Print is a simple drawing program that will allow you to create professional-looking 2D floor plan drawings. This guide covers the
Conic and Quadric Surface Lab page 4. NORTHEASTERN UNIVERSITY Department of Mathematics Fall 03 Conic Sections and Quadratic Surface Lab
 Conic and Quadric Surface Lab page 4 NORTHEASTERN UNIVERSITY Department of Mathematics Fall 03 Conic Sections and Quadratic Surface Lab Goals By the end of this lab you should: 1.) Be familar with the
Sensor Calibration Lab
 Sensor Calibration Lab The lab is organized with an introductory background on calibration and the LED speed sensors. This is followed by three sections describing the three calibration techniques which
Lesson 1b Linear Equations
 In the first lesson we looked at the concepts and rules of a Function. The first Function that we are going to investigate is the Linear Function. This is a good place to start because with Linear Functions,
8.EE. Development from y = mx to y = mx + b DRAFT EduTron Corporation. Draft for NYSED NTI Use Only
 8.EE EduTron Corporation Draft for NYSED NTI Use Only TEACHER S GUIDE 8.EE.6 DERIVING EQUATIONS FOR LINES WITH NON-ZERO Y-INTERCEPTS Development from y = mx to y = mx + b DRAFT 2012.11.29 Teacher s Guide: