INDIAN PEAKS FOUR SEASON BIRD COUNTS TWENTY-YEAR SUMMARY
|
|
|
- Adam Thomas
- 6 years ago
- Views:
Transcription
1 INDIAN PEAKS FOUR SEASON BIRD COUNTS TWENTY-YEAR SUMMARY Dave Hallock 2478 Eldora Road Nederland, CO 8466
2 Published by Boulder County Nature Association, P.O. Box 493, Boulder, CO 836 The Boulder County Nature Association is an all-volunteer, non-profit organization committed to studying and preserving the natural history of Boulder County. For membership information, write BCNA, P.O. Box 493, Boulder, CO 836; or visit our web site at Cover photo: White-tailed ptarmigan by Ruth Carol Cushman Back cover photo: American dipper by Stephen Jones
3 INDIAN PEAKS FOUR SEASON BIRD COUNTS TWENTY-YEAR SUMMARY Abstract The Indian Peaks Four Season Bird Counts began in 1982 and are conducted much like a Christmas Bird Count; except they are held four times a year and counts can be conducted on any day during a several week period within each season. The 2-year period from was assessed in this report. There was an increasing trend for total number of birds seen during all four seasons over the 2-year period. The increasing trend was strongest during the first 13 years, and then there was a decline in total numbers that corresponded with a wetter weather period. However, total numbers at the end of the 2-year period were higher than at the beginning. The spring, breeding and fall counts were similar in their numeric cycles. The winter count was more variable and influenced by the presence or absence of irruptive species, including bohemian waxwing and red crossbill. The spring, breeding and fall counts were numerically dominated by neotropical and short-distance migrants, while resident birds dominated the winter count. Average annual temperature had a significant (P.5) positive correlation with breeding, fall, and winter resident annual total birds. Warmer temperatures correlated with more birds. Average annual spring temperature also proved to be a good predictor of annual breeding bird numbers. Precipitation proved to be a poorer predictor of bird numbers, though the nonsignificant correlations of average annual precipitation with annual spring, breeding, and fall bird counts were negative. Increased precipitation correlated with fewer birds. On the breeding count, short-distance and neotropical migrants had significant positive correlations with average annual temperature and average annual spring temperature. Only neotropical migrants had a significant correlation with precipitation (average annual), and it was negative. Resident breeding birds had no significant correlations with temperature or precipitation. Early arrival was more pronounced with some short-distance migrants during the spring, including some of the most common species like broad-tailed hummingbird and ruby-crowned kinglet. There was not much evidence of neotropical migrants arriving early in the Indian Peaks count area, though some warblers appear to be departing later. Corvids are the most consistent increasing species on all counts, particularly American crow, but also Steller s jay, Clark s nutcracker, and black-billed magpie. Black-capped chickadee has also been a steady four-season increaser. An increasing human population may be contributing to their well being. Ruby-crowned kinglet consistently increased during the spring, breeding and fall seasons. Yellow warbler and black-headed grosbeak had a constant increase on the breeding counts. Evening grosbeak has been a steady four-season decliner. Green-winged teal, spotted sandpiper, violet-green swallow, western tanager, brown-headed cowbird, and brown-capped rosy-finch exhibited continual declines on the breeding count. 1
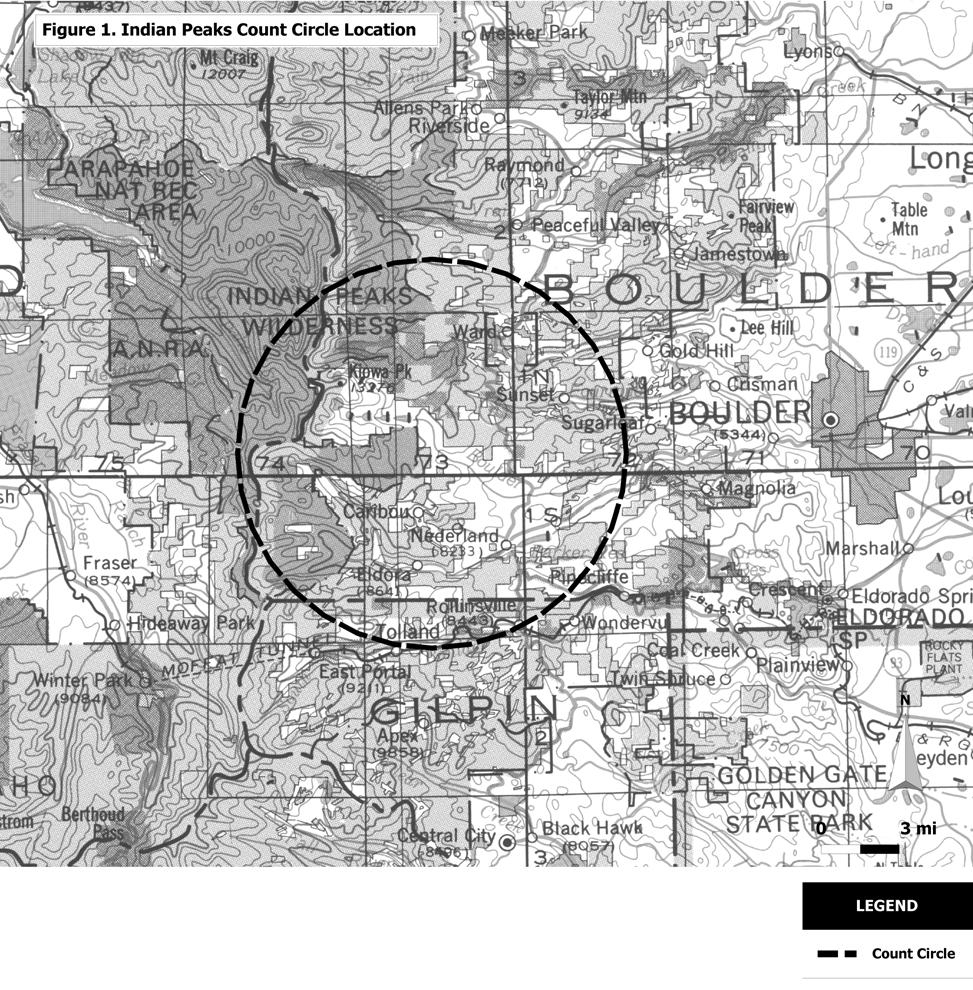
4 Introduction The purpose of the Indian Peaks Four Season Bird Counts is to track change in the types of avian species and their numbers between seasons and over time along the upper spine of the Southern Rocky Mountains in southwestern Boulder and northwestern Gilpin Counties. The counts began with a Christmas Bird Count on New Year s Day, With the exception of spring 1982, the count has occurred during each climatic season (winter, spring, summer [referred to as breeding], and fall) for 2 years. This report presents some of the findings from 1982 to 21. The data from the 2-year period showed seasonal differences in the types and numbers of birds observed. Temporally, some trends, cycles, and correlations are presented along with their possible relationship to changes in land use and weather. Study Area Methods The count area is primarily located in southwestern Boulder County, but portions of northwestern Gilpin and far eastern Grand Counties are included (Figure 1). The area is a 7.5- mile radius circle centered a half mile northeast of the Rainbow Lakes campground (4º 5 N, 15º33 4 W). Elevation ranges from 7,4 in Boulder and North Boulder Canyons to 13,52 on top of North Arapaho Peak. Habitat is dominated by four forest types and one grassland: ponderosa pine/douglas-fir forest below 8,5 ; Engelmann spruce/subalpine fir forest from 9,5 to 11, ; lodgepole pine and aspen forests between 8, and 1,, and alpine tundra above 11,5. Patches of open woodlands, meadows, wetlands, riparian areas, krummholz, lakes, reservoirs, urban areas, and limber pine are also present. Human population has grown within the study area over the 2-year period. The population for the census tracts encompassing the count circle (and covering an area larger than the circle) grew from 1,24 in 198 to 16,185 in 2, a 58% growth over the 2 years (U.S. Census Bureau data). Organization of the Count The organization of the count and methods for counting birds follows those recommended for the Audubon Christmas Bird Count (National Audubon Society 23), except for when the counts were held, which is further described below. The study area count circle is divided into 25 areas. Parties of participants cover as many of the areas as possible during each count; generally between 12 and 24 areas were covered. Participants walk, drive, ski, or snowshoe throughout each area recording all birds seen or heard. Participants keep track of time, distance and habitat covered in each area. Counts have averaged 8 party-hours of field time and covered 2 miles of ground. During the first ten years each seasonal count was held on a particular day, while during the second ten years a count period was established during which participants could conduct their count on any day within the period. During the first ten years, the count days were: Winter New Year s Day or the first Saturday of January; Spring first Saturday of May; Breeding second Saturday of June; Fall third Saturday of September. During the second ten years the 2
5 count periods were: Winter mid-december to mid-february; Spring first two weeks of May; Breeding June 1 to July 15 (the July period for subalpine areas); Fall second and third weeks of September. These differences will be noted, particularly when looking at spring and fall migrants. The numbers of birds counted is standardized for each count by dividing the number of birds by the number of party-hours for the count. A party-hour is each hour that the party, whether 1 person or each group of people birding together, is conducting the count. The 25 count areas within the count circle are classified as either montane (below 9, elevation) or subalpine/alpine (above 9, elevation), depending on the elevation that constituted the majority of habitat. Trends for individual bird species were assessed using four 5-year averages covering the 2-years of the count. Use of the terms short-distance migrant, neotropical migrant and resident generally follow Breeding Bird Survey guilds (Peterjohn and Sauer 1993). Adjustments were made to move some resident birds to short distance migrants, particularly those that are known to perform a vertical migration to lower elevation and are rarely present during the winter. Statistical analyzes were processed using the linear regression analysis function in the Microsoft Excel Statistical Analysis ToolPak (Microsoft Excel 2 V SR-1), which used the least squares method. Weather Weather can influence many aspects of avian ecology including nesting success, the timing of migration, and winter survival. It can also influence the effort of birdwatchers, as well as the ability to identify and detect birds. Temperature and precipitation data were taken from the C-1 site (1, elevation) at the Mountain Research Center of the University of Colorado (Losleben 23). The site was approximately 2 miles northeast of the center of the Indian Peaks Bird Count circle, and was located at 9,783 elevation. Temperature data indicated an increasing trend during the 2 years of the bird count (Figure 2). The historic average was 34.8 F for the 47-year period of data collection at C-1 (1953-2). The first several years of the counts saw below average temperatures, but since then there was generally an increase. The amount of precipitation was cyclic (Figure 3). The historic 47-year average is Four of the first five years of the count had above average precipitation. The next eight years ( ) were below average. Then, beginning with the exceptionally wet year of 1995 (36.9 ), four of the next five years saw above average precipitation. The final two years were well below average. It should be noted that when looking at a longer range of precipitation data ( ), the period was considered a wet period for Colorado and the Upper South Platte River basin (McKee et al. 1999). However, it is noted that snowpack was modest from The data from C-1 indicated below average precipitation for all those years. The greatest amounts of precipitation occurred in spring (9.7 ) and summer (6.8 ), while fall (5.4 ) and winter (5.1 ) had lower amounts. The four wettest months were April, May, March, and July. During the spring, the diminishing strength of the westerlies allowed Gulf air masses, in association with low-pressure weather systems, to push north with increasing 3
6 frequency resulting in heavy precipitation (Benedict 1991). July precipitation was more in the form of afternoon convectional storms, whose moisture also generally originated from the Gulf. Seasonal Comparisons Results Over 2 species were seen during the 2 years of the count. The breeding count has averaged the greatest number of species and individuals per count (Table 1). The spring and fall counts have averaged slightly fewer species and individuals than the breeding count. The winter count averaged fewer than half as many species and individuals as the breeding count. Resident species Table 1. Twenty-Year Seasonal Averages averaged 78% of all birds seen Winter Spring Breeding Fall on winter counts, but only Average # of Species % of the avifauna observed Average # of Individuals on breeding counts (Figure 4). (Per party-hour) Short-distance and neotropical migrants averaged 78% of all birds seen on breeding counts, 67% on spring counts, and 9% on fall counts. All four counts exhibited increasing numbers of birds during the 2-year period (Figures 5-8). The trend line was strongest for the breeding and fall counts and weakest for the spring and winter. The winter count numbers showed greater variability, probably influenced by irruptions of opportunistic boreal species in search of food. However, when irruptive species were excluded from the winter count and only the primary resident species were included, the fitness of the trend line increases. Figures 5-8 revealed some consistencies among numeric patterns for the various count seasons. The strongest relationships existed among the spring, breeding and fall counts. Beginning in 1982, all three counts exhibited an increasing numeric trend that peaked in the early 199s. This was followed by a decline, the steepness more pronounced in the spring and fall counts, which has been followed by another trend of numeric increase. The pattern of the winter counts was poorly correlated with the other three count periods. Five-year averaged increments portrayed a slightly different pattern of increase and decrease over the 2-years (Figure 9). The winter, spring and breeding counts all showed a decline during the last 5 years ( ), while the fall count exhibited a continual increase. Linear Regressions Between Weather and Number of Birds Linear regressions were run between weather data (independent variable) and annual seasonal count totals (dependent variable). Weather data included average annual temperature, average annual precipitation, and seasonal (winter, spring, summer, and fall) average temperature and precipitation. Four sets of regressions were run (Table 2): average annual weather data with the current season s count totals (e.g average annual temperature with spring count total for 1992); average seasonal weather data with the current season s count total (e.g spring average precipitation with spring count total for 1992); previous year s average annual weather data with the current season s total (e.g average annual temperature with 4
7 spring count total for 1992); and preceding season s weather data with the current season s count total (e.g average annual winter temperature with spring count total for 1992). Table 2. Linear Regressions Between Weather and Seasonal Count Totals (*P.5) Bird Count Weather Data Winter Spring Breeding Fall Temperature: r r² P r r² P r r² P r r² P Current Year * * Current Season * Preceding Season * Previous Year Precipitation: Current Year Current Season Preceding Season Previous Year Temperature proved to have the strongest correlation with the changes in number of birds seen from year-to-year (Table 2). Significant (P.5) positive correlations occurred between average annual temperature and breeding and fall count numbers. Breeding count numbers were also significantly positively correlated with the average temperature of the breeding season, as well as the temperature of the preceding (in this case spring) season, with the latter providing the strongest relationship. Precipitation proved to be a poorer predictor of annual change in seasonal bird numbers. No correlations proved significant. The strongest correlation was with the breeding count. There was a nonsignificant negative correlation between average annual precipitation and annual breeding count numbers. Winter Count Summary The winter count was the only one dominated by resident species, which comprise an average of 78% of all birds seen. Just over one of every four birds observed was a mountain chickadee. The 2-year trend for resident species was a gradual increase (Figure 4). The primary variable influencing the peaks and valleys of resident birds was the number of mountain chickadees, which ranged between per party-hour. While the change in annual numbers of all winter birds was not significantly correlated with weather trends (see Table 2), there was a positive relationship between winter resident birds and the change in average annual temperature (r² =.26; P =.2). The fluctuation of irruptive species was another story of the winter counts. Some boreal species, including Clark s nutcracker, red-breasted nuthatch, bohemian waxwing, pine grosbeak, red and white-winged crossbills, pine siskin, and evening grosbeak, periodically disperse south and east from Canada in winter, probably due to food shortages and/or cold temperatures in the north (Bock and Lepthien 1976). The presence or absence of irruptive species has greatly influenced the winter count totals. These patterns are often part of an irruption that is taking place over a greater geographic area. 5
8 The presence of bohemian waxwings was sometimes the single most important factor leading to a high count total, such as in 1987 and 1999 (Figures 4 and 1). Since 1982, there have been three exceptional waxwing appearances (greater than 1 per count hour), and an additional four other years of good appearances (between 2-5 per party-hour). The cycles of tree-cone seed-eating birds appeared related to the cone crops of local conifer species. High numbers of seed-eating birds occurred in relation to good cone crops, particularly on Engelmann spruce trees in the subalpine lifezone. Seed-eating bird numbers peaked three times during the 2-year count period: 1984, 1991, and 1995 (Figure 11). The number of these occurrences correlates with information on cone production of Engelmann spruce from the Fraser Experimental Forest located fifteen miles west of Boulder County (Alexander et al. 1986). There, the trees had two bumper cone crops during a fifteen-year period. Several other species proved to be numerically erratic and influenced the overall winter count totals. They were (with per party-hour ranges): pygmy nuthatch (-1.2), golden-crowned kinglet (-.6), Townsend s solitaire (.1-.7), American robin (-1.3), dark-eyed junco (-2.8), and all rosy-finches (-5.7). The Changing Seasons: Spring and Fall Summaries The spring and fall counts occurred during times of the year that signaled movement and change for many species. These counts were reference points for describing early and late migrants. Short-distance migrants greatly outnumbered neotropical migrants on both counts. Because count methodology changed between the first and second ten-year periods, from a single count day to a two-week period for the spring and fall counts, there are problems in looking at changes over the 2-year period. The spring count now runs later into May while the fall count runs earlier into September, making it likely that more migrating birds will be counted. The earlier arrival and later departure of migrants is of interest in light of possible global warming. Early arrival was more pronounced with short-distance migrants during the spring, including some of the most common species like broad-tailed hummingbird and ruby-crowned kinglet (Table 3). Because of the methodological differences between the first ten years and the second ten, the numbers are not comparable. But the pattern of more birds arriving early was present within both 1-year periods for many short-distance migrants. There was not much evidence of neotropical migrants arriving early in the Indian Peaks count area, though some warblers appear to be staying later. Table 3. Numbers of Selected Migrants on Spring and Fall Counts. Spring Fall Broad-tailed Hummingbird.11* Ruby-crowned Kinglet All Flycatchers All Neotropical Warblers * Numbers are per party-hour 5-year averages. 6
9 Breeding Count Summary The breeding count comes at a time when the majority of birds in the count area should be nesting. Short-distance migrants comprised almost half (48%) of all birds seen during the summer, followed by neotropical migrants (3%) and resident birds (22%). Like the other count seasons, the general numeric trend over the 2 years was an increase (Figure 7), with peaks and valleys that produced a high in the early 199s, and then a subsequent decline, though the numbers for most species (61%) were higher at the end of the 2-year period than at the start. There was a significant positive correlation between numbers of birds counted and average annual temperature, and with numbers of birds counted and average summer temperature (Table 2). However, the strongest correlation existed between numbers of birds counted and average spring temperature. All of these correlations were particularly strong within subalpine and alpine count areas (Table 4). Table 4. Correlation Between Temperature and Montane and Subalpine/Alpine Breeding Count Areas (*P.5) Montane Subalpine/Alpine Temperature Data: r r² P r r² P Current Year Average * * Current Season Average * Previous Season Average * * Previous Year Average * Additional data analysis provided some insight into the correlation between weather and the migratory status of birds. Numbers of resident species did not correspond with temperature or precipitation, whereas numbers of neotropical and short-distance migrants did. Numbers of neotropical migrants corresponded with average annual temperature (r² =.37; P =.4) and average spring temperature (r² =.33; P =.8), and exhibited a negative correlation with annual precipitation (r² =.24; P =.3). Short-distance migrants had a positive correlation with average annual temperature (r² =.39; P =.3), but were not significantly correlated with precipitation, though what relationship there was also was negative. However, their strongest relationship was with average spring temperature (r² =.44; P =.1). Increasers During the 2-year period, there was an overall increase in the number of birds reported (see Figures 5-8). Though the majority of species declined in number during the period, the averages for the period were still higher than the period (see Figure 9). The percentage of species exhibiting higher numbers during the last 5-year period than the first, for each season, were: winter 63%, spring 65%, breeding 58% and fall 61%. A similar trend was found in the Southern Rocky Mountains on the North American Breeding Bird Survey, where 61% of birds had in increasing trend between 198 and 21 (Sauer et al. 22). Several species exhibited a continual increase and were not subject to the decline during the period. Additionally, some of the increases were seen during all four seasons for resident birds. Black-capped chickadee stands out as the only four season continual increaser (Figure 12), while American crow had a continual increase for three of the four seasons (Figure 7
10 13). Ruby-crowned kinglet, a short-distance migrant not present during the winter, showed continual increase during its three seasons (Figure 14). Finally, for neotropical species only present during the breeding season, yellow warbler and black-headed grosbeak exhibited a continual increase (Figure 15). Besides American crow, all corvids have increased in number during all four seasons of the count (Figure 16). Steller s jays, Clark s nutcrackers, and black-billed magpies have demonstrated steady gains. Gray jays and common ravens have numerically held steady. Crows have also spatially expanded their regular range within the count area. During the period, crows were observed in 3% of the count areas; this number has now increased to over 6%. On the North American Breeding Bird survey, 5 of the 6 corvid species had significant increases from (Sauer 22). Decreasers Given that the majority of species had increasing trends over the 2-year period, those that did not tend to stand out, particularly those with continuous declines. They are shown in Figures 17 and 18. Evening grosbeak has been the most continuous and extreme decliner over all four seasons (Figure 17), and has a declining trend in the Southern Rocky Mountains on the Breeding Bird Survey. Christmas Bird Count data indicate a declining trend in North America, though much of the decline is centered in the east while in the west they appear stable (Kelling 22). A review of Colorado CBC data does not indicate a declining trend. The decline of brown-capped rosy-finch is of interest (Figure 18), as it is an endemic species to the Southern Rocky Mountains. There are insufficient data on the Breeding Bird Survey to note any trend. But rosy-finches have shown an overall decline during all four of the Indian Peak s count seasons (the numbers have included gray-crowned and black rosy-finches, particularly winter counts). Christmas Bird Count data for Colorado had the highest numbers of rosy-finches in the early 198s, and since then their numbers have been very cyclic. What we have observed in the Indian Peaks may be a localized situation. Some may view the decline of the brown-headed cowbird (Figure 18) as a good thing as they are brood parasites and can have adverse impacts on other avian species (Chace 1995). They show a declining trend on the Breeding Bird Surveys. Upward Mobility? There has been interest in possible distribution changes of avian species due to climate change, particularly global warming (Price 2). Birds may find habitat types that are currently marginal more appealing, and there could be an upward movement of some species. Is this occurring in the Indian Peaks? Yellow warbler and black-headed grosbeak have already been noted as increasers on the breeding count (Figure 15). Additionally, in the subalpine count areas black-capped chickadee and rock wren have consistently increased in number (Figure 19). 8
11 Discussion Participants of the Indian Peaks Bird Counts were somewhat baffled by the continual increase in number of birds during the first 1 years. There was speculation that it might be due to improving bird identification skills. This certainly could play a role with the initial numerical increases. As one participant expressed, I can look at the numbers for my count area over the years and see when I finally learned the song of the ruby-crowned kinglet. What else may be driving the changing numbers of birds seen in the Indian Peaks? Weather and continued urbanization could be two factors. The relationship between certain measurements of weather and bird numbers during this 2-year period is of interest. This is particularly true with so much recent attention being paid to the effects of global warming and drought. However, what was seen for primarily the breeding birds of the Indian Peaks was a significant positive correlation with higher temperatures along with a mostly non-significant negative correlation with more precipitation. The correlations were stronger in the higher, wetter, and colder climes of the subalpine lifezone than in the montane, and and they were stronger for neotropical and short-distance migrants than for resident birds. It is probable that the relationship between weather and number of birds is more complex than a simple linear regression. The current season s weather, the preceding season s weather, several sustained years of above or below average weather, or one extreme season may all play a part. But on the surface, temperature and precipitation data may help explain some of the variation in bird numbers. The initial low numbers found at the start of the count in 1982 may make sense when noting that seven out of the ten previous years had below average temperatures. The general numeric increase of birds through 1994 on the spring, breeding and fall seasons occurred during a period of above average temperature and below average precipitation. The highest breeding count numbers during the 2-year period occurred during the second warmest year. The drop in avian numbers in 1995 through 1999 occurred during a period of above average precipitation (though there was also above average temperature), punctuated by the exceptional spring moisture in The number of birds began to rebound in 2 as precipitation dropped and temperatures continued to rise. Though the drought year 22 is outside the period of this paper, it produced breeding bird numbers equal to the previous record high of Another change occurring within the count area that may have influenced the numbers of particular avian species was an increasing human presence from more homes. Members of the family Corvidae (jays, crows, magpies, and ravens) are known for their ability to live in close proximity to humans. Their numbers have been shown to increase in rural landscapes compared to more natural areas with little human habitation (Craig 1997). They increased more consistently in the montane, where there is more housing development, than in the subalpine and alpine (Figure 2). The continual increase for black-capped chickadee may also be related to more dwellings. Land use changes in the count area may also have contributed to the decline of brownheaded cowbirds. In 1982 close to 35% of National Forest land in the count area contained an active cattle-grazing allotment (Boulder District, Roosevelt National Forest, unpublished data). By 21, there were no active allotments. It was just a coincidence, but on the day that I ran the statistical analysis and first saw the positive correlation between temperature and birds for the Indian Peaks Bird Count, I had been rereading The Archaeology of Colorado (Cassells 1997) and the chapter on the Early Archaic 9
12 and the Altithermal Refugium. The premise is that during a period 4,5 to 7, years before present the climate was warmer and drier than most of the past 1, years, resulting in greater use, based on archaeological evidence, by prehistoric people of higher elevation sites and less use of the plains. It is theorized that if people were there, the animal and plant food resources must have been sufficient in the mountains during this warmer and drier period. Avian refugium? I doubt we can go that far. But the evidence suggests that warmer temperatures and less precipitation may not be limiting factors for most avian species of montane, subalpine, and alpine habitat as they may be for birds of lower elevations in Colorado. In fact, these might be the good times. The next ice age will possibly present more of a problem for many high elevation birds. Acknowledgments Two hundred and ninety-one participants have taken part during the 2 years. They have been the heart and sole of the counts. The following individuals have participated in the count for eight or more years (bold = participant for 15+ years): Linda Andes-Georges, Bev Baker, Barbara & Earl Bolton, Alex Brown, Diane Brown, George Coffee, Jack & Tressa Coss, Don & Marty Dick, Lee & Virginia Evans, Mike Figgs, Fern Ford, Dave Hallock, Paula Hansley, Elaine Hill, Lynn Hoffmann, Jim Holitza, Jody Hovorka, Steve Jones, Bill Kaempfer, Joe Krieg, Dawn Kummli, Nan Lederer, Cherie Long, Merle & Sally Miller, Paul Mintier, Naseem Munshi, Carol Newman-Holitza, Elm Sturkol, Michael Tupper, and Tom VanZandt. A special thanks goes to Bill Kaempfer who has helped with compilation. Dr. Carl Bock and Stephen R. Jones reviewed and provided constructive comments on the paper. Logistical support and weather data were provided by the NSF supported Niwot Ridge Long-Term Ecological Research Project and the University of Colorado Mountain Research Station. Todd Ackerman and Mark Losleben of the Mountain Research Station helped with obtaining weather information. Literature Cited Alexander, R., C. Edminster, and R. Watkins Estimating potential Engelmann spruce seed production on the Fraser Experimental Forest, Colorado. U.S.D.A. Forest Service Research Paper RM-269. Fort Collins. Benedict, A. D A Sierra Club Naturalist s Guide: The Southern Rocky Mountains. Sierra Club Books, San Francisco. Bock, C., and L. Lepthien Synchronous eruptions of boreal seed-eating birds. The American Naturalist. 11: Cassells, E. S The Archaeology of Colorado. Johnson Books, Boulder. Chace, J.F The Factors affecting the Reproductive Success of the Solitary Vireo (Vireo solitarius plumbeus) in Colorado. M.A. Thesis, University of Colorado, Boulder. 1
13 Craig, D. P An Experimental Analysis of Nest Predation in Western Coniferous Forests: A Focus on the Role of Corvids. PhD Thesis. Department of Environmental, Population, and Organismic Biology. University of Colorado, Boulder. Kelling, S. 22. Population Trends in Evening Grosbeaks. [online]. Available [February 23]. Losleben, M. 23. Niwot Ridge LTER Temperature and Precipitation Data for C-1 [online]. Available [January 23]. McKee, T. B., N. J. Doesken, and J. Kleist Historical Dry and Wet Periods in Colorado (Part A: Technical Report). Climatology Report No. 99-1A. Department of Atmospheric Science, Colorado State University, Fort Collins. National Audubon Society. 22. The Christmas Bird Count Historical Results [online]. Available [February 23]. National Audubon Society. 23. Audubon Christmas Bird Count Compilation Manual [online]. Available [January 24]. Peterjohn, B.G., and J.R. Sauer North American Breeding Bird Survey Annual Summary Bird Populations 1: Price, J. 2. Modeling the potential impacts of climate change on the summer distributions of Colorado s nongame birds. Journal of the Colorado Field Ornithologists. 34: Sauer, J.R., J.E. Hines, and J. Fallon. 22. The North American Breeding Bird Survey, Results and Analysis , version 22.1 (update of 29 May 22), USGS Patuxant Wildlife Research Center, Laurel, MD. [online]. Available [February 23]. 11
14 12
15 Figure 2. Average Annual Temperature ( F) and Trend Line, Data from C-1 station at University of Colorado Mountain Research Station (1, elevation) y =.341x R 2 =.629 Degrees F Historic 47-Year Average Year Figure 3. Average Annual Precipitation (inches) and Trend Line, Data from C-1 station at University of Colorado Mountain Research Station (1, elevation) Inches of Precipitation Historic 47-Year Average " y = x R 2 = Year 13
16 Figure 4. Resident and Migratory Bird Numbers, All Seasons, 2-Year Averages Winter Spring Breeding Fall Resident Short-Distance Migrants Neotropical Migrants Figure 5. Winter Count Totals and Trend Lines, y =.1369x R 2 =.215 y =.1833x R 2 = Year All Resident Linear (Resident) Linear (All) 14
17 Figure 6. Spring Count Totals and Trend Line, y =.3193x R 2 = Year Figure 7. Breeding Count Totals and Trend Line, y =.4459x R 2 = Year 15
18 Figure 8. Fall Count Totals and Trend Line, y =.4947x R 2 = Year Figure 9. Total Numbers, 5-Year Averages, All Seasons, Montane Subalpine
19 Figure 1. Number of Bohemian Waxwings on Winter Counts, Year Figure 11. Number of Selected Tree-Cone Seed-Eaters on Winter Counts, (Redbreasted Nuthatch, Pine Grosbeak, Red Crossbill and White-Winged Crossbill) Year 17
20 Figure 12. Number of Black-capped Chickadees, All Seasons, Winter Spring Breeding Fall Figure 13. Number of American Crows, All Seasons, Winter Spring Breeding Fall
21 Figure 14. Number of Ruby-crowned Kinglets, Spring, Breeding and Fall Counts, Spring Breeding Fall Figure 15. Number of Yellow Warblers and Black-headed Grosbeaks, Breeding Count, Yellow Warbler Black-headed Grosbeak
22 Figure 16. Number of Corvids, All Seasons, Winter Spring Breeding Fall Figure 17. Number of Evening Grosbeaks, All Seasons, Winter Spring Summer Fall
23 Figure 18. Number of Green-winged Teals, Spotted Sandpipers, Violet-green Swallows, Western Tanagers, Brown-headed Cowbirds, and Brown-capped Rosy-Finches, Breeding Season, Greenwinged Teal Spotted Violet-green Sandpiper Swallow Western Tanager Brownheaded Cowbird Browncapped Rosy-Finch Figure 19. Number of Black-capped Chickadees and Rock Wrens in Subalpine/Alpine Count Areas, Breeding Season, Black-capped Chickadee Rock Wren
24 Figure 2. Number of Corvids, Montane and Subalpine/Alpine Count Areas, Breeding Season, Montane Subalpine
Snake River Float Project Summary of Observations 2013
 We thank Anya Tyson for stepping in to organize the Nature Mapping volunteers and to compile the data for 2013. She kept the project afloat for the year. Below is Anya s report. Snake River Float Project
~ BIRD SURVEY'S ON Mr. MANs~.-LELD
 ~ BIRD SURVEY'S ON Mr. MANs~.-LELD Introduction: In 993, breeding bird censuses were conducted for a third consecutive year on two permanent study sites on Mt. Mansfield, as part of a long-term Vermont
Crater Lake National Park Habitats
 Overview Students will identify essential components of a habitat and presence of habitat & bird species at various Klamath Basin Birding Trail Sites. California Science Standards Grade 3: 3.b.c.d.-L.S.
Mixed Conifer Working Group Meeting February 17, 2011 Wildlife Habitat Management Considerations
 Mixed Conifer Working Group Meeting February 17, 2011 Wildlife Habitat Management Considerations Overview 1. Existing mixed conifer habitat 2. Habitat trends 3. Factors influencing wildlife habitat suitability
AN ASSESSMENTOFTHE WHITE-BREASTED NUTHATCH AND RED-BREASTED NUTHATCH ON RECENT NEW YORK STATE CHRISTMAS COUNTS
 AN ASSESSMENTOFTHE WHITE-BREASTED NUTHATCH AND RED-BREASTED NUTHATCH ON RECENT NEW YORK STATE CHRISTMAS COUNTS The White-breasted Nuthatch (Sitta carolinensis) and the Red-breasted Nuthatch (S. canadensis)
A survey of Birds of Forest Park in Everett, Washington
 A survey of Birds of Park in Everett, Washington This report summarizes a survey of bird species found in Park of Everett, Washington. The author is an intermediate-level, amateur birder who lives near
B IRD CONSERVATION FOREST BIRD SURVEY ENTERS FINAL WINTER V OLUME 11, NUMBER 1 JANUARY Board of. Trustees. Forest bird survey 1
 B IRD CONSERVATION V OLUME 11, NUMBER 1 JANUARY 2009 INSIDE THIS ISSUE: Forest bird survey 1 Forest bird survey (continued) 2 FOREST BIRD SURVEY ENTERS FINAL WINTER Forest bird paper 3 Populations decrease
Table 1b. Coverage and Capture Rates During 2018 Fall MM at IBS
 Table 1b. Coverage and Capture Rates During 218 Fall MM at IBS Date Net-hours New Bandings Captures Recaptures Escapes Mortalities Total Captures/1 Net-hours 28-Jul 72.3 7 1 8.11 29-Jul 72.8 4 2 6.8 3-Jul
FOREST BIRD SURVEYS ON MT. MANSFIELD AND UNDERBILL
 FOREST BIRD SURVEYS ON MT. MANSFIELD AND UNDERBILL STATE PARK Introduction: In 99, breeding bird censuses were conducted for a second year on two permanent study sites on Mt. Mansfield, as part of a long-term
Come one! Come All! Join the Fun! It is the season for The National Audubon Society 116th Annual Christmas Count.
 Come one! Come All! Join the Fun! It is the season for The National Audubon Society 116th Annual Christmas Count. "The Christmas Bird Count, started by Frank Chapman along with 26 other conservationists,
Water Valley where is it? Water Valley habitats Why bird there? The beaten track Birding sites. Some birds to watch for
 Brian Elder Water Valley where is it? Water Valley habitats Why bird there? The beaten track Birding sites Southern route - Just off the beaten track North of the beaten track a suggested route Some birds
Cordilleran Flycatcher (Empidonax occidentalis)
") Cordilleran Flycatcher (Empidonax occidentalis) NMPIF level: Species Conservation Concern, Level 2 (SC2) NMPIF assessment score: 15 NM stewardship responsibility: High National PIF status: No special status
Cordilleran Flycatcher (Empidonax occidentalis) NMPIF level: Species Conservation Concern, Level 2 (SC2) NMPIF assessment score: 15 NM stewardship responsibility: High National PIF status: No special status
Basic Bird Classification. Mia Spangenberg. Goal: Identify 30 species
 Basic Bird Classification Mia Spangenberg Goal: Identify 30 species Grouping Categories of Birds Major groups: shorebirds, sea birds, wading birds, raptors, song birds, waterfowl, game birds, Bird families:
Trends in numbers of migrant birds at Thunder Cape Bird Observatory ( )
") Trends in numbers of migrant birds at Thunder Cape Bird Observatory (1995-2002) 2003 Annual Report Produced for Ontario Ministry of Natural Resources Wildlife Assessment Program October 2003 Debbie S.
Trends in numbers of migrant birds at Thunder Cape Bird Observatory (1995-2002) 2003 Annual Report Produced for Ontario Ministry of Natural Resources Wildlife Assessment Program October 2003 Debbie S.
FOREST HABITAT 2015 ANNUAL REPORT
 SETTLEMENT AGREEMENT ARTICLE 0 FOREST HABITAT 01 ANNUAL REPORT REPORTING PERIOD JANUARY 1 DECEMBER 31, 01 BAKER RIVER HYDROELECTRIC PROJECT FERC No. 10 September 01 PUGET SOUND ENERGY Baker River Hydroelectric
Long Term Monitoring of Song Birds in Quetico Park 2014 & 2015 Data Summary
 Long Term Monitoring of Song Birds in Quetico Park 2014 & 2015 Data Summary May 2017 Jared Stachiw 1 and Brian Jackson 2 1 Quetico Foundation Biologist Intern 2 Quetico Park Biologist Staffing for this
2003 ANALYSIS OF AVIAN GUILD SPECIES DIVERSITY IN THE CARMEL RIVER RIPARIAN CORRIDOR. Twelfth Annual Report
 2003 ANALYSIS OF AVIAN GUILD SPECIES DIVERSITY IN THE CARMEL RIVER RIPARIAN CORRIDOR Twelfth Annual Report Prepared for the Monterey Peninsula Water Management District Monterey Peninsula Water Supply
Current Species Declines in the Willamette Valley. Andrea Hanson Oregon Department of Fish and Wildlife
 Current Species Declines in the Willamette Valley Andrea Hanson Oregon Department of Fish and Wildlife Oregon s Birds Oregon (OR): ~ 486 bird species 5 th in nation for bird diversity Part of the Pacific
Date: April, 20, 2013 Location: Lake Conestee Nature Park, 601 Fork Shoals Rd, Greenville, S.C.
 Trip Report Date: April, 20, 2013 Location: Lake Conestee Nature Park, 601 Fork Shoals Rd, Greenville, S.C. Leader: Jeff Click Species List Compiled by: Brad Dalton Total Species: 83 species Resources:
Black Swamp Bird Observatory Navarre Banding Station Fall 2014 Passerine Migration Monitoring Latitude 413 Longitude 0830
 Fall Passerine Migration Monitoring The 24th fall season began daily 20 August at our primary passerine banding station. This site is a barrier beach ridge along the southwest shore of Lake Erie. Operations
Black Swamp Bird Observatory Navarre, Ottawa NWR Banding Station Spring 2016
 Black Swamp Bird Observatory Navarre, Ottawa NWR Banding Station Spring The 38 th spring season began daily 16 April at the primary passerine banding station of the Black Swamp Bird Observatory. Operations
Paul Hess. List of Works 1 as of compiled by Jack E. Solomon, Past President and Founder Three Rivers Birding Club
 Paul Hess List of Works 1 as of 2010 compiled by Jack E. Solomon, Past President and Founder Three Rivers Birding Club 1 This enumeration of works accompanies a tribute to Paul Hess that appears in the
203 Species of Birds observed 1770 Checklists entered by UBB (Updated 7/3/17 H.Murphy) 21 Birding Stations (4 on Fish Lake Pontoon Boats)
 21 Birding Stations (4 on Fish Lake Pontoon Boats)") Bald Eagle on UBB Survey 6/6/2013 Tim Gallagher Wood Ducks on UBB Survey 7/3/2013 Tim Gallagher Pileated Woodpecker on UBB Survey 3/30/2014 Tim Gallagher American Dipper on UBB Survey 11/3/2016 Tim Gallagher
Bald Eagle on UBB Survey 6/6/2013 Tim Gallagher Wood Ducks on UBB Survey 7/3/2013 Tim Gallagher Pileated Woodpecker on UBB Survey 3/30/2014 Tim Gallagher American Dipper on UBB Survey 11/3/2016 Tim Gallagher
Earth Sanctuary. Breeding Bird Survey May 5-July 19, Compiled by Yvonne Palka and Frances Wood
 1 Earth Sanctuary Breeding Bird Survey May 5-July 19, 2003 Compiled by Yvonne Palka and Frances Wood Birds Identified as Breeding (using criteria established by the Audubon Society) Canada Goose Wood Duck
Subject: Pre-clearing Nest Survey Report for German Auto Import Network Track Near Duncan, B.C.
 Ursus Environmental Wildlife & Environmental Resource Consulting 600 Castle Way, Parksville, B.C. V9P 2R1 Ph/Fax: 250-248-1918 E-mail: ursusnanaimo@shaw.ca Date: April 11 th, 2014. To: Sarah Bonar, B.Sc.,
Greater White-fronted Goose Snow Goose** Brant Cackling Goose Canada Goose Cackling/Canada - undifferentiated goose sp.
 NOTE: Species with a ** require some corroboration. At a minimum, write a short statement about the basis of your identification. For species that are truly rare (and not just hard to identify), please
Bird Observations. Date Range: For. 1 of 5 2/29/2016 8:36 AM. Home About Submit Observations Explore Data My ebird Help
 1 of 5 2/29/2016 8:36 AM Home About Submit Observations Explore Data My ebird Help Hello Steve Lombardi (brycesteve) Preferences Sign Out Language «Hotspot Explorer Bird Observations For [ Mt. Diablo SP--Mitchell
Ute Mountain Mesa Verde Birding Festival Bird Species Tally May 10 14, 2017
 Bird Species Tally May 10 14, 2017 SPECIES Twenty-four tours in 2017 found a combined total of 160 bird species Number of Tours That Found Each Species DUCKS, GEESE, & SWANS Canada Goose 19 Gadwall 5 American
Migrate Means Move (K-3)
") Migrate Means Move (K-3) At a glance Students role play as migrating birds. Time requirement One session of 45 minutes Group size and grades Any group size Grades K-3 Materials Photos or illustrations
Migrate Means Move (K-3) At a glance Students role play as migrating birds. Time requirement One session of 45 minutes Group size and grades Any group size Grades K-3 Materials Photos or illustrations
B IRD CONSERVATION FOREST BIRD SURVEY PRODUCES ADDITIONAL POPULATION ESTIMATES
 B IRD CONSERVATION V OLUME 14, NUMBER 3 JULY 2012 INSIDE THIS ISSUE: Forest bird survey 1 Survey, continued 2 Field trips 3 FOREST BIRD SURVEY PRODUCES ADDITIONAL POPULATION ESTIMATES Blog 4 Membership
NOVEMBER 1-14, 2015 NATURAL HISTORY NOTES FOR EAST VIEW
 WHAT BIRDS CAN EASTVIEW EXPECT TO SEE THIS WINTER? 2015 2016 Let s start with an edited summary of the Winter Finch Forecast put out by Ron Pittaway of the Ontario Field Ornithologists from Toronto, Ontario
FORAGING BEHAVIOR OF THE PYGMY NUTHATCH IN COLORADO PONDEROSA PINE FORESTS
 FORAGING BEHAVIOR OF THE PYGMY NUTHATCH IN COLORADO PONDEROSA PINE FORESTS HEATHER EWELL and ALEXANDER CRUZ, Environmental, Population, and Organismic Biology Department, University of Colorado, Boulder,
Greenlaw Mountain Hawk Watch Fall 2012
 Greenlaw Mountain Hawk Watch Fall 2012 Our fourth season of data collection has been completed. There were numerous exciting moments and our season total was the second highest on record. Single-day high
Six Decades of Migration Counts in North Carolina
 Six Decades of Migration Counts in North Carolina Marilyn Westphal 230 Park Lane, Hendersonville, NC 28791 Introduction Might the day come when Turkeys are easier to come by than Northern Bobwhites? This
NEST BOX TRAIL HISTORY
 NEST BOX TRAIL HISTORY 1985-2016 by KEITH EVANS and JACK RENSEL INTRODUCTION In August of 1984, members of the Wasatch Audubon Society (Ogden, Utah) held a workshop to construct bluebird nesting boxes.
Say s Phoebe Sayornis saya Conservation Profile
 Ed Harper Habitat Use Profile Habitats Used in California Grasslands, 1,2 open areas with bare ground, 3 agricultural areas 1 Key Habitat Parameters Plant Composition No plant affinities known. Plant Density
Effects of Climate Change on Species and Ecosystems
 Effects of Climate Change on Species and Ecosystems Dr. David Karowe Department of Biological Sciences Some species are already responding to climate change 1. Geographic range shifts 2. Phenological shifts
Point-count Surveys of Bird Use in Olema Marsh Spring and Autumn A report to the Point Reyes National Seashore
 Point-count Surveys of Bird Use in Olema Marsh Spring and Autumn 2004 A report to the Point Reyes National Seashore Richard W. Stallcup 1 and John P. Kelly 2, 3 1 PRBO Conservation Science 4990 Shoreline
PHOTOGRAPHY. Birding Hotspots of UConn and the Surrounding Area JAMES ADAMS. 9 Merrow Meadow Park Fenton River.7. 5 New Storrs Cemetery 4
 9 Merrow Meadow Park 10 5 New Storrs Cemetery 4 6 Fenton River.7 7 Common Fields. 8 8 Eagleville Preserve..9 1 Horse Barn Hill. 1 2 W Lot.2 3 Mirror Lake 3 4 Swan Lake..3 9 Birding Hotspots of UConn and
Flammulated Owl Surveys in Sequoia National Forest 2011
 2011 Final Report Prepared for: U.S. Fish and Wildlife Service Sacramento, CA Cooperative Agreement No. 82011BJ111 Prepared by: Jenna E. Stanek, John R. Stanek, and Mary J. Whitfield Southern Sierra Research
Appendix D. MIS and Sensitive Plant Species and their Habitat Associations. Houston Longleaf Project Bankhead National Forest
 Appendix D MIS and Sensitive Plant Species and their Habitat Associations Houston Longleaf Project Bankhead National Forest Houston Longleaf Project Management Indicator Species and Major Terrestrial Habitat
Breeding Songbird Monitoring at the Seton Powerhouse Restoration (Sàt atqwa7) Site
 Site") Breeding Songbird Monitoring at the Seton Powerhouse Restoration (Sàt atqwa7) Site 2011 Summary Report Prepared by: Kenneth G. Wright Box 2341, Lillooet, BC V0K 1V0 Powerhouse (Sàt atqwa7) Breeding Birds
Breeding Songbird Monitoring at the Seton Powerhouse Restoration (Sàt atqwa7) Site 2011 Summary Report Prepared by: Kenneth G. Wright Box 2341, Lillooet, BC V0K 1V0 Powerhouse (Sàt atqwa7) Breeding Birds
CraNEsville Swamp Preserve
 CraNEsville Swamp Preserve A unique botanical and wildlife preserve Written by: Dan Whetzel Photography by: Lance C. Bell Alder Flycatcher Want to explore a unique botanical and wildlife preserve where
I know that during the winter you migrate. But where do you come from in the spring?
 Bird Migrations I know that during the winter you migrate. But where do you come from in the spring? Winter Summer -this is an example of Bird Migration, which for most migratory birds involves flying
Ute Mountain Mesa Verde Birding Festival Bird Species Tally May 9-13, 2018
 Bird Species Tally May 9-3, 208 SPECIES Twenty-six tours in 208 found a combined total of 67 bird species Number of Tours That Found Each Species DUCKS, GEESE, & SWANS Canada Goose 9 Gadwall 6 American
Iona Island Bird Observatory 2011 Year End Report
 Iona Island Bird Observatory 2011 Year End Report Mike Boyd, Rachel Field, Samantha Franks, David Hodkinson, Elly Knight, Paul Levesque, and Christine Rock Iona Island Bird Observatory c/o WildResearch,
Tour 14: Yellow Jkt Cyn and Cyn of the Ancients Guest Ranch. Tour 12: Nature Center at Butler Corner 1/2 Day. Tour 11: Pontoon on McPhee Reservoir
 SPECIES TOTALS BY TOUR 20 24 12 68 50 54 52 28 60 54 61 41 36 44 30 75 46 46 52 28 8 51 41 70 56 44 DUCKS, GEESE, & SWANS Canada Goose 19 Gadwall 6 American Wigeon 1 Wood Duck 1 Mallard 20 Blue-winged
EEB 4260 Ornithology. Lecture Notes: Migration
 EEB 4260 Ornithology Lecture Notes: Migration Class Business Reading for this lecture Required. Gill: Chapter 10 (pgs. 273-295) Optional. Proctor and Lynch: pages 266-273 1. Introduction A) EARLY IDEAS
Washington State Park Bird Census 2017
 Washington State Park Bird Census 2017 A report to the Missouri Department of Natural Resources Washington State Park Bird Census Summary The Missouri River Bird Observatory conducted a basic bird census
FWP Northwest Montana Terrestrial Climate Change Species Monitoring and Conservation Plan January 2010
 FWP Northwest Montana Terrestrial Climate Change Species Monitoring and Conservation Plan January 2010 Chris Hammond FWP Management Biologist Region One NW MT FWP Staff Terrestrial Climate Change Species
Commonly Seen Birds of the Prescott Area
 Commonly Seen Birds of the Prescott Area Waterfowl Canada Goose Gadwall American Wigeon Mallard Cinnamon Teal Northern Shoveler Northern Pintail Green-winged Teal Canvasback Redhead Ring-necked Duck Lesser
Nova Scotia Christmas Bird Count 2014
 Please Print Clearly ^^^^^^^^^^^^^^^^^^^^^^^^^^^^^ Count Name Count Circle Description (Please complete if different from last year) 'N 'W (Briefly describe centre. Describe points on circle's perimeter
MIGRATION MONITORING AT PRINCE EDWARD POINT FALL 2013
 MIGRATION MONITORING AT PRINCE EDWARD POINT FALL 2013 by Stéphane Menu, Ph.D. 502007 Grey Road #1 Georgian Bluffs Ontario, N0H 2T0 stefmenu@gmail.com prepared for PRINCE EDWARD POINT BIRD OBSERVATORY November
PHENOLOGY LESSON TEACHER GUIDE
 PHENOLOGY LESSON TEACHER GUIDE Age Group: Grades 6-12 Learning Objectives: To develop an understanding of the interconnectedness of the three trophic levels To make the connections between climate change
PART FIVE: Grassland and Field Habitat Management
 PART FIVE: Grassland and Field Habitat Management PAGE 64 15. GRASSLAND HABITAT MANAGEMENT Some of Vermont s most imperiled birds rely on the fields that many Vermonters manage as part of homes and farms.
Egg Dates for Species that Breed in the SAAS Chapter Area
 Egg Dates for Species that Breed in the SAAS Chapter Area Egg Dates Unfledged Juveniles Fledglings Species First Last First Last First Last Great Horned Owl 28-Jan 8-May 8-Mar 12-Jun 9-Apr 9-Jun Horned
The Effects of Climate Change on the Breeding Behavior and Migration Patterns of Birds and Mammals. Dr. Susan Longest Colorado Mesa University
 The Effects of Climate Change on the Breeding Behavior and Migration Patterns of Birds and Mammals Dr. Susan Longest Colorado Mesa University How much do we know? 1 st paper on climate change in birds
J A N U A R Y. Bird Calendar
 J A N U A R Y Watch for winter flocks of cardinals at your feeders. Observe which males and which females are dominant. Chickadees will also arrive in flocks. What other tag-along species show up at the
GULLS WINTERING IN FLORIDA: CHRISTMAS BIRD COUNT ANALYSIS. Elizabeth Anne Schreiber and Ralph W. Schreiber. Introduction
 GULLS WINTERING IN FLORIDA: CHRISTMAS BIRD COUNT ANALYSIS Elizabeth Anne Schreiber and Ralph W. Schreiber Introduction Christmas Bird Counts (CBC's) provide a unique data source for determining long term
HOW THE OTHER HALF LIVES: MONARCH POPULATION TRENDS WEST OF THE GREAT DIVIDE SHAWNA STEVENS AND DENNIS FREY. Biological Sciences Department
 HOW THE OTHER HALF LIVES: MONARCH POPULATION TRENDS WEST OF THE GREAT DIVIDE SHAWNA STEVENS AND DENNIS FREY Biological Sciences Department California Polytechnic State University San Luis Obispo, California
Arizona Field Ornithologist Annual Meeting 2017 Mini-expeditions. Sunday, 22 October
 Sunday, 22 October West Clear Creek West Clear Creek Wilderness Leader: David Vander Pluym One of a handful of prominent canyon drainages coming off the Colorado Plateau feeding crystal clear water into
Bird Field Guides. Summary: Students will explore field guides by identifying local bird species and their characteristics.
 Oregon State Standards Grade 3: 01,04,05- L.S. Grade 5: 01-L.S. Common Core Standards RI.3.1 RI.3.2 RI.3.7 RI.3.8 RI.3.9 RI.4.1 RI.4.2 RI.5.1 RI.6.1 RI.6.2 RI.7.1 RI.7.2 RI.8.1 RI.8.2 RI.9-10.1 RI.9-10.2
Bay breasted Warbler. Appendix A: Birds. Setophaga castanea. New Hampshire Wildlife Action Plan Appendix A Birds-288
 Bay breasted Warbler Setophaga castanea Federal Listing State Listing Global Rank State Rank Regional Status N/A S5 S4 Very High Photo by Len Medlock Justification (Reason for Concern in NH) Populations
1 Chickadee population trends
 1 Chickadee population trends The Analysis of Black-capped, Boreal, and Mountain Chickadee Population Trends across North America in Correlation with Changing Climate. Shyloh A. van Delft BIOL-225-001
Greenlaw Mountain Hawk Watch Fall 2014
 Greenlaw Mountain Hawk Watch Fall 2014 Another season has come to an end. Much was learned, volunteer participation remained strong and several rarities were recorded including two new raptor species.
2018 Ladd Marsh Bird Festival Field Trips Register at under the Bird Festival tab
 Friday, May 18th Field Trips Birds and Botany of the Ponderosa Pine Forest #1 Friday, May 18th, 2018, 6:30 AM 12:30 PM; $30 per participant Led by naturalists, Mike and Susan Daugherty, and Kent Coe, botanist
WVWA 2018 Wissahickon Birdathon Checklist
 Team: Count: This checklist contains 178 species recorded in birdathons from 1997 through 2017. Enter the locations you birded in the space provided at the top of each column. For each species recorded
Appendix L. Nova Scotia Museum Letter
 Appendix L Nova Scotia Museum Letter Appendix M Result Tables Supplementary Breeding Bird Survey, July 2005 Table M-1 Site by Site Comparison of the Number of Individuals Recorded and Number of Individuals
Recreational Trails and Bird Communities
 - 1 - Recreational Trails and Bird Communities INTRODUCTION One of the most insidious challenges facing scientific researchers is their tendency to find what they are looking for: it can be incredibly
Yearly Total Summary, Birds Banded, 1995 through 2012 Dan Brown's Hummer Ranch, Christoval, Texas Listed in Phylogenetic Order
 Yearly Total Summary, Birds Banded, 1995 through 2012 Dan Browns Hummer Ranch, Christoval, Texas Listed in Phylogenetic Order Wood Duck 1 1 2 Gadwall 2 2 Green Heron 1 1 Sharp-shinned Hawk 1 2 1 1 5 Cooper
10 th Annual Mono Basin Bird Chautauqua Sightings 2011 All Chautauqua Field Trips and Chautauqua Week
 10 th Annual Mono Basin Bird Chautauqua Sightings 2011 All Chautauqua Field Trips and Chautauqua Week Species Tally: 166 This list includes all birds seen during listed field trips and workshops and during
Black Tern Sightings in Minnesota:
 Nongame Wildlife Program Division of Ecological Services Minnesota Department of Natural Resources Black Tern Sightings in Minnesota: 1990-1995 Submitted to the U.S. Fish and Wildlife Service, Region 3
West Nile Virus and the Law of Averages
 West Nile Virus and the Law of Averages Steve Hampton 1201 Elk Place Davis, CA 95616 stevechampton@gmail.com 16 AMERICAN BIRDS Creating an Index to Analyze Christmas Bird Count Data: An Application to
Notes on a Breeding Population of Red-headed Woodpeckers in New York State. Jacob L. Berl and John W. Edwards
 Notes on a Breeding Population of Red-headed Woodpeckers in New York State Jacob L. Berl and John W. Edwards Division of Forestry and Natural Resources, West Virginia University Morgantown, WV 26505 The
Dead Bird Surveillance
 Dead Bird Surveillance Dead Bird Surveillance Highlights for 25 1,71 dead birds were reported to Health Line Peel a decrease of 48% from 24 and the lowest number since 22 Approximately 6% of the dead birds
Rancocas Birds Bar Graphs
 Rancocas Birds Bar Graphs Common = Five or more on almost all field trips. Fairly Common = One to four on most field trips. Uncommon = One or many individuals depending on species, but only on half the
Expansion Work Has Begun The perimeter dike for Cell 7 is now visible
 Summer/Fall 2017 In This Issue Poplar Island Expansion Wetland Cell 5AB Development Wildlife Update Birding tours on Poplar Island Expansion Work Has Begun The perimeter dike for Cell 7 is now visible
The Blue Heron. Executive Director's Corner. Birding for Everyone, October 6th Megan Prelinger, Naturalist
 The Blue Heron News from San Francisco Nature Education November 2018 Executive Director's Corner Dear Friends, I am writing to ask for your generous support of our school and public programs. San Francisco
Peregrine Falcon Falco peregrinus
 Plant Composition and Density Mosaic Distance to Water Prey Populations Cliff Properties Minimum Patch Size Recommended Patch Size Home Range Photo by Christy Klinger Habitat Use Profile Habitats Used
ASSESSING HABITAT QUALITY FOR PRIORITY WILDLIFE SPECIES IN COLORADO WETLANDS
 C O L O R A D O P A R K S Dabbling Ducks & W I L D L I F E GADWALL TOM KOERNER, USFWS / AMERICAN WIGEON BILL GRACEY NORTHERN PINTAIL GEORGIA HART / MALLARD MICHAEL MENEFEE, CNHP / ALL TEAL PHOTOS TOM KOERNER,
APPENDIX 5F BIRD AND WILDLIFE POINT COUNTS AND AREA SEARCH SURVEYS BY HABITAT TYPE
 APPENDIX 5F BIRD AND WILDLIFE POINT COUNTS AND AREA SEARCH SURVEYS BY HABITAT TYPE Terrestrial Resources FTR Appendix 5F.doc Appendix Table 5F-1. Total numbers of birds detected during 2002 avian plot
Horned Grebe vs. Eared Grebe: Head shape and occurrence timing
 IN THE SCOPE Horned Grebe vs. Eared Grebe: Head shape and occurrence timing Tony Leukering Introduction Though separation of Horned and Eared Grebes is well-covered in the typical field guides, many birders
Lewis s Woodpecker (Melanerpes lewis)
") Lewis s Woodpecker (Melanerpes lewis) NMPIF level: Species Conservation Concern, Level 1 (SC1) NMPIF assessment score: 18 NM stewardship responsibility: High National PIF status: Watch List New Mexico
Lewis s Woodpecker (Melanerpes lewis) NMPIF level: Species Conservation Concern, Level 1 (SC1) NMPIF assessment score: 18 NM stewardship responsibility: High National PIF status: Watch List New Mexico
Sea & Sage Audubon Southern Sierra Spring Trip May 16-19, 2014 Bob Barnes, Trip Leader
 MAY 16: Butterbredt Spring (6:15 9:00 AM) 70-84 Eurasian Collared-Dove 1 Yellow Warbler 2 Mourning Dove 11 Townsend s Warbler 1 hummingbird sp. 1 Wilson s Warbler 3 Ladder-backed Woodpecker 1 Yellow-breasted
Bluebonnet Bird Monitoring Project 2012 Annual Report
 Bluebonnet Bird Monitoring Project 2012 Annual Report Photos by Eric Liffmann Introduction to The Blubonnet Bird Monitoring Project The Bluebonnet Bird Monitoring Project (BBMP) is a collaborative effort
Abstract The American Redstart is a wood warbler that is in population decline in northern Michigan.
 Abstract The American Redstart is a wood warbler that is in population decline in northern Michigan. This study investigates the effect understory vegetation density has on the distribution of American
Anthropocene. Citizen science as an essential tool for studying the impacts of climate change on birds
 Anthropocene Citizen science as an essential tool for studying the impacts of climate change on birds Benjamin Zuckerberg Department of Forest and Wildlife Ecology University of Wisconsin Madison World
IMPACTS ON BIOLOGICAL SYSTEMS: ANIMALS MIGRATORY BIRD ARRIVALS Spring and fall arrivals of some migratory birds are changing
 visit http://www.oehha.ca.gov/multimedia/epic/climateindicators.html to read and download the full report IMPACTS ON BIOLOGICAL SYSTEMS: ANIMALS MIGRATORY BIRD ARRIVALS Spring and fall arrivals of some
COLORADO BIRDING. Prairies, Foothills, Sagebrush, and Rocky Mountains! June 21-27, 2017
 COLORADO BIRDING Prairies, Foothills, Sagebrush, and Rocky Mountains! June 21-27, 2017 A birding trip organized by Colorado Birding Adventures and Seven Ponds Nature Center Despite having no ocean coastline,
Modeling Habitat Relationships using Point Counts. Tim Jones Atlantic Coast Joint Venture
 Modeling Habitat Relationships using Point Counts Tim Jones Atlantic Coast Joint Venture Use of Point Counts Investigate responses of avian populations to management treatments or to environmental disturbances
Palmer Hay Flats. Audubon Important Bird Area and State Game Refuge BIRD CHECKLIST.
 Palmer Hay Flats Audubon Important Bird Area and State Game Refuge BIRD CHECKLIST www.miloburcham.com REVISED 2017 CHECKLIST KEY n Very Common: Easily found in the right habitat and season n Common: Found
Monitoring Avian Productivity and Survivorship on Oak Openings Preserve PROGRESS REPORT-2015 BSBO-16-3
 Monitoring Avian Productivity and Survivorship on Oak Openings Preserve Mark C. Shieldcastle, Research Director Black Swamp Bird Observatory 13551 West State Route 2 Oak Harbor, Ohio 43449 markshieldcastle@bsbo.org
Lucy's Warbler (Vermivora luciae)
") Lucy's Warbler (Vermivora luciae) NMPIF level: Species Conservation Concern, Level 1 (SC1) NMPIF assessment score: 17 NM stewardship responsibility: Moderate National PIF status: Watch List New Mexico
Lucy's Warbler (Vermivora luciae) NMPIF level: Species Conservation Concern, Level 1 (SC1) NMPIF assessment score: 17 NM stewardship responsibility: Moderate National PIF status: Watch List New Mexico
Project summary. Key findings, Winter: Key findings, Spring:
 Summary report: Assessing Rusty Blackbird habitat suitability on wintering grounds and during spring migration using a large citizen-science dataset Brian S. Evans Smithsonian Migratory Bird Center October
Kaibab National Forest Landbird Surveys 2005 MIGRATORY BIRD BREEDING SEASON
 Kaibab National Forest Landbird Surveys 2005 MIGRATORY BIRD BREEDING SEASON July 2006 Introduction Under the 1976 National Forest Management Act (NFMA), the Forest Service is directed to provide for diversity
BOULDER BIRD CLUB NEWS. BBC Officers And Coordinators. Presidents Letter.
 BOULDER BIRD CLUB NEWS http://www.boulderbirdclub.org Dedicated to the Field Observation of Birds Since 1947 BBC Officers And Coordinators President Presidents Letter Where have all the birds gone? Well,
Wildlife Habitat Management on State Forest and Wildlife Lands
 Wildlife Habitat Management on State Forest and Wildlife Lands State Forests are managed within a sustainable forestry framework under an approved management plan. Sustainability includes managing the
American Bittern Minnesota Conservation Summary
 Credit Jim Williams American Bittern Minnesota Conservation Summary Audubon Minnesota Spring 2014 The Blueprint for Minnesota Bird Conservation is a project of Audubon Minnesota written by Lee A. Pfannmuller
PROJECT WILDBIRD Food and Feeder Preferences of Wild Birds in the United States and Canada
 PROJECT WILDBIRD Food and Feeder Preferences of Wild Birds in the United States and Canada Executive Summary Dr. David J. Horn, Principal Investigator Department of Biology, Millikin University A Research
2017 LADD MARSH BIRD FESTIVAL FIELD TRIPS
 Saturday, May 20 th Field Trips #1. Birds and Botany of the Ponderosa Pine Forest #1 Saturday, May 20 th, 2017, 6:30 AM 12:30 PM; $10 per participant Led by naturalists Mike and Susan Daugherty, and Kent