THE SOCIALLY SMART COMMUNITY
|
|
|
- Emerald Johnson
- 5 years ago
- Views:
Transcription

1 THE SOCIALLY SMART COMMUNITY 2017 CIC Community Indicators Symposium Winnipeg, MB Canada June 12th and 13th 2017 Donald Cowan, Paulo Alencar, Kyle Young, Bryan Smale Tracy Birtch, Ryan Erb, Fred McGarry Presented by Fred McGarry E.D. the Centre for Community Mapping
2 Socially Smart Communities Abstract: Smarty Cities loudly promote the use of cell-phone GPS data, utility data etc., in applications that help with population and traffic flow and utility consumption etc. Socially Smart Communities quietly rely on data derived from interactions between citizens and community services for advances in economic development, health, community safety, education, housing, social health, volunteerism and democratic participation. Socially Smart Communities can analyze this data to track Socio-economic Indicators and combine this data to refine and improve their understanding of the current condition of vulnerable populations and the impacts of their initiatives and programs.
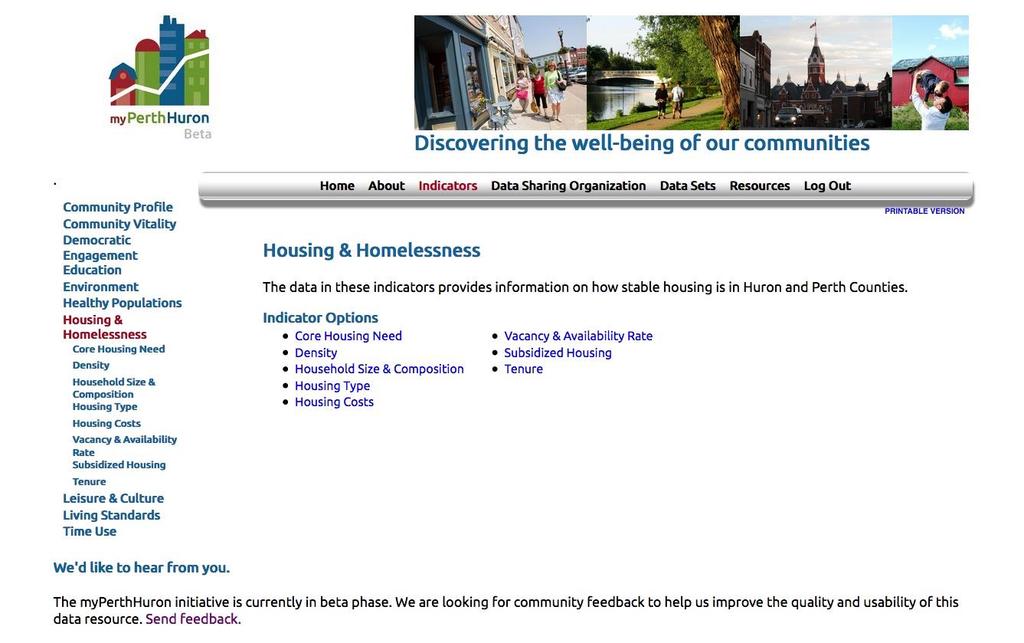
3 THE SOCIALLY SMART COMMUNITY A G E N D A The Socially Smart Community Canadian Index of Wellbeing The Case for Community-level Data Approaches to Identifying and Collecting Community Data Combining Data to Expose New Relationships Tools, Types of Analysis and Output Governance Privacy and Security MyPerthHuron.ca


4 The Eight Domains of the CIW
5 Validity the extent to which the indicator was directly related to well-being based on compelling evidence in the literature Criteria for the selection of CIW Indicators Quality the extent to which the indicator could be derived from credible sources and was easy to define and understand Reliability consistency in the way in which the indicator has been measured in different years (e.g., consistent question wording across survey years) Feasibility the extent to which data were available and relatively easily accessible.
6 Community Vitality Democratic Engagement Vital communities are those that have strong, active and inclusive relationships among residents, the private and public sectors, and civil society organisations, relationships that promote individual and collective well-being. Engagement democratically is the state of being involved in advancing democracy through political institutions, organisations, and activities. A healthy democracy requires ongoing democratic engagement both during and between elections. Education Societies that thrive encourage that thirst for knowledge at every age and stage. Domains of the Canadian Index of Wellbeing Environment The environment, the basis for our health, our communities, and our economy source of our sustained well-being. and is the Healthy Populations Leisure and Culture Living Standards Time Use Healthy populations: not only the physical, mental, and social well-being of the population, but life expectancy, lifestyle and behaviours, and the circumstances that influence health as well as health care quality, access, and public health services. By participating in leisure and cultural activities, whether arts, culture, or recreation, contributes to our well-being as individuals and to our communities. These forms of human expression help to fully define our lives, and ultimately, ultimately our well-being. The level and distribution of income and wealth, with particular emphasis on poverty rates, income volatility, employment, economic security, and work-related issues and outcomes. Time use measures how people experience and spend their time, and how the use of our time our affects well-being, our balance: the length of our work week and our work arrangements, time pressure, and the time we spend in leisure and volunteerism.
7 C o m p o n e n t S u b - c o m p o n e n t Indicator Social Engagement CIW Well-being indicators for the Community Vitality domain Social and civic participation Social support Community safety Social Norms and Values Attitudes towards community Percentage of population reporting participation in organized activities Percentage of population who provide unpaid help to other living on their own Percentage of population with six or more close friends Crime Severity Index Percentage of population that feels safe from crime walking alone at night Percentage of population that feels most or many people can be trusted Percentage of population that has experienced discrimination in the past five years Percentage of population reporting a very or somewhat strong sense of belonging to the community


8 Case for Community-Level Data 1: Dr. Snow plotted all the cases of cholera on the map and noticed that many were clustered close to the Broad Street pump, which was liked because of its flavour. Lesson learned: Location and local knowledge matters. Census and disease statistics alone wouldn t have solved the problem.

9 Case for Community - Level Data 2: Are Food Banks located where they are needed? Data: income, food store locations, food bank locations, school breakfast programs Lesson learned: Aggregated income data isn t sufficient, local insight is needed
10 Indicators such as those in the CIW, though initially identified through citizen consultation, are narrowed down, compiled and validated by experts. COMMUNITY-LEVEL INDICATORS ARE DIFFERENT Community-level indicators are often identified and derived by community-level organizations and individuals. An indicator s validity relies on the credibility of the supplier of the data and a consistent approach to collection and reporting. Community experts and external experts can, where feasible, work together to identify data needs and sources.

 uploaded to platform in real-time Local Data from Province, StatsCan, National Household Survey etc.")

11 Local groups that purchased data that can be compiled and incorporated into the platform Local 211 statistics e.g.: top 10 caller information requests Data from local service providers (hospitals, city social services, CAS, food banks etc.) uploaded to platform in real-time Local Data from Province, StatsCan, National Household Survey etc. Data from County, Municipal and First Nations sources Data from local community organizations such as local/ youth, seniors, service groups, grassroots organizations etc. Survey given to community members to discover overall perception and well-being (Pending funding) Additional data yet to be discovered from grassroots organization and groups and future research findings Data from local Health Units
12 We decided to only work with community-level experts in Perth-Huron. We recognize that we needed the leadership of a trusted party that could mobilize APPROACHES TO IDENTIFYING AND COLLECTING COMMUNITY-LEVEL DATA community participation. The United Way provided community connections and a collection point for fund requests, funds and data. Community foundations and charities can be trusted lead partners.
13 To identify appropriate data and collection opportunities : the stakeholder process must be inclusive formal groups could be the social service agencies, APPROACHES TO IDENTIFYING AND COLLECTING COMMUNITY-LEVEL DATA government departments, organized charities, educational authorities and public health units, where informal groups might be food banks, sports groups and churches could participate smaller and rural communities may be challenged with data analysis but software design and the temporary assistance of a data analyst can assist with identifying, organizing and downloading initial datasets
14 The trusted lead party needs to maintain the stakeholder structure to allow evolution of the original data scheme Participants should not able to share data without COMBINING DATA TO EXPOSE NEW RELATIONSHIPS some form of data-sharing agreement and related mutual permissions including what can be presented and to whom Geographic analysis of community-level data offers an opportunity to interrelate social, physical and biological indicators to yield insights into the influences of population, social organization, technology, and environmental effects upon a public problem or concern
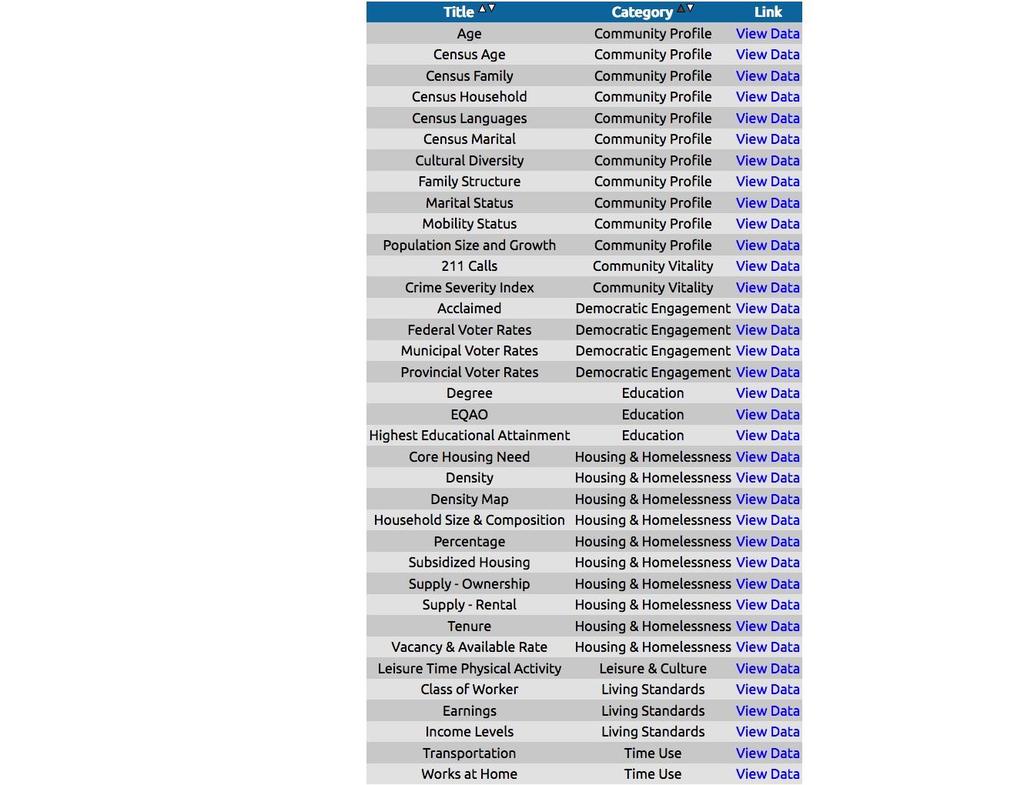
15 Income-based rental benchmark Market-based rental benchmark Affordability Benchmarks Income-based ownership benchmark Market-based ownership benchmark Percentage of new residential construction that is affordable to low and moderate income households HOUSING AND HOMELESSNESS INDICATORS Shelter cost-to-income ratio (percentage of households paying more than 30% of income on housing) Core Housing Need (affordability, adequacy and suitability) Percentage of households that require major repair Percentage of household living in overcrowded housing according to the National Occupancy Standard Percentage of households in core housing need (by tenure) Household size and composition Percentage of one person households Percentage of lone parent households
16 Average # of people per hectare Average # of people and jobs per hectare Ratio of people to jobs Density Ratio of land in residential use Average # of residential dwellings per hectare Average # of people per household HOUSING AND HOMELESSNESS INDICATORS Eviction Prevention Percentage of new residential units constructed in the built-up areas Usage of Rent Bank programs Usage of Emergency Energy programs # and type of emergency shelter beds (resources) Homelessness Number and profile of sheltered and unsheltered homeless Household size and composition ALOS in shelters Percentage of one person households Percentage of lone parent households
17 Supply - Private Number and mix of occupied dwellings (single-detached dwellings, semi- detached dwellings, row and town houses and apartments) Number and mix of new residential dwellings that have been completed each year Number and type of residential dwellings that have been demolished each year Market Ownership Number of rental units that have been converted to condominiums each year Average resale prices (by structure type) HOUSING AND HOMELESSNESS INDICATORS Supply -Private Market Rental Subsidized housing Tenure Average (or median) value of dwellings Vacancy rates (by unit size) Average rental rates by unit size Average amount spent on rent + utilities per month per renter household Number of new accessory apartments registered each year # of subsidized housing units (permanent v. temporary) # of supportive housing units (permanent v. temporary) Percentage of population that lives in subsidized housing Percentage change in the number of active households on the centralized waiting list (by unit size, household type and geography) Average waiting time for social housing (by unit size, household type and geography) Ratio between housed households and new applicants (by unit size, household type and geography) Trends in the number of rent supplement (housing allowance) units Building condition audits Ratio of owners to renters Age of primary household maintainers by tenure
18 TIME USE INDICATORS Arts and Culture Physical Activity Library Tourism Volunteering Faith participation in arts and culture events (not an organization) attendance at cultural events employment in cultural industries Municipal spending on all arts and culture as a % of total municipal expenditures Household expenditures in past year on culture and recreation as a % of total Leisure-time physical activity; moderately active or active (%) % of school-aged children walking to school Household spending on sports and recreation as a % of total expenditures % of population using gyms, walking clubs, running clubs, etc. on a regular basis # of free physical activity programs # of children/youth receiving subsidies for sports and recreation programs Municipal spending on recreation and parks as a percentage of total expenditures Usage of local recreation and cultural facilities % of population that are active patrons Library use (as measured by circulation/types of loans) Amount of time visitors spend here # of visitors to festivals # of tourists Proportion of residents planning a vacation in coming year Average number of days on holidays in previous year Volunteer hours associated with minor sports activities Volunteer hours associated with cultural activities % of population attending church/religious events on a regular basis Charitable giving rate for faith groups
19 While social indicators tend to be examined in isolated silos. It is not often that they are combined in order to determine interactions. Poverty, unemployment, poor health, poor housing, crime and COMBINING DATA TO EXPOSE NEW RELATIONSHIPS poor educational standards are not independent variables. There are many possible combinations. What is the geography of a community in relation to education, food security, health and income levels? How do income levels relate to food security or volunteering? Are poor people less healthy than those with a higher income? What biases can be dispelled about a community? There are just so many possibilities to explore.
20 Sharing data can be extremely powerful when trying to assess a community s well-being and plan through the implementation of future laws and policies. Tools to analyze the community indicator data can include: TOOLS, TYPES OF ANALYSIS AND OUTPUT the ability to access multiple datasets from different sources to display a single combined dataset; reports in the form of lists; tools such as graphs and charts to show data relationships; statistical tools to manipulate data; and maps to show geographic relationships of multiple data layers and to support geographic queries

21 ADAPTIVE MANAGEMENT CYCLE
 New or altered services Treat Repeat Longitudinal - time Convert community data to community")
22 Communities as Patients Personal health problem Vital signs Other Tests Diagnose Treat Repeat Community health problem Capture Data Vital signs, Tests Diagnose (analysis) New or altered services Treat Repeat Longitudinal - time Convert community data to community action/wisdom

23 Current Community Practice Obtain data StatsCan Reliable, old Questionnaires Sample Unavailable data Issues: Data is old (5 years?) Not community-based No treatment No way to measure treatment Diagnose Communities - huge sources of data

24 WATER QUALITY MODELLING & MONITORING WITH BIOLOGICAL MONITORING

25 WATER QUALITY MODELLING & MONITORING WITH BIOLOGICAL MONITORING
26 Several principles for governance by contributing community organizations are evolving from our research: Privacy of the individual and security of the data should be paramount; Gathering community-level data should be governed GOVERNANCE by the community and data suppliers; Suppliers of data own the data and can remove that data from the platform at any time; Organizations that wish to share data must respect the privacy of the individual; The consumers of the data may have confidence in the results; and The system will need an audit capability to ensure validity and reliability.
27 Community-level data are very resolute and can often be used to identify individuals. Suppliers and users of data, particularly when datasets PRIVACY AND SECURITY are combined should be very sensitive to how the data are to be used. Specifically, they should be clear about the audience for the results and whether the results should be accessible to the public. The platform needs to be designed to prevent unapproved access to data, particularly multiple datasets that when combined can often reveal personal details.
28 A steering committee should be established that is representative of the community and oversees the data PRIVACY AND SECURITY suppliers and acts on their behalf. Organizations that wish to share data to gain new insights into the community must sign data sharing agreements that respect the privacy of individuals and determine who can view the results.
29 How is it possible to make information accessible to appropriate agencies and support sharing among agencies? A community-based system can have a two-level PRIVACY AND SECURITY structure. Data can be: Public where the possibility of invasion of privacy is non-existent even when data sets are combined, or Published but protected where parties who want access to the data can only have access if they agree to a restrictive data sharing and to display this covenant.
30 How such a data and display covenant might operate. A data sharing and display agreement is signed among all participants with the conditions under which the data becomes available to whom and how to decide what is displayed. PRIVACY AND SECURITY The data is uploaded to a cloud platform and secured: Access to the data can be provided through a twofactor or two-step verification process where users must supply two different components to identify themselves. In order to provide an extra degree of security the data can be encrypted where sharing of keys is limited.

31
32

33
34

35

36

37
38

39
40


41 THANK YOU
Neighbourhood Profiles Census and National Household Survey
 Neighbourhood Profiles - 2011 Census and National Household Survey 8 Sutton Mills This neighbourhood profile is based on custom area tabulations generated by Statistics Canada and contains data from the
Neighbourhood Profiles Census and National Household Survey
 Neighbourhood Profiles - 2011 Census and National Household Survey 1 Sharpton/Glenvale This neighbourhood profile is based on custom area tabulations generated by Statistics Canada and contains data from
How a People Classification Can Add Value to Census Data. Simon Perry
 How a People Classification Can Add Value to Census Data Simon Perry Presentation outline Why the census is useful and what s better this time Disclosure protection and spatial analysis What the census
0-4 years: 8% 7% 5-14 years: 13% 12% years: 6% 6% years: 65% 66% 65+ years: 8% 10%
 The City of Community Profiles Community Profile: The City of Community Profiles are composed of two parts. This document, Part A Demographics, contains demographic information from the 2014 Civic Census
Census Response Rate, 1970 to 1990, and Projected Response Rate in 2000
 Figure 1.1 Census Response Rate, 1970 to 1990, and Projected Response Rate in 2000 80% 78 75% 75 Response Rate 70% 65% 65 2000 Projected 60% 61 0% 1970 1980 Census Year 1990 2000 Source: U.S. Census Bureau
Methodology Statement: 2011 Australian Census Demographic Variables
 Methodology Statement: 2011 Australian Census Demographic Variables Author: MapData Services Pty Ltd Version: 1.0 Last modified: 2/12/2014 Contents Introduction 3 Statistical Geography 3 Included Data
Population and dwellings Number of people counted Total population
 Henderson-Massey Local Board Area Population and dwellings Number of people counted Total population 107,685 people usually live in Henderson-Massey Local Board Area. This is an increase of 8,895 people,
Working with NHS and Taxfiler data to measure income and poverty in Toronto neighbourhoods
 Working with NHS and Taxfiler data to measure income and poverty in Toronto neighbourhoods Wayne Chu Planning Analyst Social Development, Finance & Administration, City of Toronto CCSD Community Data Canada
Population and dwellings Number of people counted Total population
 Whakatane District Population and dwellings Number of people counted Total population 32,691 people usually live in Whakatane District. This is a decrease of 606 people, or 1.8 percent, since the 2006
2016 Census Bulletin: Families, Households and Marital Status
 2016 Census Bulletin: Families, Households and Marital Status Kingston, Ontario Census Metropolitan Area (CMA) The 2016 Census Day was May 10, 2016. On August 2, 2017, Statistics Canada released its fourth
The main focus of the survey is to measure income, unemployment, and poverty.
 HUNGARY 1991 - Documentation Table of Contents A. GENERAL INFORMATION B. POPULATION AND SAMPLE SIZE, SAMPLING METHODS C. MEASURES OF DATA QUALITY D. DATA COLLECTION AND ACQUISITION E. WEIGHTING PROCEDURES
NISRA Merged Report. Area Profile Report. Created Friday, July 04, :54 PM. Page 1
 Area Profile Report Created Friday, July 04, 2014 1:54 PM Page 1 Area Profile of Enniskillen Neighbourhood Renewal Area (NRA) Enniskillen NRA covers the Galliagh Park, Rossory Church Road, Windmill Heights,
Chart 20: Percentage of the population that has moved to the Regional Municipality of Wood Buffalo in the last year
 130 2012 Residents were asked where they were living one year prior to Census 2012. Chart 20 illustrates that 90.6% of respondents were living in the Municipality within the last year (77.5% were at the
Enfield CCG. CCG 360 o stakeholder survey 2015 Main report. Version 1 Internal Use Only Version 1 Internal Use Only
 CCG 360 o stakeholder survey 2015 Main report Version 1 Internal Use Only 1 Table of contents Slide 3 Background and objectives Slide 4 Methodology and technical details Slide 6 Interpreting the results
Oxfordshire CCG. CCG 360 o stakeholder survey 2015 Main report. Version 1 Internal Use Only Version 1 Internal Use Only
 CCG 360 o stakeholder survey 2015 Main report Version 1 Internal Use Only 1 Table of contents Slide 3 Background and objectives Slide 4 Methodology and technical details Slide 6 Interpreting the results
Southern Derbyshire CCG. CCG 360 o stakeholder survey 2015 Main report. Version 1 Internal Use Only Version 1 Internal Use Only
 CCG 360 o stakeholder survey 2015 Main report Version 1 Internal Use Only 1 Table of contents Slide 3 Background and objectives Slide 4 Methodology and technical details Slide 6 Interpreting the results
South Devon and Torbay CCG. CCG 360 o stakeholder survey 2015 Main report Version 1 Internal Use Only
 CCG 360 o stakeholder survey 2015 Main report 1 Table of contents Slide 3 Background and objectives Slide 4 Methodology and technical details Slide 6 Interpreting the results Slide 7 Using the results
Portsmouth CCG. CCG 360 o stakeholder survey 2015 Main report. Version 1 Internal Use Only Version 1 Internal Use Only
 CCG 360 o stakeholder survey 2015 Main report Version 1 Internal Use Only 1 Table of contents Slide 3 Background and objectives Slide 4 Methodology and technical details Slide 6 Interpreting the results
2016 Census Bulletin: Age and Sex Counts
 2016 Census Bulletin: Age and Sex Counts Kingston, Ontario Census Metropolitan Area (CMA) The 2016 Census Day was May 10, 2016. On May 3, 2017, Statistics Canada released its second set of data from the
; ECONOMIC AND SOCIAL COUNCIL
 Distr.: GENERAL ECA/DISD/STAT/RPHC.WS/ 2/99/Doc 1.4 2 November 1999 UNITED NATIONS ; ECONOMIC AND SOCIAL COUNCIL Original: ENGLISH ECONOMIC AND SOCIAL COUNCIL Training workshop for national census personnel
Sutton CCG. CCG 360 o stakeholder survey 2015 Main report. Version 1 Internal Use Only Version 1 Internal Use Only
 CCG 360 o stakeholder survey 2015 Main report Version 1 Internal Use Only 1 Table of contents Slide 3 Background and objectives Slide 4 Methodology and technical details Slide 6 Interpreting the results
The Census questions. factsheet 9. A look at the questions asked in Northern Ireland and why we ask them
 factsheet 9 The Census questions A look at the questions asked in Northern Ireland and why we ask them The 2001 Census form contains a total of 42 questions in Northern Ireland, the majority of which only
Support Needs Questionnaire
 Support Needs Questionnaire Version 2.3: February 2011 Name: Address: This questionnaire is for you to complete with the social worker from Newcastle City Council Adult and Culture Services. You will already
ESSnet on DATA INTEGRATION
 ESSnet on DATA INTEGRATION WP5. On-the-job training applications LIST OF CONTENTS On-the-job training courses 2 1. Introduction 2. Ranking the application on record linkage 2 Appendix A - Applications
Health Record Linkage at Statistics Canada
 Health Record Linkage at Statistics Canada www.statcan.gc.ca Telling Canada s story in numbers Nicole Aitken, Philippe Finès Statistics Canada Thursday, November 16 th 2017 Why use linked data? Harnessing
Strategies for the 2010 Population Census of Japan
 The 12th East Asian Statistical Conference (13-15 November) Topic: Population Census and Household Surveys Strategies for the 2010 Population Census of Japan Masato CHINO Director Population Census Division
Objective 3.1: Provide or stimulate provision by the private sector of affordable housing units.
 3. HOUSING ELEMENT The purpose of this element is to provide plans and policies that will assist the City in meeting identified or projected deficits in the supply of housing, correcting substandard or
Chapter 1 Introduction
 Chapter 1 Introduction Statistics is the science of data. Data are the numerical values containing some information. Statistical tools can be used on a data set to draw statistical inferences. These statistical
Neighbourhood Profiles Census
 Neighbourhood Profiles - 2011 Census 35 Queen s This neighbourhood profile is based on custom area tabulations generated by Statistics Canada and contains data from the 2011 Census only. The 2011 National
TOGETHER FOR CHANGE AND A FAIR EINDHOVEN
 TOGETHER FOR CHANGE AND A FAIR EINDHOVEN Political program Together for change, and a fair Eindhoven GroenLinks' choice is for a fair Eindhoven. Where everyone is given the same opportunities. Where the
Housekeeping items. Bathrooms Breaks Evaluations
 Housekeeping items Bathrooms Breaks Evaluations Welcome Welcome and Introduction 10:00-10:15 Census 101 10:15-11:15 Break 11:15-11:30 Complete Count Committee Planning 11:30-12:45 Lunch 12:45-1:45 Complete
The Role of Libraries in Narrowing the Gap Between the. Information Rich and Information Poor. A Brief Overview on Rural Communities. Alba L.
 The Role of Libraries 1 The Role of Libraries in Narrowing the Gap Between the Information Rich and Information Poor. A Brief Overview on Rural Communities. Alba L. Scott Library 200 Dr. Wagers March 18,
West Norfolk CCG. CCG 360 o stakeholder survey 2014 Main report. Version 1 Internal Use Only Version 7 Internal Use Only
 CCG 360 o stakeholder survey 2014 Main report Version 1 Internal Use Only 1 Background and objectives Clinical Commissioning Groups (CCGs) need to have strong relationships with a range of health and care
AN INQUIRY INTO THE CONSUMPTION OF GAMING SERVICES BY MALTESE RESIDENTS
 AN INQUIRY INTO THE CONSUMPTION OF GAMING SERVICES BY MALTESE RESIDENTS MARCH 2017 MALTA GAMING AUTHORITY 01 02 MALTA GAMING AUTHORITY AN INQUIRY INTO THE CONSUMPTION OF GAMING SERVICES BY MALTESE RESIDENTS
SMART PLACES WHAT. WHY. HOW.
 SMART PLACES WHAT. WHY. HOW. @adambeckurban @smartcitiesanz We envision a world where digital technology, data, and intelligent design have been harnessed to create smart, sustainable cities with highquality
How It Works and What s at Stake for Massachusetts. Wednesday, October 24, :30-10:30 a.m.
 How It Works and What s at Stake for Massachusetts Wednesday, October 24, 2018 8:30-10:30 a.m. The Original 1790 Census 1. Name of the head of the family 2. # of free white males16 y.o.+ 3. # of free
Maintaining knowledge of the New Zealand Census *
 1 of 8 21/08/2007 2:21 PM Symposium 2001/25 20 July 2001 Symposium on Global Review of 2000 Round of Population and Housing Censuses: Mid-Decade Assessment and Future Prospects Statistics Division Department
Virginia Employment Commission
 Small-Area Data and Graphs for New Kent County Virginia Employment Commission 703 East Main Street Richmond, Virginia 23219 Tel: (804) 786-8223 www.virginialmi.com Last updated: 2/6/2017 2:25:29 PM Table
Testing the Progress Out of Poverty Index: Triangulation of the PPI with Key Informant Wealth Ranking Exercises and SILC Financial Diaries Data
 Testing the Progress Out of Poverty Index: Triangulation of the PPI with Key Informant Wealth Ranking Exercises and SILC Financial Diaries Data Expanding Financial Inclusion Project Catholic Relief Services
Virginia Employment Commission
 Small-Area Data and Graphs for Mecklenburg County Virginia Employment Commission 703 East Main Street Richmond, Virginia 23219 Tel: (804) 786-8223 www.virginialmi.com Last updated: 2/6/2017 2:24:09 PM
Recovery Capital Tool
 Recovery Capital Tool Your Personal Recovery Journey. Produced by WDP, Great Expectations & Genesis Housing Association residents 2 Recovery Recovery: what does it all mean? Recovery doesn t mean returning
Virginia Employment Commission
 Small-Area Data and Graphs for Lancaster County Virginia Employment Commission 703 East Main Street Richmond, Virginia 23219 Tel: (804) 786-8223 www.virginialmi.com Last updated: 2/6/2017 2:03:07 PM Table
Measuring ICT use by businesses in Brazil: The Project of the Brazilian Institute of Geography and Statistic (IBGE)
") Measuring ICT use by businesses in Brazil: The Project of the Brazilian Institute of Geography and Statistic (IBGE) International Seminar on Information and Communication Technology Statistics Roberto
Measuring ICT use by businesses in Brazil: The Project of the Brazilian Institute of Geography and Statistic (IBGE) International Seminar on Information and Communication Technology Statistics Roberto
Vanuatu - Household Income and Expenditure Survey 2010
 National Data Archive Vanuatu - Household Income and Expenditure Survey 2010 Vanuatu Nationall Statistics Office - Ministry of Finance and Economic Management Report generated on: August 20, 2013 Visit
Development Strategies of Leisure Sports Industry and It's Significance on the Process of Turning Chengdu into an Oriental Capital of Leisure Wei Ren
 4th International Education, Economics, Social Science, Arts, Sports and Management Engineering Conference (IEESASM 2016) Development Strategies of Leisure Sports Industry and It's Significance on the
Medical Legal Partnerships (MLP) in a Hospital Setting
 in a Hospital Setting") Medical Legal Partnerships (MLP) in a Hospital Setting PRISCILLA KEITH, JD, MS EXECUTIVE DIRECTOR COMMUNITY HEALTH NETWORK OFFICE OF COMMUNITY BENEFIT RAKUYA K. TRICE, JD MEDICAL LEGAL PARTNERSHIP LAWYER
Medical Legal Partnerships (MLP) in a Hospital Setting PRISCILLA KEITH, JD, MS EXECUTIVE DIRECTOR COMMUNITY HEALTH NETWORK OFFICE OF COMMUNITY BENEFIT RAKUYA K. TRICE, JD MEDICAL LEGAL PARTNERSHIP LAWYER
million people connected to wastewater systems Water million people supplied with water Waste
 ForCity 1 Veolia approach to sustainable and smart city Today, natural resources are becoming increasingly scarce while our needs are growing in an ever more densely populated and urbanized world facing
ESP 171 Urban and Regional Planning. Demographic Report. Due Tuesday, 5/10 at noon
 ESP 171 Urban and Regional Planning Demographic Report Due Tuesday, 5/10 at noon Purpose The starting point for planning is an assessment of current conditions the answer to the question where are we now.
Pan-Canadian Trust Framework Overview
 Pan-Canadian Trust Framework Overview A collaborative approach to developing a Pan- Canadian Trust Framework Authors: DIACC Trust Framework Expert Committee August 2016 Abstract: The purpose of this document
STATISTICS ACT NO. 4 OF 2006 STATISTICS (CENSUS OF POPULATION) ORDER, 2008 SUBSIDIARY LEGISLATION. List of Subsidiary Legislation.
 ORDER, 2008 SUBSIDIARY LEGISLATION. List of Subsidiary Legislation.") NO. 4 OF 2006 STATISTICS ACT SUBSIDIARY LEGISLATION Page List of Subsidiary Legislation 1. Statistics (Census of Population) Order, 2008... S18 21 STATISTICS (CENSUS OF POPULATION) ORDER, 2008 [L.N. 107/2008.]
NO. 4 OF 2006 STATISTICS ACT SUBSIDIARY LEGISLATION Page List of Subsidiary Legislation 1. Statistics (Census of Population) Order, 2008... S18 21 STATISTICS (CENSUS OF POPULATION) ORDER, 2008 [L.N. 107/2008.]
A Comprehensive Statewide Study of Gambling Impacts: Implications for Public Health
 A Comprehensive Statewide Study of Gambling Impacts: Implications for Public Health Rachel A. Volberg 2 nd Annual Maryland Conference on Problem Gambling June 13, 2014 Acknowledgement We would like to
National Economic Census 2018: A New Initiative in National Statistical System of Nepal
 National Economic Census 2018: A New Initiative in National Statistical System of Nepal ( A paper presented on Inception Seminar on First National Economic Census 2018 of Nepal ) 28 February 2017 Mahesh
Technologies that will make a difference for Canadian Law Enforcement
 The Future Of Public Safety In Smart Cities Technologies that will make a difference for Canadian Law Enforcement The car is several meters away, with only the passenger s side visible to the naked eye,
The Entertainment Industry and Venue Management
 Unit 35: The Entertainment Industry and Venue Management Unit code: H/601/1828 QCF level: 5 Credit value: 15 Aim This unit enables learners to gain an understanding of the entertainment industry, the activities
SENIOR CITIZENS ARE RIDING THE DIGITAL HEALTH WAVE
 SENIOR CITIZENS ARE RIDING THE DIGITAL HEALTH WAVE OLDER AUSTRALIANS ARE AFFLUENT, HEALTH LITERATE AND SURPRISINGLY PROACTIVE IN MANAGING THEIR OWN HEALTH AND THEY ARE USING DIGITAL HEALTH TOOLS TO DO
DESTINATION FEELGOOD. Minor 30 EC Offered in fall and spring semester. Interested? Get in touch with Timo Derriks for more information
 DESTINATION FEELGOOD Minor 30 EC Offered in fall and spring semester Interested? Get in touch with Timo Derriks for more information t.derriks@hz.nl PE.216 Minor: Destination Feelgood Life is better at
Tackling Digital Exclusion: Counter Social Inequalities Through Digital Inclusion
 SIXTEEN Tackling Digital Exclusion: Counter Social Inequalities Through Digital Inclusion Massimo Ragnedda The Problem Information and Communication Technologies (ICTs) have granted many privileges to
CCG 360 o Stakeholder Survey
 July 2017 CCG 360 o Stakeholder Survey National report NHS England Publications Gateway Reference: 06878 Ipsos 16-072895-01 Version 1 Internal Use Only MORI This Terms work was and carried Conditions out
American Community Survey Review and Tips for American Fact Finder. Sarah Ehresman Kentucky State Data Center August 7, 2014
 1 American Community Survey Review and Tips for American Fact Finder Sarah Ehresman Kentucky State Data Center August 7, 2014 2 American Community Survey An ongoing annual survey that produces characteristics
5 TH MANAGEMENT SEMINARS FOR HEADS OF NATIONAL STATISTICAL OFFICES (NSO) IN ASIA AND THE PACIFIC SEPTEMBER 2006, DAEJEON, REPUBLIC OF KOREA
 IN ASIA AND THE PACIFIC SEPTEMBER 2006, DAEJEON, REPUBLIC OF KOREA") Malaysia 5 TH MANAGEMENT SEMINARS FOR HEADS OF NATIONAL STATISTICAL OFFICES (NSO) IN ASIA AND THE PACIFIC. 18 20 SEPTEMBER 2006, DAEJEON, REPUBLIC OF KOREA 1. Overview of the Population and Housing Census
Malaysia 5 TH MANAGEMENT SEMINARS FOR HEADS OF NATIONAL STATISTICAL OFFICES (NSO) IN ASIA AND THE PACIFIC. 18 20 SEPTEMBER 2006, DAEJEON, REPUBLIC OF KOREA 1. Overview of the Population and Housing Census
Unlike Digital Divide
 Unlike Digital Divide POK Fook-sun Chief Development Officer Information Technology Resource Centre The Hong Kong Council of Social Service 22 January 2013 Content 1) Why Accessible to All 2) Digital Divide
CORPORATE COMMUNITY INVESTMENT PRACTICES, MOTIVATIONS AND CHALLENGES: Findings from the Canada Survey of Business Contributions to Community
 CORPORATE COMMUNITY INVESTMENT PRACTICES, MOTIVATIONS AND CHALLENGES: Findings from the Canada Survey of Business Contributions to Community Attribution Non-Commercial Share Alike cc by-nc-sa This license
Napier City Council. Arts Policy. Adopted 24 February
 Napier City Council Arts Policy Adopted 24 February 2010 www.napier.govt.nz The purpose of the Arts Policy is to promote social, cultural, economic and environmental well-being in accordance with the Local
Culturally and Linguistically Diverse Young People and Digital Citizenship:
 Culturally and Linguistically Diverse Young People and Digital Citizenship: A Pilot Study Executive Summary technologies have fundamentally reshaped the meaning and function of citizenship in the internet
European Circular Economy Stakeholder Conference Brussels, February 2018 Civil Society Perspectives
 European Circular Economy Stakeholder Conference Brussels, 20-21 February 2018 Civil Society Perspectives On the 20 th and 21 st February 2018, the European Commission and the European Economic and Social
Adopted March 17, 2009 (Ordinance 09-15)
") ECONOMIC ELEMENT of the PINELLAS COUNTY COMPREHENSIVE PLAN Prepared By: The Pinellas County Planning Department as staff to the LOCAL PLANNING AGENCY for THE BOARD OF COUNTY COMMISSIONERS OF PINELLAS COUNTY,
ECONOMIC ELEMENT of the PINELLAS COUNTY COMPREHENSIVE PLAN Prepared By: The Pinellas County Planning Department as staff to the LOCAL PLANNING AGENCY for THE BOARD OF COUNTY COMMISSIONERS OF PINELLAS COUNTY,
PREPARATIONS FOR THE PILOT CENSUS. Supporting paper submitted by the Central Statistical Office of Poland
 Distr. GENERAL CES/SEM.40/22 15 September 1998 ENGLISH ONLY STATISTICAL COMMISSION and ECONOMIC COMMISSION FOR EUROPE STATISTICAL OFFICE OF THE EUROPEAN COMMUNITIES (EUROSTAT) CONFERENCE OF EUROPEAN STATISTICIANS
Societal megatrends and business
 Societal megatrends and business Operating, innovating, and growing in a turbulent world April 2018 Introduction The World Business Council for Sustainable Development (WBCSD) has a long history of examining
Dallas Regional Office US Census Bureau
 The Census Bureau: Important Data Products for Every Community Paula Wright, Information Services Specialist Suzee Privett, Information Services Assistant Willie DeBerry, Partnership Specialist Lacey Loftin,
Getting the evidence: Using research in policy making
 Getting the evidence: Using research in policy making REPORT BY THE COMPTROLLER AND AUDITOR GENERAL HC 586-I Session 2002-2003: 16 April 2003 LONDON: The Stationery Office 14.00 Two volumes not to be sold
Country Paper : Macao SAR, China
 Macao China Fifth Management Seminar for the Heads of National Statistical Offices in Asia and the Pacific 18 20 September 2006 Daejeon, Republic of Korea Country Paper : Macao SAR, China Government of
2011 National Household Survey (NHS): design and quality
: design and quality") 2011 National Household Survey (NHS): design and quality Margaret Michalowski 2014 National Conference Canadian Research Data Center Network (CRDCN) Winnipeg, Manitoba, October 29-31, 2014 Outline of the
2011 National Household Survey (NHS): design and quality Margaret Michalowski 2014 National Conference Canadian Research Data Center Network (CRDCN) Winnipeg, Manitoba, October 29-31, 2014 Outline of the
HEALTH STATUS. Health Status
 HEALTH STATUS HEALTH STATUS This chapter on health status provides data about Haldimand County and Norfolk County s health status considered by mortality, unintentional injuries and obesity. Data on mortality
census 2016: count yourself in
 On May 10, all Canadians will be asked to count themselves in. That includes YOU, so expect your family to get a letter from Statistics Canada. It will be all about the 2016 Census of Population. What
Overview. CONSENSUS OVERVIEW Challenges and Opportunities for SC in the Irish Context. CONSENSUS CONFERENCE NUI GALWAY 18 th MAY 2012
 CONSENSUS OVERVIEW Challenges and Opportunities for SC in the Irish Context CONSENSUS CONFERENCE NUI GALWAY 18 th MAY 2012 Frances Fahy Mary Jo Lavelle Jessica Pape Overview! Challenges and Opportunities
Art for Social Change
 Art for Social Change POLICY RECOMMENDATIONS From the International Centre of Art for Social Change (ICASC.ca) April 2018 Contents 3 What is Community-Engaged Art for Social Change (ASC)? A definition
The Digital Divide. Factors that contribute towards widening the digital divide gap: Poverty. Education
 The Digital Divide Digital Divide refers to the gap between those who benefit from digital technology and those who do not. It is the gap between those people with effective access to digital and information
This factsheet covers:
 Social Care Assessment and eligibility under the Care Act 2014 If you have a mental illness you may need support from social services. This factsheet explains who is eligible for support and how you can
People s Union. Understanding and addressing inequalities
 People s Union According to the Eurobarometer on the future of Europe, its citizens would like to see greater solidarity across the Union in addressing key challenges such as unemployment and social inequalities
3i Group plc Corporate responsibility report 2006
 3i Group plc Corporate responsibility report 2006 As included in our Annual report and accounts 2006 2 3i Report and accounts 2006 Corporate responsibility Core values: We believe that the highest standard
Introduction to the Wisconsin Census Research Data Center. Health Projects
 Introduction to the Wisconsin Census Research Data Center Health Projects Rachelle Hill, PhD Administrator, MnRDC Center for Economic Studies U.S. Census Bureau November 26, 2014 Overview Introduction
Attribution and impact for social science data
 Attribution and impact for social science data Louise Corti Collections Development and Producer Support ODIN conference, Cologne October 2013 Overview Introducing the UK Data Service Our data portfolio
Chapter 4: Sampling Design 1
 1 An introduction to sampling terminology for survey managers The following paragraphs provide brief explanations of technical terms used in sampling that a survey manager should be aware of. They can
Any unauthorised copying or redistribution is prohibited. All rights reserved.
 First steps In order to make our action plan work, we have decided to follow this simple but working model. STUDY three members of our team had volunteered to be in charge of the implementation of the
Planning for the 2010 Population and Housing Census in Thailand
 Planning for the 2010 Population and Housing Census in Thailand Ms. Wilailuck Chulewatanakul Ms. Pattama Amornsirisomboon Socio-Economic Statistician National Statistical Office Bangkok, Thailand 1. Introduction
Socio-Economic Sciences and Humanities. First Call for proposals. Nikos Kastrinos. Unit L1 Coordination and Horizontal Aspects
 Socio-Economic Sciences and Humanities First Call for proposals Nikos Kastrinos Unit L1 Coordination and Horizontal Aspects Information Day Socio-economic Sciences & the Humanities Thessaloniki 29 March
Sustainable home heating practices Visions for 2050
 Sustainable home heating practices Visions for 2050 Prof. Anna Davies Geography Department Trinity College Dublin email: daviesa@tcd.ie Challenges to sustainable consumption Perfect Storm "Can we cope
Parish: CLACKMANNAN Presbytery Parish. Stirling CLACKMANNAN
 Parish: Presbytery Parish Stirling This profile of selected Census data has been prepared by the Statistics for Mission Group of the Church of for use by Congregations, Presbyteries and Councils of the
Rushcliffe CCG CCG 360 o Stakeholder Survey
 CCG 360 o Stakeholder Survey 207-8 Findings Table of contents Slide 3 Summary Slide 6 Introduction Slide 7 Background and objectives Slide 8 Methodology and technical details Slide 0 Interpreting the results
Eastern Cheshire CCG CCG 360 o Stakeholder Survey
 CCG 360 o Stakeholder Survey 2017-18 Findings 1 Table of contents Slide 3 Summary Slide 6 Introduction Slide 7 Background and objectives Slide 8 Methodology and technical details Slide 10 Interpreting
Ghana - Ghana Living Standards Survey
 Microdata Library Ghana - Ghana Living Standards Survey 5+ 2008 Institute of Statistical, Social and Economic Research - University of Ghana Report generated on: June 11, 2015 Visit our data catalog at:
Assessing the Welfare of Farm Animals
 Assessing the Welfare of Farm Animals Part 1. Part 2. Review Development and Implementation of a Unified field Index (UFI) February 2013 Drewe Ferguson 1, Ian Colditz 1, Teresa Collins 2, Lindsay Matthews
Parish: GLASGOW CARDONALD Presbytery Parish. Glasgow GLASGOW CARDONALD
 Parish: Presbytery Parish Glasgow This profile of selected Census data has been prepared by the Statistics for Mission Group of the Church of for use by Congregations, Presbyteries and Councils of the
Parish: CALLANDER Presbytery Parish. Stirling CALLANDER
 Parish: Presbytery Parish Stirling This profile of selected Census data has been prepared by the Statistics for Mission Group of the Church of for use by Congregations, Presbyteries and Councils of the
Parish: STIRLING ST MARK'S Presbytery Parish. Stirling STIRLING ST MARK'S
 Parish: Presbytery Parish Stirling This profile of selected Census data has been prepared by the Statistics for Mission Group of the Church of for use by Congregations, Presbyteries and Councils of the
Sampling Techniques. 70% of all women married 5 or more years have sex outside of their marriages.
 Sampling Techniques Introduction In Women and Love: A Cultural Revolution in Progress (1987) Shere Hite obtained several impacting results: 84% of women are not satisfied emotionally with their relationships.
Parish: MUCKAIRN Presbytery Parish. Argyll MUCKAIRN
 Parish: Presbytery Parish Argyll This profile of selected Census data has been prepared by the Statistics for Mission Group of the Church of for use by Congregations, Presbyteries and Councils of the Church.
Parish: DUNOON, THE HIGH KIRK Presbytery Parish. Argyll DUNOON, THE HIGH KIRK
 Parish: Presbytery Parish Argyll This profile of selected Census data has been prepared by the Statistics for Mission Group of the Church of for use by Congregations, Presbyteries and Councils of the Church.
Parish: ABERNETHY Presbytery Parish. Abernethy ABERNETHY
 Parish: Presbytery Parish Abernethy This profile of selected Census data has been prepared by the Statistics for Mission Group of the Church of for use by Congregations, Presbyteries and Councils of the
Developing the Arts in Ireland. Arts Council Strategic Overview
 Developing the Arts in Ireland Arts Council Strategic Overview 2011 2013 1 Mission Statement The mission of the Arts Council is to develop the arts by supporting artists of all disciplines to make work