Standard Title Page - Report on Federally Funded Project 1. Report No.: 2. Government Accession No. 3. Recipient s Catalog No.
|
|
|
- Tabitha Pope
- 5 years ago
- Views:
Transcription
1 Standard Title Page - Report on Federally Funded Project 1. Report No.: 2. Government Accession No. 3. Recipient s Catalog No. FHWA/VTRC 05-CR7 4. Title and Subtitle: 5. Report Date: Ground-Penetrating Radar Calibration at the Virginia Smart Road January 2005 and Signal Analysis to Improve Prediction of Flexible Pavement Layer 6. Performing Organization Code Thicknesses 7. Author(s): Imad L. Al-Qadi, Samer Lahouar, and Amara Loulizi 8. Performing Organization Report No.: VTRC 05-CR7 9. Performing Organization and Address: 10. Work Unit No. (TRAIS) Virginia Tech Transportation Institute 3500 Transportation Research Plaza 11. Contract or Grant No.: Blacksburg, VA Sponsoring Agencies' Name and Address: 13. Type of Report and Period Covered: Final June 1999 thru June 2004 Virginia Department of Transportation FHWA 1401 E. Broad Street P.O. Box Sponsoring Agency Code Richmond, VA Richmond, VA Supplementary Notes 16. Abstract A ground-penetrating radar (GPR) system was used to collect data over the different pavement sections of the Virginia Smart Road from June 1999 until December Three antennae at different frequencies were used for this research. The collected data were successfully used to evaluate the physical GPR detection limitations, to evaluate the GPR accuracy for pavement layer thickness determination, to control the installation of three different types of reinforcing meshes installed within the pavement, and to estimate the in-situ complex dielectric constant of several types of hot-mix asphalt (HMA). The data analysis results were verified by the well-documented structure and composition of each section of the road, in addition to the embedment of 35 copper plates (perfect electromagnetic reflectors) at the different layer interfaces during construction of the pavement. It was found that GPR is a feasible nondestructive tool to estimate the layer thicknesses of bound and unbound aggregate layers, HMA layers, and concrete slabs. However, interface detection can be altered if the layers have comparable dielectric constants. A technique was developed to estimate the frequency-dependent in-situ complex dielectric constant of HMA materials. Results have shown that the effect of the variations of the dielectric properties within the GPR bandwidth is insignificant vis-à-vis the accuracy of thickness estimation. The use of GPR as a quality control tool to verify the success of steel reinforcing mesh installation was also found to be feasible. Given the success of using GPR for the aforementioned applications in the Virginia Smart Road, it is recommended that the Virginia Department of Transportation use GPR more frequently as a quality control tool during new pavement construction projects and as an assessment tool prior to project rehabilitation and as part of Virginia s pavement management system. 17 Key Words 18. Distribution Statement Ground penetrating radar, non-destructive testing, pavement No restrictions. This document is available to the public through thickness measurement, dielectric properties, quality NTIS, Springfield, VA control/quality assurance 19. Security Classif. (of this report) 20. Security Classif. (of this page) 21. No. of Pages 22. Price Unclassified Unclassified 65 Form DOT F (8-72) Reproduction of completed page authorized
2 FINAL CONTRACT REPORT GROUND-PENETRATING RADAR CALIBRATION AT THE VIRGINIA SMART ROAD AND SIGNAL ANALYSIS TO IMPROVE PREDICTION OF FLEXIBLE PAVEMENT LAYER THICKNESSES Imad L. Al-Qadi Samer Lahouar Amara Loulizi Via Department of Civil and Environmental Engineering Virginia Tech Transportation Institute Project Managers Thomas E. Freeman, P.E., Senior Research Scientist Kevin K. McGhee, P.E., Senior Research Scientist Virginia Transportation Research Council Contract Research Sponsored by Virginia Transportation Research Council Virginia Transportation Research Council (A Cooperative Organization Sponsored Jointly by the Virginia Department of Transportation and the University of Virginia) Charlottesville, Virginia VTRC 05-CR7 January 2005 DISCLAIMER
3 The project that is the subject of this report was done under contract for the Virginia Department of Transportation, Virginia Transportation Research Council. The contents of this report reflect the views of the authors, who are responsible for the facts and the accuracy of the data presented herein. The contents do not necessarily reflect the official views or policies of the Virginia Department of Transportation, the Commonwealth Transportation Board, or the Federal Highway Administration. This report does not constitute a standard, specification, or regulation. Each contract report is peer reviewed and accepted for publication by Research Council staff with expertise in related technical areas. Final editing and proofreading of the report are performed by the contractor. Copyright 2005 by the Commonwealth of Virginia. ii
4 ABSTRACT A ground-penetrating radar (GPR) system was used to collect data over the different pavement sections of the Virginia Smart Road from June 1999 until December Three antennae at different frequencies were used for this research. The collected data were successfully used to evaluate the physical GPR detection limitations, to evaluate the GPR accuracy for pavement layer thickness determination, to control the installation of three different types of reinforcing meshes installed within the pavement, and to estimate the in-situ complex dielectric constant of several types of hot-mix asphalt (HMA). The data analysis results were verified by the well-documented structure and composition of each section of the road, in addition to the embedment of 35 copper plates (perfect electromagnetic reflectors) at the different layer interfaces during construction of the pavement. It was found that GPR is a feasible nondestructive tool to estimate the layer thicknesses of bound and unbound aggregate layers, HMA layers, and concrete slabs. However, interface detection can be altered if the layers have comparable dielectric constants. A technique was developed to estimate the frequencydependent in-situ complex dielectric constant of HMA materials. Results have shown that the effect of the variations of the dielectric properties within the GPR bandwidth is insignificant visà-vis the accuracy of thickness estimation. The use of GPR as a quality control tool to verify the success of steel reinforcing mesh installation was also found to be feasible. Given the success of using GPR for the aforementioned applications in the Virginia Smart Road, it is recommended that the Virginia Department of Transportation use GPR more frequently as a quality control tool during new pavement construction projects and as an assessment tool prior to project rehabilitation and as part of Virginia s pavement management system. iii
5 INTRODUCTION Ground-Penetrating Radar Radar (Radio Detection and Ranging) is an application of electromagnetic (EM) energy. It was in the early 1900s that the principle of radar was found to be applicable for detecting airborne objects. The principle consists of transmitting EM waves and receiving the reflected signals from any object in the path of the beam. During World War II, rapid development of radar technology took place because of its application in the military. It was later discovered that different objects interfere differently with EM energy. The main material properties that have an adverse effect on electric and magnetic fields that constitute the EM wave are permittivity, conductivity, and permeability. It was also discovered that EM waves travel in free space with a constant speed comparable to the speed of light. With these discoveries, radar could be used to detect airplanes, ships, and clouds. In 1926, Hulsenberg used the same principle to detect buried objects; it was the first application in which EM waves were intentionally transmitted through solids. In 1929, ground-penetrating radar (GPR) surveys were performed in Austria to sound the depth of glaciers. GPR technology was forgotten until the late 1950s when a U.S. Air Force plane misread the altitude given by their radar systems and crashed into the ice in Greenland while trying to land. This event started investigations into the ability of radar to see into the subsurface, especially for ice sounding, mapping subsoil properties, and locating water tables. In late 1960s, some advances in radar technology were made through NASA lunar investigations when a GPR system was built and was flown to the moon to characterize its surface electrical properties. During the Vietnam War, the U.S. Army developed a radar system called Combat Radar for locating mines, tunnels, and bunkers. Through further research, this radar system led to the development of other ground probing radar systems used to identify and profile subsurface geological features. Since the 1970s, GPR has been used in many applications, including locating sewer lines and buried cables, measuring the thickness of sea ice, and profiling the bottom of lakes and rivers. GPR systems, depending upon the way antennas are used, are classified as air-coupled systems or ground-coupled systems. In air-coupled systems, the horn antennas are typically 150 to 500 mm above the surface. In ground-coupled systems, a transceiver (i.e., a device that transmits and receives EM signals) is in full contact with the ground. Five radar system types have been used to evaluate civil infrastructure: frequency modulation, synthetic-pulse, stepped frequency, synthetic aperture, and pulsed (impulse). In the frequency modulation, the transmitted signal has a frequency sweep between two preset limits. The reflected signal is mixed with the transmitted signal and, depending upon the time delay, results in a different frequency. In the synthetic-pulse, the transmitted wave frequency varies, and the amplitude and phase of the reflected wave are analyzed at each frequency. In the stepped frequency, the transmitted signal can be of any shape and have any desired frequency. This will allow for a better penetration and recognition of some detailed features. However, the data acquisition rate is very limited. Data collected by synthetic aperture systems is processed in a way that generates an image of the investigated feature. This is achieved by simultaneously analyzing radar signals obtained at different locations. A pulsed system launches a series of sine wave (a pulse 1
6 consists of a wide spectrum of EM waves at different frequencies) at a well-defined repetition rate to allow the reception of reflected signals. The pulsed systems are the most used and are the most commercially available. The principle of the impulse systems is based upon transmission of EM pulse and analysis of the reflected pulse from interfaces where there is a contrast in the dielectric properties. Figure 1 shows the major components of a pulsed radar system. A sequence of trigger pulses is generated in the control unit by the radar circuitry. These trigger pulses are sent through the control cable to the antenna, where each trigger pulse is transformed into a bipolar transmit pulse. These transmitted pulses encounter different materials in the subsurface with different dielectric properties. At the interface, signals are reflected back to the subsurface, where they are detected by the antenna and are sent to the control unit where they are processed and displayed. TRANSMIT/RECEIVE UNIT CONTROL UNIT ANTENNA DISPLAY / STORAGE UNIT Figure 1. Components of a pulsed GPR system. PURPOSE AND SCOPE GPR technology has been used for the past 20 years for a variety of applications to assess pavement performance. The main issue after all these years remains to be how well GPR works and under what conditions? Results show that GPR works well for some situations but is not an appropriate tool for other situations. Currently, it is not used on a routine basis by the U.S. Department of Transportation (DOT). This is due mainly to difficulties encountered in data interpretation, as well as the expenses involved for conducting GPR surveys. It is expected that there will be a growing interest and demand for GPR surveys. However, a number of limitations exist that are mainly related to interpreting the results of GPR testing: The images obtained from the reflected signals (using signal-processing packages) are not photographs of the features that are beneath the surface being investigated. The images show the amplitude of the radar-reflected signals from the interfaces with different dielectric properties. These amplitudes are plotted in colors using user 2
7 defined color codes. Therefore, a considerable amount of experience and operator skill may be required to interpret sub-surface GPR results correctly. Extensive amount of data. Determination of the exact location of a reflecting feature beneath the surface relies upon a prior knowledge of the dielectric properties of the material. These dielectric properties are also frequency dependent; therefore, a frequency domain method of analysis is required to accurately measure thicknesses. Change of the dielectric constant with depth mainly because of the presence of moisture. Losses in the pavement materials, especially with the presence of moisture or conducting subgrade soils. Reflections from thin layers may overlap, depending upon the GPR system resolution. Insufficient dielectric contrast between layers may hinder the detection of the underneath layers. In light of all these limitations, this project was conducted to evaluate the feasibility of using GPR as a nondestructive tool for pavement assessment. This report presents findings from the GPR measurements performed between June1999 and December 2002 over the pavement sections of the Virginia Smart Road. The first part of the Results and Discussion Section evaluates the physical GPR detection limitations. The second part of the Results and Discussion Section presents the thicknesses of the pavement layers in the Virginia Smart Road, as predicted with the GPR surveys. An evaluation of the GPR thickness prediction accuracy is also presented in this section. The third part of the Results and Discussion Section shows how GPR was used to control the installation of the reinforcing mesh installed within the pavement. The last part of the Results and Discussion Section presents a methodology to measure the complex dielectric constant of the different Superpave mixes used in the Virginia Smart Road. METHODS The Virginia Smart Road, located in southwest Virginia in Montgomery County, is a unique, state-of-the-art, full-scale research facility for pavement research and evaluation of Intelligent Transportation Systems (ITS) concepts, technologies, and products. It is the first facility of its kind to be built from the ground up with its infrastructure incorporated into the roadway. The completed facility will consist of a 9.6 km connector highway between State Route 460 in Blacksburg, Virginia, and Interstate 81. The first 3.2 km, already constructed, serves as a controlled test facility that begins at the southern section of the town of Blacksburg at the Route 460 bypass and ends 189 m west of Route 723. The test bed facility is designed with two travel lanes, each 3.6 m wide, with a 3.0 m wide shoulder on each side of the road. The maximum longitudinal slope of the road is 6% through moderately hilly to mountainous terrain. The pavement research facility consists of two types of pavement: continuously reinforced concrete and flexible pavements. The flexible pavement component includes 12 different 3
8 flexible pavement designs of approximately 100 m in length each (sections A to L), as shown in Table 1. Six different layers were used in the flexible pavement sections (all designations are in accordance with Virginia Department of Transportation specifications): Wearing surface: Seven types of wearing surface were used: SM-9.5A, SM-9.5A with high laboratory compaction, SM-9.5D, SM-9.5E, SM-12.5D, SMA-12.5 (Stone Mastic Asphalt), and OGFC (open-graded friction course). Intermediate hot-mix-asphalt (HMA) layer: BM-25.0 with different thicknesses. Three sections include a 50 mm layer of SM-9.5A (a wearing surface mix) below the BM Open graded drainage layer (OGDL): Out of the 12 sections, three sections were built without OGDL. Seven sections were treated with asphalt cement, and two sections treated with Portland cement. The thickness of this layer was kept constant at 75 mm. Cement stabilized subbase: A 21-A cement-stabilized layer was used in 10 sections at a thickness of 150 mm. Aggregate subbase: A 21-B aggregate subbase layer was used in all sections at different thicknesses. The continuously reinforced concrete pavement section was constructed using a 250 mm thick concrete slab placed over a 75 mm stabilized open graded drainage layer, 150 mm cement stabilized aggregate layer, and 75 mm aggregate base layer. The reinforcement within the continuously reinforced concrete slab consisted of #20 longitudinal reinforcing bars and #15 transverse reinforcing bars. The longitudinal reinforcing bars were placed at intervals of 165 mm on center. The transverse reinforcement was placed at intervals of 1.2 m on center. To calibrate GPR systems and to better interpret collected data (signals), 35 copper plates were placed at different layer interfaces throughout the Virginia Smart Road pavement sections. Thirty-one of these copper plates were placed at the layer interfaces of the flexible sections and four plates were placed underneath the concrete slab in the CRCP section. The copper plates serve as a reflecting material and thus allow for accurate determination of the layers dielectric constant. Another benefit of the copper plates is to indicate where the interface between each two layers occurs. As stated earlier, some of the pavement materials do not have significant differences in their dielectric properties; therefore, very small amount of energy will be reflected back from their interface. Sometimes, this reflected energy is obscured by the GPR system noise; thus, accurate determination of the interface becomes difficult. The copper plates ( mm) were placed at several locations in all tested sections. The exact locations of the plates were surveyed in the field using a Lecia TC 605 total station. Initially, the locations of the copper plates were based upon a relative coordinate system. This system of coordinates originated at each bunker. Figures A1 to A13 in the Appendix A show the position of the copper plates in all the pavement sections. The relative coordinate system was combined with the construction baseline provided by the Virginia Department of Transportation (VDOT) to establish state plane coordinates for all the copper plates, as shown in Appendix A, Table A1. Prior to the placement of a copper plate, three points were marked in the field representing the upper left corner, the center, and the bottom right corner of the plate. This marking was used so the plates would be aligned with the road. After 4
 Table 1.")
 (mm) A 104 SM-12.5D 150 - - 75+ 150 175 B 90 SM-9.5D 150 - - 75+ 150 175/GT C 87 SM-9.")


9 placement on a layer, nails were driven through to the underlying layer to keep the plate in a permanent fixed position. Figure 2 shows the copper plate placed in Section B under the 21B layer. Sec. Length (m) Table 1. The Virginia Smart Road pavement design. HMA Concrete (mm) OGDL (mm) CTA (mm) Aggregate (mm) Wearing Surface BM-25.0 SM-9.5A 38mm (mm) (mm) A 104 SM-12.5D B 90 SM-9.5D /GT C 87 SM-9.5E /GT D 117 SM-9.5A /GT E 76 SM-9.5D /GT F 94 SM-9.5D G 90 SM-9.5D /GT H 90 SM-9.5D I 98 SM-9.5A* 100/RM J 92 SM-9.5D /MB K 86 OGFC+SM-9.5D 225/SR ^ L 104 SMA /RM ^ CRCP CRCP ^ * High laboratory compaction; + Asphalt stabilized; ^ Cement stabilized SR: Stress Relief Geosynthetic; GT: Woven Geotextile/Separator; RM: Reinforcing Mesh; MB: Moisture Barrier Figure 2. Copper plate under 21B layer in Section B. 5
10 The GPR systems used at the Virginia Smart Road are manufactured by Geophysical Survey Systems, Inc. All three systems have the same control unit, shown in Figure B1, Appendix B. For the air-coupled system, the control unit is connected to a transceiver, which is connected to a pair of horn antennas (one is a transmitter and one is a receiver). Figure B2, Appendix B, shows the pair of antennas and the transceiver box. For the two that used groundcoupled systems, the control unit is directly connected to the monostatic antennas, as shown in Figure B3, Appendix B. Table 2 shows the control unit specifications. While taking data, all antennas are mounted behind a van with the control unit set inside the van, as shown in Figures B4 and B5, Appendix B. Table 2. GPR system specifications. Radar Parameters: Comments Antennas Can handle up to 2 antenna inputs simultaneously Sampling frequency rate up to 100 GHz Analog Quantization 8 or 16 bits, selectable Analog to Digital Sampling rate 128, 256, 512, 1024, 2048, 4096 or 8192 samples/scan, selectable Scan Rate 2 to 220 scans/second, selectable Programmable time window 2-10,000 nanoseconds full scale, selectable Programmable sampling window 10 picoseconds increments Dynamic range of time variable gain 150 db Dynamic range of input A/D 25 bits Dynamic range of input averaging filter 48 bits Dynamic range of DSP 24 bits Clock frequency of DSP 38.5 MHz Programmable stacking range Acquisition Software: Inputs Records data from 1 or 2 channels simultaneously, 1 to 4 data channels selectable Display Modes Linescan (using 16 color bins to represent the polarity and amplitude of the signal), Wiggle plot and Oscilloscope System Setups Storage of over 50 system setup files for different road types and antenna configurations Range gain Manual adjustment from 20 to +120 db. Number of segments in gain curve is user-selectable from 1 to 8 Vertical Filters Individually filter the scans in the time domain. Low and High Pass, Infinite Impulse Response (IIR), Finite Impulse Response (FIR), Boxcar and triangular filter types are available. Horizontal Filters Sequentially filter the scans in the spatial domain. Stacking background removal, IIR, FIR, Boxcar and Triangle types are available, as well as Static 6
11 Radar Parameters: Data Storage Hard Drive Floppy Disk Drive Data Transfer Scan size Antennas: Ground-Coupled Center Frequency Pulse width Ground-Coupled Center Frequency Pulse width Air-Coupled Center Frequency Pulse width Pulse Repetition Comments Stacking modes. 1.3 GB 1.44 MB Through parallel cable 1 Kb/scan for 16-bit and 512 samples/scan Model MHz 1.1 ns Model GHz 0.67 ns Model 4208, TEM horn antenna 1 GHz 1 ns 400 KHz Since June of 1999, GPR data were collected on the Virginia Smart Road, Table 3. Data were collected from both the center of the instrumented lane for all the sections and the center of the non-instrumented lane for sections I and L. Prior to installation of a Distance Measuring Instrument (DMI) in October 2001, data were collected at an approximate speed of 10 km/h when the ground-coupled system was used and at an approximate speed of 20 km/h when only the air-coupled system was used. Installation of the DMI made it possible to take measurements at specific distances (scan acquisition was set at 10 scans/m). The DMI used in the GPR van, Figure B6, Appendix B, is manufactured by US Digital. It is a heavy-duty ball bearing optical incremental encoder. It is connected to the rear wheel using a rigid shaft coupling to minimize wheel bouncing effects. The DMI can tolerate a shaft speed of 10,000 rpm continuous and an acceleration of 10,000 rad/sec 2. The DMI has two output channels compatible with the input of the GPR system. The two channels make it possible to collect GPR data either in one direction (forward or backward) or in both directions. The resolution of the encoder is 2000 pulses per rotation per channel. 7
12 Table 3. Summary of data collection. Date GPR System Sections Comments MHz A-H Over BM-25.0 layer GHz 900MHz A-L A-H I-L: 21-B layer A-H: BM-25.0 layer GHz I-L 21A layer GHz I-L I: SM-9.5A and the reinforcing mesh J: Asphalt stabilized OGDL, K-L: Cement stabilized OGDL and reinforcing mesh in L GHz I-L I-L: BM-25.0 layer. 900MHz I-L & CRCP GHz A-L Road completely constructed GHz and 900MHz All GHz and 900MHz All GHz and 900MHz All GHz and 900MHz All GHz and 900MHz All GHz and 900MHz All GHz and 900MHz All GHz and 900MHz All GHz and 900MHz All GHz and 900MHz All GHz and 900MHz All GHz and 900MHz All GHz and 900MHz All DMI Installed in the Van GHz and 900MHz All GHz and 900MHz All GHz and 900MHz All GHz and 900MHz All GHz and 900MHz All GHz and 900MHz All GHz and 900MHz All GHz and 900MHz All GHz A-B; I-L; CRCP RESULTS AND DISCUSSION 8
13 Data collected at the Virginia Smart Road were used to assess the performance of GPR for the nondestructive evaluation of pavements. In particular, the data were used to achieve the following: Evaluate the physical GPR detection limitations, Estimate the GPR accuracy for pavement layer thickness determination, Control the installation of the reinforcing mesh within the pavement, and Estimate the in-situ dielectric constant of HMA. These topics are discussed in the following paragraphs. GPR Detection Limitations As was aforementioned, 31 copper plates were embedded, during construction, in the Virginia Smart Road at the different layer interfaces of the 12 experimental flexible sections. It is important to note that, because of its high conductivity ( Siemens/m), copper is considered a perfect EM reflecting material whose GPR signature could be easily separated from the normal pavement response. Thus, the embedded copper plates serve as a good indicator of the exact locations of the pavement interface reflections. To study the GPR detection limitations, the data collected with the air-coupled antenna from section A were examined. As indicated in Table 1, Section A is composed of the following layers: wearing surface (WS), HMA base layer (BM-25.0), asphalt-treated open-graded drainage layer (OGDL), cement-stabilized limestone base layer (21-A), limestone aggregate base layer (21-B), and subgrade layer. Figure 3 shows a scope view of a single GPR scan, and Figure 4 illustrates a linescan (also known as B-scan) view of a group of scans collected over the same section. A linescan view represents a set of along-track scans stacked together vertically. The amplitude of each scan is quantized and coded into a solid color. Therefore, the x-axis in this figure represents the scan number, which is proportional to the surveyed distance, and the y-axis represents the reflection time that can be converted to depth, knowing the dielectric properties of each layer. The amplitude to color transformation function used to obtain Figure 4 is given at the right side of the figure. In order to enhance low reflections, a nonlinear transformation function was used. As can be seen in Figure 3, only two reflected pulses are visible: the surface reflection and the HMA/aggregate base interface reflection. In Figure 4, five strong reflections can be distinguished. These reflections correspond to the five copper plates placed at the wearing surface/bm-25.0, BM-25.0/OGDL, OGDL/21-A, 21-A/21-B, and 21-B/subgrade interfaces, respectively. Moreover, multiple reflections (or reverberations) can be seen in Figure 4 underneath the copper plate reflections. These multiple reflections are due to EM energy entrapment between the pavement surface and the copper plates, which are strong reflecting interfaces. In typical pavements, multiple reflections are seldom present in GPR signals because the bottom layers are usually not highly reflective, in addition the pavement material is lossy,.which causes rapid attenuation of the reverberating EM energy. It is clear from Figures 3 and 4 that the 21-B/subgrade and 21-A/21-B interfaces are not detectable under normal conditions (i.e., without copper plates). This lack of visibility is due to 9
14 the low contrast between the dielectric properties of the subgrade, 21-B, and 21-A layers since they were constructed using the same type of limestone material (which has a dielectric constant, ε r, of approximately 8). The low contrast in dielectric constant results in a low amplitude reflected signal, which is further attenuated by material loss. The effect of material loss on the reflected signal can be further shown in Figure 4, where the reflected signal from the deeper copper plates is found to have a lower amplitude (darker color) than the reflected signal from the shallower plates. In contrast to the base layers, the OGDL/21-A interface (reflection 3 in Figure 4) is easily detectable, even in the absence of a copper plate at the interface, as illustrated in Figures 3 and 4. This is due to the relatively high contrast between the dielectric constants of HMA (ε r approximately 4) and cement-stabilized limestone aggregate (ε r approximately 8). The high contrast between the dielectric constants results in a high amplitude reflected signal. Amplitude Surface Reflection HMA/Base Reflection HMA Base Time (ns) Figure 3. Scope view of a GPR scan collected over Section A. Surface Reflection Spurious Reflection Multiple Reflections from copper plates OGDL/21-A Reflection Figure 4: Linescan view showing the copper plate reflections at the (1) 21-B/subgrade, (2) 21-A/21-B, (3) OGDL/21-A, (4) BM-25.0/OGDL, and (5) WS/BM-25.0 interfaces. According to the design of the pavement section studied, the HMA layer is composed of a wearing surface, an HMA base layer (BM-25.0), and an asphalt-treated drainage layer 10
15 (OGDL). However, in Figures 3 and 4 it is not obvious where the reflections from the interfaces between these layers occur. In fact, a close examination of Figure 4 shows a longitudinal reflection within the HMA layers that does not correspond to any copper plate reflection depth (the reflection is between reflections 4 and 5 in Figure 4, which correspond to the copper plate reflections). This spurious reflection is due to the overlap between the reflections from the pavement surface, wearing surface/bm-25.0 interface, and BM-25.0/OGDL interface. In this case, the reflections within the HMA layer are masked by the stronger reflections in their vicinity (surface reflection). Consequently, these three HMA layers would be considered as one homogeneous layer when attempting to estimate the layer thicknesses from GPR data. Signal processing techniques that can be used to separate the layer interface reflections in this case are discussed later in the report. Layer thickness estimation As indicated previously, the principle of the GPR system used in this study (impulse radar) is based upon sending an electromagnetic (EM) pulse through an antenna to the pavement surface and then recording the reflected pulses from the internal interfaces, where there is a contrast in the dielectric properties, as depicted in Figure 5. The time difference measured between the reflected pulses (i.e., t 1 or t 2 ) can be used in conjunction with the dielectric properties of the surveyed layer to determine its thickness. The thickness of the i th layer could be computed according to equation (1): d i ct i = (1) 2 ε r, i where: d i is the thickness of the i th layer, t i is the EM wave two-way travel time through the i th layer as shown in Figure 5, c is the speed of light in free space: c = m/s, and ε r,i is the dielectric constant of the i th layer. The thickness of any pavement layer can be estimated by using equation (1). Assuming that the two-way travel time t i can be measured accurately from the GPR reflected signal, as pictured in Figure 5, the dielectric constant ε r,i would be the only unknown remaining in equation (1). The dielectric constant ε r,1 of the first (top) layer (which can be HMA or concrete) can be estimated non-destructively from the GPR-collected signal, based on equation (2). 2 A0 1+ Ap ε r,1 = (2) A0 1 Ap where: 11
16 12 ε r,1 is the dielectric constant of the top layer, A 0 is the amplitude of the surface reflection as shown in Figure 5, and A P is the amplitude of the reflected signal collected over a flat metal plate placed on the pavement surface. This calibration measurement is usually conducted either at the beginning or the end of each GPR survey. Figure 5. Typical GPR reflections from a pavement system. The dielectric constant of the second layer ε r,2 is calculated using equation (3) ,1, = p p p p r r A A A A A A A A ε ε (3) where: ε r,2 is the dielectric constant of the second layer, and A 1 is the amplitude of the reflection obtained at the interface between the first and second layers as shown in Figure 5. Similarly, for the third layer the dielectric constant ε r,3 is found according to equation (4) ,2, = p p p p p p r r A A A A γ A A A A A A γ A A ε ε (4) HMA, d 1, ε r,1 Air Base, d 2, ε r,2 Subgrade, ε r,3 Tx/Rx t 1 Time t 2 A 0 A 1 A 2
17 where: ε r,3 is the dielectric constant of the third layer, A 2 is the amplitude of the reflection obtained at the interface between the second and third layers as shown in Figure 5, and γ 1 is the reflection coefficient at the interface between the first and second layers and is given by equation (5). ε r,1 ε r,2 γ 1 = (5) ε + ε r,1 r,2 The same process can be repeated iteratively to compute the dielectric constant of the n th layer using equation (6). 2 2 n A Ai An + + γi 1 Ap i= Ap Ap ε r, n = εr, n-1 (6) 2 n A Ai An + γi Ap i= 1 Ap Ap where the reflection coefficient γ i is given by equation (7). r, i r, i+ 1 2 εr, i εr, i+ 1 γ i = (7) ε + ε It should be noted that, in the above formulation, the pavement layers are assumed to be homogeneous and to be composed of lossless material. Therefore, the dielectric constant of each layer is assumed to be constant in the sense that it does not vary with the layer thickness. 21-B layer thickness in Sections I through L The GPR survey performed on August 16 th, 1999, was used to determine the as-built thickness of the 21B layer installed in Sections I to L. The design thickness called for 75 mm for Sections I and L, and 150 mm for Sections J and K. Since during the survey only the 21B layer was constructed, the dielectric constant of the 21-B material was estimated using equation (2) for all the collected scans. Equation (1) was then used to determine the layer thicknesses throughout these four sections. Figure 6 shows the results for Sections I and J. In this figure, the x-axis represents the distance traveled along both sections, with zero representing 10 m after the start of section I (Station ). The as-built thickness in Section I started with approximately 145 mm; it then dropped to around 100 mm in the entire section and where the instruments were placed. The as-built thickness in Section J was found to be approximately 150 mm. The transition between the two sections is clearly seen (from 82 m to 96 m). Figure 7 shows the results for Sections K and L. In this figure, the x-axis represents the distance traveled along both sections, with zero representing 10 m after the start of Section K (Station ). The as-built thickness in Section K was found to be approximately 150 mm. The as-built thickness in Section L varied from 85 mm in the beginning of the section to 75 mm at the end of it. Again, the transition between the two sections is clearly seen in the figure. 13
18 Distance (m) Depth (mm) Section I Section J 250 Figure B layer thickness as obtained with GPR in Sections I and J. Distance (m) Depth (mm) Section K Section L 250 Figure B layer thickness as obtained with GPR in Sections K and L. 14
19 21-A layer thickness in Sections I and L The data taken on September 12 th, 1999, were used to determine the as-built thickness of the 21-A layer installed in Sections I and L. The design thickness called for 150 mm for both sections. It should be noted that, because this survey was conducted directly on the 21-A layer, the reflection from the 21-A/21-B interface was visible, unlike the case when the survey was conducted on the wearing surface (Figure 4). This is because there were no layers above the 21-A layer to attenuate the low reflection returned from the 21-A/21-B interface. The dielectric constant of the 21-A layer (top layer) was estimated based on equation (2) for all the collected scans, and then equation (1) was used to find the layer thickness. Figures 8 and 9 show the results for Sections I and L, respectively. In these figures, the x-axis represents the distance traveled throughout the sections from their respective starting stations ( for I and for J). The as-built average thickness for Section I was measured to be 172 mm, with a maximum of 190 mm and a minimum of 163 mm. For Section L, the as-built average thickness was found to be 168 mm with a minimum of 154 mm and a maximum of 178 mm. Distance (m) Depth (mm) Figure A layer thickness as obtained with GPR in sections I. 15
20 HMA layer thickness As was shown in Figure 3, the layer interfaces of the WS/BM-25.0 and BM-25.0/OGDL of Section A are not detectable in the GPR scan because the WS and OGDL layers are thin compared to the depth resolution of the GPR system used. The existence of thin layers within a pavement system has considerable effects on the layer thickness results reported by GPR. In fact, if these layers are ignored during the GPR data analysis phase (i.e., if multiple layers with different dielectric properties were considered as a single homogeneous layer), the dielectric constants estimated by equations (2) through (7) would be incorrect. Moreover, since the dielectric constant of any bottom layer depends upon the dielectric constants of all the layers above it, errors in the estimation of the top layer s dielectric constant would result in erroneous dielectric constants for all the layers underneath. Distance (m) Depth (mm) Figure A layer thickness as obtained with GPR in Section L. In order to show the effects of thin layers on GPR thickness results, the GPR scans collected on May 22 nd, 2002, with the air-coupled antenna over section A were analyzed to estimate the HMA layer thicknesses. The total thickness of the considered pavement section s HMA layer is 263 mm, divided as follows: 38 mm wearing surface, 150 mm BM-25.0, and 75 mm OGDL. This pavement section is a good candidate for testing the effects of thin layers on GPR thickness estimation performance because the pavement was more than two years old and the layers had different densities thus resulting in different dielectric constants. For example, among the three layers, the OGDL layer has the highest air-voids and lowest asphalt content; thus, theoretically, it should have the lowest dielectric constant. The total thickness of the HMA layer found from GPR data along Section A is presented in Figure 10. For comparison purposes, the HMA design thickness for the same section is also shown in the figure. After construction of the Virginia Smart Road was completed, direct measurements on cores and analysis of copper plate location survey data showed that the as-built HMA thickness differed from the design thickness by a maximum of 6%. Hence, the performance of GPR in estimating layer thicknesses could be assessed by direct comparison of GPR results to the actual thicknesses. According to Figure 10, GPR results tend to overestimate 16
21 the real HMA thickness by approximately 10 to 80 mm, which represents 4 to 30% of the total design thickness. This overestimation is mainly caused by the following: The assumption that the three HMA layers have the same dielectric constant, even though they have different compositions. The dielectric constant computation technique, which is based upon the amplitude of the surface reflection, as given by Equation (2). In fact, due to the overlap between the surface reflection and the reflection at the WS/BM-25.0 interface, the measured amplitude of the surface reflection would be greater or less than the real reflection amplitude. In other words, due to the different peak polarities of the transmitted GPR pulses (positive peak surrounded by two negative peaks), the superposition of the two adjacent reflections might have an additive or a subtractive effect, which will either increase or decrease the measured surface reflection amplitude. In order to increase the accuracy of the GPR depth estimation technique in the case of thin layers, the average dielectric constant of the three layers should be estimated. One way of determining this average dielectric constant is to base its computation on the reflection at the OGDL/Base interface, instead of the surface reflection, using a modified common depth technique proposed by Lahouar et al. (2002). This technique considers the dielectric constant of the whole HMA layer, rather than the surface area alone. For this solution, GPR data should be collected simultaneously with two antenna systems: a bistatic air-coupled antenna and a monostatic ground-coupled antenna. The dielectric constant estimation is then based upon the two-way travel times of the reflections rather than on their amplitudes. 0 Distance (m) Total HMA Design Depth (mm) Figure 10. HMA thickness found from GPR data when considering all HMA layers as a single homogeneous layer, Section A. 17
.")
22 When GPR data are collected by a single antenna system, an alternative solution to counteract the problem caused by thin layers would be to resolve the individual layers in the GPR reflected signal using a signal processing technique known as deconvolution (Lahouar 2003). Ideally, deconvolution would remove the effect of the GPR incident signal from the GPR reflected signal, resulting in the reflectivity function of the pavement system. Since the reflectivity function is composed of narrower pulses than the original reflected signal, separating the interface reflections would be easier, even if the considered layers are thin, as shown in Figure 11. After finding the exact reflection locations, equations (2) through (7) can be used to iteratively estimate the dielectric constants of the different layers. Then, equation (1) can be used to find the thicknesses of the individual layers. It should be noted here that applying deconvolution to the reflected GPR signals usually produces an output signal with an increased noise level. Because a high noise level generally makes the detection process of the reflected pulses more difficult, the probability of missing some interfaces or mistakenly detecting some noise peaks as layer interfaces (false alarm) might become high with this type of signal processing. 5 WS HMA Layers BM OGDL Base Layer 2 Multiple Reflections from 1 Figure 11. GPR data after deconvolution showing the copper plate reflections at the (1) 21- B/subgrade, (2) 21-A/21-B, (3) OGDL/21-A, (4) BM-25.0/OGDL, and (5) WS/BM-25.0 interfaces. Figure 12 shows the HMA thicknesses of the WS, BM-25.0 and OGDL layers found from the same GPR data; that is, after applying deconvolution and using the aforementioned thickness estimation technique. For comparison purposes, the figure also shows the design thicknesses for each layer. According to the figure, the thicknesses estimated by GPR are very comparable to the design thicknesses. Moreover, when comparing the GPR estimated thicknesses to the design thicknesses, as shown in Table 4, an average thickness error of 3.3% is found for the WS layer, 7.7% for the WS and BM-25.0 layers, and 0.7% for the overall HMA layer. The latter result shows the improvement made in the thickness estimation accuracy when 18
23 the pavement s individual HMA layers were considered instead of being considered as a single layer. Distance (m) Depth (mm) WS BM-25.0 OGDL Design 400 Figure 12. HMA thicknesses estimated from GPR data when considering the individual layers, Section A. Table 4. Comparison between design HMA thicknesses and GPR thicknesses. WS WS + BM-25.0 WS + BM OGDL Design (mm) GPR Average (mm) GPR STD (mm) COV (%) Avg. Error (%) The HMA layer thicknesses of all the flexible pavement sections of the Virginia Smart Road found from GPR data for May 22 nd, 2002, survey data are presented in Appendix C. For comparison purposes the design thicknesses are also shown in these figures. The distances shown in the x-axis represent distances from the beginning of Section A. To assess the accuracy of the GPR tool, the layer thicknesses reported by GPR should be compared to the real thicknesses of the pavement layers. These thicknesses usually differ from the design thicknesses due to construction operation reasons. Hence, a more appropriate performance evaluation technique is to compare the GPR results to thicknesses measured directly on pavement cores. For this assessment method to be reliable, the GPR data used for the comparison should be collected prior to coring from the same locations where the cores would be 19

24 taken from. In fact, since coring is destructive to the pavement, the presence of core pits, even filled with HMA material, would affect the GPR signals. The accuracy of the GPR system was evaluated based upon the thicknesses measured on 19 cores taken from the different sections of the Virginia Smart Road. Figure 13 shows a typical core taken from Section H. Four different layers can be identified in the core: wearing surface between 0 and 38 mm (0 and 1.5 in), BM-25.0 between 38 and 127 mm (1.5 and 5 in), SM-9.5A between 127 and 200 mm (5 and 8 in), and OGDL between 200 and 280 mm (8 and 11 in). The different layers can be clearly separated in the core based on aggregate size. All cores were extracted from the pavement after all necessary GPR data were collected. To facilitate finding the core locations on the GPR data, the cores were taken at a distance of 0.8m (2.6ft) from the centers of the copper plates embedded in the pavement, which were surveyed and marked on the pavement surface after the Virginia Smart Road construction was completed. Then, based upon the copper plate signature, the GPR data corresponding to the core locations were identified by moving a number of scans corresponding to the offset distance. Locating core data in GPR files was facilitated by the use of the distance measuring instrument. The GPR data collected at the core locations were analyzed using the two aforementioned analysis techniques (i.e., overall and individual HMA layers). Table 5 presents a comparison between the total core thicknesses and the thicknesses measured by GPR using the two analysis techniques. The distance column in Table 5 represents the absolute distance, starting from the beginning of section A, at which the cores were taken. According to these results, the average absolute error in estimating the HMA thickness using the overall analysis method is 12.0%, whereas the average error introduced after resolving the individual HMA layers is only 3.1%. For the overall thickness estimation technique, the absolute error varies between a minimum of 1.1% for Section A to a maximum of 27.6% for Section K. For the individual layers technique, the absolute error varies between a minimum of 0.2% for Section F to a maximum of 9.4% for Section K. According to theses results, it is evident that the layer separation technique outperforms the overall thickness estimation technique. Again, the high errors introduced by the latter analysis method are mainly due to the erroneous estimates of the dielectric constant, which were computed solely from the amplitudes of the surface reflection. Figure 13. Typical HMA core extracted from Section H at the Virginia Smart Road. 20
25 Table 5. Comparison between core thicknesses and GPR thicknesses obtained by the overall and the individual analysis techniques. Core # Dist. HMA Thick. (mm) Error (%) (m) Overal Overal Core l Individual l Individual A A A A B D D E E F F F G G H J J K K Average Absolute Error (%) Concrete slab thickness in the CRCP section The GPR data taken on June 19 th, 2002, by the air-coupled antenna were used to determine the as-built thickness of the concrete slab along the CRCP section. Since the concrete slab could be considered as a homogeneous layer, its dielectric constant was computed for each scan based on equation (2), and then its thickness was estimated using equation (1). Figure 14 shows the concrete slab thickness measured from GPR data over the first 130m of the CRCP section. The figure also shows the thickness measured directly on a core taken from the pavement. The core thickness is found to coincide with the GPR thickness with an error of 2%. It should be noted that for the concrete slab built over the cement treated OGDL layer, the bottom of the slab is not detectable in the GPR response because of the similarity of the dielectric constant of the two materials and the high EM energy attenuation of concrete. This GPR detection limitation is illustrated in Figure 15, which shows the transition from asphalt treated OGDL to cement treated OGDL around 297m. It is clearly seen in the figure that the 21
26 slab/ogdl interface is visible up to 297m then it disappears. The reflection from the copper plate at the slab/cement OGDL interface is clearly visible, however. 0 Distance (m) Depth (mm) Core Figure 14. Concrete slab thickness through CRCP section. As could be seen in Figure 15, the reflections from the transversal reinforcing bars (rebar) in the CRCP section are usually difficult to detect in GPR data collected by an aircoupled antenna at high survey speeds. This is mainly caused by the relatively small diameter of the bars combined with the effects of the air gap between the antenna and the pavement surface. In order to detect the rebar, it is usually preferable to use a high-frequency ground-coupled antenna and conduct the GPR survey at a very low speed to insure a high spatial acquisition resolution (at least 1 scan per 20 mm). Because of the large beamwidth (cone within which the EM energy is transmitted from the antenna) of the ground-coupled antenna (approximately 90 degrees), it would be receiving reflections from the rebar at a certain distance before it actually reaches it. The distance traveled by the EM waves in this case would be decreasing while the antenna is approaching the rebar. The minimum distance is achieved when the antenna is exactly on top of the rebar. The distance would then start increasing again as soon as the antenna starts moving away from the rebar. The combination of all these reflections is represented in a Linescan view as a hyperbola, with its peak showing the exact rebar location. Figure 16 shows GPR data collected by the 1500MHz ground-coupled antenna over the CRCP section. The locations of the transversal rebar are clearly seen in this figure by the hyperbola shapes. Because the longitudinal rebar is orthogonal to the polarization direction of the GPR antenna, it is usually not detectable by GPR. However, in the case of the CRCP section, and due to the relatively low spacing between the bars, longitudinal rebar is seen by the GPR antenna as a continuous layer. Hence, in Figure 16, the longitudinal rebar is shown as a continuous reflection 22

27 connecting the transversal rebar hyperbola reflections. In contrast, because of the same spacing between the longitudinal bars, some EM energy could still reach and get reflected from the bottom of the slab (i.e. the mesh formed by the longitudinal rebar is not a perfect EM reflector like a copper plate), which is found in Figure 16 at the same depth as the copper plate located at the concrete/ogdl interface. Concrete/Asphalt OGDL interface Pavement Surface Copper Plate Figure 15. Air-coupled GPR response over CRCP section. Construction quality control GPR was used during the construction phase to control the successful installation of galvanized steel meshes used in Sections I and L. The ground-coupled GPR system confirmed that the reinforcing meshes were kept in a leveled position after paving in most parts of the sections. However, some minor distortions were detected due to the waves produced while paving, as seen in Figure 17, showing ground-coupled GPR data over the reinforcing mesh installed in Section I. The same distortions were also found in the installed mesh in Section L, as shown in Figure 18. It was found that the first 7 m of the mesh were installed in the transition segment between Sections K and L where the BM-25.0 layer is reduced from a thickness of 244 mm to a thickness of 150 mm. 23


28 Figure 16. Ground-coupled GPR response over CRCP section. Pavement surface Minor distortions detected in the mesh final position Figure 17. Ground-coupled GPR survey of section I. Pavement surface Transition between sections K and L Minor distortion detected in the mesh final position 24
29 Figure 18. Ground-coupled GPR survey of Section L. In-situ HMA Dielectric Properties Estimation A new method to characterize the in-situ dielectric properties of HMA over the bandwidth of GPR (500 to 2000MHz) was developed at the Virginia Smart Road. The method was used to compare the dielectric properties of the different SuperPave TM mixes used in the road, namely: SM-12.5D, SM-9.5D, SM-9.5E, SM-9.5A, SM-9.5A, with high lab compaction and SMA The main differences between all these mixes include the binder type, binder content, and/or the nominal aggregate size. In order to estimate the dielectric properties of these mixes as placed in the field, GPR scans were taken over the different surface mixes where copper plates were previously placed during the pavement construction. Since copper is assumed to be a perfect EM energy reflector, all of the EM energy transmitted by the GPR through the HMA surface is reflected back to the GPR receiver, with the exception of a fraction of the energy that is lost within the layer due to material loss (i.e., dielectric loss and conduction loss). Comparing the measured GPR reflected signal to the transmitted signal, and using a theoretical model for the surveyed system (i.e., HMA layer plus copper plate) yields the dielectric properties of the HMA layer, which are the only unknowns in the theoretical model. Theoretically, the GPR reflected signal is related to the GPR incident signal in the frequency domain through the overall reflection coefficient of the surveyed system as given by the following equation: { Yr ( t) } Fr ( f ) { Y ( t) } F ( f ) F Γ in ( f ) = = (8) F i where Γ in (f) is the overall reflection coefficient, F{} is the Fourier transform, f is the frequency, and Y r (t) and Y i (t) are the reflected signal from the pavement surface and the incident signal, respectively. The Fourier transform is computed from the time domain signal using a fast Fourier transform (FFT) algorithm. The incident GPR signal is usually measured by placing a copper plate underneath the antenna on the surface of the pavement. It should be noted that, because the wearing surface is thin (design calls for a thickness of 38 mm at the Virginia Smart Road) compared to the GPR depth resolution, the reflected signal is composed of an overlap between the reflection from the surface of the pavement and the reflection from the copper plate. Moreover, because the air/hma surface interface and the copper plate underneath it are strong reflectors, EM energy would be trapped in between (i.e., EM energy would go back and forth between the interfaces). This would result in a ringing phenomenon or multiple reflections, which in turn would overlap with the first two reflections. The multiple reflections would continue until all the incident EM energy is dissipated within the HMA layer. On the other hand, the overall reflection coefficient Γ in (f) of the considered system (i.e., HMA layer plus copper plate) can be determined theoretically using the multiple reflection model presented in Equation 9. It should be noted that the GPR transmitted wave is assumed in this case transverse electromagnetic (TEM) propagating normally to the pavement surface. The i 25
30 overall reflection coefficient could be modeled theoretically according to the following equation (Balanis, 1989): 2 ( γt ) N Γ in ( f ) = γ (1 γ ) T (9) 2 1 γt where γ(f) and T(f) are respectively the reflection and transmission coefficients of the air/wearing surface interface and they are given by the following equations: * 1- εr ( f ) γ ( f ) = (10) * 1+ ε ( f ) r j ω c ε * r ( f ) d ω 1 γ ( f ) j d c 1+ γ ( f ) T ( f ) = e = e (11) and: N is the number of multiple reflections within the HMA layer, ε r * (f) is the complex dielectric constant of the wearing surface layer, d is the thickness of the HMA layer, ω is the angular frequency, and c is the speed of light in free space. Air 1 γ (1 γ 2 )*T 2 γ(1 γ 2 )*T 4 γ 2 (1 γ 2 )*T 6 1+γ γ 1 γ 1 γ 1 γ ΗΜΑ (1+γ)*T -1 (1+γ)*T (1+γ)*T 2 -γ γ (1+γ)*T 2 γ (1+γ)*T 3-1 γ (1+γ)*T 3 γ (1+γ)*T 4 -γ γ 2 (1+γ)*T 4 γ 2 (1+γ)*T 5-1 γ 2 (1+γ)*T 5 γ 2 (1+γ)*T 6 d Copper Plate Figure 19. Multiple reflection model. 26
31 Combining equations (8) and (9) leads to an equation where the reflection coefficient γ(f) is the only unknown: 2 N ( γt ) Fr ( f ) = g( γ ) = γ (1 γ ) T (12) 2 1 γt F ( f ) Equation (12) should be solved for γ(f) for the different frequencies within the GPR bandwidth. The HMA complex dielectric constant could then be recovered from the reflection coefficient γ(f) using the following equation derived from equation (10): i 2 * 1-γ ( f ) ε r ( f ) = (13) 1+ γ ( f ) Because of the periodicity introduced by the complex factor T, equation (12) typically has multiple solutions, depending upon the number of multiple reflections N, the frequency f, the HMA dielectric constant ε r *, and the HMA thickness d. However, in this case it was found that a unique solution exists for each frequency value within the GPR bandwidth and the maximum range of physical complex dielectric constant values. This result is illustrated in Figure 20, which shows the variations of the magnitude of the function g(γ) of equation (12) versus the expected values of γ at a frequency of 750MHz. The solution is highlighted in the figure by a small circle. g(γ) Imag(γ) Real(γ) 0 Figure 20. Zeros of the function g(γ) for a frequency of 750MHz. 27
32 The number of multiple reflections N was found by comparing the variations of the measured real and imaginary parts of the overall reflection coefficient Γ in (f) to the corresponding real and imaginary parts of the modeled reflection coefficient, for different values of N, and for a constant dielectric constant. The number of reflections N was thus found to be equal to five (5). For this value of N, equation (12) does not have a closed form solution; therefore, it has to be solved numerically. A Gauss-Newton algorithm was found to converge rapidly, in this case, to the required solution. Because the real and imaginary parts of the dielectric constant are continuous functions of frequency, the initial solution of the Gauss-Newton algorithm at any frequency value was chosen to be the exact solution found at the previous frequency value. The initial solution for the first frequency value was arbitrarily chosen to be four (4), which is a typical dielectric constant of HMA. Applying the previous technique to GPR data collected over the different HMA materials yields their dielectric constant variations over the GPR bandwidth. The real and negative imaginary parts of the dielectric constant found are depicted in Figure 21a through Figure 21f for the SM-9.5A, SM-9.5A with high lab compaction, SM-9.5D, SM-9.5E, SM-12.5D, and SMA- 12.5, respectively. A summary of the statistics for the dielectric constant variations (average, standard deviation, coefficient of variance (COV), and maximum) for the different mixes is presented in Table 6. According to the results of Figure 21 and Table 6, the variations of the real part of the dielectric constant within the GPR bandwidth are in the acceptable range. In fact, the real part s COV is found to vary between a minimum of 3.6% for the SM-9.5D mix to a maximum of 12.7% for the SM-9.5E mix. The standard deviation for the imaginary part is comparable to the average value, which suggests a high COV (high fluctuations around the average). However, since the imaginary part s maximum value is approximately 0.7 for all the mixes, these fluctuations might not be very significant. Table 6. Summary of dielectric constant variations for the different mixes. Mix Real Part -Imaginary Part Average Std. Dev. COV (%) Average Std. Dev. Maximum SM-9.5A SM-9.5A* SM-9.5D SM-9.5E SM-12.5D SMA * high lab compaction. 28
33 Dielectric Constant Real Imag Dielectric Constant Real Imag Frequency (GHz) (a) Frequency (GHz) (b) Dielectric Constant Real Imag Dielectric Constant Real Imag Frequency (GHz) Frequency (GHz) Dielectric Constant (c) Real Frequency (GHz) (e) Imag Dielectric Constant (d) Frequency (GHz) (f) Figure 21. Dielectric constant variations for the different mixes: (a) SM-9.5A, (b) SM-9.5A with high lab compaction, (c) SM-9.5D, (d) SM-9.5E, (e) SM-12.5D, (f) SMA Real Imag 29
34 Effect of dielectric properties variations on thickness estimation In order to investigate the significance of the dielectric properties variations on the GPR estimated HMA thicknesses, the average value of the complex dielectric constant found for each mix (as presented in Table 6) was used to estimate the thicknesses of the corresponding HMA layers. It should be noted that, because of the overlap of the reflected pulses and the existence of multiple reflections within the time domain reflected signal, it is difficult to accurately estimate the HMA layer thickness using the aforementioned time-domain technique. An alternative technique is to compute the thickness from the frequency-domain signal by solving equation (12) for d knowing the complex dielectric constant ε r *. The HMA thicknesses found by utilizing this technique for each mix, averaged within the GPR bandwidth, are presented in Table 7, along with their standard deviations (within the GPR bandwidth) and the actual layer thicknesses. The actual layer thicknesses were measured directly from cores taken near the copper plate locations. Table 7. Comparison between measured thickness and GPR estimated thickness. Mix Average Dielectric Constant Measured Thickness (mm) GPR Estimated Thickness (mm) Std. Dev. of Estimated Thickness (mm) SM-9.5A 4.9-j SM-9.5A* 4.3-j SM-9.5D 4.3-j SM-9.5E 4.6-j SM-12.5D 4.7-j SMA j * high lab compaction. According to the results presented in Table 7, the average HMA thicknesses estimated by GPR are exactly equal to the actual thicknesses of the different wearing surface types. Furthermore, based upon the standard deviation, it is apparent that the fluctuations of the thickness around the average are within an acceptable range (a maximum standard deviation of 3 mm was found compared to an average of 44 mm, which gives a COV of approximately 6%). Hence, it could be concluded that the variations of the dielectric constant within the GPR bandwidth do not largely affect the accuracy of the layer thickness determination of the different HMA. In other words, for the six investigated types of HMA, utilizing a static dielectric constant corresponding to the average dielectric constant within the GPR bandwidth would not jeopardize the accuracy of the layer thickness estimations from GPR data. CONCLUSIONS GPR testing at the Virginia Smart Road allowed the evaluation of the performance of GPR when used for nondestructive testing of flexible and rigid pavements. This evaluation was facilitated by the full knowledge of the different structures and compositions of the various sections of the road, in addition to the embedment of copper plates (perfect EM reflectors) at the 30
35 different layer interfaces during construction of the pavement. The following findings are presented: 1. Use of GPR to nondestructively estimate the layer thicknesses of aggregate, HMA, and concrete layers is validated. The error of the HMA layer thickness was found to be around 3% when the individual layers were resolved in the GPR reflected signal. The error increased to 12% when the overall HMA layer was considered without resolving the thin layers 2. A technique to estimate the variations, versus frequency, of the in-situ dielectric properties of HMA layers was developed and validated. 3. The effect of the variations of the dielectric properties within the GPR bandwidth is found to be insignificant vis-à-vis the accuracy of thickness estimation. 4. GPR can successfully be used as a quality control tool during pavement construction to ensure that the constructed layer thicknesses conform to the design. This nondestructive technique can be considered as a better alternative to coring since it does not disturb the pavement structure and provides continuous thickness information along the constructed section. GPR surveys can be conducted as soon as the HMA layer is hard enough for driving on it (i.e., 4 to 5 hours after placing the layer). RECOMMENDATIONS Given the success of using GPR for different applications at the Virginia Smart Road, it is recommended that GPR be implemented for use as a quality control tool for constructing new pavements and as an assessment tool for rehabilitation projects and as part of the Commonwealth Pavement Management System. The type of GPR system to be used depends upon the application and the level of accuracy needed in the project. For example, to measure the thickness of HMA layer or concrete slab in a network level, an air coupled system is recommended with a survey performed at a speed of 90 km/h. On a project level, air- and ground-coupled systems should be used simultaneously to achieve more accurate results. However, the survey speed should be reduced to 25 km/h. REFERENCES Balanis, C. (1989), Advanced Engineering Electromagnetics, John Wiley & Sons, Inc., New York, NY. Huang, Y. H. (1993), Pavement Analysis and Design, Prentice Hall, New Jersey. Lahouar, S., Al-Qadi, I. L., Loulizi, A., Trenton, C. M., and. Lee, D. T. (2002), Approach to Determining In-Situ Dielectric Constant of Pavements: Development and Implementation at Interstate 81, Transportation Research Record No 1806, Assessing and Evaluating Pavements, TRB, National Research Council, Washington, DC, pp Lahouar S. (2003), Development of Data Analysis Algorithms for Interpretation of Groundpenetrating radar Data, Ph.D. dissertation, Dept. of Elect. Eng., Virginia Tech, Blacksburg, VA. 31
36 32
37 APPENDIX A Figure A1. Copper plate locations, Section A Figure A2. Copper plate locations, Section B Figure A3. Copper plate locations, Section C Figure A4. Copper plate locations, Section D Figure A5. Copper plate locations, Section E Figure A6. Copper plate locations, Section F Figure A7. Copper plate locations, Section G Figure A8. Copper plate locations, Section H Figure A9. Copper plate locations, Section I Figure A10. Copper plate locations, Section J Figure A11. Copper plate locations, Section K Figure A12. Copper plate locations, Section L Figure A13. Copper plate locations, CRCP Sections Table A1. State coordinates for the copper plates 33
38 34
39 Figure A1. Copper plate locations, Section A. 35
40 Figure A2. Copper plate locations, Section B. 36
41 Figure A3. Copper plate locations, Section C. 37
42 Figure A4. Copper plate locations, Section D. 38
43 Figure A5. Copper plate locations, Section E. 39
44 Figure A6. Copper plate locations, Section F. 40
45 Figure A7. Copper plate locations, Section G. 41
46 Figure A8. Copper plate locations, Section H. 42
47 Figure A9. Copper plate locations, Section I. 43
48 Figure A10. Copper plate locations, Section J. 44
49 Figure A11. Copper plate locations, Section K. 45
50 Figure A12. Copper plate locations, Section L. 46

51 Figure A13. Copper plate locations, CRCP Sections. Table A1. State coordinates for the copper plates 47
52 48
53 APPENDIX B Figure B1. Control Unit Figure B2. Transceiver and horn antennas for the air-coupled system Figure B3. Ground-coupled antennas: (a) 900 MHz, (b) 1.5 GHz Figure B4. Air-coupled and ground-coupled antennas mounted behind survey van Figure B5. Control unit inside van Figure B6. DMI mounted on GPR van wheel 49
54 50


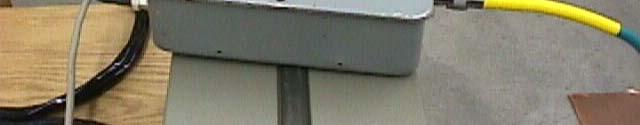

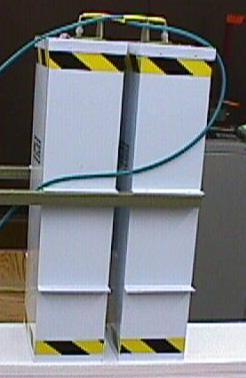


55 Figure B1. Control Unit. Figure B2. Transceiver and horn antennas for the air-coupled system. (a) (b) Figure B3. Ground-coupled antennas: (a) 900MHz, (b) 1.5GHz. 51


56 Figure B4. Air-coupled and ground-coupled antennas mounted behind survey van. Figure B5. Control unit inside van. 52

57 Figure B6. DMI mounted on GPR van wheel. 53
1. Report No. FHWA/TX-05/ Title and Subtitle PILOT IMPLEMENTATION OF CONCRETE PAVEMENT THICKNESS GPR
 1. Report No. FHWA/TX-05/5-4414-01-3 4. Title and Subtitle PILOT IMPLEMENTATION OF CONCRETE PAVEMENT THICKNESS GPR Technical Report Documentation Page 2. Government Accession No. 3. Recipient s Catalog
Form DOT F (8-72) This form was electrically by Elite Federal Forms Inc. 16. Abstract:
 This form was electrically by Elite Federal Forms Inc. 16. Abstract:") 1. Report No. FHWA/TX-06/0-4820-3 4. Title and Subtitle Investigation of a New Generation of FCC Compliant NDT Devices for Pavement Layer Information Collection: Technical Report 2. Government Accession
1. Report No. FHWA/TX-06/0-4820-3 4. Title and Subtitle Investigation of a New Generation of FCC Compliant NDT Devices for Pavement Layer Information Collection: Technical Report 2. Government Accession
GPR SYSTEM USER GUIDE AND TROUBLESHOOTING GUIDE
 GPR SYSTEM USER GUIDE AND TROUBLESHOOTING GUIDE Implementation Report 5-4414-01-1 Project Number 5-4414-01 Subsurface Sensing Lab Electrical and Computer Engineering University of Houston 4800 Calhoun
The use of high frequency transducers, MHz, allowing the resolution to target a few cm thick in the first half meter suspect.
 METHODOLOGY GPR (GROUND PROBING RADAR). In recent years the methodology GPR (Ground Probing Radar) has been applied with increasing success under the NDT thanks to the high speed and resolving power. As
Ground Penetrating Radar (GPR) By Dr. Eng. Zubair Ahmed
 By Dr. Eng. Zubair Ahmed") Ground Penetrating Radar (GPR) By Dr. Eng. Zubair Ahmed Acknowledgement Golder Associates, Whitby, Ontario Stantec Consulting, Kitchener, Ontario Infrasense Inc. USA Geophysical Survey Systems Inc. (GSSI),
Ground Penetrating Radar (GPR) By Dr. Eng. Zubair Ahmed Acknowledgement Golder Associates, Whitby, Ontario Stantec Consulting, Kitchener, Ontario Infrasense Inc. USA Geophysical Survey Systems Inc. (GSSI),
Tri-band ground penetrating radar for subsurface structural condition assessments and utility mapping
 Tri-band ground penetrating radar for subsurface structural condition assessments and utility mapping D. Huston *1, T. Xia 1, Y. Zhang 1, T. Fan 1, J. Razinger 1, D. Burns 1 1 University of Vermont, Burlington,
ScienceDirect. A comparison of dielectric constants of various asphalts calculated from time intervals and amplitudes
 Available online at www.sciencedirect.com ScienceDirect Procedia Engineering 111 (2015 ) 660 665 XXIV R-S-P seminar, Theoretical Foundation of Civil Engineering (24RSP) (TFoCE 2015) A comparison of dielectric
7. Consider the following common offset gather collected with GPR.
 Questions: GPR 1. Which of the following statements is incorrect when considering skin depth in GPR a. Skin depth is the distance at which the signal amplitude has decreased by a factor of 1/e b. Skin
The Discussion of this exercise covers the following points:
 Exercise 3-2 Frequency-Modulated CW Radar EXERCISE OBJECTIVE When you have completed this exercise, you will be familiar with FM ranging using frequency-modulated continuous-wave (FM-CW) radar. DISCUSSION
Chapter 4 Results. 4.1 Pattern recognition algorithm performance
 94 Chapter 4 Results 4.1 Pattern recognition algorithm performance The results of analyzing PERES data using the pattern recognition algorithm described in Chapter 3 are presented here in Chapter 4 to
Report. Mearns Consulting LLC. Former Gas Station 237 E. Las Tunas Drive San Gabriel, California Project # E
 Mearns Consulting LLC Report Former Gas Station 237 E. Las Tunas Drive San Gabriel, California Project #1705261E Charles Carter California Professional Geophysicist 20434 Corisco Street Chatsworth, CA
Geophysical Survey Rock Hill Bleachery TBA Site Rock Hill, South Carolina EP-W EPA, START 3, Region 4 TABLE OF CONTENTS Section Page Signature
 Geophysical Survey Rock Hill Bleachery TBA Site Rock Hill, South Carolina EP-W-05-054 EPA, START 3, Region 4 Prepared for: Tetra Tech EM, Inc. October 12, 2012 Geophysical Survey Rock Hill Bleachery TBA
GPR Investigation: Post Tension Cable Mapping
 CMD Civil Pty Ltd PO Box 1119 Huntingdale VIC 3166 +61 3 9544 8833 info@cmdcivil.com www.cmdcivil.com Case Study: GPR Investigation: Post Tension Cable Mapping This application note demonstrates an example
Report on a Ground Penetrating Radar survey of Longyearbreen
 Report on a Ground Penetrating Radar survey of Longyearbreen AT-329 Unis, 10.03.2006 Christopher Nuth Karen Klemetsrud Matthias Hofmann Tone Gulliksen Øy Abstract: Ground Penetration Radar was used to
Standard Test Method for Evaluating Asphalt-Covered Concrete Bridge Decks Using Ground Penetrating Radar 1
 Designation: D 6087 08 Standard Test Method for Evaluating Asphalt-Covered Concrete Bridge Decks Using Ground Penetrating Radar 1 This standard is issued under the fixed designation D 6087; the number
Case Studies and Innovative Uses of GPR for Pavement Engineering Applications
 Case Studies and Innovative Uses of GPR for Pavement Engineering Applications Richard Korczak, MASc., P.Eng., Stantec Consulting Ltd. Amir Abd El Halim, PhD., P.Eng., Stantec Consulting Ltd. Paper prepared
Model 4105 Horn Antenna
 Model 4105 Horn Antenna System Settings and User Notes The Difference is the Data 13 Klein Drive, P.O. Box 97 North Salem, NH 03073-0097 Phone: (603) 893-1109 / Fax: (603) 889-3984 www.geophysical.com
GPR SURVEY METHOD. Ground probing radar
 The ground penetrating radar (GPR - Ground Probing Radar) is a geophysical method used to investigate the near surface underground. Thanks to its high degree of resolution, the GPR is the most effective
Project No.: VTRC 06-R22 March Period Covered: Contract No.
 Standard Title Page - Report on State Project Report No. Report Date No. Pages Type Report: Final Project No.: 78783 VTRC 06-R22 March 2006 17 Period Covered: Contract No. Title: Evaluation of Precast
An Introduction to Spectrum Analyzer. An Introduction to Spectrum Analyzer
 1 An Introduction to Spectrum Analyzer 2 Chapter 1. Introduction As a result of rapidly advancement in communication technology, all the mobile technology of applications has significantly and profoundly
Exercise 1-3. Radar Antennas EXERCISE OBJECTIVE DISCUSSION OUTLINE DISCUSSION OF FUNDAMENTALS. Antenna types
 Exercise 1-3 Radar Antennas EXERCISE OBJECTIVE When you have completed this exercise, you will be familiar with the role of the antenna in a radar system. You will also be familiar with the intrinsic characteristics
Dr. Ali Muqaibel. Associate Professor. Electrical Engineering Department King Fahd University of Petroleum & Minerals Dhahran, Saudi Arabia
 By Associate Professor Electrical Engineering Department King Fahd University of Petroleum & Minerals Dhahran, Saudi Arabia Wednesday, December 1, 14 1 st Saudi Symposium for RADAR Technology 9 1 December
MAKING TRANSIENT ANTENNA MEASUREMENTS
 MAKING TRANSIENT ANTENNA MEASUREMENTS Roger Dygert, Steven R. Nichols MI Technologies, 1125 Satellite Boulevard, Suite 100 Suwanee, GA 30024-4629 ABSTRACT In addition to steady state performance, antennas
Estimaton of Rebar Diameter Using Ground Penetrating Radar
 International Journal of Advances in Scientific Research and Engineering (ijasre) E-ISSN : 2454-8006 Vol.3, Special Issue 1 Aug - 2017 Estimaton of Rebar Diameter Using Ground Penetrating Radar K Ambika
Advanced Ground Investigation Techniques to Help Limit Risk or Examine Failure. Advanced Subsurface Investigations
 Advanced Ground Investigation Techniques to Help Limit Risk or Examine Failure Overview Introduction What is geophysics? Why use it? Common Methods Seismic Ground Radar Electrical Case Studies Conclusion
Technical Report Documentation Page 2. Government 3. Recipient s Catalog No.
 1. Report No. FHWA/TX-06/0-4958-1 Technical Report Documentation Page 2. Government 3. Recipient s Catalog No. Accession No. 4. Title and Subtitle Linear Lighting System for Automated Pavement Distress
IEEE 802.3ba 40Gb/s and 100Gb/s Ethernet Task Force 22th Sep 2009
 Draft Amendment to IEEE Std 0.-0 IEEE Draft P0.ba/D. IEEE 0.ba 0Gb/s and 00Gb/s Ethernet Task Force th Sep 0.. Stressed receiver sensitivity Stressed receiver sensitivity shall be within the limits given
Form DOT F (8-72) 'This fonn was electrically by Elite Federal Fonns Inc. Reproduction of completed page authorized
 'This fonn was electrically by Elite Federal Fonns Inc. Reproduction of completed page authorized") l.report No. / 12. Government Accession No. 3. Recipient's Catalog No. TxDOT4172-4. Title and Subtitle 5. Report Date Development of a Radar System for the Non-Destructive Measurement of Feb.2001 Concrete
l.report No. / 12. Government Accession No. 3. Recipient's Catalog No. TxDOT4172-4. Title and Subtitle 5. Report Date Development of a Radar System for the Non-Destructive Measurement of Feb.2001 Concrete
PS 1000 X-Scan Tips & Tricks. Quick Guide
 PS 1000 X-Scan Tips & Tricks Quick Guide en en QUICK GUIDE Tips & tricks 1. PS 1000 X-Scan Scanning on rough surfaces When the scanner is moved over a rough surface, the distance between the scanner and
Detection of Obscured Targets: Signal Processing
 Detection of Obscured Targets: Signal Processing James McClellan and Waymond R. Scott, Jr. School of Electrical and Computer Engineering Georgia Institute of Technology Atlanta, GA 30332-0250 jim.mcclellan@ece.gatech.edu
Investigation of Bridge Decks Utilizing Ground Penetrating Radar
 Investigation of Bridge Decks Utilizing Ground Penetrating Radar Steve Cardimona *, Brent Willeford *, John Wenzlick +, Neil Anderson * * The University of Missouri-Rolla, Department of Geology and Geophysics
An acousto-electromagnetic sensor for locating land mines
 An acousto-electromagnetic sensor for locating land mines Waymond R. Scott, Jr. a, Chistoph Schroeder a and James S. Martin b a School of Electrical and Computer Engineering b School of Mechanical Engineering
Exercise 3-3. Multiple-Source Jamming Techniques EXERCISE OBJECTIVE
 Exercise 3-3 Multiple-Source Jamming Techniques EXERCISE OBJECTIVE To introduce multiple-source jamming techniques. To differentiate between incoherent multiple-source jamming (cooperative jamming), and
Microwave Remote Sensing (1)
") Microwave Remote Sensing (1) Microwave sensing encompasses both active and passive forms of remote sensing. The microwave portion of the spectrum covers the range from approximately 1cm to 1m in wavelength.
Microwave Remote Sensing (1) Microwave sensing encompasses both active and passive forms of remote sensing. The microwave portion of the spectrum covers the range from approximately 1cm to 1m in wavelength.
Understanding Seismic Amplitudes
 Understanding Seismic Amplitudes The changing amplitude values that define the seismic trace are typically explained using the convolutional model. This model states that trace amplitudes have three controlling
GPR Data Acquisition and Interpretation
 1 GPR Data Acquisition and Interpretation Mezgeen Rasol PhD Candidate Geophysics and Seismic Engineering Polytechnic University of Catalonia mezgeen.rasol@upc.edu BIG-SKY-EARTH Cost Action TD143 Workshop
Part VI: Requirements for Integrated Services Digital Network Terminal Equipment
 Issue 9, Amendment 1 September 2012 Spectrum Management and Telecommunications Compliance Specification for Terminal Equipment, Terminal Systems, Network Protection Devices, Connection Arrangements and
Downloaded from library.seg.org by on 10/26/14. For personal use only. SEG Technical Program Expanded Abstracts 2014
 Ground penetrating abilities of broadband pulsed radar in the 1 70MHz range K. van den Doel, Univ. of British Columbia, J. Jansen, Teck Resources Limited, M. Robinson, G. C, Stove, G. D. C. Stove, Adrok
Some Advances in UWB GPR
 Some Advances in UWB GPR Gennadiy Pochanin Abstract A principle of operation and arrangement of UWB antenna systems with frequency independent electromagnetic decoupling is discussed. The peculiar design
Ground Penetrating Radar (day 1) EOSC Slide 1
 EOSC Slide 1") Ground Penetrating Radar (day 1) Slide 1 Introduction to GPR Today s Topics Setup: Motivational Problems Physical Properties - Dielectric Permittivity and Radiowaves - Microwave Example Basic Principles:
Ground Penetrating Radar (day 1) Slide 1 Introduction to GPR Today s Topics Setup: Motivational Problems Physical Properties - Dielectric Permittivity and Radiowaves - Microwave Example Basic Principles:
Texas Transportation Institute The Texas A&M University System College Station, Texas
 1. Report No. FHWA/TX-06/5-4577-01-1 4. Title and Subtitle PILOT IMPLEMENTATION OF PAVE-IR FOR DETECTING SEGREGATION IN HOT-MIX ASPHALT CONSTRUCTION 2. Government Accession No. 3. Recipient's Catalog No.
Results of GPR survey of AGH University of Science and Technology test site (Cracow neighborhood).
.") Results of GPR survey of AGH University of Science and Technology test site (Cracow neighborhood). October 02, 2017 Two GPR sets were used for the survey. First GPR set: low-frequency GPR Loza-N [1]. Technical
Results of GPR survey of AGH University of Science and Technology test site (Cracow neighborhood). October 02, 2017 Two GPR sets were used for the survey. First GPR set: low-frequency GPR Loza-N [1]. Technical
Maximizing the Fatigue Crack Response in Surface Eddy Current Inspections of Aircraft Structures
 Maximizing the Fatigue Crack Response in Surface Eddy Current Inspections of Aircraft Structures Catalin Mandache *1, Theodoros Theodoulidis 2 1 Structures, Materials and Manufacturing Laboratory, National
TxDOT Project : Evaluation of Pavement Rutting and Distress Measurements
 0-6663-P2 RECOMMENDATIONS FOR SELECTION OF AUTOMATED DISTRESS MEASURING EQUIPMENT Pedro Serigos Maria Burton Andre Smit Jorge Prozzi MooYeon Kim Mike Murphy TxDOT Project 0-6663: Evaluation of Pavement
Assessment of layer thickness and uniformity in railway embankments with Ground Penetrating Radar
 Assessment of layer thickness and uniformity in railway embankments with Ground Penetrating Radar F.M. Fernandes Department of Civil Engineering, University of Minho, Guimarães, Portugal M. Pereira Geotechnique
7. Experiment K: Wave Propagation
 7. Experiment K: Wave Propagation This laboratory will be based upon observing standing waves in three different ways, through coaxial cables, in free space and in a waveguide. You will also observe some
SEPTEMBER VOL. 38, NO. 9 ELECTRONIC DEFENSE SIMULTANEOUS SIGNAL ERRORS IN WIDEBAND IFM RECEIVERS WIDE, WIDER, WIDEST SYNTHETIC APERTURE ANTENNAS
 r SEPTEMBER VOL. 38, NO. 9 ELECTRONIC DEFENSE SIMULTANEOUS SIGNAL ERRORS IN WIDEBAND IFM RECEIVERS WIDE, WIDER, WIDEST SYNTHETIC APERTURE ANTENNAS CONTENTS, P. 10 TECHNICAL FEATURE SIMULTANEOUS SIGNAL
Applied Geophysics Nov 2 and 4
 Applied Geophysics Nov 2 and 4 Effects of conductivity Surveying geometries Noise in GPR data Summary notes with essential equations Some Case histories EOSC 350 06 Slide 1 GPR Ground Penetrating Radar
Precast Concrete Panels for Rapid Pavement Repair
 Precast Concrete Panels for Rapid Pavement Repair Scott Shuler, Ph. D., P. E. Colorado State University Ft. Collins, CO 80523-1584 Gary Dewitt, P. E. Colorado Department of Transportation Evans, Colorado
Rec. ITU-R F RECOMMENDATION ITU-R F *
 Rec. ITU-R F.162-3 1 RECOMMENDATION ITU-R F.162-3 * Rec. ITU-R F.162-3 USE OF DIRECTIONAL TRANSMITTING ANTENNAS IN THE FIXED SERVICE OPERATING IN BANDS BELOW ABOUT 30 MHz (Question 150/9) (1953-1956-1966-1970-1992)
RADAR INSPECTION OF CONCRETE, BRICK AND MASONRY STRUCTURES
 RADAR INSPECTION OF CONCRETE, BRICK AND MASONRY STRUCTURES C.P.Hobbs AEA Industrial Technology Materials and Manufacturing Division Nondestructive Testing Department Building 447 Harwell Laboratory Oxon
GPR Part II: Effects of conductivity. Surveying geometries. Noise in GPR data. Summary notes with essential equations. Some Case histories
 GPR Part II: Effects of conductivity Surveying geometries Noise in GPR data Summary notes with essential equations Some Case histories EOSC 350 06 Slide 1 GPR Ground Penetrating Radar R = ε ε 2 2 + ε ε
Diagnostics of Bridge Pavements by Ground Penetrating Radar
 11th European Conference on Non-Destructive Testing (ECNDT 2014), October 6-10, 2014, Prague, Czech Republic Diagnostics of Bridge Pavements by Ground Penetrating Radar Radek MATULA 1, Josef STRYK 1, Karel
Design and analysis of new GPR antenna concepts R.V. de Jongh (1), A.G. Yarovoy (1), L. P. Ligthart (1), I.V. Kaploun (2), A.D.
, A.G. Yarovoy (1), L. P. Ligthart (1), I.V. Kaploun (2), A.D.") Design and analysis of new GPR antenna concepts R.V. de Jongh (1), A.G. Yarovoy (1), L. P. Ligthart (1), I.V. Kaploun (2), A.D. Schukin (2) (1) Delft University of Technology, Faculty of Information Technology
Design and analysis of new GPR antenna concepts R.V. de Jongh (1), A.G. Yarovoy (1), L. P. Ligthart (1), I.V. Kaploun (2), A.D. Schukin (2) (1) Delft University of Technology, Faculty of Information Technology
Sea Surface Backscatter Distortions of Scanning Radar Altimeter Ocean Wave Measurements
 Sea Surface Backscatter Distortions of Scanning Radar Altimeter Ocean Wave Measurements Edward J. Walsh and C. Wayne Wright NASA Goddard Space Flight Center Wallops Flight Facility Wallops Island, VA 23337
New Features of IEEE Std Digitizing Waveform Recorders
 New Features of IEEE Std 1057-2007 Digitizing Waveform Recorders William B. Boyer 1, Thomas E. Linnenbrink 2, Jerome Blair 3, 1 Chair, Subcommittee on Digital Waveform Recorders Sandia National Laboratories
Notes on OR Data Math Function
 A Notes on OR Data Math Function The ORDATA math function can accept as input either unequalized or already equalized data, and produce: RF (input): just a copy of the input waveform. Equalized: If the
GROUND PENETRATING RADAR (GEORADAR) INSPECTION
 INSPECTION") - CIVIL ENGENEERING - GEOLOGY AND ENVIRONMENT - GROUND PENETRATING RADAR - LOSSES DETECTING RADAR SYSTEM - ARCHEOLOGY & CULTURAL HERITAGE - CARGO INSPECTION - LOSS CONTROL - CHEMICAL ANALYSIS - INDUSTRIAL
- CIVIL ENGENEERING - GEOLOGY AND ENVIRONMENT - GROUND PENETRATING RADAR - LOSSES DETECTING RADAR SYSTEM - ARCHEOLOGY & CULTURAL HERITAGE - CARGO INSPECTION - LOSS CONTROL - CHEMICAL ANALYSIS - INDUSTRIAL
(i) Determine the admittance parameters of the network of Fig 1 (f) and draw its - equivalent circuit.
 Determine the admittance parameters of the network of Fig 1 (f) and draw its - equivalent circuit.") I.E.S-(Conv.)-1995 ELECTRONICS AND TELECOMMUNICATION ENGINEERING PAPER - I Some useful data: Electron charge: 1.6 10 19 Coulomb Free space permeability: 4 10 7 H/m Free space permittivity: 8.85 pf/m Velocity
I.E.S-(Conv.)-1995 ELECTRONICS AND TELECOMMUNICATION ENGINEERING PAPER - I Some useful data: Electron charge: 1.6 10 19 Coulomb Free space permeability: 4 10 7 H/m Free space permittivity: 8.85 pf/m Velocity
A New TEM Horn Antenna Designing Based on Plexiglass Antenna Cap
 Journal of Applied Science and Engineering, Vol. 21, No. 3, pp. 413 418 (2018) DOI: 10.6180/jase.201809_21(3).0012 A New TEM Horn Antenna Designing Based on Plexiglass Antenna Cap Lin Teng and Jie Liu*
Advanced Utility Locating Technologies (R01B)
") Advanced Utility Locating Technologies (R01B) Jacob Sheehan Senior Geophysicist Olson Engineering Phil Sirles Principal Geophysicist Olson Engineering Introduction: Utility Bundle Overview SHRP2 Strategic
Advanced Utility Locating Technologies (R01B) Jacob Sheehan Senior Geophysicist Olson Engineering Phil Sirles Principal Geophysicist Olson Engineering Introduction: Utility Bundle Overview SHRP2 Strategic
CENTER FOR INFRASTRUCTURE ENGINEERING STUDIES
 1 CENTER FOR INFRASTRUCTURE ENGINEERING STUDIES Nondestructive Ultrasonic Detection of FRP Delamination By Dr. Norbert Maerz University Transportation Center Program at UTC R81 The University of Missouri-Rolla
Characteristics of an Optical Delay Line for Radar Testing
 Naval Research Laboratory Washington, DC 20375-5320 NRL/MR/5306--16-9654 Characteristics of an Optical Delay Line for Radar Testing Mai T. Ngo AEGIS Coordinator Office Radar Division Jimmy Alatishe SukomalTalapatra
CHAPTER 1 INTRODUCTION
 1 CHAPTER 1 INTRODUCTION In maritime surveillance, radar echoes which clutter the radar and challenge small target detection. Clutter is unwanted echoes that can make target detection of wanted targets
3D UTILITY MAPPING USING ELECTRONICALLY SCANNED ANTENNA ARRAY. Egil S. Eide and Jens F. Hjelmstad
 D UTILITY MAPPING USING ELECTRONICALLY SCANNED ANTENNA ARRAY Egil S. Eide and Jens F. Hjelmstad Department of Telecommunications Norwegian University of Science and Technology, N-79 Trondheim, Norway eide@tele.ntnu.no
Part VI: Requirements for ISDN Terminal Equipment
 Issue 9 November 2004 Spectrum Management and Telecommunications Policy Compliance Specification for Terminal Equipment, Terminal Systems, Network Protection Devices, Connection Arrangements and Hearing
Practical Considerations for Radiated Immunities Measurement using ETS-Lindgren EMC Probes
 Practical Considerations for Radiated Immunities Measurement using ETS-Lindgren EMC Probes Detectors/Modulated Field ETS-Lindgren EMC probes (HI-6022/6122, HI-6005/6105, and HI-6053/6153) use diode detectors
Design and experimental realization of the chirped microstrip line
 Chapter 4 Design and experimental realization of the chirped microstrip line 4.1. Introduction In chapter 2 it has been shown that by using a microstrip line, uniform insertion losses A 0 (ω) and linear
UNIVERSITI MALAYSIA PERLIS
 UNIVERSITI MALAYSIA PERLIS SCHOOL OF COMPUTER & COMMUNICATIONS ENGINEERING EKT 341 LABORATORY MODULE LAB 2 Antenna Characteristic 1 Measurement of Radiation Pattern, Gain, VSWR, input impedance and reflection
MICROWAVE SCATTERING FOR THE CHARACTERIZATION OF A DISC-SHAPE VOID IN DIELECTRIC MATERIALS AND COMPOSITES
 MICROWAVE SCATTERING FOR THE CHARACTERIZATION OF A DISC-SHAPE VOID IN DIELECTRIC MATERIALS AND COMPOSITES John M. Liu Code 684 Naval Surface Warfare Center Carderock Div. West Bethesda, Md. 20817-5700
SIMULATION OF GPR SCENARIOS USING FDTD
 SIMULATION OF GPR SCENARIOS USING FDTD 1 GAMIL ALSHARAHI, 2 ABDELLAH DRIOUACH, 3 AHMED FAIZE 1,2 Department of physic, Abdelmalek Essaâdi University, Faculty of sciences, Morocco 3 Department of physic,
SURVEYING THE UNDERGROUND
 SURVEYING THE UNDERGROUND An Introduction to ASCE 38-02 and the Practice of Subsurface Utility Engineering ACECMD March 28, 2018 Presented by: Art Worthman A. Morton Thomas & Associates, Inc. John Berrettini
Radar Methods General Overview
 Environmental and Exploration Geophysics II Radar Methods General Overview tom.h.wilson tom.wilson@mail.wvu.edu Department of Geology and Geography West Virginia University Morgantown, WV Brown (2004)
Mhow (MP) PIN c/o 56 APO RFI : PROCUREMENT OF FAST TRANSIENT RESPONSE ELECTROMAGNETIC PULSE (EMP) SIMULATOR
 PIN c/o 56 APO RFI : PROCUREMENT OF FAST TRANSIENT RESPONSE ELECTROMAGNETIC PULSE (EMP) SIMULATOR") Tele : 07324-256130 Army Centre for Electromagnetics Mhow (MP) PIN - 900444 c/o 56 APO 2710/M/EMP Sml/ 23 Jul 20 To RFI : PROCUREMENT OF FAST TRANSIENT RESPONSE ELECTROMAGNETIC PULSE (EMP) SIMULATOR 1.
Tele : 07324-256130 Army Centre for Electromagnetics Mhow (MP) PIN - 900444 c/o 56 APO 2710/M/EMP Sml/ 23 Jul 20 To RFI : PROCUREMENT OF FAST TRANSIENT RESPONSE ELECTROMAGNETIC PULSE (EMP) SIMULATOR 1.
Using GPR Technique Assessment for Study the Sub-Grade of Asphalt and Concrete Conditions
 Using GPR Technique Assessment for Study the Sub-Grade of Asphalt and Concrete Conditions Alaa S. Mahdi Remote Sensing Unit, College of Science, University of Baghdad, Baghdad, Iraq Abstract The Ground
P a g e 1 ST985. TDR Cable Analyzer Instruction Manual. Analog Arts Inc.
 P a g e 1 ST985 TDR Cable Analyzer Instruction Manual Analog Arts Inc. www.analogarts.com P a g e 2 Contents Software Installation... 4 Specifications... 4 Handling Precautions... 4 Operation Instruction...
Dowel Bar Alignment and Location for Placement by Mechanical Dowel Bar Insertion
 Dowel Bar Alignment and Location for Placement by Mechanical Dowel Bar Insertion January 7, 2013 Scope, Background and Applicability This guide specification is directly applicable to 18 in. (457 mm) long,
Fig.: Developed Hand Held cavity Detector (Ground Penetrating Radar) with the type of display of results
 with the type of display of results") Major Research Initiatives (12-13 to 1-16) by Prof. Dharmendra Singh, Microwave Imaging and Space Technology Application Lab, Dept. of Electronics and Communication Engineering, IIT Roorkee, Roorkee-247667
Major Research Initiatives (12-13 to 1-16) by Prof. Dharmendra Singh, Microwave Imaging and Space Technology Application Lab, Dept. of Electronics and Communication Engineering, IIT Roorkee, Roorkee-247667
Exercise 1-5. Antennas in EW: Sidelobe Jamming and Space Discrimination EXERCISE OBJECTIVE
 Exercise 1-5 Antennas in EW: Sidelobe Jamming EXERCISE OBJECTIVE To demonstrate that noise jamming can be injected into a radar receiver via the sidelobes of the radar antenna. To outline the effects of
Correlation Between Measured and Simulated Parameters of a Proposed Transfer Standard
 Correlation Between Measured and Simulated Parameters of a Proposed Transfer Standard Jim Nadolny AMP Incorporated ABSTRACT Total radiated power of a device can be measured using a mode stirred chamber
Modeling of Ground-Penetrating Radar Wave Propagation in Pavement Systems
 TRANSPORTATION RESEARCH RECORD 1355 99 Modeling of Ground-Penetrating Radar Wave Propagation in Pavement Systems CHUN LOK LAU, TOM SCULLION, AND PAUL CHAN In recent years considerable attention has been
Exercise 2-6. Target Bearing Estimation EXERCISE OBJECTIVE
 Exercise 2-6 EXERCISE OBJECTIVE When you have completed this exercise, you will be able to evaluate the position of the target relative to a selected beam using the A-scope display. You will be able to
THE BEST GPR DATA QUALITY AT THE BEST PRICE! GROUND PENETRATING RADAR ZOND-12e G R O U N D P E N E T R A T I N G R A D A R S
 GROUND PENETRATING RADAR ZOND-12e General Purpose Pulse GPR ZOND-12e SINGLE CHANNEL OR ADVANCED CONTROL UNITS ZOND 12e GPR is a portable digital Ground Penetrating Radar carried by a single operator. The
Time Domain Far Field Antenna Measurements Without Anechoic Chamber
 1 Time Domain Far Field Antenna Measurements Without Anechoic Chamber Adjacent Reflecting Objects Transmitting Antenna Antenna Under Test Pulse Generator Head Sampling Unit DC-26GHz Pulse Generator Mainframe
Space Frequency Coordination Group
 Space Frequency Coordination Group Report SFCG 38-1 POTENTIAL RFI TO EESS (ACTIVE) CLOUD PROFILE RADARS IN 94.0-94.1 GHZ FREQUENCY BAND FROM OTHER SERVICES Abstract This new SFCG report analyzes potential
MICROWAVE SUB-SURFACE IMAGING TECHNOLOGY FOR DAMAGE DETECTION
 MICROWAVE SUB-SURFACE IMAGING TECHNOLOGY FOR DAMAGE DETECTION By Yoo Jin Kim 1, Associate Member, ASCE, Luis Jofre 2, Franco De Flaviis 3, and Maria Q. Feng 4, Associate Member, ASCE Abstract: This paper
Downloaded from 1. THE FOLLOWING PAGES OF MIL-STD-462D HAVE BEEN REVISED AND SUPERSEDE THE PAGES LISTED:
 NOTICE OF CHANGE METRIC 10 April 1995 MILITARY STANDARD MEASUREMENT OF ELECTROMAGNETIC INTERFERENCE CHARACTERISTICS TO ALL HOLDERS OF : 1. THE FOLLOWING PAGES OF HAVE BEEN REVISED AND SUPERSEDE THE PAGES
Analysis of Crack Detection in Metallic and Non-metallic Surfaces Using FDTD Method
 ECNDT 26 - We.4.3.2 Analysis of Crack Detection in Metallic and Non-metallic Surfaces Using FDTD Method Faezeh Sh.A.GHASEMI 1,2, M. S. ABRISHAMIAN 1, A. MOVAFEGHI 2 1 K. N. Toosi University of Technology,
9/28/2010. Chapter , The McGraw-Hill Companies, Inc.
 Chapter 4 Sensors are are used to detect, and often to measure, the magnitude of something. They basically operate by converting mechanical, magnetic, thermal, optical, and chemical variations into electric
Exercise 4. Angle Tracking Techniques EXERCISE OBJECTIVE
 Exercise 4 Angle Tracking Techniques EXERCISE OBJECTIVE When you have completed this exercise, you will be familiar with the principles of the following angle tracking techniques: lobe switching, conical
FISCHER CUSTOM COMMUNICATIONS, INC.
 FISCHER CUSTOM COMMUNICATIONS, INC. Current Probe Catalog FISCHER CUSTOM COMMUNICATIONS, INC. Fischer Custom Communications, Inc., is a manufacturer of custom electric and magnetic field sensors for military
Ground Penetrating Radar
 Ground Penetrating Radar Begin a new section: Electromagnetics First EM survey: GPR (Ground Penetrating Radar) Physical Property: Dielectric constant Electrical Permittivity EOSC 350 06 Slide Di-electric
Paper presented at the Int. Lightning Detection Conference, Tucson, Nov. 1996
 Paper presented at the Int. Lightning Detection Conference, Tucson, Nov. 1996 Detection Efficiency and Site Errors of Lightning Location Systems Schulz W. Diendorfer G. Austrian Lightning Detection and
Index Terms - Attenuation Constant(α), MB-OFDM Signal, Propagation Constant( β), TWI.
, MB-OFDM Signal, Propagation Constant( β), TWI.") Through-The-Wall Propagation and Channel Modeling G. Nagaraja 1,G.Balaji 2 1 Research Scholar in Department of Electronics and Communications Engineering, Shri Venkateshwara University, Gajraula, Amorha,
Through-The-Wall Propagation and Channel Modeling G. Nagaraja 1,G.Balaji 2 1 Research Scholar in Department of Electronics and Communications Engineering, Shri Venkateshwara University, Gajraula, Amorha,
CHAPTER 6 EMI EMC MEASUREMENTS AND STANDARDS FOR TRACKED VEHICLES (MIL APPLICATION)
") 147 CHAPTER 6 EMI EMC MEASUREMENTS AND STANDARDS FOR TRACKED VEHICLES (MIL APPLICATION) 6.1 INTRODUCTION The electrical and electronic devices, circuits and systems are capable of emitting the electromagnetic
147 CHAPTER 6 EMI EMC MEASUREMENTS AND STANDARDS FOR TRACKED VEHICLES (MIL APPLICATION) 6.1 INTRODUCTION The electrical and electronic devices, circuits and systems are capable of emitting the electromagnetic
You will need the following pieces of equipment to complete this experiment: Wilkinson power divider (3-port board with oval-shaped trace on it)
") UNIVERSITY OF TORONTO FACULTY OF APPLIED SCIENCE AND ENGINEERING The Edward S. Rogers Sr. Department of Electrical and Computer Engineering ECE422H1S: RADIO AND MICROWAVE WIRELESS SYSTEMS EXPERIMENT 1:
UNIVERSITY OF TORONTO FACULTY OF APPLIED SCIENCE AND ENGINEERING The Edward S. Rogers Sr. Department of Electrical and Computer Engineering ECE422H1S: RADIO AND MICROWAVE WIRELESS SYSTEMS EXPERIMENT 1:
University Tunku Abdul Rahman LABORATORY REPORT 1
 University Tunku Abdul Rahman FACULTY OF ENGINEERING AND GREEN TECHNOLOGY UGEA2523 COMMUNICATION SYSTEMS LABORATORY REPORT 1 Signal Transmission & Distortion Student Name Student ID 1. Low Hui Tyen 14AGB06230
UWB SHORT RANGE IMAGING
 ICONIC 2007 St. Louis, MO, USA June 27-29, 2007 UWB SHORT RANGE IMAGING A. Papió, J.M. Jornet, P. Ceballos, J. Romeu, S. Blanch, A. Cardama, L. Jofre Department of Signal Theory and Communications (TSC)
Exercise 1-4. The Radar Equation EXERCISE OBJECTIVE DISCUSSION OUTLINE DISCUSSION OF FUNDAMENTALS
 Exercise 1-4 The Radar Equation EXERCISE OBJECTIVE When you have completed this exercise, you will be familiar with the different parameters in the radar equation, and with the interaction between these
Test Protocol for the Rolling Density Meter
 Test Protocol for the Rolling Density Meter October 2017 Prepared by: Ryan Conway Kyle Hoegh Lev Khazanovich i Contents Section Page Definitions... iii 1.0 Introduction... 1 2.0 Preparation and Equipment