IRSoft PC-Software. Instruction manual
|
|
|
- Leonard Gibbs
- 6 years ago
- Views:
Transcription

1 IRSoft PC-Software Instruction manual
2 2
3 1 Contents 1 Contents 1 Contents About this document Specifications Use System requirements First steps Installing the software/driver Starting the software Product description User interface Ribbon Work space Status bar Using the software Performing program settings Modifying the work space view Image presentation Temperature unit Colour scheme Tips (tool hints) Program update Preview image Program language Report templates Selecting images Edit image properties Colours Parameter Playing/saving audio comments Creating image overlay with TwinPix Copying settings for several images Accepting settings for multiple images Batch export Evaluating images Thermal image document window Temperature scale document window Histogram document window Thermal image markers document window Real image document window Profile document window Comments document window
4 1 Contents 6.5. Creating a report Modifying the report Report Designer User interface Functions and commands Editing a report template Tips & tricks Configuring the instrument Video (only for testo 885 / 890) Establishing/disconnecting a connection Settings Capturing a video/logger sequence Playing/analysing/saving videos Archive (only for testo 885 / 890) Tips and assistance Questions and answers Index
5 2 About this document 2 About this document Use > Please read this documentation through carefully and familiarize yourself with the product before putting it to use. Pay particular attention to the safety instructions and warning advice in order to prevent injuries and damage to the products. > Keep this document to hand so that you can refer to it when necessary. > Hand this documentation on to any subsequent users of the product. Knowledge of Windows operating systems is required when working with the software. Symbols and writing standards Representation Explanation Note: Basic or further information. Action: more steps, the sequence must be followed. >... Action: a step or an optional step Result of an action. Menu Elements of the program interface. [OK] Buttons of the program interface Functions/paths within a menu.... Example entries 5
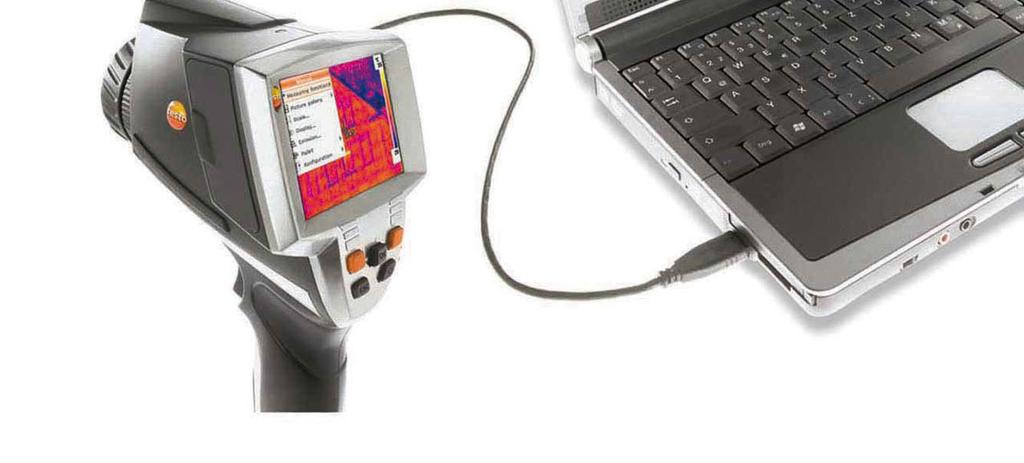
6 3 Specifications 3 Specifications 3.1. Use The IRSoft software is used for the analysis, processing and archiving of the images recorded by a testo thermal imager. It also has integrated reporting for the clear presentation of the data. The settings can be performed on the connected thermal imager via the instrument control System requirements Operating system The software can be run on the following operating systems: Windows 7 Service Pack 1(32 bit / 64 bit) Windows 8 (32 bit / 64 bit) Windows 10 (32 bit / 64 bit) Computer The computer must meet the requirements of the corresponding operating system. The following requirements must additionally be fulfilled:: Interface USB 2.0 or higher Internet Explorer 6.0 or higher When used in conjunction with testo 882, testo 885 and testo 890: Intel Core i3-2310m 2.1 GHz, Intel Pentium Dual Core E GHz 2.4 GHz or AMD Athlon 64 X GB RAM 3 GB available hard drive capacity DirectX 9c graphics device For computers with Windows 7 operating system: WDDM 1.0 driver Information/special requirements for the video function: Windows 7 ServicePack 1 (32 bit/64 bit) No remote desktop support No terminal server 6
7 3 Specifications Hardware device (HAL) required. This is missing in some virtual environments, we recommend VMWare Workstation >Version 6. Only WDDM drivers are supported. The use of XDDM drivers may work but is not recommended, as it leads to performance losses. Due to the large amounts of data, we recommend using an internal hard drive or a serial ATA BUS to capture videos. Processes running in parallel may have a considerable impact on the speed when showing and capturing videos. We recommend closing any programs that are not required. The maximum video stream frequency is 25 Hz. Depending on the system environment, the achievable value may be lower. To achieve the highest possible video stream frequency, we recommend: Using Windows 7 SP1 64 bit. Using a dedicated graphics card with a separate local memory. Capturing without analysis tools, which can be added during later evaluation. 7
8 4 First steps 4 First steps 4.1. Installing the software/driver Administrator rights are required for installation. 1. Insert the program CD in the CD-ROM drive of the computer. If the installation program does not start automatically: > Open My Computer, select the CD drive and start the Setup.exe file. 2. Follow the instructions of the installation wizard. 3. To finish the software installation, click on [Finish]. After completion of the software installation, the instrument must be connected to the PC to continue with the driver installation. 4. Switch on the instrument: [ ]. 5. Connect the instrument to the PC using the USB cable. - The connection is established. - The driver installation is performed automatically. In some cases, the instrument driver may not be automatically recognized. In this case, continue as follows: - The Found New Hardware window is opened. 1. Click on Locate and install driver software and then on [Continue]. If the driver is not automatically found: > Click on Browse my computer for driver software and then click on [Browse]. Enter the driver path in the CD directory: Driver folder: - The Windows Security window opens: 2. Click on Install this driver software anyway. 3. Click on [Close]. 8
9 4 First steps 4.2. Starting the software Start IRSoft The user interface of the software is opened in the language of the operating system if this is supported. If the operating system language is not supported, the user interface is in English. > Click on (All) Programs Testo IRSoft. Establishing a connection with the instrument 1. Press the [ ] button to switch on the instrument. 2. Connect the instrument to the PC using the USB cable. - The connection is established. - The instrument switches into slave mode, where all control keys of the instrument are deactivated except the [ ] button. - The instrument is identified by the PC as a USB memory device. The operating system automatically assigns the memory of the instrument (SD card) a drive letter. This is displayed in Windows Explorer. Using the Import Wizard The Import Wizard supports you when transferring images from the thermal imager to the PC. Only.bmt and.bmp files and folder structures are transferred. 1. Click on [Continue]. 2. Highlight the folders or images to be transferred. When a folder is marked, all subfolders are automatically included. 3. Click on [Continue]. 4. Select the location you want to save them to: In the archive (only for images from imagers that support site recognition, e.g. testo 885 / 890) In the file system (target directory must be specified). > If required, activate the optional functions Set target directory as default and Delete data in the device after copying. 9
10 4 First steps 5. Click on [Continue]. - When importing to the file system: In the selected target directory, a folder is created with the date of the data transfer to prevent the overwriting of previous folders with the same designation. The folders and the images are saved in this directory. - When adding to the archive: the images are inserted into the archive structure. Existing images are not overwritten. 6. Click on [Finish]. - The Import Wizard is closed. Activating/deactivating the Import Wizard > In IRSoft click on the Imager tab and carry out the desired change in the Import Wizard group. 10

11 5 Product description 5 Product description 5.1. User interface 5.2. Ribbon 1 Ribbon 2 Work space 3 Status bar Explanations of the individual areas: see below. The ribbon helps you to carry out modifications and settings and to find the relevant functions and commands quickly. The functions are divided into different groups on four tabs: Analysis, Report, Imager and Settings. The functions/commands vary depending on the tab selected. The tab Analysis contains function/commands for: Opening and saving infrared images Close multiple/all images Setting and copying image properties Playing/saving audio comments Creating image overlays (IR image - real image) Copying image settings If no IR image is opened, only the function for opening IR images is displayed. The tab Report contains function/commands for: 11
 The tab Settings contains")
12 5 Product description Creating reports Editing reports The tab Imager contains function/commands for: Configuring the thermal imager Activating/deactivating the Import Wizard The Video tab includes functions/commands for: Capturing and analysing videos The Archive tab includes functions/commands for: Archiving images (for cameras with the site recognition function) The tab Settings contains function/commands for: Setting the work space view Setting the infrared image presentation Setting the temperature unit Setting the user interface view (colour scheme) Activating/deactivating the tips Activating/deactivating the automatic program updates Setting the image preview (IR image/real image) Creating user-generated report templates 5.3. Work space Information is shown and editing performed in the work space. The work space display varies depending on the page layout selected. The work space is divided into different document windows: 1 Thermal image (see Thermal image document window, page 25) 2 Temperature scale (see Temperature scale document window, page 30) 3 Histogram (see Histogram document window, page 33) 12
13 5 Product description 4 Thermal image markings (see Thermal image markers document window, page 34) 5 Real image (see Real image document window, page 36) 6 Profile (see Profile document window, page 38) 7 Comments (see Comments document window, page 39) 5.4. Status bar Depending on the work space view selected and the size of the screen, not all document windows are visible. If necessary, use the scroll bars. The work spaces on the Video and Archive tabs are set up differently. Refer to the description in the relevant sections. Information on the open image is shown in the status bar: Audio comments exist (possible to play by clicking on the symbol)/do not exist, imager type, number of pixels, image type (only in the case of SuperResolution and panoramic images), recording date, min./max./mean value. It is possible to change the work space view via (tabs) and (overlapping windows). 13
14 6 Using the software 6.1. Performing program settings Program settings can be performed on the Settings tab Modifying the work space view Tabbed windows/overlapping windows The work space view can be modified in the Settings tab. 1. In the ribbon, click on the Settings tab. 2. Modify the work space view in the Work space view group. > For quick changes to the work space view: Click on (tabs) or (overlapping windows) in the status bar. Tab groups Arranging the tabs into groups makes it easier to compare several IR images. Prerequisites: At least 2 IR images are open. The Tabbed windows work space view is open, see above. 1. Right-click on the tab of an infrared image that you wish to compare with another infrared image. - A context menu is opened. 2. From the context menu, select the option New Horizontal / New Vertical Tab Group. - The infrared image can be compared with the other infrared image. You can arrange images that are already open under one another or next to one another. The user-defined settings for the desktop view are saved and available once again during a restart Image presentation The image presentation can be optimized: Image smoothing: the image presentation is optimized by means of an algorithm. Radial distortion correction (not available for images from testo 870, testo 880, testo 885, testo 890): compensates for the optical distortion in images made with wide-angle lenses. 14
15 Display temperature values: temperature values for the set measuring tools (e.g. measuring point, average, hot & cold spot) are displayed in the thermal image. 1. Click on the Settings tab. 2. Activate/deactivate the desired function under the Image presentation group Temperature unit The display of temperature values can be changed between the units C and F. 1. Click on the Settings tab. 2. Select the desired option in the Temperature unit group Colour scheme The colour scheme of the software interface can be set. 1. Click on the Settings tab. 2. Select the desired option in the Colour scheme group Tips (tool hints) All of the functions and commands available in this software are described in more detail in tips (tool hints) in IRSoft. > Move the mouse pointer over the functions/command in IRSoft. - Tips (tool hints) are displayed. Activate/deactivate tips (tool hints): 1. Click on the Settings tab. 2. In the group Tips select the option Display/Hide Program update The software can automatically search for program updates. An Internet connection is required for this. If there is an update, you will be informed. 1. Click on the Settings tab. 2. Under the Program update group, activate/deactivate the Autom. check function. 15
16 Preview image Instead of the thermal image, the attached real image (if available) can be used for the Explorer preview. 1. Click on the Settings tab. 2. Enable/disable the Real image preview function under the Settings group. Following the switch-over, sometimes the Windows Explorer still displays the old preview images, since images were saved in the background. Remove old preview images: 1. Click on the Windows Start icon. 2. In the field Search programs/files, type the command "Disk Cleanup". - The Disk Cleanup program is displayed under Programs. 3. Click on Disk Cleanup. - Search starts. - If there are multiple storage media on the PC, the drive containing the old preview images must be selected in the Drive dialogue box by clicking on it with the mouse. 4. Press OK. - The program scans the disks for files that can be deleted. 5. In the dialogue box, select the program file Thumbnail views by clicking on it with the mouse (place a ). 6. Press OK. > Click on Delete files. - The old preview images are removed from the drive Program language The program interface language can be changed. 1. Click on the Settings tab. 2. Click on and select the desired language from the drop-down list. 3. Confirm the advisory message with [OK] and restart the software Report templates User-specific report templates can be created, see Report Designer, page
17 6.2. Selecting images During the image selection of IRSoft, the following images are shown: Infrared images without attached real image (IR). Infrared images with attached real imageiv). Real images alone (VI) are not displayed. > Please use Windows Explorer for access to the real images. Opening infrared images The number of images that can be opened in parallel is limited depending on their size (pixel count): 160x120: approx. 52 images 320x240: approx. 50 images 640x480: approx. 36 images 1280x960: approx. 20 images 1712x1214: approx. 9 images In the report wizard menu, more stored images can be opened than the above-mentioned quantity of images for opening in parallel, depending on their size. To do this, first close all images in IRSoft and then open the report wizard menu, see Create report, section To open infrared images: > In the ribbon, click on the testo logo and select Open or > Click on the Analysis tab and select Open. > If the Windows dialogue with the infrared images does not open: navigate to the directory with the infrared images. > If you wish to display preview images: In the Windows dialogue Menu View select Thumb view. 2. Highlight one or several infrared images. > If you wish to highlight several images: Hold down the Ctrlkey and click on the images. 3. Click on [Open]. - The selected infrared image will be displayed in the Thermal image document window. - If you have opened an infrared image with an attached real image: the real image will be displayed in the Real image document window. 17
18 - If several images were highlighted: Depending on the work space view selected, the rest of the infrared images will be displayed in individual tabs or in individual windows. To open images stored in the Archive, see Archive (only for testo 885 / 890), page 53. Alternatively, you can also select an infrared image when IRSoft is not open. In this case, multiple infrared images cannot be selected. 1. Open Windows Explorer and navigate to the directory where the infrared images are located. 2. Double-click on the infrared image you wish to open. - IRSoft starts automatically and the selected infrared image will be displayed in the Thermal image document window. Importing real images See Real image document window page 36. see Archive (only for testo 885 / 890), page Edit image properties Image properties can be edited in the Analysis tab. Changes to the image properties will only be accepted for the currently selected infrared image in the Thermal image document window. To transfer image properties to other open infrared images, see Accepting settings for multiple images page 24. Changes in the Parameter group can affect the measurement result. The functions in the Colours group are for editing the visual presentation of the thermal image and have no influence on the measurement results. 1. In the ribbon, click on the Analysis tab. 2. Edit the infrared image properties with the functions and commands in the ribbon. - If changes have been made but not yet saved, appears after the file name. 18
19 Colours Selecting a palette You can choose between several existing colour palettes for the infrared image. > Click on and select a colour palette from the drop-down list. When Humidity image is selected, the relative surface moisture is calculated for each pixel and the temperature image is converted to a humidity image. The ambient temperature and humidity parameters are calculated, together with the measured surface temperature. With an IR image saved as a humidity image in the thermal imager, the parameters entered in the imager are saved with the image. With an IR image saved as a temperature image in the thermal imager, the parameters must be entered later on. If this is not done, the image appears completely green. The humidity image shows which areas are at risk of mould: Colour Surface moisture Assessment green 0 64%RH noncritical yellow/orange 65 80%RH red >80%RH critical potentially critical Selecting colour temperature measuring points, profiles and histograms > Click on Colour temperature measuring points, profile and histogram and select a colour. Selecting colour for temperature correction Changes the marker colour with the temperature correction in the Thermal image document window. > Click on Colour region markers and select a colour for infrared image area markers. Select colour for coldspots/hotspots > Click on Colour coldspot / Colour hotspot and select a colour. 19
20 Parameter The settings from the recording of the thermal image can be corrected. Changes to the settings influence the measurement result. The settings should therefore only be changed with the utmost caution. Function Set Emissivity, Reflected temperature, Intensity, Humidity 1, Ambient temperature 1 Inside temperature Fehler! Textmarke nicht definiert. Outside Fehler! Textmarke temperature nicht definiert. Procedure > Click on the number and change it by means of input via the keyboard or via. You can find more information on the individual properties in the instruction manual of the thermal imager. Dewpoint ScaleAssist Current (A), Voltage (V), Power (W) Discard changes Dewpoint temperature: The value is calculated from the humidity and the ambient temperature and cannot be changed manually. The scale limits are automatically adjusted to the calculated ScaleAssist min./max. values. > Click on the number and change it by inputting via the keyboard or via. You can find more information on the individual properties in the instruction manual of the thermal imager. > If you wish to reset the changes back to the most recently saved parameters: Click on Discard changes. 1 The humidity, ambient temperature, inside and outside temperature are transmitted by the thermal imager and can be changed in IRSoft. When shown as a humidity image: correct values must be entered to calculate the relative surface moisture. When shown as a temperature image: the values are for information purposes only. 20
21 Playing/saving audio comments The function is only available if an audio comment is attached to the thermal image currently selected (see status bar). It is not possible to record, change or delete audio comments. > Click on the control key symbols to control the audio functions: (Rewind), (Play), (Pause), (Stop), (Fastforward). > Click on to save the audio file in the file format MP3 or Wave Creating image overlay with TwinPix An image overlay can be created using the IR image and the attached real image 2 (taken with the thermal imager) or the imported real image (taken with a separate imager) (see Real image document window page 36). Both images can be shown together in one image. The images are aligned by setting marking points. The image overlay simplifies the orientation in the image, whereby the localization of certain measurement points is made easier, for example. 1. Click on TwinPix. - The Wizard for TwinPix is opened. - The First steps tab contains a description of the image overlay function. This tab can be hidden: Do not show this page again. 2. Click on the Image markings tab. 3. Set marking points in the IR image and the real image. Note the following while doing this: Set the marking points at the same position in both images: Use distinctive spots. The zoomed image sections with the cursor position displayed below the images help with precise positioning. Distribute the marking points throughout the image. Set additional marking points in the image area that is of particular importance (if possible). The marking points must be set in the same order in both images. At least four marking points must be set. 2 The real-image lens and IR lens have a different slant due to the special separation. This means that the image areas do not correspond exactly (parallax error). 21
22 The points are numbered automatically. To move a marking point: > Move marking point with mouse button pressed. To delete a marking point: > Select the point in the list below the image and click on [Delete]. - The point is deleted. The corresponding point with the same number in the other image is also deleted. 4. Click on [Continue]. - The image overlay is displayed. - If the result is unsatisfactory: Return to the Image markings tab and optimize the marking points (moving, supplementing with additional points) The following functions are available to adjust the image overlay: Setting transparency level The Transparency level regulates the proportion of the infrared or the real image in the overlay. The IR readings can even be read off with the setting 100 % real image (no IR image visible). > Click on the controller. Hold the mouse button down and move the controller. Setting infrared limit values The observation area of the image overlay can be limited with the infrared limit values. Only values above an upper limit value or values below a lower limit value are shown as infrared image information. Only the real image is shown in the irrelevant temperature range. Function With activated infrared limit values, setting the transparency level to 100 % infrared is recommended. The relevant temperature ranges are thereby most clearly visible. Activate Use upper limit value or Use lower limit value Set Upper/lower limit value (only available with activated limit value) Procedure > Activate the desired limit value. > Click on the number and change it by means of input via the keyboard or via. or > Click on the controller of the lower/upper limit value. Hold the mouse button down and move the controller. 22
23 Setting infrared range The observation area of the image overlay can be limited with the infrared range. Only values between the two range limits are shown as infrared image information. Only the real image is shown in the irrelevant temperature range. Function With an activated infrared range, setting the transparency level to 100 % infrared is recommended. The relevant temperature range is thereby most clearly visible. Activate Use infrared range Set Upper/lower area limit value (only available with activated infrared range) Procedure > Activate the alarm range. > Click on the number and change it by means of input via the keyboard or via. or > Click on the controller of the lower/upper range limit value. Hold the mouse button down and move the controller. 5. Click on [Finish]. - Assistant will be closed. The image overlay is applied in the Thermal image document window. All analysis functions can be applied on the image overlay, see Evaluating images page 25. The overlaid image is shown instead of the IR image during reporting. > To cancel image overlay, see Fehler! Verweisquelle konnte nicht gefunden werden., page Fehler! Textmarke nicht definiert Copying settings for several images Copies the image settings of the currently selected image to other images. Image settings can only be copied to images taken with an imager that has the same detector size. 1. Click on Copy actual settings. - The wizard for copying settings is opened. - The Instructions tab contains a description of the function. This tab can be hidden: Do not show this page again. 2. Click on the Destination tab. 23
24 24 3. Select an option for copying the image settings: Copy settings to all open images. Copy settings to files from disc: if this option is selected, the images you want to copy the image settings to must not be open. [Add ] opens the Windows dialogue box for opening files and the images can be added. 4. Click on [Next]. 5. Click on the desired settings to activate them ( ). 6. Click on [Next]. - The image settings are copied over. The result is displayed as a table. 7. Click on [Quitter] Accepting settings for multiple images Copies the image settings of the currently selected thermal image into all open thermal images. 1. Click on Thermal image settings. - A dialogue box with the parameters is opened. 2. Select the parameters that you wish to accept for the other infrared images and click on [OK]. - The settings are accepted for all open infrared images Batch export Multiple images can be exported all at once without needing to be opened. 1. Click on Batch export. - The assistant for the batch export opens. - The Instructions tab contains a description of the function. This tab can be hidden: Do not show this page again. 2. Click on the BMT Files tab. 3. Choose an option to select the images to be exported: Export the images that are currently open.. Export images from the file system:: [Add ] opens the Windows dialogue box for opening files and the images can be added. 4. Click on [Next]. 5. Choose an option to select the target folder: Export to source folder. Export to this folder:: [Browse...] opens the Windows dialogue box for searching for folders and the target folder can be selected.
25 6. Click on [Next]. 7. Choose an option to select the file format. 8. Click on [Next]. - The export is carried out. The result is displayed as a table. 9. Click on [Finish] Evaluating images IR images can be edited and evaluated in the individual document windows below the work space Thermal image document window The following functions are available in the Thermal image document window: Saving/exporting the infrared image Copying the infrared image to the clipboard Extract single images from a panoramic image Export an image with detector resolution from a SuperResolution image (standard imager resolution) Rotating the infrared image Specifying the readings for one pixel in an infrared image Temperature correction in an infrared image area (adjust emissivity and reflected temperature for the area) Specifying a hotspot/coldspot for an infrared image area Creating a histogram of an infrared image area Determine the average temperature of an IR image area Creating a temperature profile for a line Moving/deleting measuring points/range Carrying out data agglomeration Cancelling image overlay Saving/exporting the infrared image When exporting infrared images in BMP, JPG and PNG format only the image data is exported, no readings. If you wish to create a temperature table for the infrared image, the infrared image must be saved in XLS/XLSX format (Excel). 1. Click on Save thermal image. - The Windows dialogue for saving files is opened. 25
26 26 2. Enter a file name. > If you wish to export the temperature values of the infrared image: Select the XLS file format. > If you wish to export the image data of the infrared image: Select file format BMP, JPG or PNG. 3. Select a storage location and click on [Save]. Copying an infrared image to the clipboard When you copy the IR image to the clipboard, an IR image file and also the temperature value of each individual pixel of the thermal image can be pasted into other programs. 1. Click on Copy to clipboard. 2. To paste an image file/text file into Excel, Powerpoint or Word: 1. Open the required program. 2. In the toolbar of the program, click on the Start tab. 3. Select the Insert menu. 4. From the shortcut menu, select the option Insert content... Insert image file/text file into Libre/OpenOffice Calc, Impress or Writer: 1. Open the program. 2. In the toolbar of the program, click on the Edit tab. 3. Select the Insert content... menu. 4. Select Bitmap from the opened menu. 5. Click on [OK]. > If you want to insert an IR image file: select the Bitmap option and click on [OK]. > If you wish to insert the temperature of each individual pixel of the IR image: select the Text option and click on [OK]. Extract single images from a panoramic image Extracts one or several single images from a panoramic image. The function is only available if the currently selected image was taken as a panoramic image (see imager instruction manual). 1. Click on Extract single image out of panorama. - The panorama export wizard is opened. - The Instructions tab contains a description of the function. This tab can be hidden: Do not show this page again. 2. Click on the Images tab. 3. Select the single images to be extracted ( ). 4. Click on [Next].
27 5. Perform the required settings (file format, file name, save location). 6. Click on [Next]. - Image extraction is carried out. The result is displayed as a table. 7. Click on [Finish]. Exporting an IR image with detector resolution from a SuperResolution image An image in standard imager resolution (detector resolution) can be exported from an IR image taken with SuperResolution. The function is only available if the currently selected image was taken with SuperResolution (see imager instruction manual). 1. Click on Export with detector resolution. - Windows dialogue box for saving files is opened. 2. Enter a file name. The file type (.bmt) must be retained! 3. Select the location you want to save it to and click on [Save]. The function is only available if a TwinPix was created for the currently selected image. Rotating the infrared image > Click on Rotate left or Rotate right. Specifying the readings for one pixel in an infrared image For specifying the temperature, the emissivity and the reflected temperature for one pixel in an infrared image. If you wish to specify the temperature within one infrared image area (temperature correction), you should first highlight the infrared image area and then position the measuring points on it. Otherwise, the correctness of the temperature displayed for the measuring point cannot be guaranteed. 1. Click on Temperature. 2. Click on one point in the infrared image. - Temperature, emissivity and reflected temperature of the measured point set here will be displayed in the Thermal image markers document window. For further information about editing measurement results (e.g. changing emissivity), see Thermal image markers document window page
28 Correcting temperature in an infrared image area For specifying emissivity and a reflected temperature within an infrared image area. Infrared images areas with temperature corrections should not overlap each other because only one emissivity and one reflected temperature is correct per pixel. However, if two infrared image areas do overlap, the parameters (emissivity and reflected temperature) of the most recently entered infrared image area will be used to specify the temperature. 1. Click on Temperature correction. 2. Select a marking form from the drop-down menu (rectangle, circle, ellipse, free form shape) 3. Drag the mouse with the mouse button pressed to highlight an infrared image area in the thermal image. - The measurement results of the selected infrared image area will be displayed in the Thermal image markers document window. For further information about editing measurement results see Thermal image markers document window page 34. Specifying a hotspot/coldspot For specifying the hottest/coldest point within an infrared image area. 1. Click on Coldspot / Hotspot. 2. Select a marking form from the drop-down menu (rectangle, circle, ellipse, free form shape) 3. Drag the mouse with the mouse button pressed to highlight an infrared image area in the thermal image. - The hotspot/coldspot of the selected infrared image area will be displayed in the Thermal image markers document window. Determining the average temperature To determine the average temperature within an IR image area. 1. Click on Average 2. Select a marker from the drop-down menu (rectangle, circle, ellipse, freehand tool) 3. With the mouse button pressed down, drag the mouse to highlight an IR image area in the thermal image. - The average temperature of the selected IR image area is displayed in the Thermal image markers document window. 28
29 Creating a histogram For displaying the frequency of a temperature within an infrared image area. 1. Click on Histogram. 2. Select a marking form from the drop-down menu (rectangle, circle, ellipse, free form shape) 3. Drag the mouse with the mouse button pressed to highlight an infrared image area in the thermal image. - The temperature distribution in the selected infrared image area will be displayed in the Histogram document window. Creating a new histogram deletes the existing one. For further information about editing the histogram see Histogram document window page 33. Creating a temperature profile For displaying a temperature progression over a line. 1. Click on Temperature profile. 2. Select the characteristics of the line from the drop-down menu (horizontal, vertical, diagonal) 3. Drag the mouse with the mouse button pressed to draw a line in the infrared image. - The temperature profile will be displayed in the Profile document window. Max. 5 profile lines per image can be created. For further information about editing the temperature profile see Profile document window page 38. Moving/deleting image markers in the infrared image If infrared image areas are moved, the set measurement markers should be moved along with them. If the measurement point remains in the same position or if infrared image areas are deleted, the parameters (emissivity and reflected temperature) of the measurement points must be checked. > Click on the measurement markers in the infrared image (not possible if the Temperature tool is activated) or > Click on the Marking tool and drag the mouse with the mouse button pressed to create a frame around the measurement points/range that you wish to delete/move. > If you wish to delete measurement points/ranges: Click on Delete. - The measurement markers in the infrared image are deleted. 29
30 - The measurement results will be removed from the Thermal image markers, Histogram and Profile document windows. > If you wish to move measurement markers: Hold down the mouse button and move the measuring points/range. - The measurement results will be adjusted according to the movement in the Thermal image markers, Histogram and Profile document windows. Carrying out data agglomeration The image can be divided into individual areas. Statistical data can be shown for the individual areas. > Click on Data agglomeration and then on the required agglomeration level (None, One, Two, Three, Four). > Click on Data agglomeration and then on the required information (Min, Max, Avg). Cancelling image overlay 1. Click on Undo TwinPix. - A confirmation request will follow. 2. Click on [Yes] Temperature scale document window The following functions are available in the Temperature scale document window: Setting the scale Setting the limit values Setting the isotherm area Setting the scale You can choose between automatic scaling (adjustment to the min./max. values), manual scaling and ScaleAssist. The scale limits can be set within the measuring range that is valid for the image. All temperatures that go below or exceed the min./max. value are displayed in the colour of the min./max. value (depending on the selected colour palette). Temperature ranges that are not relevant can thus be hidden. 30
31 When the Humidity image palette is selected, scale adjustments cannot be made. Function Set Min./max. values Carry out Automatic scaling ScaleAssist Procedure > Click on the number and change it by means of input via the keyboard or via. or > Click on the arrowhead of the min./max. value on the scale. Hold the mouse button down and move the arrow. > To carry out automatic scaling: Click on [ Auto]. - The scaling limit values are adjusted to the min./max. values. > To activate ScaleAssist: 1. Enter the inside and outside temperature 2. Click on ScaleAssist - The scale limits are automatically adjusted to the calculated ScaleAssist min./max. values. You will find the ScaleAssist function in the multi-function window. Setting the limit values A lower and an upper limit value can be defined. Temperatures below the lower limit value or above the upper limit value can be marked with one colour. The transparency of the limit value colours can be set. Function Activate Limit values Set Upper/lower limit value (only available with activated limit values) Procedure > Activate the limit values. > Click on the number and change it by means of input via the keyboard or via. or > Click on the arrowhead of the lower/upper limit value on the scale. Hold the mouse button down and move the arrow. 31
32 Function Select Upper/lower limit value colour (only available with activated limit values) Set Transparency (only available with activated limit values) Procedure > Click on Colour upper/lower limit value and select a colour. 1. Click on Colour upper/lower limit value. 2 Click on the number next to Transparency and change it by means of input via the keyboard or via. Setting isotherms (temperature range) A lower and an upper area limit value can be defined. Temperatures between the lower and upper area limit values are marked with one colour. Function Procedure Activate Isotherms > Activate the isotherms. Set Upper/lower area limit values (only available with activated isotherms) Select Isotherm colour (only available with activated isotherms) > Click on the number and change it by means of input via the keyboard or via. or > Click on the arrowhead of the lower/upper area limit value on the scale. Hold the mouse button down and move the arrow. > Click on Colour isotherms and select a colour. If Rainbow is selected, the isotherm is shown in a rainbow colour palette. Temperature gradings within the isotherm are thus rendered visible. If Rainbow is selected, we recommend setting the colour palette of the IR image to Greyscale. 32
33 Histogram document window The following functions are available in the Histogram document window: Saving a histogram as an image file Copying a histogram to the clipboard Choosing between absolute (number of the measurement points) and relative (percent of the measurement points) scaling: Setting the background colour for the histogram Switching grid lines in the histogram on/off Setting the number of columns over the temperature range being assessed Changes can only be seen if a histogram had already been created in the Thermal image document window for the infrared image currently open, see Determining the average temperature page 28. Function Saving a histogram as an image file Copying a histogram to the clipboard Selecting scaling Selecting background colour Procedure 1. Click on Save file. - The Windows dialogue for saving files is opened. 2. Enter a file name. 3. Select a file format (BMP, JPG, PNG). 4. Select a storage location and click on [Save]. 1. Click on Clipboard. - Image files from the histogram can be inserted in other programs (e.g. Microsoft Word). Choosing between absolute (number of the measurement points) and relative (percent of the measurement points) scaling. > Click on absolute scaling or relative scaling. > Click on Background colour and select a colour. Switching grid lines on/off > Click on Grid lines. 33
34 Function Specifying number of columns Procedure Set the number of columns over the temperature range being assessed (settings between 10 and 100 columns are possible): > Click on the number and change it by means of input via the keyboard or via Thermal image markers document window Shows the measurement results of the image markers performed in the Thermal image document window. The emissivity and the reflected temperature of the inserted image marker can be changed at the same time here as well. Additional comments can be entered for each individual image marker. The following functions are available in the Thermal image markers document window: Saving/exporting measurement results for the image markers in Excel Copying measurement results to the clipboard Deleting measurement results for the image markers Calculate the temperature difference (DeltaT) between set thermal image markers or between an input value and thermal image markers. Modifying emissivity and reflected temperature for image markers at specific points/ranges Entering comments Function Saving/exporting measurement results in Excel Procedure The measurement results for the image markers are saved in an Excel table. 1. Click on Save file. - The Windows dialogue for saving files is opened. 2. Enter a file name. 3. Select the file format XLS. 4. Select a storage location and click on [Save]. 34
35 Function Copying measurement results to the clipboard Deleting image markers DeltaT calculation Procedure The data cannot be inserted into other programs as an image file. > Click on Clipboard. - Measurement results can be inserted in other programs (e.g. Microsoft Word, Powerpoint). 1. Highlight the line to be deleted. 2. Click on Delete. 1. Click on [DeltaT] 2. Calculate the temperature difference: select the required thermal image markers or enter an input value. 3. Change the input value: click on the number and change it by inputting via the keyboard or by clicking with the mouse. 4. Confirm by clicking [OK] - Up to 10 temperature differences can be calculated. - The results are displayed in a separate table in the Thermal image markers document window. 35
36 Function Modifying emissivity and reflected temperature for image markers at specific points/ranges Entering comments Procedure Changes to the settings influence the measurement result. The settings should only be changed with the utmost caution! > In the table, click on the value (emissivity or reflected temperature) and modify it via the keyboard or. - The temperature of the measurement point adjusts to the set emissivity/reflected temperature. - Changes can be seen in the Thermal image document window. > Click in the comment field and use the keyboard to enter the text Real image document window The following functions are available in the Real image document window: Importing real images Exporting real images Copying a real image to the clipboard Inserting a real image from the clipboard Deleting a real image Rotating a real image Modifying the brightness of a real image 36
37 Change image section Insert additional image Function Procedure Importing real images 1. Click on Open. - The folder containing the real images opens. 2. Highlight a real image and click on [Open]. - The real image selected will be displayed in the Real image document window. Exporting real images 1. Click on Save file. - The Windows dialogue for saving files is opened. 2. Enter a file name. 3. Select a file format (BMP, JPG, PNG). 4. Select a storage location and click on [Save]. Copying a real image to the clipboard Inserting a real image from the clipboard > Click on Clipboard. - The real image can be inserted in other programs (e.g. Microsoft Word, Powerpoint). > Click on Clipboard Insert. - The confirmation request is opened. > If you wish to insert the real image from the clipboard: Click on [Yes]. - The real image is inserted from the clipboard. > If you wish to cancel the process: Click on [No]. Deleting a real image 1. Click on Delete. - The confirmation request is opened. 2. Click on [OK]. - The real image is deleted. Rotating a real image > Click on Rotate left or Rotate right. 37
38 Function Modifying the brightness of a real image Insert additional image Zoom in/zoom out/move real image/fit to document window Procedure 1. Click on Brightness. - The dialogue box is opened. 2. Use the scroll bar to modify the brightness of the real image. 3. Click on [OK]. 1. Click on [Additional Image] 2. Use Open file to add an additional image file to the thermal image. > Click on Zoom in (or move the mouse wheel forwards) to zoom in on the real image. > Click on Zoom out (or move the mouse wheel back) to zoom out of the real image. > Click on Fit to fit the real image to the document window. If the set image size is bigger than the document window: > Click with the mouse button on the real image and move the image while holding the button down to change the visible image section. The currently visible real image section is displayed in a report. Check how the real image looks before creating a report Profile document window Displays the temperature profiles created in the Thermal image document window. The following functions are available in the Profile document window: Saving a temperature profile as an image file Copying a temperature profile to the clipboard Selecting the presentation of the temperature profile 38
39 Changing the background colour of the temperature profile Switching grid lines on/off Function Procedure Saving a temperature profile as an image file Copying a temperature profile to the clipboard Selecting the presentation of the temperature profile Changing the background colour of the temperature profile 1. Click on Save file. - The Windows dialogue for saving files is opened. 2. Enter a file name. 3. Select a file format (BMP, JPG, PNG). 4. Select a storage location and click on [Save]. > Click on Clipboard. - Image file from the profile can be inserted in other programs (e.g. Microsoft Word). > To select filled out profile: Click on. Several profile lines are displayed in individual card tabs (P1, P2, ). > To select a line profile: Click on. Several profile lines are displayed in individual card tabs (P1, P2, ). > To select a general line profile for all profile lines: Click on. > Click on Background colour and select a colour. Switching grid lines on/off > Click on Grid lines Comments document window > Use the keyboard to enter the comments about the currently selected infrared image in the text field Creating a report You can create a report with one or more IR images. IR images that are already open can be selected, or stored IR images can be opened in the report wizard menu. The report wizard guides you through the process. There are several report templates available to you for easy reporting: 39
40 Thermal bridges in building shells in accordance with EN (comprehensive) Thermal bridges in building shells in accordance with EN (simplified test) Industry (Archiv) Industrial thermography MaxiPicture MultiPicture Short report Standard report cover picture Standard report (humidity) Standard report (solar) Standard report 1. In the ribbon, click on the Report tab. 2. Click on Report Wizard. - The Report Wizard is opened. Report tab Depending on the report template selected, the Report Wizard is divided into the following tabs: Template Image selection Company address / Logo Address / Location Job description Freetext Ambient conditions Conclusion Preview > Work through the individual tabs from left to right and note the respective tips at the bottom of the window. - The data entered appear automatically in the report. Saving a report 1. Click on the Preview tab. - A preview of the report is opened. 2. Click on Save report. - The Windows dialogue for saving files is opened. 3. Enter the file name and select a file format. 40
41 4. Select a storage location and click on [Save]. - The report will be saved in TIR file format. This will create a file with the images and the report data entered. Reports that are created with IRSoft as of version 2.4 cannot be opened with older software versions. Saving the report as a PDF or RTF 1. Click on the Preview tab. - A preview of the report is opened. 2. Click on PDF or RTF. - The Windows dialogue for saving files is opened. 3. Enter a file name, select a storage location and click on [Save]. - The report is saved as a PDF or RTF. Reports saved in RTF format are compatible with Office 2003 and higher. Printing report 1. Click on the report tab Preview. - A preview of the report is opened. 2. Click on Print. - The Windows dialogue for printing a report is opened. 3. Complete the print settings if necessary and click on [Print]. - The report is printed Modifying the report Data in a saved report can be modified. 1. In the Report tab, click on Restore saved report. - The Windows dialogue is opened. 2. Navigate to the directory where the report is stored. 3. Select a report and click on [Open]. - The Report Wizard is opened. - Report texts can be modified in the Report Wizard. > To edit images afterward: 1. Click on the Report Wizard. - The report data are displayed in the work space in individual document windows. - Report texts remain in the Report Wizard. 2. Carry out the desired image edits. 41
42 3. In the Report tab, click on Report Wizard. - The edited image is inserted in the Report Wizard. - The existing texts are displayed. 4. Save the report with the changes Report Designer With the Report Designer you can create your own report template by changing an existing template to meet your needs. There are tools available to help you design and edit the report template to your liking. The Report Designer is used exclusively for creating individualised report templates. The reports themselves are created by selecting the report template in the Report Wizard. Opening the Report Designer Requirement: at least one infrared image must be open. 1. Select the Settings tab and click on Report Designer. - The dialogue box is opened. 2. Select the report template that you would like to edit and click on [OK]. - The Report Designer is opened User interface Ribbon The ribbon helps you to carry out modifications and settings in the Report Designer and to find the relevant functions and commands quickly. The functions and commands are divided into different groups on two tabs: Report Designer and Preview. The functions/commands and the work space vary depending on the tab selected. The tab Report Designer contains function/commands for: Saving the report template Editing the report template Changing the report template view 42

43 The tab Preview contains function/commands for: Printing a report Editing and aligning the page layout Changing the report template view Work space Modifications are carried out in the work space in the Report Designer tab. It consists of the file directory tree and the open report template. The file directory tree contains prescribed fields that you can pull into the report template. When the Preview tab is selected, the work space view changes Functions and commands All of the functions/commands in the ribbon are described in more detail in tips (tool hints). > Move the mouse pointer over the functions/command in the ribbon. - Tips (tool hints) are displayed Editing a report template Overview The open report template consists of various areas. Fields can be inserted into or removed from each area. Report Header: contains fields with general information that appear once in the report template (e.g. company, instrument, 43
44 client, etc.). When the report is created later, this information appears at the beginning of the report. Page Header: contains fields with information that appears on each page in the header. Bottom Margin: contains fields with information that appears on each page in the footer. Detail: contains fields with information about the corresponding measurements (e.g. location, ambient conditions, etc.) Detail Report "Picture": contains placeholders for image and text fields with information about the infrared images (emissivity and reflected temperature, comments about the individual infrared images, histogram, temperature profile, etc.). The Detail Report "Picture" area is repeated in the report depending on the number of infrared images. Report Footer: contains fields with information that appears at the end of the report template (e.g. general comments, conclusion, date and signature, etc.) Text changes: Only carry out text changes in fields without the symbol. Dragging prescribed fields into the report template You can integrate data, images, tables and tools from the file directory tree into the report template to modify it to meet your needs. Note the report template areas into which you drag the fields. For example, image fields should only be integrated into the Detail Report "Picture" area. Because the image fields serve as placeholders, each may only be dragged once into the Detail Report "Picture" area. 1. Click on the Report Designer tab. 2. In the file directory tree, click on the desired option. 3. Hold down the mouse buttons and drag the field into the desired position in the report template. - The field is aligned to the grid. With free text fields, additional, freely selectable information can be included in reports. If a free text field is included in the report template, the Freetext tab is also shown in the report wizard. 44
45 Modifying fields Font, font size and text alignment can be changed for the fields. 1. Click on the Report Designer tab. 2. In the report template, click on the field that you wish to adjust. 3. To highlight several fields: > Hold down the Ctrl-key and click on the fields or > Drag the mouse to create a marker frame around the fields. 4. Use the editing functions in the ribbon to modify the fields. - The changes will be applied to all highlighted fields. Aligning fields Requirement: at least two fields must be highlighted. 1. Click on the Report Designer tab. 2. To highlight several fields: > Hold down the Ctrl-key and click on the fields or > Drag the mouse to create a marker frame around the fields. 3. Use the editing functions in the ribbon to align the fields. - The changes will be applied to all highlighted fields. Moving field(s) 1. Click on the Report Designer tab. 2. In the report template, click on the field(s) that you wish to move. 3. Hold down the mouse button and drag the field(s) to the desired position. - The field(s) align to the grid. Modifying field size(s) 1. Click on the Report Designer tab. 2. In the report template, click on the field(s) where you wish to adjust the size. 3. Click on one of the black contact points of the field(s) and change the size of the field(s) by dragging with the mouse button pressed. Deleting field(s) 1. Click on the Report Designer tab. 2. In the report template, click on the field(s) that you wish to delete. 45
46 3. To delete fields: > On the keyboard, press the [Del] key or > Right-click with the mouse and select Delete. Deleting a field has no effect on the size and position of other fields. Empty spaces between fields can be prevented by moving fields or changing their size. Entering text in a text field 1. Click on the Report Designer tab. 2. Double-click on a text field in the report template and enter the text via the keyboard. - Text appears as a fixed block if the report template is selected in the Report Wizard. Saving a report template 1. Click on the Report Designer tab. 2. Click on Save. - The Windows dialogue for saving files is opened. 3. Enter a file name and click on [Save]. - The report templates are saved in a folder based on the operating system and operating system language. > To find the report templates: Select the search function in Explorer and search for the *.repx file. - Report templates (file format.repx) will be displayed. Deleting a report template Note that report templates are deleted permanently. After they are deleted, report templates cannot be restored. Only "User" type report templates can be deleted. Requirement: the Report Designer must be closed. 1. In IRSoft, in the ribbon, click on the Settings tab. 2. In the ribbon, click on the Report Designer. - The dialogue box is opened. 3. Select the report template that you wish to delete. 4. Click on [Delete]. - The confirmation request is opened. > If you wish to permanently delete the report template: Click on [Yes]. > If you wish to cancel the process: Click on [No]. 46
47 Editing the page layout 1. Click on the Preview tab. 2. Use the editing functions in the ribbon to adjust the page layout Tips & tricks Creating a report template with a cover image 1. Move the PageHeader header bar far enough down to leave sufficient space for the cover image. 2. In the ReportHeader report section, select all fields from Company to Job and move these to the bottom of the report section. 3. From the PageHeader report section, copy the fields Title, Logo and the line directly below both fields into the ReportHeader report section above the Company field. 4. Above the fields inserted in the last step Insert a Page break (Tools folder). 5. Above the page break inserted in the last step insert the Cover image field (Images folder) and adjust the size of the field as needed. Creating a report with an additional real image > In the DetailReport - "Picture" report section, insert the Real image 2 field (Images folder) and adjust the size of the field as needed. Use the Real image 2 field exclusively within the DetailReport - "Picture" report section to ensure that it is assigned to the thermal image added to the report. Creating a report with a digital signature > In the ReportFooter report section, insert the Digital signature field (Images folder) directly above the signature line and adjust the size of the field as needed. Creating a report with two thermal images side by side 1. In the DetailReport - "Picture" report section, delete the Real image field. 2. In the DetailReport - "Picture" report section, click on the Detail1 header bar. - A white box with an arrow is displayed next to Detail1. 3. Click on the box. - The DetailBand advanced settings dialogue window is opened. 47
48 4. Make the following settings: Column direction: AcrossThenDown Number of columns: 2 5. Click on the box to close the dialogue window. - In the DetailReport - "Picture" report section, a grey section is displayed with the information: Space for repeated columns. Controls placed here will not print correctly. 6. Customise all fields in the DetailReport - "Picture" report section, ensuring that no fields protrude into this grey section. Creating a report with fixed textual content 1. Go to the report section that you wish to insert text into. 2. Insert the Text field field (Tools folder) at the required position and adjust the size of the field as needed. 3. Input the text into the field. Inserting a watermark 1. In the multi-function bar click on the Preview tab. 2. Click on Watermark. - The Watermark dialogue window opens. In the left half of the window you will see a preview of the subsequent settings. 3. In the text and / or picture tab make the required settings with regard to the content, layout and size of the watermark. 4. Under Position, select whether it should be printed behind or in front of the report content. 5. Under Page Range, select the pages on which the watermark is to be inserted Configuring the instrument The configuration makes it possible to perform settings on the thermal imager using IRSoft. In both tabs Picture settings and Instrument settings, all settings can be performed that can also be performed using the instrument menu of the thermal imager. For this, please also observe the instruction manual for the thermal imager. A user-defined material list from specified materials (including the associated emissivity) can also be copied over to the imager. Additional functions can be activated in the imager by entering an activation code, e.g. SuperResolution (not for testo 880) and full radiometric video measurement (only for testo and testo 890-2). 48
49 Requirement: Thermal imager is connected to the PC Thermal imager is switched on and recognised by the PC 1. In the ribbon, click on the Imager tab. 2. Click on Configuration. - The Characteristics of Testo Thermal Imager dialogue window is opened. 3. Choose between image and instrument settings. 4. Complete the settings (see Picture settings page 49 and Instrument settings page 50). > If you wish to transfer the settings to the thermal imager: Click on [Apply]. > If you wish to discard the settings: Click on [Cancel]. 5. Click on [OK]. - The dialogue window is closed. Picture settings Function availability depends on the model of the connected imager. Function Settings Selecting the Choose between automatic scaling, temperature scale ScaleAssist and manual scaling: > Select the desired option. > With the selection of manual: Enter the min. and max. value. Setting the palette, temperature unit, LCD brightness, measuring range Select required settings: > Click on and select the desired value from the drop-down list. 49
50 Function Transferring materials Settings Transfer the desired materials with the corresponding emissivity to the thermal imager or IRSoft: The language of the materials to be chosen from depends on the language of the operating system. The language of the materials present in the thermal imager depends on the setting of the instrument language during commissioning. It is therefore possible that materials are displayed in different languages. Emissivity settings 1. Click on the materials in the Materials in thermal imager list that are not required and remove these by clicking on. 2. Click on the required materials in the For selection of stationary materials list and copy these by clicking on in the thermal imager. A maximum of 8 materials can be saved in the thermal imager. Activate desired material: > Click on and select the desired material from the drop-down list. > With the selection of User-defined: Enter the value of the emissivity. Instrument settings Function availability depends on the model of the connected imager. Function Settings Setting Language Activate the desired language: > Click on and select the desired language from the drop-down list. Switching the Power save function on/off Select the desired setting (Switch off imager or Switch off LCD): > Click on and select the desired function from the drop-down list. 50
51 Function Automatically hide (function keys, cursor, scale) Carrying out factory reset Synchronizing with PC clock Firmware Update Activation code entry Settings Activate the desired function: > Click on the desired functions to activate them ( ). Carry out a factory reset: 1. Click on [Factory reset]. - A confirmation request will follow. 2. Click on [Yes]. Synchronize the date and time of the instrument with the PC: > Click on [Synchronize with PC clock]. The imager software (firmware) can be updated. Current firmware data can be downloaded from 1. Click on Firmware Update. - The Windows dialogue box for opening files appears. 2. Select the update file and click on [Open]. Activate additional functions in the imager: > Enter the activation code and click on [Confirm] Video (only for testo 885 / 890) With the video function, the thermal image from the imager can be displayed live on the PC and recorded. With the testo and testo 890-2, it is possible to carry out full radiometric video measurement and capture a logger sequence (optional instrument function). > Select the Video tab. 51

52 Work space 52 1 Video stream 2 Image marks 3 Profile The size of an area can be adjusted by clicking and dragging the area border. Display information on the video file > Click on Info to open the dialogue window Establishing/disconnecting a connection The connection to the imager can be established and disconnected again. > Click on Connect to establish a connection to the imager - The image is displayed in the software. > Click on Disconnect to disconnect the connection Settings Camera settings can be carried out using the software. Initiating auto-focus This function is only available if auto-focus was enabled in the camera before a connection was established. > Click on Autofocus. Initiating the shutter manually > Click on Shutter.
53 Enabling/disabling the automatic shutter function In the case of stable environmental conditions and set-ups that do not heat up the sensor/camera, the automatic shutter function can be disabled to avoid interruptions in the video. Deviations in accuracy and image quality are negligible in a period of up to 60 minutes. The disabled status remains even after the camera has been disconnected from the PC. Re-enabling can be carried out by re-starting the camera. > Click on Automatic Shutter. If Automatic Shutter has an orange background, the function has been enabled. Changing the colour palette The palette setting remains in the camera even after the camera has been disconnected from the PC. > Click on and select the required palette from the drop-down list Capturing a video/logger sequence Start Wizard for capture settings and select Capturing mode 1. Click on Capture Settings. - The Wizard for capture settings is opened. - The First steps tab includes a description of the capture functions. This tab can be hidden: Do not show this page again. 2. Click on the Capturing mode tab. 3. Select the required capturing mode: Capturing of a video: capturing a video sequence. Capturing a logger sequence (only testo and testo with option of full radiometric video measurement): capturing a sequence of individual images with a defined start, duration and interval. Capturing of a video: settings The folder, file name, file format and maximum size or length of the video can be set. 4. Click on the Settings tab. 5. File: click on [Browse ] and enter the parameters/settings: 53
54 The videos can be saved in various formats: MPEG file (only for cameras with 33 Hz)/WMV file (compressed or uncompressed): video file in which pure image data is saved but no measuring values (temperature or humidity values). Existing image marks (measuring points and profile lines) are also saved as image data and cannot be subsequently changed or deleted. If an image mark has been set, when video capturing is carried out, the capturing of the measuring value diagram is started automatically, but there is no automatic saving. Saving measuring value diagrams as an image or exporting them as an Excel file must be done after video capturing manually via the relevant buttons, separately for each measuring value diagram. VMT files (full radiometric video, only testo and testo with option of full radiometric video measurement): Video file in which image data, measuring values and image marks are saved. Saved files can be played back in testo IRSoft and subsequently analysed by adding or changing image marks. The number of individual files captured (frames) per second corresponds to the video frequency of the camera, provided the system environment supports this frequency (see system requirements), but max. 25 Hz. > Select folder and enter file name. > Select the file format and click on [Save]. 6. Stop capturing after : select MB (limit according to file size in megabytes, max MB) or sec (limit according to duration in seconds, max s, corresponds to 24 h) and enter the required size or duration for the video. Capturing of a logging sequence: settings Start criterion, capturing interval and file name/file format can be set. 4. Start tab: select a start criterion and enter the parameters: Immediately: capturing starts when you click on Start Capture. Limit value over/undershooting: capturing starts during the first over or undershooting of the set temperature after clicking on Start Capture. 54
55 Timed: capturing starts after expiry of the entered duration (max. 24 h 00 min, min. 0 h 1 min) after clicking on Start Capture. 5. Interval tab: enter the number of images to be saved and the capturing interval (min. 3 s). 6. File tab: select a file format and enter the parameters/settings: The logger sequences can be saved in various formats: BMT files: sequence of individual image files (thermal images). Image marks (measuring points and profile lines) are also saved as image data and cannot be subsequently changed or deleted. If an image mark has been set, when sequence capturing is carried out, the capturing of the measuring value diagram is started automatically, but there is no automatic saving. Saving measuring value diagrams as an image or exporting them as an Excel file must be done after image sequence capturing manually via the relevant buttons, separately for each measuring value diagram. The individual thermal images of the sequence can be displayed under the Analyze tab and analysed. VMT files (full radiometric video, only testo and testo with option of full radiometric video measurement): Video file in which image data, measuring values and image marks are saved. Saved files can be played back in testo IRSoft and subsequently analysed by adding or changing image marks. The playback speed (frames per second) corresponds to the video frequency of the camera, if the system environment supports this frequency (see system requirements), but max. 25 Hz. > VMT: click on [Browse ], select folder and file name and click on [Save]. > BMT: click on [Browse ], select the folder and click on [OK]. Enter prefix for the file name. Saving capture settings 7. Click on the Summary tab. 8. Check the settings and click on [Finish]. 55
56 Starting/ending capture The video is saved under the file name and location selected in the capture settings. - The capture settings have been carried out. > Click on Start Capture. - Capture is started. - The diagrams of the set measuring points/profile lines are captured after the start of the capture with the video. This enables diagram data that corresponds time-wise to the captured video to be saved. > End capture manually: click on Stop Capture. - If capture is not ended manually, it ends automatically according to the set capture criteria Playing/analysing/saving videos Saved VMT files can be played in testo IRSoft and analysed using the image marks. It is not possible to play saved MPEG/WMV- files in testo IRSoft. For this, use separate software (e.g. Windows Mediaplayer (recommended) or VLC Player). Opening a video file 1. Click on Open. 2. Select a video file and click on [Open]. Playing a video file In logger sequence capturing mode, video playback is not carried out in real time but in time lapse (with the image refresh rate of the camera). The time stamp of the individual images (frames) corresponds to actual time during capture. > Start playback: Play. > Pause playback: Pause. > Go back to the start: To beginning. > Display a specific frame (individual image): enter number under Frame and click on Go to or select frame with. 56
57 Analysing and re-saving saved videos The analysis functions (see below) can also be applied to saved VMT files. The files can then be saved with the new/changed analysis data. 1. Click on Save as. - Windows dialogue box for saving files is opened. 2. Enter a file name, select a file format and click on [Save]. 3. Click on [OK]. Switching back to capturing mode > Click on Connect to re-establish a connection to the camera Determining measurement values at an IR image point To determine the temperature at an IR image point. 1. Click on. - A measuring point is inserted into the image. - The current temperature and coordinates of the image point are displayed on the right next to the image. - The measurement value characteristic curve of the image point is displayed in a measurement value chart below the image. Creating a temperature profile To display a temperature curve via a line. 1. Click on. - A profile line is inserted into the image. - The min./max./average temperature and coordinates of the profile line end points are displayed on the right next to the image. - The current temperature curve of the measuring points on the profile line is displayed in a measurement value chart below the image. Deleting/moving image marks on the IR image > Click on the measurement mark on the IR image. - The mark is highlighted red. > If you want to delete the measuring point: click on Delete. > If you want to move the measuring point: hold down the mouse button and move the measuring point. 57
58 Producing a snapshot One frame of the video stream can be captured and exported as a thermal image including image marks. No real image is attached to the thermal image. 1. Click on. - Windows dialogue box for saving files is opened. 2. Enter a file name. 3. Select a folder and click on [Save]. Coldspot / Hotspot anzeigen 1. Klicken Sie auf bzw.. - Coldspot bzw. Hotspot werden angezeigt. Saving a measurement value chart as an image Measurement value charts can be saved as an image. Only image data is saved - no measurement values. 1. Select the relevant tab of the measuring point or the profile line and click on. - Windows dialogue box for saving files appears. 2. Enter a file name. 3. Select the location you want to save it to and click on [Save]. Exporting measuring values from a measuring value diagram as an Excel file 1. Select the relevant tab of the measuring point or the profile line and click on. - Windows dialogue box for saving files appears. 2. Enter a file name. 3. Select the location you want to save it to and click on [Save]. Re-starting diagram capturing > Click on to re-start the capturing of the measuring value diagram. Show grid lines in the measuring value diagram > Click on to show the grid lines. 58
.")
59 6.10. Archive (only for testo 885 / 890) The archive function manages images captured with an imager that supports site recognition. In the archive, measurement sites can be created and are then automatically assigned an identification number (ID). This ID can be transferred to the imager, and ID markers can be printed out and affixed to the measurement site. When carrying out a measurement on site, by setting a marker with the built-in digital imager, the images, which are then saved, are automatically allocated to the relevant measurement object (allocation is saved in this image). When transferring images to the PC, please use the import assistant and select the Add to archive option. The images are then saved automatically in the archive under the correct measurement object. Work space 1 Archive tree 2 Information area The size of an area can be adjusted by clicking and dragging the area border. Opening an image from the archive > In the archive tree, double-click on the image you want to open. Adding a project/folder/measurement object To structure the archive data, projects can be created in the archive for which details in the form of address data can be saved. For further grouping, folders can be created within the projects (up to 3 folder levels are possible). Measurement objects can be created directly in a project or in folders. 59
1. What is SENSE Batch
 1. What is SENSE Batch 1.1. Introduction SENSE Batch is processing software for thermal images and sequences. It is a modern software which automates repetitive tasks with thermal images. The most important
Comprehensive analysis of thermal images.
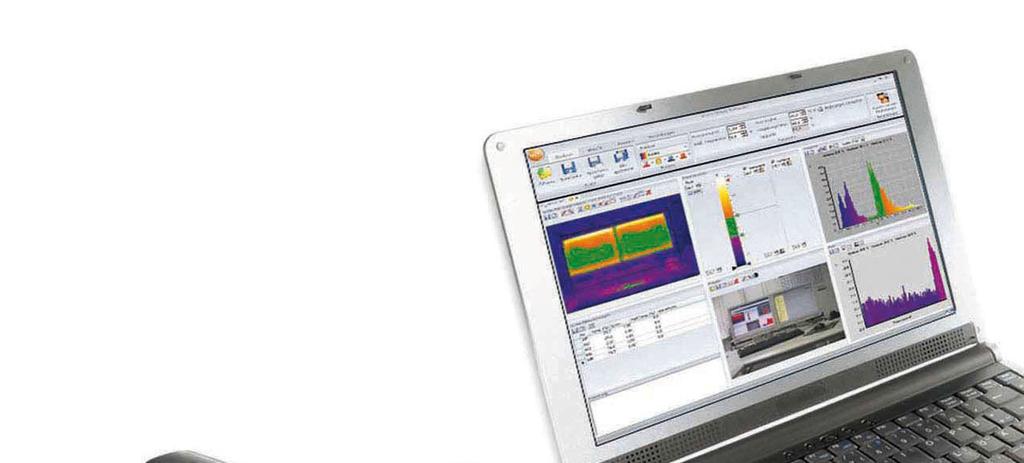
 Comprehensive analysis of thermal images. testo IRSoft: High-performance professional software. testo IRSoft Analyzing, evaluating and documenting thermal images. Thermography at the highest level needs
SKF TKTI. Thermal Camera Software. Instructions for use
 SKF TKTI Thermal Camera Software Instructions for use Table of contents 1. Introduction...4 1.1 Installing and starting the Software... 5 2. Usage Notes...6 3. Image Properties...7 3.1 Loading images
FLIR Tools for PC 7/21/2016
 FLIR Tools for PC 7/21/2016 1 2 Tools+ is an upgrade that adds the ability to create Microsoft Word templates and reports, create radiometric panorama images, and record sequences from compatible USB and
IRISYS ISI Series Imager Report Writing Software
 IRISYS ISI 4604 4000 Series Imager Report Writing Software User Manual InfraRed Integrated Systems Ltd Park Circle, Tithe Barn Way Swan Valley Northampton NN4 9BG Tel: (0) 1604 594200 Fax: (0) 1604 594210
How to Operate the Testo 870 thermal imager
 How to Operate the Testo 870 thermal imager Content 1. Technical data testo 870-1 & 870-2 2. Technical overview (Fixed focus) 3. Interface/internal memory 4. Inserting the battery 5. Operation of the testo
DOCUMENT SCANNER INSTRUCTIONS. Space. Backup. Count Only. New File. Scanner. Feeding Option Manual Auto Semi-Auto
 E FILM F Scanner A Space Count Only New File Feeding Option Manual Auto Semi-Auto Backup DOCUMENT SCANNER INSTRUCTIONS NOTICE q Copyright 2001 by CANON ELECTRONICS INC. All rights reserved. No part of
Wahl HSI3000 Series Imager Report Writer Software
 Wahl HSI3000 Series Imager Report Writer Software User Manual WD1024 Rev A 04/18/08 Palmer Wahl Instrumentation Group 234 Old Weaverville Road Asheville, NC 28804 Phone: (828) 658-3131 Fax: (828) 658-0728
Windows INSTRUCTION MANUAL
 Windows E INSTRUCTION MANUAL Contents About This Manual... 3 Main Features and Structure... 4 Operation Flow... 5 System Requirements... 8 Supported Image Formats... 8 1 Installing the Software... 1-1
KODAK Dental Imaging Software. Quick Start Guide
 KODAK Dental Imaging Software Quick Start Guide Notice Congratulations on your purchase of The KODAK Dental Imaging Software. Thank you for your confidence in our products and we will do all in our power
User Manual. Copyright 2010 Lumos. All rights reserved
 User Manual The contents of this document may not be copied nor duplicated in any form, in whole or in part, without prior written consent from Lumos. Lumos makes no warranties as to the accuracy of the
User Guide for TWAIN / DirectX interface for GRYPHAX USB 3.0 cameras
 User Guide for TWAIN / DirectX interface for GRYPHAX USB 3.0 cameras The TWAIN & DirectX driver for PROGRES GRYPHAX USB 3.0 cameras enables user to operate with TWAIN and DirectX supported 3 rd party software
Digital Portable Overhead Document Camera LV-1010
 Digital Portable Overhead Document Camera LV-1010 Instruction Manual 1 Content I Product Introduction 1.1 Product appearance..3 1.2 Main functions and features of the product.3 1.3 Production specifications.4
For customers in Canada This Class B digital apparatus meets all requirements of the Canadian Interference-Causing Equipment Regulations.
 User manual For customers in North and South America For customers in USA This device complies with Part 15 of the FCC rules. Operation is subject to the following two conditions: (1) This device may not
DigiScope II v3 TM Aperture Scope User s Manual
 DigiScope II v3 TM Aperture Scope User s Manual Welcome Thank you for choosing DigiScope II v3 TM Aperture scope! The DigiScope II v3 TM Aperture Scope is an exciting new device to Capture and record the
The ideal K-12 science microscope solution. User Guide. for use with the Nova5000
 The ideal K-12 science microscope solution User Guide for use with the Nova5000 NovaScope User Guide Information in this document is subject to change without notice. 2009 Fourier Systems Ltd. All rights
1.3. User s manual FLIR Report Studio
 1.3 User s manual FLIR Report Studio User s manual FLIR Report Studio #T810197; r. AD/44253/45486; en-us iii Table of contents 1 Legal disclaimer...1 1.1 Legal disclaimer...1 1.2 Usage statistics...1 1.3
Getting Started. with Easy Blue Print
 Getting Started with Easy Blue Print User Interface Overview Easy Blue Print is a simple drawing program that will allow you to create professional-looking 2D floor plan drawings. This guide covers the
User Manual for PROGRES GRYPHAX software
 User Manual for PROGRES GRYPHAX software PROGRES GRYPHAX software JENOPTIK l Healthcare & Industry JENOPTIK Optical Systems GmbH Göschwitzer Straße 25 07745 Jena, Germany Dear user, Please read the instructions
First English edition for Ulead COOL 360 version 1.0, February 1999.
 First English edition for Ulead COOL 360 version 1.0, February 1999. 1992-1999 Ulead Systems, Inc. All rights reserved. No part of this publication may be reproduced or transmitted in any form or by any
User Manual Veterinary
 Veterinary Acquisition and diagnostic software Doc No.: Rev 1.0.1 Aug 2013 Part No.: CR-FPM-04-022-EN-S 3DISC, FireCR, Quantor and the 3D Cube are trademarks of 3D Imaging & Simulations Corp, South Korea,
1 ImageBrowser Software User Guide 5.1
 1 ImageBrowser Software User Guide 5.1 Table of Contents (1/2) Chapter 1 What is ImageBrowser? Chapter 2 What Can ImageBrowser Do?... 5 Guide to the ImageBrowser Windows... 6 Downloading and Printing Images
ThermaViz. Operating Manual. The Innovative Two-Wavelength Imaging Pyrometer
 ThermaViz The Innovative Two-Wavelength Imaging Pyrometer Operating Manual The integration of advanced optical diagnostics and intelligent materials processing for temperature measurement and process control.
Welcome 1. Precaution
 Table of Contents EN Precaution....2 Preparation.. 4 Standard accessories....4 Parts Names & Functions...5 Computer System requirements.... 6 Technical Specifications 7 Install the software.. 7 Start Microscope.8
For customers in USA This device complies with Part 15 of the FCC rules. Operation is subject to the following two conditions:
 User manual For customers in North and South America For customers in USA This device complies with Part 15 of the FCC rules. Operation is subject to the following two conditions: (1) This device may not
Quick Start Guide for the PULSE PROFILING APPLICATION
 Quick Start Guide for the PULSE PROFILING APPLICATION MODEL LB480A Revision: Preliminary 02/05/09 1 1. Introduction This document provides information to install and quickly start using your PowerSensor+.
CHAPTER1: QUICK START...3 CAMERA INSTALLATION... 3 SOFTWARE AND DRIVER INSTALLATION... 3 START TCAPTURE...4 TCAPTURE PARAMETER SETTINGS... 5 CHAPTER2:
 Image acquisition, managing and processing software TCapture Instruction Manual Key to the Instruction Manual TC is shortened name used for TCapture. Help Refer to [Help] >> [About TCapture] menu for software
Nikon View DX for Macintosh
 Contents Browser Software for Nikon D1 Digital Cameras Nikon View DX for Macintosh Reference Manual Overview Setting up the Camera as a Drive Mounting the Camera Camera Drive Settings Unmounting the Camera
Planmeca Romexis. quick guide. Viewer EN _2
 Planmeca Romexis Viewer quick guide EN 10029550_2 TABLE OF CONTENTS 1 START-UP OF PLANMECA ROMEXIS VIEWER...1 1.1 Selecting the interface language... 1 1.2 Selecting images...1 1.3 Starting the Planmeca
KoPa Scanner. User's Manual A99. Ver 1.0. SHENZHEN OSTEC OPTO-ELECTRONIC TECHNOLOGY CO.,LTD.
 KoPa Scanner A99 User's Manual Ver 1.0 SHENZHEN OSTEC OPTO-ELECTRONIC TECHNOLOGY CO.,LTD. http://www.ostec.com.cn Content Chapter 1 Start... 1 1.1 Safety Warnings and Precautions... 1 1.2 Installation
inphoto ID Canon camera control software Automatic ID photography User Guide
 inphoto ID Canon camera control software Automatic ID photography User Guide 2008 Akond company 197342, Russia, St.-Petersburg, Serdobolskaya, 65A Phone/fax: +7(812)600-6918 Cell: +7(921)757-8319 e-mail:
digitization station DIGITAL SCRAPBOOKING 120 West 14th Street
 digitization station DIGITAL SCRAPBOOKING 120 West 14th Street www.nvcl.ca techconnect@cnv.org DIGITAL SCRAPBOOKING With MyMemories Suite 6 The MyMemories Digital Scrapbooking software allows you to create
USER MANUAL. ScanFlex AUTOMATED SCANNING DEVICE SCANFLEX Rev 5.0
 USER MANUAL ScanFlex AUTOMATED SCANNING DEVICE 05-12-17 SCANFLEX 3.1.4 Rev 5.0 Culturing Cells in a Mechanically Active Environment Flexcell International Corporation 2730 Tucker Street, Suite 200 Burlington,
ID Photo Processor. Batch photo processing. User Guide
 ID Photo Processor Batch photo processing User Guide 2015 Akond company 197342, Russia, St.-Petersburg, Serdobolskaya, 65a Phone/fax: +7(812)384-6430 Cell: +7(921)757-8319 e-mail: info@akond.net http://www.akond.net
Copyright Notice. Trademarks
 Copyright Notice All rights reserved. No part of this publication may be reproduced, stored in a retrieval system, or transmitted in any form or by any means, electronic, mechanical, photocopying, recording,
OPERATION MANUAL MIMAKI ENGINEERING CO., LTD.
 OPERATION MANUAL MIMAKI ENGINEERING CO., LTD. http://www.mimaki.co.jp/ E-mail:traiding@mimaki.co.jp D200674 About FineCut for CorelDRAW Thank you very much for purchasing a product of Mimaki. FineCut,
Mighty Scope 5M. Instruction Manual. aveninc.com
 Mighty Scope 5M Instruction Manual aveninc.com Contents Features 2 Specifications 2 Contents 2 PC System Requirements 3 Driver Installation Procedure 3 Getting Started 3 Software Installation (PC) 4 Mighty
4.0. User s manual Flir Tools/Tools+
 4.0 User s manual Flir Tools/Tools+ User s manual Flir Tools/Tools+ #T559600; r. AB/ 8669/8669; en-us iii Table of contents 1 Legal disclaimer...1 1.1 Legal disclaimer...1 1.2 Usage statistics...1 1.3
Managing images with NewZapp
 Managing images with NewZapp This guide is for anyone using the NewZapp Fixed editor as opposed to the Drag and Drop editor. The Image Manager is where images are uploaded and stored in your NewZapp account
Installation & User Manual Micro-Image Capture 7
 Installation & User Manual Micro-Image Capture 7 Ver1.2016 Product Warranty Quality Assurance Every Micro-Image Capture system passes quality assurance tests including focus, resolution quality and mechanical
InsideIR. Users Manual. Thermal Image Analysis Software
 InsideIR Thermal Image Analysis Software Users Manual January 2006 2006 Fluke Corporation, All rights reserved. Printed in USA. All product names are trademarks of their respective companies. Table of
weak spots and damage in industrial maintenance, production
 Industrial thermography Simply see more with the thermal imagers from Testo. Industrial thermography Simply see more without contact. Testo thermal imagers quickly and reliably detect anomalies, weak spots
Optika ISview. Image acquisition and processing software. Instruction Manual
 Optika ISview Image acquisition and processing software Instruction Manual Key to the Instruction Manual IS is shortened name used for OptikaISview Square brackets are used to indicate items such as menu
Apple Photos Quick Start Guide
 Apple Photos Quick Start Guide Photos is Apple s replacement for iphoto. It is a photograph organizational tool that allows users to view and make basic changes to photos, create slideshows, albums, photo
ArcSoft PhotoImpression Table of Contents:
 ArcSoft PhotoImpression Table of Contents: 1. Welcome to PhotoImpression 2. Highlights of PhotoImpression 3. System Requirements 4. Installing PhotoImpression 5. Working with PhotoImpression Getting Started
Photo Maker. User Manual
 Photo Maker User Manual PhotoMaker Mac Manual.indd 1 12/01/2011 4:46:14 PM Mac Manual.indd 2 12/01/2011 4:46:14 PM Contents 1. Precautions 2. Standard Accessories 3. Part Names 4. Installing the software
Visioneer OneTouch Scanner. Installation Guide FOR WINDOWS
 Visioneer OneTouch Scanner Installation Guide FOR WINDOWS TABLE OF CONTENTS i TABLE OF CONTENTS Getting Started with your new Scanner....................... 1 Step 1: Installing the Scanner Software.......................
EinScan-SE. Desktop 3D Scanner. User Manual
 EinScan-SE Desktop 3D Scanner User Manual Catalog 1. 2. 3. 4. 5. 6. 7. 8. 1.1. 1.2. 1.3. 1.1. 1.2. 1.1. 1.2. 1.3. 1.1. 1.2. Device List and Specification... 2 Device List... 3 Specification Parameter...
Revit Structure 2012 Basics:
 SUPPLEMENTAL FILES ON CD Revit Structure 2012 Basics: Framing and Documentation Elise Moss autodesk authorized publisher SDC PUBLICATIONS www.sdcpublications.com Schroff Development Corporation Structural
IX Feb Operation Guide. Sequence Creation and Control Software SD011-PCR-LE. Wavy for PCR-LE. Ver. 5.5x
 IX000693 Feb. 015 Operation Guide Sequence Creation and Control Software SD011-PCR-LE Wavy for PCR-LE Ver. 5.5x About This Guide This PDF version of the operation guide is provided so that you can print
Sentech USB Camera User Manual. Sentech USB Camera Viewing Software StCamSWare
 Sentech USB Camera User Manual Sentech USB Camera Viewing Software StCamSWare Safety Precautions CAUTION CAUTION RISK OF RISK ELECTRIC OF ELECTRIC SHOCK SHOCK RISK DO OF NOT ELECTRIC DO OPEN NOT SHOCK
Happy Link Software INSTRUCTION MANUAL
 Happy Link Software INSTRUCTION MANUAL 101001E-3 HAPPY Contents Regarding this software Normal Operation -------------------------------------------------------------------------------------------------
Magic Wand Portable Scanner with Auto-Feed Dock. PDSDK-ST470-VP-BX2 User Manual
 Magic Wand Portable Scanner with Auto-Feed Dock PDSDK-ST470-VP-BX2 User Manual Table of Contents 1. KEY FEATURES... 2 2. FUNCTIONAL PARTS... 2 3. EXPLANATION OF THE STATUS ICONS... 4 4. GETTING STARTED...
optris PI Connect Software for Thermal Imager Operators manual
 optris PI Connect Software for Thermal Imager Operators manual Content Content... 2 Welcome!... 4 Legal disclaimer... 5 1. Getting started... 6 1.1. Software installation... 6 1.2. Choice of camera...
Photoshop CS2. Step by Step Instructions Using Layers. Adobe. About Layers:
 About Layers: Layers allow you to work on one element of an image without disturbing the others. Think of layers as sheets of acetate stacked one on top of the other. You can see through transparent areas
ScanGear CS-U 5.6. for CanoScan FB1210U Color Scanner. User s Guide
 ScanGear CS-U 5.6 for CanoScan FB1210U Color Scanner User s Guide Copyright Notice Copyright 2000 Canon Inc. This manual is copyrighted with all rights reserved. Under the copyright laws, this manual may
September CoroCAM 6D. Camera Operation Training. Copyright 2012
 CoroCAM 6D Camera Operation Training September 2012 CoroCAM 6D Body Rubber cover on SD Card slot & USB port Lens Cap retention loop Charging port, video & audio output, audio input Laser pointer CoroCAM
Autodesk Advance Steel. Drawing Style Manager s guide
 Autodesk Advance Steel Drawing Style Manager s guide TABLE OF CONTENTS Chapter 1 Introduction... 5 Details and Detail Views... 6 Drawing Styles... 6 Drawing Style Manager... 8 Accessing the Drawing Style
ImagesPlus Basic Interface Operation
 ImagesPlus Basic Interface Operation The basic interface operation menu options are located on the File, View, Open Images, Open Operators, and Help main menus. File Menu New The New command creates a
Software Guide for Windows ZoomBrowser EX PhotoStitch
 Software Guide for Windows ZoomBrowser EX PhotoStitch Special Features Transfer Images and Movies Insert Text ABC Save Still Images From Movies Edit Movies A Print Images Back Up to a CD Attach Images
Operating Manual. (Version 3.10)
") Operating Manual (Version 3.10) Thank you for purchasing this PENTAX Digital Camera. This is the manual for PENTAX PHOTO Browser 3 and PENTAX PHOTO Laboratory 3 software for your Windows PC or Macintosh
Operating Manual (Version 3.10) Thank you for purchasing this PENTAX Digital Camera. This is the manual for PENTAX PHOTO Browser 3 and PENTAX PHOTO Laboratory 3 software for your Windows PC or Macintosh
inphoto ID Canon and Olympus camera control software Automatic ID photography User Guide
 inphoto ID Canon and Olympus camera control software Automatic ID photography User Guide 2006 Akond company 197342, Russia, St.-Petersburg, Serdobolskaya, 65a Phone/fax: +7(812)600-6918 Cell: +7(921)757-8319
Welcome to Corel DESIGNER, a comprehensive vector-based package for technical graphic users and technical illustrators.
 Workspace tour Welcome to Corel DESIGNER, a comprehensive vector-based package for technical graphic users and technical illustrators. This tutorial will help you become familiar with the terminology and
Quintic Software Tutorial 3
 Quintic Software Tutorial 3 Take a Picture 1 Tutorial 3 Take a Picture Contents Page 1. Photo 2. Photo Sequence a. Add shapes and angles 3. Export Analysis 2 Tutorial 3 Take a Picture 1. Photo Open the
Scanner Utility for Microsoft Windows Version 9.6. User's Guide
 P3PC-E892-03EN Scanner Utility for Microsoft Windows Version 9.6 User's Guide For Use with Microsoft Windows 98, Windows Me, Windows 2000 and Windows XP Introduction Thank you for purchasing the "Scanner
Version 4.2 For WINDOWS
 SIGMA Photo Pro User Guide Companion Processing Software for SIGMA Digital Cameras Version 4.2 For WINDOWS I M P O R T A N T : Please Read Before You Start Thank you very much for purchasing this SIGMA
Adobe Photoshop CC 2018 Tutorial
 Adobe Photoshop CC 2018 Tutorial GETTING STARTED Adobe Photoshop CC 2018 is a popular image editing software that provides a work environment consistent with Adobe Illustrator, Adobe InDesign, Adobe Photoshop,
User s manual Flir R&D Software 3.3
 User s manual Flir R&D Software 3.3 User s manual Flir R&D Software 3.3 #T559132; r.5674/5676; en-us iii Table of contents 1 Legal disclaimer...1 1.1 Legal disclaimer...1 1.2 Copyright...1 1.3 Quality
Operating Manual. (Version 3.5)
") Operating Manual (Version 3.5) Thank you for purchasing this PENTAX Digital Camera. This is the manual for PENTAX PHOTO Browser 3 and PENTAX PHOTO Laboratory 3 software for your Windows PC or Macintosh
Operating Manual (Version 3.5) Thank you for purchasing this PENTAX Digital Camera. This is the manual for PENTAX PHOTO Browser 3 and PENTAX PHOTO Laboratory 3 software for your Windows PC or Macintosh
GXCapture 8.1 Instruction Manual
 GT Vision image acquisition, managing and processing software GXCapture 8.1 Instruction Manual Contents of the Instruction Manual GXC is the shortened name used for GXCapture Square brackets are used to
NexImage USER S MANUAL. Model # 93708, # # 95518, # ENGLISH
 NexImage USER S MANUAL Model # 93708, # 93711 # 95518, # 95519 ENGLISH Congratulations on your purchase of the Celestron NexImage Solar System imaging camera. Your NexImage camera comes with the following:
Table of Contents 1. Image processing Measurements System Tools...10
 Introduction Table of Contents 1 An Overview of ScopeImage Advanced...2 Features:...2 Function introduction...3 1. Image processing...3 1.1 Image Import and Export...3 1.1.1 Open image file...3 1.1.2 Import
Chapter 14 Inserting Bitmapped Images
 Chapter 14 Inserting Bitmapped Images Introduction This chapter explains how to insert and size bitmapped images in R&R reports. This information is presented in the following sections: Importing an Image
Sante FFT Imaging Copyright 2018 Santesoft, all rights reserved
 Sante FFT Imaging Copyright 2018 Santesoft, all rights reserved Table of Contents About the program... 2 System Requirements... 2 The Fourier transform... 3 The user interface... 5 Customize the toolbar...
Contents Technical background II. RUMBA technical specifications III. Hardware connection IV. Set-up of the instrument Laboratory set-up
 RUMBA User Manual Contents I. Technical background... 3 II. RUMBA technical specifications... 3 III. Hardware connection... 3 IV. Set-up of the instrument... 4 1. Laboratory set-up... 4 2. In-vivo set-up...
Revit Structure 2013 Basics
 Revit Structure 2013 Basics Framing and Documentation Elise Moss Supplemental Files SDC P U B L I C AT I O N S Schroff Development Corporation Better Textbooks. Lower Prices. www.sdcpublications.com Tutorial
User Guide. Version 1.4. Copyright Favor Software. Revised:
 User Guide Version 1.4 Copyright 2009-2012 Favor Software Revised: 2012.02.06 Table of Contents Introduction... 4 Installation on Windows... 5 Installation on Macintosh... 6 Registering Intwined Pattern
The screen pictures shown in this manual may differ depending on the type of computer or camera used.
 Operating Manual Thank you for purchasing the PENTAX Digital Camera. This is the manual for PENTAX PHOTO Browser 3 and PENTAX PHOTO Laboratory 3 software for your Windows PC or Macintosh for enjoying images
NexImage Burst USER S MANUAL Model # 95518, # ENGLISH
 NexImage Burst USER S MANUAL Model # 95518, # 95519 ENGLISH Congratulations on your purchase of the Celestron NexImage Burst Solar System imaging camera. Your NexImage camera comes with the following:
User Manual. cellsens 1.16 LIFE SCIENCE IMAGING SOFTWARE
 User Manual cellsens 1.16 LIFE SCIENCE IMAGING SOFTWARE Any copyrights relating to this manual shall belong to OLYMPUS CORPORATION. We at OLYMPUS CORPORATION have tried to make the information contained
ISCapture User Guide. advanced CCD imaging. Opticstar
 advanced CCD imaging Opticstar I We always check the accuracy of the information in our promotional material. However, due to the continuous process of product development and improvement it is possible
Progeny Imaging. User Guide V x and Higher. Part Number: ECN: P1808 REV. F
 Progeny Imaging User Guide V. 1.6.0.x and Higher Part Number: 00-02-1598 ECN: P1808 REV. F Contents 1 About This Manual... 5 How to Use this Guide... 5 Text Conventions... 5 Getting Assistance... 6 2 Overview...
WinDIAS 3. Quick Start Guide version 3.2. Delta-T Devices Ltd. Image Analysis System
 WinDIAS 3 Image Analysis System Quick Start Guide version 3.2 Delta-T Devices Ltd Overview Note: Not all TWAIN devices will work Page 2 Video Camera Operations 1 Connect camera to PC 2 PC detects camera,
COURSE UNIT 3. Plan Creation. Messerli EliteCAD Version
 Messerli EliteCAD Version 13 27.09.2013 COURSE UNIT 3 Plan Creation Switzerland: Austria: Germany: Messerli Informatik AG Messerli Informatik GmbH Messerli Informatik GmbH Pfadackerstrasse 6 Hamoderstraße
Introduction to Autodesk Inventor for F1 in Schools (Australian Version)
") Introduction to Autodesk Inventor for F1 in Schools (Australian Version) F1 in Schools race car In this course you will be introduced to Autodesk Inventor, which is the centerpiece of Autodesk s Digital
Introduction to Autodesk Inventor for F1 in Schools (Australian Version) F1 in Schools race car In this course you will be introduced to Autodesk Inventor, which is the centerpiece of Autodesk s Digital
BacklightFly Manual.
 BacklightFly Manual http://www.febees.com/ Contents Start... 3 Installation... 3 Registration... 7 BacklightFly 1-2-3... 9 Overview... 10 Layers... 14 Layer Container... 14 Layer... 16 Density and Design
Tribometrics. Version 2.11
 Tribometrics Version 2.11 Table of Contents Tribometrics... 1 Version 2.11... 1 1. About This Document... 4 1.1. Conventions... 4 2. Introduction... 5 2.1. Software Features... 5 2.2. Tribometrics Overview...
in the list below are available in the Pro version of Scan2CAD
 Scan2CAD features Features marked only. in the list below are available in the Pro version of Scan2CAD Scan Scan from inside Scan2CAD using TWAIN (Acquire). Use any TWAIN-compliant scanner of any size.
StitchBuddy Help. About "StitchBuddy"
 StitchBuddy Help About "StitchBuddy" Introducing embroidery on Macs for hobbyists. Viewing embroideries View embroidery designs and use view options, copy, print and preview color changes. Modifying embroideries
Building thermography.
 Building thermography. Simply see more with the thermal imagers from Testo. Building thermography Simply see more without contact. Testo thermal imagers detect anomalies and damage to building shells or
Impress Guide. Chapter 4 Adding and Formatting Pictures
 Impress Guide Chapter 4 Adding and Formatting Pictures Copyright This document is Copyright 2005 2012 by its contributors as listed below. You may distribute it and/or modify it under the terms of either
inphoto ID PS Automatic ID photography With Canon PowerShot camera User Guide
 inphoto ID PS Automatic ID photography With Canon PowerShot camera User Guide 2018 Akond company Phone/fax: +7(812)384-6430 Cell: +7(921)757-8319 e-mail: info@akond.net akondsales@gmail.com http://www.akond.net
System Requirements...2. Installation...2. Main Menu...3. New Features...4. Game Controls...8. WARRANTY...inside front cover
 TABLE OF CONTENTS This manual provides details for the new features, installing and basic setup only; please refer to the original Heroes of Might and Magic V manual for more details. GETTING STARTED System
ROTATING SYSTEM T-12, T-20, T-50, T- 150 USER MANUAL
 ROTATING SYSTEM T-12, T-20, T-50, T- 150 USER MANUAL v. 1.11 released 12.02.2016 Table of contents Introduction to the Rotating System device 3 Device components 4 Technical characteristics 4 Compatibility
NAOMI SYSTEM User Guide
 NAOMI SYSTEM User Guide WM_0810-04 FDA 510(k) Number K062376 This document includes the important information to ensure the safe usage of the item. Before using the system, read through this User Guide
TECHNOTravel. For Microsoft Word & PowerPoint 2010 Student Workbook. TECHNOeBooks Project-based Computer Curriculum ebooks.
 TECHNOTravel For Microsoft Word & PowerPoint 2010 Student Workbook TECHNOeBooks Project-based Computer Curriculum ebooks www.bepublishing.com Copyright 1993 2010. TechnoKids Inc. in partnership with B.E.
Go Daddy Online Photo Filer
 Getting Started and User Guide Discover an easier way to share, print and manage your photos online! Online Photo Filer gives you an online photo album site for sharing photos, as well as easy-to-use editing
Advance Steel. Drawing Style Manager s guide
 Advance Steel Drawing Style Manager s guide TABLE OF CONTENTS Chapter 1 Introduction...7 Details and Detail Views...8 Drawing Styles...8 Drawing Style Manager...9 Accessing the Drawing Style Manager...9
Next Back Save Project Save Project Save your Story
 What is Photo Story? Photo Story is Microsoft s solution to digital storytelling in 5 easy steps. For those who want to create a basic multimedia movie without having to learn advanced video editing, Photo
MC3 Motion Control System Shutter Stream Quickstart
 MC3 Motion Control System Shutter Stream Quickstart Revised 7/6/2016 Carousel USA 6370 N. Irwindale Rd. Irwindale, CA 91702 www.carousel-usa.com Proprietary Information Carousel USA has proprietary rights