Viewing New Hampshire from Space
|
|
|
- Marcia Curtis
- 5 years ago
- Views:
Transcription


1 Viewing New Hampshire from Space A Bird s-eye View of the Granite State!
2 Introduction Environmental changes are a major concern for researchers and policy makers today since these changes have both human and ecological impacts (Dodge and Congalton 2013). Locating and studying these changes has, until recently, been a challenge; requiring a significant amount of effort, time, and money. Remote sensing has made this process much more efficient and cost effective by utilizing imagery collected from aircraft and satellites to monitor and study both natural and human induced changes. Imagery collected by aircraft has been extensively used and still is today, but remotely sensed satellite imagery is becoming very popular. Satellites can collect images frequently and systematically, which means it can be used to monitor short term or long term changes (Dodge and Congalton 2013). Furthermore, we can view information about features on the ground that we may not otherwise have been able to see if looking at it in person. Today s sensors can capture multiple discrete wavelengths of light outside of the visible range our eyes can see in allowing us to observe phenomena that we may otherwise have not been able to see with our eyes alone. For these reasons and more, public and private groups are beginning to understand the potential of this technology in a number of fields and thus geospatial sciences are becoming one of the most rapidly growing fields (Landengerger et al., 2011). In order to utilize all this information, the observer needs to understand how to interpret what he or she is seeing on the imagery since features within the imagery may not always look the way we see them in real life. The ability to interpret different ground features comes with a bit of training, but once learned can be utilized in a number of applications. This document provides background and practice with remotely sensed satellite imagery. It is broken up into three parts. The first section covers the basics of remote sensing: what remote sensing is, what is being sensed, and how satellites work. The second section is a guided practice where readers will be shown various satellite images of common features with corresponding background information to help them understand the imagery. The final section is a self-test using the skills and information acquired. Throughout all three sections, the reader will be asked questions related to the material that they just read in order to test their understanding as well as encourage them to apply their own experiences and knowledge. For additional information about satellite remote sensing, example applications, and case studies, please refer to Meeting Environmental Challenges with Remote Sensing Imagery. A PDF version of the book can be downloaded at the link provided below. Suggested Publication: Dodge, Rebecca L., and Russell G. Congalton Meeting Environmental Challenges with Remote Sensing Imagery. American Geosciences Institute, Alexandria, VA. 82p. Download at: Reference: Landengerger, Rick, Mark W. Patterson, Ramesh Sivanpillai, and Rick Lawrence America View: Promoting Remote Sensing Science and Technology Through Cooperative Partnerships. Photogrammetric Engineering & Remote Sensing 77 (10): This document was produced by NewHampshireView (Heather Grybas and Russell Congalton). For further information please Russ Congalton at russ.congalton@unh.edu or visit Funding for this work provided by Grant #G14AP00002 from the Department of Interior, United States Geological Survey to AmericaView. Contents of this work are the sole responsibility of the authors. 1


3 What is remote sensing? Important Vocabulary! Remote sensing is learning something about an object without touching it. We can use remote sensing to gather information about a number of things and we have different tools to help us. For example, many people are concerned about the environment and how humans are changing it because these changes can have negative impacts like polluted water or a decrease in the amount of wildlife because their habitats have been cut down or removed. Studying these changes is important but it would take a long time for you or me to go outside and find them all. This is where remote sensing can help. We can attach sensors to airplanes or satellites that take images of the earth from above so we can study the environmental changes that have occurred over a large area rather quickly. a. Humans have five senses. Three of them could be considered a form of remote sensing. What are they? Attaching sensors to airplanes has been done for many years, but airplanes can only fly when the weather is good and can also be expensive. Satellites orbiting the earth in space can continuously collect images of the Earth s surface regardless of the weather. As the satellite orbits around the earth from north to south, the Earth is rotating from east to west. This allows the satellite to take an image of a new area on the Earth with each rotation around the planet. Eventually, the entire planet will be covered and the satellite will start again. This process will continue for weeks, months, or even years! Over time we can collect hundreds of images of the Earth s surface from different times. We can look at a satellite image from a single day or we can compare images from different dates to see what has changed, much like you will do in these exercises. But before you can start you need some practice because satellite imagery has some special properties that you should understand so you know how to use it effectively. Remote Sending Learning something about an object without touching it Sensor- a device that detects or measures a physical property and records, indicates, or otherwise responds to it. Radiate- to give off energy from a specific source ex. The sun What is Being Sensed? Source: Canada Center for Remote Sensing This may seem like an obvious statement, but we can only see an object because of light. Light is energy that radiates from a source, for example a light bulb or the sun. This energy is called electromagnetic energy and it is more important than you may realize. For example, when you watch TV, listen to the radio, or send a text message, you are using electromagnetic energy. We do not tend to think about light as something that moves, but it travels from one place to another. It just moves so fast we cannot see this motion with our eyes. Electromagnetic energy is made up of charged particles and when they move, they move like a wave with high points called crests and low points called troughs. We can describe these waves using two important properties: frequency and wavelength. Imagine for a second that you can see light as it moved. You would see each individual crest and trough as it passed by. If you had a stop watch 2


4 and counted the number of times a crest passed by you in a second, you would be calculating the frequency. Frequency is the number of crests that pass by a given point in one second; the more crests per second, the higher the frequency of that wave. Wavelength is the distance from the top of one crest to the top of the next crest. Wavelength and frequency are important properties of electromagnetic energy because it allows us to decide what type of energy it is. Important Vocabulary! Frequency- The number of crests that pass by a given point in one second Wavelength- The distance between the top of one crest and the top of the next Electromagnetic Spectrum- The range of wavelengths and frequencies that electromagnetic energy exists within Visible Light The range of the electromagnetic spectrum that contains wavelengths our eyes can see Not all electromagnetic energy is the same. It can move with different frequencies and have different wavelengths. Scientists use the wavelength and frequency of the energy to group them like shown in the diagram below. This diagram represents the electromagnetic spectrum, or the range of wavelengths and frequencies over which electromagnetic energy extends. The objects under the wavelengths in the diagram below give us an idea of how long the distance between crests would be if we could see them. The spectrum ranges from the longest wavelengths (radio waves) to the shortest (gamma rays). We can use the wavelength to decide what group the energy should fall into. For example, if a particle of energy has a wavelength of 10-5 meters, it would be classified as infrared light. Now there are many types of electromagnetic energy that we can use for remote sensing, but for the satellite remote sensing we will be doing, we will focus on the visible and infrared light. Source: b. Do you recognize any of these types of electromagnetic energy? How might they be used in your daily life? c. What is the relationship between frequency and wavelength? Source: We know radio waves exist because we can listen to our favorite music through our radios, but we do not see radio waves. When we turn on a lamp, however, we can see the light that comes out of the bulb. Despite this difference, these are both types of electromagnetic energy, so you may be asking yourself, Why don t I see all this energy around me? That s because our eyes can only see the light or electromagnetic energy from a very small portion of the electromagnetic spectrum known as visible light (see the figure to the left). Everything else 3

. Our brain interprets the different kinds of wavelengths within this range as different colors.")

5 Important Vocabulary! Refraction - Change in the direction a wavelength of light is moving after passing through an object Reflect- to move in one direction, hit a surface, and then quickly move in a different direction Primary colors a set of colors that, when combined in different amounts, can produce all other colors. falls outside of that range so we do not see them but they do exist and are around us every day. Visible light has wavelengths that range between nanometers (1 nanometer = meters). Our brain interprets the different kinds of wavelengths within this range as different colors. For example, if electromagnetic energy with a wavelength of 700 nanometers entered a completely dark room, we would see it as red light. If the energy had a wavelength of 400 nanometers, we would see it as violet. d. What color would the light be if the wavelength was 450 nanometers? What would happen if the wavelength of the light coming into the dark room was 300 nanometers? We see sunlight as one uniform color, white, but it is actually made up of various wavelengths of energy including all the wavelengths within the visible range. We can prove this to ourselves if we look at light through a prism. As light enters the prism, the different wavelengths of light are bent (this is known as refraction) by differing amounts depending upon the wavelength. This splits up the light into the individual wavelengths that make it up. As the light leaves the prism, our brains interpret each wavelength as a particular color. We see rainbows after a rainstorm because the water in the sky acts like tiny prisms, splitting the light shining through it. Source: So the colors we see around us are a result of the different kinds of electromagnetic energy (light) within the visible range that is reflecting off of the object we re looking at. A leaf looks green to us because we see the light within the green portion of the visible range reflecting off the surface of the leaf. So what about the rest of the visible light? Why do we only see the green light reflected off the leaf and not any other colors? To understand, we need to learn how electromagnetic energy (light) interacts with an object. When any light, or electromagnetic energy, travels through space and strikes an object, it interacts with that object. The energy can be either absorbed by the object or reflected off the surface of the object. We will stick with the leaf as an example of this. You will also see that visible light is represented by blue (B), green (G), and red (R) light instead of all the colors. These are the primary colors or wavelengths in the spectrum. No other wavelength can make blue, green, or red, but all the other colors can be created by combining these three in different proportions. Infrared light (IR) is also shown in the diagram, but we will discuss that later. Remember that light from the sun is made up of many different wavelengths, including the visible light and infrared. It passes through our atmosphere and strikes the leaves of the trees. The blue light and the red light are absorbed by the leaves because leaves contain chlorophyll that absorbs most of the red and blue light for photosynthesis, which is how a 4


6 plant produces food. The plant does not need the green light so it is not absorbed; instead the green light is reflected back. When we look at an object, we see the energy being reflected off the object towards our eyes. Since green light is the only visible light being reflected, the leaves appear green to us. As we ve already learned though, there is more than just visible light out there. There are wavelengths that are invisible to our eyes but are still being absorbed or reflected off of objects. In the diagram of the tree, you can see that it is not just green light that is reflected from the leaf, but infrared light was well. We just do not see the infrared light with our eyes. The most useful of the invisible energy to us is in the infrared region of the spectrum, however. As we will see, there is a lot we can learn just by looking at how much infrared energy is being reflected by an object. e. What color would an object be if it reflected all visible light? f. What color would an object be if it reflected no visible light? If everything on Earth interacted the same way with electrometric energy, everything would be the same color; thankfully this does not happen. Every surface interacts with electromagnetic energy differently. Different surfaces will absorb and/or reflect energy weakly or strongly in different wavelengths. We can use this knowledge to our advantage. If we measure the amount of energy reflected off a surface at different wavelengths, we can use that information to figure out what it is. We can create a graph called a spectral reflectance curve (below) that lets us see the amount of reflected energy across a range of wavelengths for a particular object or surface. Lets say the green line on the graph to the right is the spectral reflectance curve for the tree we just looked at. As pointed out before, there is almost no reflectance in the blue and red wavelengths because that energy is absorbed for photosynthesis, but there is peak in the green which is why leaves look green. If you go beyond the visible light into the infrared, you will see that the amount of reflected energy suddenly spikes. A structure within the leaf known as the mesophyll is very effective at reflecting Infrared energy so healthy vegetation exhibits a very high peak in infrared reflectance on the graph. If we could see that energy, then vegetation would look very bright to us, but because we do not see IR wavelengths we only see the green light. Different types of objects or surfaces tend to have characteristic spectral reflectance curves that we can use to distinguish one object from another or to assess the condition of something on the ground. Like in the example to the left, we can see that in the visible light, vegetation is very different from bare ground or concrete. Deciduous and coniferous trees would look very, similar, however because there is not a big difference in the amount of reflected energy in the visible wavelengths. When objects look similar in the visible range, the energy in the invisible portions of the spectrum can come in handy. To our eyes there would be almost no difference between deciduous and 5


7 coniferous trees, but in the infrared there is a big difference. A very common use of remote sensing is to assess the health of vegetation. We can detect damage to trees before we can see it visibly with our eyes. Look at the spectral reflectance curves above for healthy and unhealthy vegetation. When plants are stressed, for example during a drought or infestation, they exhibit a significant drop in the amount of infrared reflectance well before there is enough of a change in visible light for us to visually see the damage. We can use remote sensing to detect this stress early by looking for the sudden drop in infrared reflectance and acting as soon as we see it. How Do Satellites Work? Satellites are a very important tool we can use to help us understand the environment. There are currently satellites orbiting the earth with sensors that, like our eyes, can see the energy being reflected by different objects on the Earth s surface. These sensors do not act exactly like our eyes though because they can detect the wavelengths beyond visible light that our eyes cannot see! Electromagnetic energy from the sun (A) travels through space and the Earth s atmosphere (B) where it interacts with the objects on the Earth s surface (C). Source: Canada Center for Remote Sensing As we now know, some of that energy is absorbed, but some of it is also reflected. The sensor (D) on the satellite flying overhead collects and measures the type and amount of electromagnetic energy reflected by the surface. The information collected by the sensor needs to transmitted to a processing station on Earth where it is turned into a digital image (E). We can then extract information from the satellite image that we are interested in (F). We apply this information to answer a question, solve a problem, or simply learn something more about a feature of interest (G). So let s take a look at a digital image. A digital image is a grid of equal-sized squares called pixels. Each pixel covers a certain area on the ground and has a digital number (DN) that represents the amount of electromagnetic energy being reflected in that area. A higher DN means there is more energy being reflected by the features within the area covered by that pixel. You ll see that black pixels have a DN of 0 (no reflectance) while white pixels have a DN of 255 (maximum reflectance). Satellites record the amount of reflected energy in different portions of the electromagnetic spectrum. Each portion is called a spectral band or band, for short. For example, the information shown in the table below represents the types of electromagnetic energy measured by the Landsat 8 satellite. It records the energy reflected in the visible lights (B, G, and R) as well as 3 types of infrared. So when measuring the amount of blue light being reflected, the sensor on the satellite is measuring the reflected energy between nanometers. That band is then turned into an image like shown to the right of the table. A digital image is generated for each spectral band the sensor collects. So for this satellite we have 7 digital images, each one representing the amount of reflected energy in that portion of the electromagnetic spectrum. We can 6


8 then use a computer to view these images together in color. It s important to mention that not all pixels have the same size (spatial resolution); they can vary from sensor to sensor. For example, Landsat is a very popular collection of satellites. Landsat images have a 30m pixel size. This does not mean that the pixel is 30m on your computer screen, but that a single pixel represents a 30 meter by 30 meter area on the ground. Pretend that you went outside and marked a 30 meter by 30 meter square on the ground. One Landsat pixel represents the same area. The DN in that pixel represents the averaged reflectance of all the objects in that 30mx30m box. Other satellites can collect images with a pixel size of 10 meters, 5 meters, and even less than 1 meter. You could fit a lot of those pixels in one Landsat pixel. g. What is the area covered by a single Landsat pixel? If another satellite image has 5 meter pixels, how many of those would fit in a single Landsat pixel? What might be an advantage of having smaller pixels? Satellites can measure the amount of electromagnetic energy being reflected in the visible range (B, G, and R) as well as outside of what our eyes can see. As we just learned, the infrared range is very useful for scientists because it can tell us a lot about an object. In the spectral curve example, deciduous and conifer trees would look very similar in the visible range of the spectrum, but we could tell them apart if we could see in the infrared portion of the spectrum. We cannot see the infrared energy that could help us, but this is where satellite imagery and computers can help us! The satellites measure the amount of energy reflected in the visible and invisible portions of the spectrum and the computer gives us a way to see the energy we could not see before. The two images below are actually acquired by a single satellite. The imagery is being displayed two different ways. On the left is what we call a natural color composite, meaning that this is how our eyes would see this area if we were looking at it from above. Everything makes sense to us. For example, we know that the green is vegetation and the sand on the beaches is white. The right hand image is called a false color composite. It looks nothing like the image on the left and the colors do not make much sense to us anymore. Why is that? The computer monitors we use are known as RGB moniors. RGB is the same R,G,B we have been talking about; red, blue, and green. You will also remember that red, blue, and green are primary colors and when combined together in different amounts, can produce all the other colors we see. So a computer monitor uses the three primary colors to produce all the different colors we see on the screen. Using special software, we can assign one of the primary colors to 7


9 a particular band that was collected by the sensor. The computer then displays each pixel in the image as a particular color based on the amount of reflected energy that recorded at that pixel in the bands that were chosen. h. What is the maximum number of bands we can choose to display on the computer monitor? Why? So now lets look at a natural color composite in more detail. To create this composite, we assigned the color blue to the blue band, green to the green band, and red to the red band. You will see the primary color we assigned each band matches the type of energy that was recorded by that band and the bands chosen are all the visible portion of the spectrum. This display shows the imagery exactly as we would see it if we were looking at the Earth from above with our eyes. We know that in the visible portion of the spectrum, vegetation has very little blue and red reflectance and much more green. Lets say a single pixel recorded the amount of reflected energy in the middle of a forest. The DN values of that pixel in the blue and red band would be very low, but higher in the green band. When the computer looks at the proportion of red, blue, and green reflectance (represented by the DN values) at that pixel, there is really only green reflectance (the other DN values are very low) and since we assigned the green band the color green, vegetation appears on the screen as green exactly as we would expect it. i. While trying to make a natural color composite to show you, someone assigned the color blue to the green band, red to the blue band, and green to the red band. What s wrong? What color would the vegetation be on the computer screen? Why? How should the bands really be displayed? Satellites record the amount of energy in multiple different bands, not just the visible. Therefore, we can make a false color composite, which allows us to utilize the infrared energy that we know is very useful. How do we make a false color composite? Well, we would do exactly what we did for the natural color composite with a few modifications. 8
10 In the diagram above you will see that we removed the blue band and added in the near infrared band. Now the green band has been assigned the color blue, the red band is assigned green, and the near infrared band is assigned the color red. The computer was told to display the amount of near infrared (a type of infrared) energy being reflected as one of the primary colors we can see, in this case red. Remember in the spectral reflectance curves above that vegetation reflects a lot of of this kind of energy, much more so than the green that our eyes see. Because the infrared reflectance is so high, we see the vegetation as red in the image. A false color composite is a very common way to display satellite imagery on a computer and as you continue with this exercise, you will learn how being able to see the amount of infrared reflectance can be very helpful. Next you will see how different features on the ground appear in satellite imagery. Before You Move On. Now that you have the background information you need, you are ready for some hands on practice. The next two sections will present you with several example images and ask questions to test your knowledge and understanding of remote sensing. The first section, Image Interpretation, is a guided practice. You will be provided with some example images of common landscapes in New Hampshire (forests, mountains, cities, etc.) and some additional background information that will help you to interpret the image and answer some questions related to what you just saw and read. In this section you will be given the answers to those questions. In the last section, Test Yourself, you will be given images and questions for you to answer on your own without additional guidance. The last section is a way to test your understanding of everything you have read in this exercise. Remember to think outside of the box, beyond what you have read here. When interpreting satellite images, it is very common for us to utilize knowledge and experiences we already have to help us answer questions, it is what makes us good problem solvers. Good Luck! 9


11 Image Interpretation Forest: Sanbornton Mountain located between Franklin and New Hampton, west of Laconia, NH. Here we have an example of a forested area in a Landsat 8 image. This forest is a mix of deciduous trees and coniferous trees. On the natural color composite (left) it is difficult to see the difference between different tones of green, but if you look at the same area on a false color composite (right) you ll see far more shades of red. This allows us to see the difference between the deciduous and coniferous areas. The spectral reflectance curves for deciduous and coniferous trees are shown above. You will notice that the deciduous trees reflect more infrared energy than the conifers. So if we are looking at a false color composite that lets us see infrared reflectance, the deciduous forests should look much brighter. Answer: a) Look at area A and B on the images above. Which one is deciduous and which one is coniferous? How do you know this? Which type of image was more helpful? b) How do you tell the difference between deciduous and conifer trees with your eyes? c) When can you most easily tell the difference between area A and B? a) Area A is a patch of deciduous forest and area B is coniferous forest. We can tell this because deciduous trees have more infrared reflectance than conifer trees and area A is much brighter than area B. The false color composite image was more helpful. b) Deciduous trees have leaves while coniferous trees have needles c) The best time to tell area A from area B would be during the fall or winter because deciduous trees would not have any leaves but the coniferous trees would still have needles. 10

12 Water: Great Bay surrounded by Newington, Newmarket, Durham, Dover, and Elliot, NH Here we have an example of water. The spectral reflectance curve for clean water is to the left. You will notice that clear water has very low reflectance in the visible portion of the spectrum and almost none in the infrared. Water is an excellent absorber of energy and will absorb a lot of the electromagnetic energy that hits it. Because it absorbs a lot of energy, it reflects very little and will appears very dark (dark Blue to black) in both the natural and false color composites, however, if there is a lot of sediment in the water from erosion or algae, the reflectance characteristics of water, especially in the visible range, will change significantly. The water itself will absorb most of the energy that hits it but the materials floating in the water or at the bottom (if the water is shallow enough) will reflect some energy. The materials in the water creates higher reflectance than we would expect if the water was clean or deep and lets us assess water quality in rivers, lakes or bays. Answer: a) Look closely at the water in the two images. Do you see any difference in the water? b) Pretend that you had to describe what water looks like in the imagery to someone who can t see the pictures. Besides what color it is, how else would you describe it? a) In both images you can see the difference between deep water and shallow water. The vegetation and sediment in the shallow edges of the bay cause greater reflectance in the visible portion of the spectrum. Since the water is not deep, the sensor can detect the reflectance from these materials. b) The water is smooth, glassy, uniform, and flat, 11


13 Development: Nashua, NH 1 1 A A 2 2 B B Above is an example of a developed area. Development is interesting because it has a variety of land cover types like bare pavement, grassy field/lawns, water, and forested areas. The spectral reflectance curve for a number of these land cover types is shown to the right. You should be able to spot the forested areas and the water in the image, but there are some other features you might not be familiar with. The circles are centered on non-woody vegetation like grass or agricultural field. They tend to be pale or bright pink in color because of the high near infrared reflectance of the vegetation, but they are a deep red like the forests to the right of them. The second feature is the urban areas that appear bright blue in the false color composite. These are roads, buildings, or non-vegetated areas. They stand out significantly more from vegetation in that image. There are also areas of bare ground (no vegetation or pavement) that look blue-grey. Answer: a) Areas 1 and 2 are both areas with non-woody vegetation. Area 1 is a farm and area 2 is a golf course. The colors of these areas are similar in both images. What other characteristics about these locations can you use to tell one from the other? b) A and B are both pointing to developed areas. Area A is a heavily developed area and Area B is moderately developed. What difference do you notice that could help you tell one from the other? Do you notice any patterns that could help you tell developed areas from bare ground? a) The shape of the patches is helpful. The farmland is made up of rectangular patches of low vegetation where farmers have plowed fields. b) Area A is more dark blue while Area B is made of some blue and some red indicating that there is more vegetation in area B and less bare ground or pavement. Developed areas also have long narrow strips of bare ground that cross over each other. These would be roads. 12


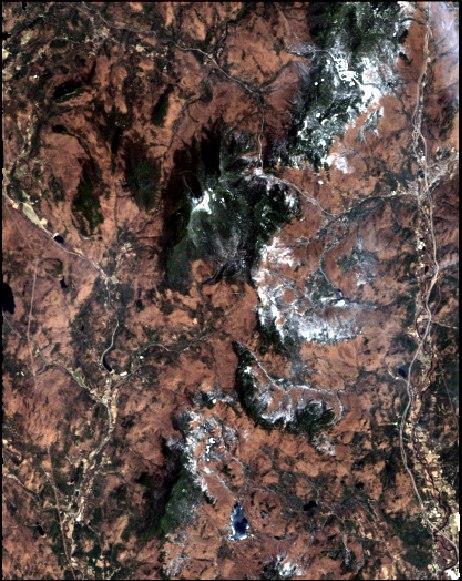
14 Clouds and Shadows Clouds are an uncontrollable aspect of remote sensing. With satellite sensors flying so high above the Earth s surface they are going to capture the reflectance of features on the ground as well as the reflectance from the clouds. As you can see in the images above, clouds can hide the features on the ground underneath them making it hard to interpret those areas. The shadow from the clouds over head makes the lake look bigger than it actually is. Researchers usually try and use images with as few clouds as possible but sometimes it is hard to avoid. The spectral reflectance curve for a cloud is to the left. They are easy to tell from other features because they reflect a lot of energy across the visible and infrared portions of the spectrum making them bright white. You usually have to decide if their shadows are water or not though. Other objects cast shadows too. For example, tall mountains like the one to the right can cast shadows because they block the sun from reaching one side. These shadows are useful because they let us know whether the feature we are looking at has height or not. The arrows on the image to the right point to locations where the mountain is casting a shadow. They look almost black on the image, but they are definitely not water. Answers: a) What is something you can do to tell the difference between cloud shadows and water in an image? b) Clouds are not always bad. When might you want clouds in your images? a) Look at cloud free images from a previous date b) If we were interested in weather on a particular day then we would like to see clouds in the imagery. 13


15 Test Yourself Note: Both images are false color composites September February 1. What is this yellow arrow pointing to in the image on the left? 2. Are both arrows pointing to the same thing? Why do they look different? 3. What does the color of the object in the image to the right tell you about the type and amount of energy being reflected there? Be general with your answer. BONUS: What is the name of this location? Note: Both images are false color composites August November 1. The image on the left was taken in August and the Image on the right was taken in November. What kind of vegetation is at points A and B on both images? 2. Why does the vegetation in area B still have a high infrared reflectance between August and November while there is no infrared reflectance in area A in November but a lot of reflectance in August? 3. Why is point C blue while the surrounding areas are red to red-purple in color? 4. The yellow lines represent a proposed new road. Would it be a good idea to build it here? Why? What clue helped you answer the question? BONUS: What is the Name of this location? 14


16 Note: Image is a false color composite February 1. Is the feature the arrow is pointing to natural or manmade? 2. Based on your previous answer, what do you think this is? 3. Notice how the area the arrow is pointing to has lots of white pixels but the surrounding landscape has very few. Why might this be? Use your answer to the previous question to help you. BONUS: What is the name of this location? Both images were taken on the same day. The image on the left is a false color composite and the image on the right is a natural color composite. 1. What kind of land use is occurring within the yellow box? 2. What characteristics of this area helped you to answer question 1? 3. What seems to be the relationship between this land use and water (Hint: Look at the whole scene, not just the box)? Why do you think this is happening? 4. Why might this relationship be a problem environmentally? 5. Based on the whole image, should we be concerned about the water here 15


17 September 1. What is the arrow pointing to? 2. What characteristics about this object helped you to answer question 1? BONUS: What is the name of this location? June 1. What is occurring in the yellow box? 2. What characteristics about this area helped you to answer question 1? BONUS: What is the name of this location? 16


18 April August April August May September May September June July October November June July October November 17


19 Above are a series of images from the same location collected between April and November. The first sets of images are false color composites and the second sets are natural color composites. 1. What natural process is happening in these photos? 2. If you wanted to study the health of the trees in a forest, what would be the best months to do so? 3. Is there a relationship between elevation and the type of trees we would see (Hint: is there an object in this image that has height)? If so, what is it? The second set of images in this practice section may be helpful to look at too. BONUS: What is the name of this location? Identify several areas that have changed between 1990 and What types of changes have happened? 3. What might some of the environmental impacts be from these changes? 18
Interpreting land surface features. SWAC module 3
 Interpreting land surface features SWAC module 3 Interpreting land surface features SWAC module 3 Different kinds of image Panchromatic image True-color image False-color image EMR : NASA Echo the bat
Exploring the Earth with Remote Sensing: Tucson
 Exploring the Earth with Remote Sensing: Tucson Project ASTRO Chile March 2006 1. Introduction In this laboratory you will explore Tucson and its surroundings with remote sensing. Remote sensing is the
Sensors and Data Interpretation II. Michael Horswell
 Sensors and Data Interpretation II Michael Horswell Defining remote sensing 1. When was the last time you did any remote sensing? acquiring information about something without direct contact 2. What are
Image interpretation I and II
 Image interpretation I and II Looking at satellite image, identifying different objects, according to scale and associated information and to communicate this information to others is what we call as IMAGE
How can we "see" using the Infrared?
 The Infrared Infrared light lies between the visible and microwave portions of the electromagnetic spectrum. Infrared light has a range of wavelengths, just like visible light has wavelengths that range
Introduction to Remote Sensing
 Introduction to Remote Sensing Outline Remote Sensing Defined Resolution Electromagnetic Energy (EMR) Types Interpretation Applications Remote Sensing Defined Remote Sensing is: The art and science of
Visualizing a Pixel. Simulate a Sensor s View from Space. In this activity, you will:
 Simulate a Sensor s View from Space In this activity, you will: Measure and mark pixel boundaries Learn about spatial resolution, pixels, and satellite imagery Classify land cover types Gain exposure to
Introduction to Remote Sensing
 Introduction to Remote Sensing 1 Outline Remote Sensing Defined Electromagnetic Energy (EMR) Resolution Interpretation 2 Remote Sensing Defined Remote Sensing is: The art and science of obtaining information
Remote Sensing. in Agriculture. Dr. Baqer Ramadhan CRP 514 Geographic Information System. Adel M. Al-Rebh G Term Paper.
 Remote Sensing in Agriculture Term Paper to Dr. Baqer Ramadhan CRP 514 Geographic Information System By Adel M. Al-Rebh G199325390 May 2012 Table of Contents 1.0 Introduction... 4 2.0 Objective... 4 3.0
Outline Remote Sensing Defined Resolution Electromagnetic Energy (EMR) Types Interpretation Applications
 Types Interpretation Applications") Introduction to Remote Sensing Outline Remote Sensing Defined Resolution Electromagnetic Energy (EMR) Types Interpretation Applications Remote Sensing Defined Remote Sensing is: The art and science of
Introduction to Remote Sensing Outline Remote Sensing Defined Resolution Electromagnetic Energy (EMR) Types Interpretation Applications Remote Sensing Defined Remote Sensing is: The art and science of
Outline Remote Sensing Defined Resolution Electromagnetic Energy (EMR) Types Interpretation Applications 2
 Types Interpretation Applications 2") Introduction to Remote Sensing 1 Outline Remote Sensing Defined Resolution Electromagnetic Energy (EMR) Types Interpretation Applications 2 Remote Sensing Defined Remote Sensing is: The art and science
Introduction to Remote Sensing 1 Outline Remote Sensing Defined Resolution Electromagnetic Energy (EMR) Types Interpretation Applications 2 Remote Sensing Defined Remote Sensing is: The art and science
FOR 353: Air Photo Interpretation and Photogrammetry. Lecture 2. Electromagnetic Energy/Camera and Film characteristics
 FOR 353: Air Photo Interpretation and Photogrammetry Lecture 2 Electromagnetic Energy/Camera and Film characteristics Lecture Outline Electromagnetic Radiation Theory Digital vs. Analog (i.e. film ) Systems
The (False) Color World
 Color World") There s more to the world than meets the eye In this activity, your group will explore: The Value of False Color Images Different Types of Color Images The Use of Contextual Clues for Feature Identification
There s more to the world than meets the eye In this activity, your group will explore: The Value of False Color Images Different Types of Color Images The Use of Contextual Clues for Feature Identification
Chapter 9: Light, Colour and Radiant Energy. Passed a beam of white light through a prism.
 Chapter 9: Light, Colour and Radiant Energy Where is the colour in sunlight? In the 17 th century (1600 s), Sir Isaac Newton conducted a famous experiment. Passed a beam of white light through a prism.
Making NDVI Images using the Sony F717 Nightshot Digital Camera and IR Filters and Software Created for Interpreting Digital Images.
 Making NDVI Images using the Sony F717 Nightshot Digital Camera and IR Filters and Software Created for Interpreting Digital Images Draft 1 John Pickle Museum of Science October 14, 2004 Digital Cameras
Important Missions. weather forecasting and monitoring communication navigation military earth resource observation LANDSAT SEASAT SPOT IRS
 Fundamentals of Remote Sensing Pranjit Kr. Sarma, Ph.D. Assistant Professor Department of Geography Mangaldai College Email: prangis@gmail.com Ph. No +91 94357 04398 Remote Sensing Remote sensing is defined
2. Pixels and Colors. Introduction to Pixels. Chapter 2. Investigation Pixels and Digital Images
 2. Pixels and Colors Introduction to Pixels The term pixel is a truncation of the phrase picture element which is exactly what a pixel is. A pixel is the smallest block of color in a digital picture. The
earthobservation.wordpress.com
 Dirty REMOTE SENSING earthobservation.wordpress.com Stuart Green Teagasc Stuart.Green@Teagasc.ie 1 Purpose Give you a very basic skill set and software training so you can: find free satellite image data.
Fill in the blanks. Reading Skill: Compare and Contrast - questions 3, 17
 Light and Color Lesson 9 Fill in the blanks Reading Skill: Compare and Contrast - questions 3, 17 How Do You Get Color From White Light? 1 A(n) is a triangular piece of polished glass that refracts white
Psy 280 Fall 2000: Color Vision (Part 1) Oct 23, Announcements
 Oct 23, Announcements") Announcements 1. This week's topic will be COLOR VISION. DEPTH PERCEPTION will be covered next week. 2. All slides (and my notes for each slide) will be posted on the class web page at the end of the week.
Announcements 1. This week's topic will be COLOR VISION. DEPTH PERCEPTION will be covered next week. 2. All slides (and my notes for each slide) will be posted on the class web page at the end of the week.
Lecture 6 6 Color, Waves, and Dispersion Reading Assignment: Read Kipnis Chapter 7 Colors, Section I, II, III 6.1 Overview and History
 Lecture 6 6 Color, Waves, and Dispersion Reading Assignment: Read Kipnis Chapter 7 Colors, Section I, II, III 6.1 Overview and History In Lecture 5 we discussed the two different ways of talking about
An Introduction to Remote Sensing & GIS. Introduction
 An Introduction to Remote Sensing & GIS Introduction Remote sensing is the measurement of object properties on Earth s surface using data acquired from aircraft and satellites. It attempts to measure something
Enhancement of Multispectral Images and Vegetation Indices
 Enhancement of Multispectral Images and Vegetation Indices ERDAS Imagine 2016 Description: We will use ERDAS Imagine with multispectral images to learn how an image can be enhanced for better interpretation.
Module 3 Introduction to GIS. Lecture 8 GIS data acquisition
 Module 3 Introduction to GIS Lecture 8 GIS data acquisition GIS workflow Data acquisition (geospatial data input) GPS Remote sensing (satellites, UAV s) LiDAR Digitized maps Attribute Data Management Data
Figure 1: Percent reflectance for various features, including the five spectra from Table 1, at different wavelengths from 0.4µm to 1.4µm.
 Section 1: The Electromagnetic Spectrum 1. The wavelength range that has the highest reflectance for broadleaf vegetation and needle leaf vegetation is 0.75µm to 1.05µm. 2. Dry soil can be distinguished
Introduction to Remote Sensing
 Introduction to Remote Sensing Spatial, spectral, temporal resolutions Image display alternatives Vegetation Indices Image classifications Image change detections Accuracy assessment Satellites & Air-Photos
Geo/SAT 2 INTRODUCTION TO REMOTE SENSING
 Geo/SAT 2 INTRODUCTION TO REMOTE SENSING Paul R. Baumann, Professor Emeritus State University of New York College at Oneonta Oneonta, New York 13820 USA COPYRIGHT 2008 Paul R. Baumann Introduction Remote
Remote Sensing in an
 Chapter 11: Creating a Composite Image from Landsat Imagery Remote Sensing in an ArcMap Environment Remote Sensing Analysis in an ArcMap Environment Tammy E. Parece Image source: landsat.usgs.gov Tammy
Smithsonian. Reflections National Earth: AirExploring and Space Planet Earth Museu from Space program is made possible by support from Honda.
 Smithsonian Reflections National Earth: AirExploring and Space Planet Earth Museu from Space program is made possible by support from Honda. Reflections on Earth: Exploring Planet Earth from Space Reflections
First Exam: Thurs., Sept 28
 8 Geographers Tools: Gathering Information Prof. Anthony Grande Hunter College Geography Lecture design, content and presentation AFG 0917. Individual images and illustrations may be subject to prior copyright.
REMOTE SENSING HYDROLOGY 2012 EVENT TRAINING POWERPOINT
 REMOTE SENSING HYDROLOGY 2012 EVENT TRAINING POWERPOINT PRESENTED BY: MARK A. VAN HECKE NATIONAL SCIENCE OLYMPIAD EARTH-SPACE SCIENCE EVENTS CHAIR/EVENT TRAINER SENIOR SOCIAL STUDIES INSTRUCTOR INSTRUCTIONAL
Crop Scouting with Drones Identifying Crop Variability with UAVs
 DroneDeploy Crop Scouting with Drones Identifying Crop Variability with UAVs A Guide to Evaluating Plant Health and Detecting Crop Stress with Drone Data Table of Contents 01 Introduction Crop Scouting
Using Color-Infrared Imagery for Impervious Surface Analysis. Chris Behee City of Bellingham Planning & Community Development
 Using Color-Infrared Imagery for Impervious Surface Analysis. Chris Behee City of Bellingham Planning & Community Development NW GIS Users Group - March 18, 2005 Outline What is Color Infrared Imagery?
APCAS/10/21 April 2010 ASIA AND PACIFIC COMMISSION ON AGRICULTURAL STATISTICS TWENTY-THIRD SESSION. Siem Reap, Cambodia, April 2010
 APCAS/10/21 April 2010 Agenda Item 8 ASIA AND PACIFIC COMMISSION ON AGRICULTURAL STATISTICS TWENTY-THIRD SESSION Siem Reap, Cambodia, 26-30 April 2010 The Use of Remote Sensing for Area Estimation by Robert
Present and future of marine production in Boka Kotorska
 Present and future of marine production in Boka Kotorska First results from satellite remote sensing for the breeding areas of filter feeders in the Bay of Kotor INTRODUCTION Environmental monitoring is
Center for Advanced Land Management Information Technologies (CALMIT), School of Natural Resources, University of Nebraska-Lincoln
, School of Natural Resources, University of Nebraska-Lincoln") Geoffrey M. Henebry, Andrés Viña, and Anatoly A. Gitelson Center for Advanced Land Management Information Technologies (CALMIT), School of Natural Resources, University of Nebraska-Lincoln Introduction
Geoffrey M. Henebry, Andrés Viña, and Anatoly A. Gitelson Center for Advanced Land Management Information Technologies (CALMIT), School of Natural Resources, University of Nebraska-Lincoln Introduction
Land Cover Change Analysis An Introduction to Land Cover Change Analysis using the Multispectral Image Data Analysis System (MultiSpec )
") Land Cover Change Analysis An Introduction to Land Cover Change Analysis using the Multispectral Image Data Analysis System (MultiSpec ) Level: Grades 9 to 12 Windows version With Teacher Notes Earth Observation
Land Cover Change Analysis An Introduction to Land Cover Change Analysis using the Multispectral Image Data Analysis System (MultiSpec ) Level: Grades 9 to 12 Windows version With Teacher Notes Earth Observation
Lecture 13: Remotely Sensed Geospatial Data
 Lecture 13: Remotely Sensed Geospatial Data A. The Electromagnetic Spectrum: The electromagnetic spectrum (Figure 1) indicates the different forms of radiation (or simply stated light) emitted by nature.
746A27 Remote Sensing and GIS
 746A27 Remote Sensing and GIS Lecture 1 Concepts of remote sensing and Basic principle of Photogrammetry Chandan Roy Guest Lecturer Department of Computer and Information Science Linköping University What
How to Access Imagery and Carry Out Remote Sensing Analysis Using Landsat Data in a Browser
 How to Access Imagery and Carry Out Remote Sensing Analysis Using Landsat Data in a Browser Including Introduction to Remote Sensing Concepts Based on: igett Remote Sensing Concept Modules and GeoTech
Unit 1.5 Waves. The number waves per second. 1 Hz is 1waves per second. If there are 40 waves in 10 seconds then the frequency is 4 Hz.
 Unit 1.5 Waves Basic information Transverse: The oscillations of the particles are at right angles (90 ) to the direction of travel (propagation) of the wave. Examples: All electromagnetic waves (Light,
Chapter 1 Overview of imaging GIS
 Chapter 1 Overview of imaging GIS Imaging GIS, a term used in the medical imaging community (Wang 2012), is adopted here to describe a geographic information system (GIS) that displays, enhances, and facilitates
An NDVI image provides critical crop information that is not visible in an RGB or NIR image of the same scene. For example, plants may appear green
 Normalized Difference Vegetation Index (NDVI) Spectral Band calculation that uses the visible (RGB) and near-infrared (NIR) bands of the electromagnetic spectrum NDVI= + An NDVI image provides critical
Monitoring agricultural plantations with remote sensing imagery
 MPRA Munich Personal RePEc Archive Monitoring agricultural plantations with remote sensing imagery Camelia Slave and Anca Rotman University of Agronomic Sciences and Veterinary Medicine - Bucharest Romania,
Satellite Imagery and Remote Sensing. DeeDee Whitaker SW Guilford High EES & Chemistry
 Satellite Imagery and Remote Sensing DeeDee Whitaker SW Guilford High EES & Chemistry whitakd@gcsnc.com Outline What is remote sensing? How does remote sensing work? What role does the electromagnetic
MODULE P6: THE WAVE MODEL OF RADIATION OVERVIEW
 OVERVIEW Wave behaviour explains a great many phenomena, both natural and artificial, for all waves have properties in common. The first topic introduces a basic vocabulary for describing waves. Reflections
Section Electromagnetic Waves and the Electromagnetic Spectrum
 Section 17.6 Electromagnetic Waves and the Electromagnetic Spectrum Electromagnetic Waves Can you name all the colors of the rainbow? Red, Orange, Yellow, Green, Blue, Indigo, Violet Electromagnetic Waves
Apply Colour Sequences to Enhance Filter Results. Operations. What Do I Need? Filter
 Apply Colour Sequences to Enhance Filter Results Operations What Do I Need? Filter Single band images from the SPOT and Landsat platforms can sometimes appear flat (i.e., they are low contrast images).
17-1 Electromagnetic Waves
 17-1 Electromagnetic Waves transfers energy called electromagnetic radiation no medium needed transverse some electrical, some magnetic properties speed is 300,000,000 m/s; nothing is faster; at this speed
First Exam. Geographers Tools: Gathering Information. Photographs and Imagery. SPIN 2 Image of Downtown Atlanta, GA 1995 REMOTE SENSING 9/19/2016
 First Exam Geographers Tools: Gathering Information Prof. Anthony Grande Hunter College Geography Lecture design, content and presentation AFG 0616. Individual images and illustrations may be subject to
UNIT 3 LIGHT AND SOUND
 NIT 3 LIGHT AND SOUND Primary Colours Luminous Sources of Light Colours sources is divided Secondary Colours includes Illıminated Sources of Light LIGHT Illumination is form Travels in Spaces Shadow Reflection
Using Multi-spectral Imagery in MapInfo Pro Advanced
 Using Multi-spectral Imagery in MapInfo Pro Advanced MapInfo Pro Advanced Tom Probert, Global Product Manager MapInfo Pro Advanced: Intuitive interface for using multi-spectral / hyper-spectral imagery
Remote Sensing. The following figure is grey scale display of SPOT Panchromatic without stretching.
 Remote Sensing Objectives This unit will briefly explain display of remote sensing image, geometric correction, spatial enhancement, spectral enhancement and classification of remote sensing image. At
Contents Remote Sensing for Studying Earth Surface and Changes
 Contents Remote Sensing for Studying Earth Surface and Changes Anupma Prakash Day : Tuesday Date : September 26, 2008 Audience : AMIDST Participants What is remote sensing? How does remote sensing work?
Test 1: Example #2. Paul Avery PHY 3400 Feb. 15, Note: * indicates the correct answer.
 Test 1: Example #2 Paul Avery PHY 3400 Feb. 15, 1999 Note: * indicates the correct answer. 1. A red shirt illuminated with yellow light will appear (a) orange (b) green (c) blue (d) yellow * (e) red 2.
Name: Date: Block: Light Unit Study Guide Matching Match the correct definition to each term. 1. Waves
 Name: Date: Block: Light Unit Study Guide Matching Match the correct definition to each term. 1. Waves 2. Medium 3. Mechanical waves 4. Longitudinal waves 5. Transverse waves 6. Frequency 7. Reflection
Make a Refractor Telescope
 Make a Refractor Telescope In this activity students will build, and observe with, simple refractory telescope providing an interactive introduction to light, lenses and refraction. LEARNING OBJECTIVES
WATCHING OVER OUR PLANET FROM SPACE
 3.10 Land Use Mapping City planners need to know which areas of a city are used for which purpose. Therefore, they produce a map of land use, that identifies parts of a city and the major activities (land
Conceptual Physics Fundamentals
 Conceptual Physics Fundamentals Chapter 13: LIGHT WAVES This lecture will help you understand: Electromagnetic Spectrum Transparent and Opaque Materials Color Why the Sky is Blue, Sunsets are Red, and
Govt. Engineering College Jhalawar Model Question Paper Subject- Remote Sensing & GIS
 Govt. Engineering College Jhalawar Model Question Paper Subject- Remote Sensing & GIS Time: Max. Marks: Q1. What is remote Sensing? Explain the basic components of a Remote Sensing system. Q2. What is
NRS 415 Remote Sensing of Environment
 NRS 415 Remote Sensing of Environment 1 High Oblique Perspective (Side) Low Oblique Perspective (Relief) 2 Aerial Perspective (See What s Hidden) An example of high spatial resolution true color remote
Wonderlab The Statoil Gallery
 Wonderlab The Statoil Gallery and maths s Age (s) Topic 7 11 LIGHT INFORMATION 11-14 Location WONDERLAB: THE STATOIL GALLERY LEVEL 3, SCIENCE MUSEUM LONDON 1 What s the science? What more will you wonder?
Grades 3-7. Light Learning Lapbook with Study Guide. Sample Page. A Journey Through Learning
 T Grades 3-7 Light Learning Lapbook with Study Guide A Journey Through Learning www.ajourneythroughlearning.com Authors-Paula Winget and Nancy Fileccia Copyright 2014 A Journey Through Learning Pages may
Introductory Physics, High School Learning Standards for a Full First-Year Course
 Introductory Physics, High School Learning Standards for a Full First-Year Course I. C ONTENT S TANDARDS 4.1 Describe the measurable properties of waves (velocity, frequency, wavelength, amplitude, period)
First Exam: New Date. 7 Geographers Tools: Gathering Information. Photographs and Imagery REMOTE SENSING 2/23/2018. Friday, March 2, 2018.
 First Exam: New Date Friday, March 2, 2018. Combination of multiple choice questions and map interpretation. Bring a #2 pencil with eraser. Based on class lectures supplementing chapter 1. Review lecture
Term Info Picture. A wave that has both electric and magnetic fields. They travel through empty space (a vacuum).
.") Waves S8P4. Obtain, evaluate, and communicate information to support the claim that electromagnetic (light) waves behave differently than mechanical (sound) waves. A. Ask questions to develop explanations
Waves S8P4. Obtain, evaluate, and communicate information to support the claim that electromagnetic (light) waves behave differently than mechanical (sound) waves. A. Ask questions to develop explanations
Exercise 4-1 Image Exploration
 Exercise 4-1 Image Exploration With this exercise, we begin an extensive exploration of remotely sensed imagery and image processing techniques. Because remotely sensed imagery is a common source of data
Land Cover Analysis to Determine Areas of Clear-cut and Forest Cover in Olney, Montana. Geob 373 Remote Sensing. Dr Andreas Varhola, Kathry De Rego
 1 Land Cover Analysis to Determine Areas of Clear-cut and Forest Cover in Olney, Montana Geob 373 Remote Sensing Dr Andreas Varhola, Kathry De Rego Zhu an Lim (14292149) L2B 17 Apr 2016 2 Abstract Montana
Reflection and Color
 CHAPTER 16 13 SECTION Sound and Light Reflection and Color KEY IDEAS As you read this section, keep these questions in mind: What happens to light when it hits an object? Why can you see an image in a?
1. Theory of remote sensing and spectrum
 1. Theory of remote sensing and spectrum 7 August 2014 ONUMA Takumi Outline of Presentation Electromagnetic wave and wavelength Sensor type Spectrum Spatial resolution Spectral resolution Mineral mapping
746A27 Remote Sensing and GIS. Multi spectral, thermal and hyper spectral sensing and usage
 746A27 Remote Sensing and GIS Lecture 3 Multi spectral, thermal and hyper spectral sensing and usage Chandan Roy Guest Lecturer Department of Computer and Information Science Linköping University Multi
Light waves interact with materials.
 Page of 7 KEY CONCEPT Light waves interact with materials. BEFORE, you learned Mechanical waves respond to a change in medium Visible light is made up of EM waves EM waves interact with a new medium in
Sommersemester Prof. Dr. Christoph Kleinn Institut für Waldinventur und Waldwachstum Arbeitsbereich Fernerkundung und Waldinventur.
 Basics of Remote Sensing Some literature references Franklin, SE 2001 Remote Sensing for Sustainable Forest Management Lewis Publishers 407p Lillesand, Kiefer 2000 Remote Sensing and Image Interpretation
Electromagnetic Spectrum
 Electromagnetic Spectrum Wave - Review Waves are oscillations that transport energy. 2 Types of waves: Mechanical waves that require a medium to travel through (sound, water, earthquakes) Electromagnetic
Ground Truth for Calibrating Optical Imagery to Reflectance
 Visual Information Solutions Ground Truth for Calibrating Optical Imagery to Reflectance The by: Thomas Harris Whitepaper Introduction: Atmospheric Effects on Optical Imagery Remote sensing of the Earth
Conceptual Physics 11 th Edition
 Conceptual Physics 11 th Edition Chapter 27: COLOR This lecture will help you understand: Color in Our World Selective Reflection Selective Transmission Mixing Colored Light Mixing Colored Pigments Why
Electromagnetic Waves
 Chapter 13 Electromagnetic Waves 13.1 Gamma Rays Gamma rays have a very short wavelength and are very penetrating. They are produced by radioactive substances and are very dangerous to humans unless used
Spectral and Polarization Configuration Guide for MS Series 3-CCD Cameras
 Spectral and Polarization Configuration Guide for MS Series 3-CCD Cameras Geospatial Systems, Inc (GSI) MS 3100/4100 Series 3-CCD cameras utilize a color-separating prism to split broadband light entering
FOR 474: Forest Inventory. FOR 474: Forest Inventory. Why do we Care About Forest Sampling?
 FOR 474: Forest Inventory 1. Advanced Forest Inventory The Need for Forest Sampling Brief Intro to Remote Sensing and GIS Readings: FOR 474: Forest Inventory Related Courses! FOR 274: Forest Measurements
Introduction. Introduction. Introduction. Introduction. Introduction
 Identifying habitat change and conservation threats with satellite imagery Extinction crisis Volker Radeloff Department of Forest Ecology and Management Extinction crisis Extinction crisis Conservationists
Section 1: Sound. Sound and Light Section 1
 Sound and Light Section 1 Section 1: Sound Preview Key Ideas Bellringer Properties of Sound Sound Intensity and Decibel Level Musical Instruments Hearing and the Ear The Ear Ultrasound and Sonar Sound
REMOTE SENSING. Topic 10 Fundamentals of Digital Multispectral Remote Sensing MULTISPECTRAL SCANNERS MULTISPECTRAL SCANNERS
 REMOTE SENSING Topic 10 Fundamentals of Digital Multispectral Remote Sensing Chapter 5: Lillesand and Keifer Chapter 6: Avery and Berlin MULTISPECTRAL SCANNERS Record EMR in a number of discrete portions
2017 REMOTE SENSING EVENT TRAINING STRATEGIES 2016 SCIENCE OLYMPIAD COACHING ACADEMY CENTERVILLE, OH
 2017 REMOTE SENSING EVENT TRAINING STRATEGIES 2016 SCIENCE OLYMPIAD COACHING ACADEMY CENTERVILLE, OH This presentation was prepared using draft rules. There may be some changes in the final copy of the
CHARACTERISTICS OF REMOTELY SENSED IMAGERY. Spatial Resolution
 CHARACTERISTICS OF REMOTELY SENSED IMAGERY Spatial Resolution There are a number of ways in which images can differ. One set of important differences relate to the various resolutions that images express.
Light Energy. By: Genevieve Rickey 5th Grade Mrs. Branin 2016
 Light Energy By: Genevieve Rickey 5th Grade Mrs. Branin 2016 Everyone has probably turned on a light before, but have you ever thought about what light is? Light is a form of energy that is reflected from
Remote Sensing for Rangeland Applications
 Remote Sensing for Rangeland Applications Jay Angerer Ecological Training June 16, 2012 Remote Sensing The term "remote sensing," first used in the United States in the 1950s by Ms. Evelyn Pruitt of the
Introduction to Remote Sensing Part 1
 Introduction to Remote Sensing Part 1 A Primer on Electromagnetic Radiation Digital, Multi-Spectral Imagery The 4 Resolutions Displaying Images Corrections and Enhancements Passive vs. Active Sensors Radar
Notes: Light and Optics. Reflection. Refraction. Law of Reflection. Light goes straight 12/13/2012
 Notes: Light and Optics Light goes straight Light travels in a straight line unless it interacts with a medium. The material through which a wave travels is called a medium. Light can be reflected, refracted
What Eyes Can See How Do You See What You See?
 Light Waves 2015 The Regents of the University of California Permission granted to purchaser to photocopy for classroom use. Image Credit: Shutterstock Animals eyes can look very different on the outside,
Measurement and Measurement Error of Light Used for Photosynthesis & Plant Growth Richard Garcia April 20, 2010
 TRANSCRIPT SLIDE 1 [00:01] Thanks Ashlee, good afternoon from LI-COR Biosciences here in Lincoln, Nebraska. Thanks for joining us. Probably the most important process on our planet, is Photosynthesis and
Saturation And Value Modulation (SVM): A New Method For Integrating Color And Grayscale Imagery
: A New Method For Integrating Color And Grayscale Imagery") 87 Saturation And Value Modulation (SVM): A New Method For Integrating Color And Grayscale Imagery By David W. Viljoen 1 and Jeff R. Harris 2 Geological Survey of Canada 615 Booth St. Ottawa, ON, K1A 0E9
87 Saturation And Value Modulation (SVM): A New Method For Integrating Color And Grayscale Imagery By David W. Viljoen 1 and Jeff R. Harris 2 Geological Survey of Canada 615 Booth St. Ottawa, ON, K1A 0E9
Mod. 2 p. 1. Prof. Dr. Christoph Kleinn Institut für Waldinventur und Waldwachstum Arbeitsbereich Fernerkundung und Waldinventur
 Histograms of gray values for TM bands 1-7 for the example image - Band 4 and 5 show more differentiation than the others (contrast=the ratio of brightest to darkest areas of a landscape). - Judging from
Color Studies for Kids
 Color Studies for Kids By C.L. Swanner 2011 C.L. Swanner All rights reserved. Special Thanks To: God, who designed me with a great love for His creation and gave me the ability to explore His creation
1. Start a bit about Linux
 GEOG432/632 Fall 2017 Lab 1 Display, Digital numbers and Histograms 1. Start a bit about Linux Login to the linux environment you already have in order to view this webpage Linux enables both a command
An Introduction to Geomatics. Prepared by: Dr. Maher A. El-Hallaq خاص بطلبة مساق مقدمة في علم. Associate Professor of Surveying IUG
 An Introduction to Geomatics خاص بطلبة مساق مقدمة في علم الجيوماتكس Prepared by: Dr. Maher A. El-Hallaq Associate Professor of Surveying IUG 1 Airborne Imagery Dr. Maher A. El-Hallaq Associate Professor
Due Date: September 22
 Geography 309 Lab 1 Page 1 LAB 1: INTRODUCTION TO REMOTE SENSING Due Date: September 22 Objectives To familiarize yourself with: o remote sensing resources on the Internet o some remote sensing sensors
In late April of 1986 a nuclear accident damaged a reactor at the Chernobyl nuclear
 CHERNOBYL NUCLEAR POWER PLANT ACCIDENT Long Term Effects on Land Use Patterns Project Introduction: In late April of 1986 a nuclear accident damaged a reactor at the Chernobyl nuclear power plant in Ukraine.
Longitudinal No, Mechanical wave ~340 m/s (in air) 1,100 feet per second More elastic/denser medium = Greater speed of sound
 1,100 feet per second More elastic/denser medium = Greater speed of sound") Type of wave Travel in Vacuum? Speed Speed vs. Medium Light Sound vs. Sound Longitudinal No, Mechanical wave ~340 m/s (in air) 1,100 feet per second More elastic/denser medium = Greater speed of sound
Type of wave Travel in Vacuum? Speed Speed vs. Medium Light Sound vs. Sound Longitudinal No, Mechanical wave ~340 m/s (in air) 1,100 feet per second More elastic/denser medium = Greater speed of sound
Remote Sensing Part 3 Examples & Applications
 Remote Sensing Part 3 Examples & Applications Review: Spectral Signatures Review: Spectral Resolution Review: Computer Display of Remote Sensing Images Individual bands of satellite data are mapped to
IR Remote Control. Jeffrey La Favre. January 26, 2015
 1 IR Remote Control Jeffrey La Favre January 26, 2015 Do you have a remote control for your television at home? If you do, it is probably an infrared remote (IR). When you push a button on the IR remote,