Honors Statistics. Daily Agenda
|
|
|
- Megan Byrd
- 5 years ago
- Views:
Transcription

1 Honors Statistics Aug 23-8:26 PM Daily Agenda 1. Check homework C4#2 Aug 23-8:31 PM 1


2 Apr 6-9:53 AM All the artifacts discovered at the dig. Actual Population - Due to the random sampling... All the artifacts discovered at the dig. The 2% of the artifacts randomly chosen from those discovered at the dig. Oct 26-2:42 PM 2


3 The 1000 envelopes stuffed by the automated machine each hour. Actual Population - Due to the random sampling... All of the 1000 the envelopes. The 40 envelopes sampled at random from the Oct 26-2:55 PM The 45,000 people who made credit card purchases at the department store. Actual Population - Due to the random sampling... All the 45,000 people. Sample - Sadly only the 137 people who returned the survey. BIAS SAMPLE WHY? Oct 26-2:56 PM 3


4 I am not convinced that a majority of the voters oppose the bill. This is a voluntary sample of her constituents. I would explain to the congresswoman that because of the voluntary nature of the sample there is a bias present. Usually people with strong opinions are the ones motivated to write to their representatives. This sample systematically favors the "oppose" opinion and should not be used to judge the true beliefs of her constituents. Oct 26-2:56 PM This is a voluntary response sample and it will over represent the opinions of those who feel most strongly about the issue being surveyed. Perhaps it was a poll posed just after a woman's professional sports win, a very exciting game so many were thinking about this event and thus in favor of equal pay. Oct 26-2:56 PM 4


5 This is a convenience sample and it will represent the opinions of those who were If it was during daytime shopping hours then it could over-represent those who do not have a job and have more time to shop than those who are employed. Oct 26-2:56 PM This is a convenience sample and it will represent the opinions of those who were available for the survey, the students who were first to arrive at school. This sample is biased because it will over represent the students who arrived at school first. Perhaps these students needed to get up earlier than the rest and so they did not get as much sleep than the others. 7.2 is less than the average. Oct 26-2:56 PM 5


6 This is a voluntary response sample. This sample is biased because it will over represent those with strong opinions on the cell phone issue. Probably people who have been in an accident caused by cell phone use. I believe that 85% is probably higher than the true population percent of all adults who believe that cell phone used while driving should be banned. Sadly, many people still use their cell phones while driving. Oct 26-2:56 PM Name the undesirable methods used to obtain a sample from a population. Oct 26-4:55 PM 6


7 Nov 7-10:17 AM Oct 26-4:54 PM 7
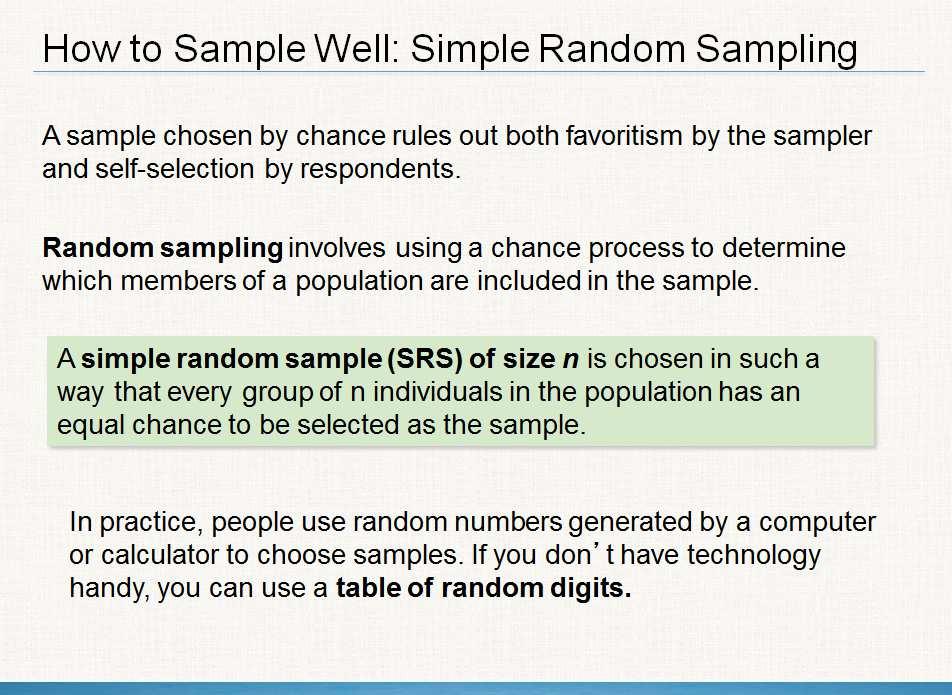
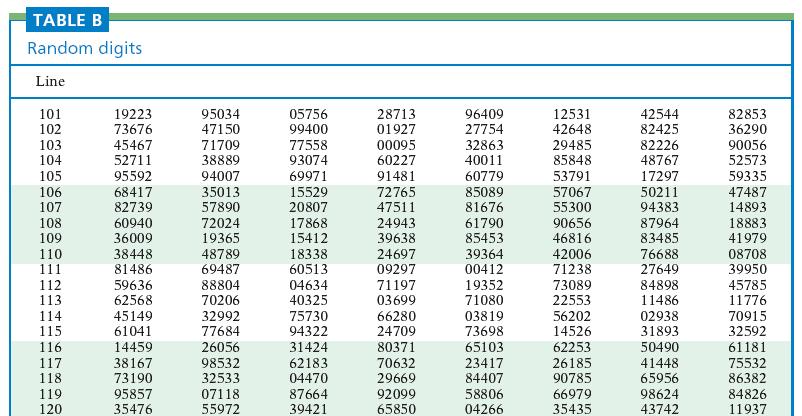
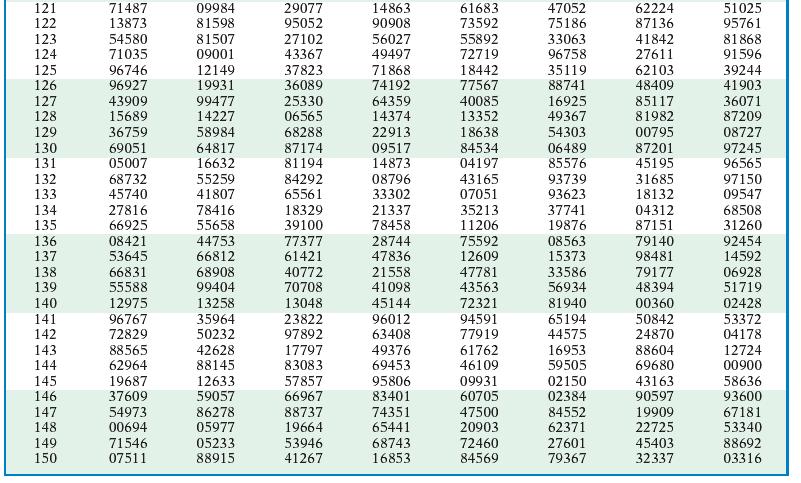
8 involves studying a part in order to gain information about the whole. Sampling Frame methods of sampling probability sampling simple random sampling (SRS) stratified random sampling cluster sampling systematic random sampling multistage sampling voluntary response convenience sample A sampling frame is the LIST of individuals from which a sample is selected. This list should include all of the intended population of interest. Apr 5-5:13 PM Picking a Sample... Names out of a hat Label Random Rules Identify Oct 27-3:08 PM 8

9 Oct 26-5:04 PM Do different sizes of tickets example with class. Is this fair? Mar 12-11:13 AM 9


10 Oct 31-12:19 PM Mar 17-9:33 AM 10


11 Nov 1-7:33 PM Oct 31-12:11 PM 11


12 Example on page 217 Label: Identify sample: Oct 26-5:09 PM Using Technology Seed Calculator first 323 Rand Identify Oct 26-5:11 PM 12
 do not use repeats Mar 12-10:54 AM Suppose that your")
13 Using the calculator to select random numbers. Choose a unique number between 5439 and 9127 Seed the calculator your number rand choose the sample of 5 words using the command randint (1,130,1) do not use repeats Mar 12-10:54 AM Suppose that your are a regional manager in charge of all the WalMart stores in NYC that sells your company's LABEL: (N) STOPPING PROCEDURE: Apr 5-5:16 PM 13


14 117 Rand Identify Oct 26-5:11 PM Oct 26-5:17 PM 14


15 First "random" sample Circle 5 random words. Oct 27-3:45 PM Oct 24-7:24 AM 15
16 Using a random digit table to select random numbers. We must think of the numbers as three digits 001 to 130 Pick a random starting place... choose the sample of 5 words by "peeling off" three digits at a time. Only keep 3 digit numbers between 001 and 130, do not keep repeats. Mar 12-10:54 AM Oct 31-12:11 PM 16

17 Oct 28-3:05 PM Block 3 Student Sample Random Sample Random Sample Oct 27-3:19 PM 17

18 Block 1 Student Sample Random Sample Random Sample Oct 27-3:19 PM Type of sampling method? LABEL: TABLE: STOPPING PROCEDURE: IDENTIFY SAMPLE: LABEL: TABLE: STOPPING PROCEDURE: IDENTIFY SAMPLE: Apr 5-5:25 PM 18
19 Put numbers on homework tables of names line 107 QUIZ ON CHAPTER 4 SECTION 2 NOTES MONDAY Apr 6-9:53 AM 19
Honors Statistics. Daily Agenda
 Honors Statistics Aug 23-8:26 PM Daily Agenda 3. Check homework C4#2 Aug 23-8:31 PM 1 Mar 12-12:06 PM Apr 6-9:53 AM 2 All the artifacts discovered at the dig. Actual Population - Due to the random sampling...
Chapter 8. Producing Data: Sampling. BPS - 5th Ed. Chapter 8 1
 Chapter 8 Producing Data: Sampling BPS - 5th Ed. Chapter 8 1 Population and Sample Researchers often want to answer questions about some large group of individuals (this group is called the population)
3. Data and sampling. Plan for today
 3. Data and sampling Business Statistics Plan for today Reminders and introduction Data: qualitative and quantitative Quantitative data: discrete and continuous Qualitative data discussion Samples and
Chapter 3 Monday, May 17th
 Chapter 3 Monday, May 17 th Surveys The reason we are doing surveys is because we are curious of what other people believe, or what customs other people p have etc But when we collect the data what are
b. Stopping students on their way out of the cafeteria is a good way to sample if we want to know about the quality of the food there.
 Chapter 12 Sample Surveys Look at Just Checking on page 273. Various claims are made for surveys. Why is each of the following claims not correct? a. It is always better to take a census than to draw a
Sample Surveys. Chapter 11
 Sample Surveys Chapter 11 Objectives Population Sample Sample survey Bias Randomization Sample size Census Parameter Statistic Simple random sample Sampling frame Stratified random sample Cluster sample
Stat Sampling. Section 1.2: Sampling. What about a census? Idea 1: Examine a part of the whole.
 Section 1.2: Sampling Idea 1: Examine a part of the whole. Population Sample 1 Idea 1: Examine a part of the whole. e.g. Population Entire group of individuals that we want to make a statement about. Sample
Basic Practice of Statistics 7th
 Basic Practice of Statistics 7th Edition Lecture PowerPoint Slides In Chapter 8, we cover Population versus sample How to sample badly Simple random samples Inference about the population Other sampling
Other Effective Sampling Methods
 Other Effective Sampling Methods MATH 130, Elements of Statistics I J. Robert Buchanan Department of Mathematics Fall 2018 Stratified Sampling Definition A stratified sample is obtained by separating the
Stats: Modeling the World. Chapter 11: Sample Surveys
 Stats: Modeling the World Chapter 11: Sample Surveys Sampling Methods: Sample Surveys Sample Surveys: A study that asks questions of a small group of people in the hope of learning something about the
Chapter 12 Summary Sample Surveys
 Chapter 12 Summary Sample Surveys What have we learned? A representative sample can offer us important insights about populations. o It s the size of the same, not its fraction of the larger population,
AP Statistics S A M P L I N G C H A P 11
 AP Statistics 1 S A M P L I N G C H A P 11 The idea that the examination of a relatively small number of randomly selected individuals can furnish dependable information about the characteristics of a
MAT 1272 STATISTICS LESSON STATISTICS AND TYPES OF STATISTICS
 MAT 1272 STATISTICS LESSON 1 1.1 STATISTICS AND TYPES OF STATISTICS WHAT IS STATISTICS? STATISTICS STATISTICS IS THE SCIENCE OF COLLECTING, ANALYZING, PRESENTING, AND INTERPRETING DATA, AS WELL AS OF MAKING
Population vs. Sample
 Population vs. Sample We draw samples from a population because we are interested in inferring something about the population based on the sample. We sample when a census is impractical. In order to draw
March 10, Monday, March 10th. 1. Bell Work: Week #5 OAA. 2. Vocabulary: Sampling Ch. 9-1 MB pg Notes/Examples: Sampling Ch.
 Monday, March 10th 1. Bell Work: Week #5 OAA 2. Vocabulary: Sampling Ch. 9-1 MB pg. 462 3. Notes/Examples: Sampling Ch. 9-1 1. Bell Work: Students' Lesson HeightsObjective: Students 2. Vocabulary: will
Sample Surveys. Sample Surveys. Al Nosedal. University of Toronto. Summer 2017
 Al Nosedal. University of Toronto. Summer 2017 My momma always said: Life was like a box of chocolates. You never know what you re gonna get. Forrest Gump. Population, Sample, Sampling Design The population
Polls, such as this last example are known as sample surveys.
 Chapter 12 Notes (Sample Surveys) In everything we have done thusfar, the data were given, and the subsequent analysis was exploratory in nature. This type of statistical analysis is known as exploratory
Objectives. Module 6: Sampling
 Module 6: Sampling 2007. The World Bank Group. All rights reserved. Objectives This session will address - why we use sampling - how sampling can create efficiencies for data collection - sampling techniques,
Class 10: Sampling and Surveys (Text: Section 3.2)
") Class 10: Sampling and Surveys (Text: Section 3.2) Populations and Samples If we talk to everyone in a population, we have taken a census. But this is often impractical, so we take a sample instead. We
Class 10: Sampling and Surveys (Text: Section 3.2) Populations and Samples If we talk to everyone in a population, we have taken a census. But this is often impractical, so we take a sample instead. We
STA 218: Statistics for Management
 Al Nosedal. University of Toronto. Fall 2017 My momma always said: Life was like a box of chocolates. You never know what you re gonna get. Forrest Gump. Population, Sample, Sampling Design The population
Chapter 12: Sampling
 Chapter 12: Sampling In all of the discussions so far, the data were given. Little mention was made of how the data were collected. This and the next chapter discuss data collection techniques. These methods
POLI 300 PROBLEM SET #2 10/04/10 SURVEY SAMPLING: ANSWERS & DISCUSSION
 POLI 300 PROBLEM SET #2 10/04/10 SURVEY SAMPLING: ANSWERS & DISCUSSION Once again, the A&D answers are considerably more detailed and discursive than those you were expected to provide. This is typical
Stat472/572 Sampling: Theory and Practice Instructor: Yan Lu Albuquerque, UNM
 Stat472/572 Sampling: Theory and Practice Instructor: Yan Lu Albuquerque, UNM 1 Chapter 1: Introduction Three Elements of Statistical Study: Collecting Data: observational data, experimental data, survey
Full file at
 Chapter 2 Data Collection 2.1 Observation single data point. Variable characteristic about an individual. 2.2 Answers will vary. 2.3 a. categorical b. categorical c. discrete numerical d. continuous numerical
Sampling Terminology. all possible entities (known or unknown) of a group being studied. MKT 450. MARKETING TOOLS Buyer Behavior and Market Analysis
 of a group being studied. MKT 450. MARKETING TOOLS Buyer Behavior and Market Analysis") Sampling Terminology MARKETING TOOLS Buyer Behavior and Market Analysis Population all possible entities (known or unknown) of a group being studied. Sampling Procedures Census study containing data from
Sampling Terminology MARKETING TOOLS Buyer Behavior and Market Analysis Population all possible entities (known or unknown) of a group being studied. Sampling Procedures Census study containing data from
Gathering information about an entire population often costs too much or is virtually impossible.
 Sampling Gathering information about an entire population often costs too much or is virtually impossible. Instead, we use a sample of the population. A sample should have the same characteristics as the
CHAPTER 8: Producing Data: Sampling
 CHAPTER 8: Producing Data: Sampling The Basic Practice of Statistics 6 th Edition Moore / Notz / Fligner Lecture PowerPoint Slides Chapter 8 Concepts 2 Population vs. Sample How to Sample Badly Simple
4.1: Samples & Surveys. Mrs. Daniel AP Stats
 4.1: Samples & Surveys Mrs. Daniel AP Stats Section 4.1 Samples and Surveys After this section, you should be able to IDENTIFY the population and sample in a sample survey IDENTIFY voluntary response samples
Unit 8: Sample Surveys
 Unit 8: Sample Surveys Marius Ionescu 10/27/2011 Marius Ionescu () Unit 8: Sample Surveys 10/27/2011 1 / 13 Chapter 19: Surveys Why take a survey? Marius Ionescu () Unit 8: Sample Surveys 10/27/2011 2
There is no class tomorrow! Have a good weekend! Scores will be posted in Compass early Friday morning J
 STATISTICS 100 EXAM 3 Fall 2016 PRINT NAME (Last name) (First name) *NETID CIRCLE SECTION: L1 12:30pm L2 3:30pm Online MWF 12pm Write answers in appropriate blanks. When no blanks are provided CIRCLE your
Introduction. Descriptive Statistics. Problem Solving. Inferential Statistics. Chapter1 Slides. Maurice Geraghty
 Inferential Statistics and Probability a Holistic Approach Chapter 1 Displaying and Analyzing Data with Graphs This Course Material by Maurice Geraghty is licensed under a Creative Commons Attribution-ShareAlike
a) Getting 10 +/- 2 head in 20 tosses is the same probability as getting +/- heads in 320 tosses
 Getting 10 +/- 2 head in 20 tosses is the same probability as getting +/- heads in 320 tosses") Question 1 pertains to tossing a fair coin (8 pts.) Fill in the blanks with the correct numbers to make the 2 scenarios equally likely: a) Getting 10 +/- 2 head in 20 tosses is the same probability as
Question 1 pertains to tossing a fair coin (8 pts.) Fill in the blanks with the correct numbers to make the 2 scenarios equally likely: a) Getting 10 +/- 2 head in 20 tosses is the same probability as
October 6, Linda Owens. Survey Research Laboratory University of Illinois at Chicago 1 of 22
 INTRODUCTION TO SURVEY SAMPLING October 6, 2010 Linda Owens University of Illinois at Chicago www.srl.uic.edu 1 of 22 Census or sample? Census: Gathering information about every individual in a population
Chapter 4: Designing Studies
 Chapter 4: Designing Studies Section 4.1 Samples and Surveys The Practice of Statistics, 4 th edition For AP* STARNES, YATES, MOORE Chapter 4 Designing Studies 4.1 Samples and Surveys 4.2 Experiments 4.3
**Gettysburg Address Spotlight Task
 **Gettysburg Address Spotlight Task Authorship of literary works is often a topic for debate. One method researchers use to decide who was the author is to look at word patterns from known writing of the
CHAPTER 4 Designing Studies
 CHAPTER 4 Designing Studies 4.1 Samples and Surveys The Practice of Statistics, 5th Edition Starnes, Tabor, Yates, Moore Bedford Freeman Worth Publishers Samples and Surveys Learning Objectives After this
Warm Up The following table lists the 50 states.
 .notebook Warm Up The following table lists the 50 states. (a) Obtain a simple random sample of size 10 using Table I in Appendix A, a graphing calculator, or computer software. 4 basic sampling techniques
AP Statistics Ch In-Class Practice (Probability)
") AP Statistics Ch 14-15 In-Class Practice (Probability) #1a) A batter who had failed to get a hit in seven consecutive times at bat then hits a game-winning home run. When talking to reporters afterward,
AP Statistics Ch 14-15 In-Class Practice (Probability) #1a) A batter who had failed to get a hit in seven consecutive times at bat then hits a game-winning home run. When talking to reporters afterward,
Sampling. I Oct 2008
 Sampling I214 21 Oct 2008 Why the need to understand sampling? To be able to read and use intelligently information collected by others: Marketing research Large surveys, like the Pew Internet and American
Census: Gathering information about every individual in a population. Sample: Selection of a small subset of a population.
 INTRODUCTION TO SURVEY SAMPLING October 18, 2012 Linda Owens University of Illinois at Chicago www.srl.uic.edu Census or sample? Census: Gathering information about every individual in a population Sample:
Introduction INTRODUCTION TO SURVEY SAMPLING. General information. Why sample instead of taking a census? Probability vs. non-probability.
 Introduction Census: Gathering information about every individual in a population Sample: Selection of a small subset of a population Census INTRODUCTION TO SURVEY SAMPLING Sample February 14, 2018 Linda
Probability - Introduction Chapter 3, part 1
 Probability - Introduction Chapter 3, part 1 Mary Lindstrom (Adapted from notes provided by Professor Bret Larget) January 27, 2004 Statistics 371 Last modified: Jan 28, 2004 Why Learn Probability? Some
, -the of all of a probability experiment. consists of outcomes. (b) List the elements of the event consisting of a number that is greater than 4.
 List the elements of the event consisting of a number that is greater than 4.") 4-1 Sample Spaces and Probability as a general concept can be defined as the chance of an event occurring. In addition to being used in games of chance, probability is used in the fields of,, and forecasting,
4-1 Sample Spaces and Probability as a general concept can be defined as the chance of an event occurring. In addition to being used in games of chance, probability is used in the fields of,, and forecasting,
Unit 7 Central Tendency and Probability
 Name: Block: 7.1 Central Tendency 7.2 Introduction to Probability 7.3 Independent Events 7.4 Dependent Events 7.1 Central Tendency A central tendency is a central or value in a data set. We will look at
Introduction INTRODUCTION TO SURVEY SAMPLING. Why sample instead of taking a census? General information. Probability vs. non-probability.
 Introduction Census: Gathering information about every individual in a population Sample: Selection of a small subset of a population INTRODUCTION TO SURVEY SAMPLING October 28, 2015 Karen Foote Retzer
Statistical Measures
 Statistical Measures Pre-Algebra section 10.1 Statistics is an area of math that deals with gathering information (called data). It is often used to make predictions. Important terms: Population A population
Unit 1B-Modelling with Statistics. By: Niha, Julia, Jankhna, and Prerana
 Unit 1B-Modelling with Statistics By: Niha, Julia, Jankhna, and Prerana [ Definitions ] A population is any large collection of objects or individuals, such as Americans, students, or trees about which
Honors Statistics. Daily Agenda
 Honors Statistics Aug 23-8:26 PM Daily Agenda 3. Review Homework C5#7 Aug 23-8:31 PM 1 Apr 17-8:20 PM Nov 9-5:30 PM 2 Nov 9-5:34 PM How do you want it - the crystal mumbo-jumbo or statistical probability?
The Teachers Circle Mar. 20, 2012 HOW TO GAMBLE IF YOU MUST (I ll bet you $5 that if you give me $10, I ll give you $20.)
") The Teachers Circle Mar. 2, 22 HOW TO GAMBLE IF YOU MUST (I ll bet you $ that if you give me $, I ll give you $2.) Instructor: Paul Zeitz (zeitzp@usfca.edu) Basic Laws and Definitions of Probability If
The Teachers Circle Mar. 2, 22 HOW TO GAMBLE IF YOU MUST (I ll bet you $ that if you give me $, I ll give you $2.) Instructor: Paul Zeitz (zeitzp@usfca.edu) Basic Laws and Definitions of Probability If
CUOMO TOPS de BLASIO 4-1 AS TOP DEM IN NEW YORK, QUINNIPIAC UNIVERSITY POLL FINDS; CLINTON OR CUOMO STOMP GOP IN STATE IN 2016 RACE
 Maurice Carroll, Assistant Director, Quinnipiac University Poll (203) 582-5334 Rubenstein Associates, Inc. Public Relations Contact: Pat Smith (212) 843-8026 FOR RELEASE: DECEMBER 23, 2014 CUOMO TOPS de
- go over homework #2 on applications - Finish Applications Day #3 - more applications... tide problems, start project
 10/20/15 ALICATIONS DAY #3 HOMEWORK TC2 WARM U! Agenda Homework - go over homework #2 on applications - Finish Applications Day #3 - more applications... tide problems, start project UCOMING: OW #6 Quiz
These days, surveys are used everywhere and for many reasons. For example, surveys are commonly used to track the following:
 The previous handout provided an overview of study designs. The two broad classifications discussed were randomized experiments and observational studies. In this handout, we will briefly introduce a specific
Statistics and Data Long-Term Memory Review Review 1
 Review 1 1. Choose from the words below to complete the sentence: When collecting data using a survey, you can choose to ask everyone in your target group, which is called a census, or you can choose a,
Sampling distributions and the Central Limit Theorem
 Sampling distributions and the Central Limit Theorem Johan A. Elkink University College Dublin 14 October 2013 Johan A. Elkink (UCD) Central Limit Theorem 14 October 2013 1 / 29 Outline 1 Sampling 2 Statistical
Turnout Key in Close Race; Young Voters Favor Kerry
 ABC NEWS POLL: CAMPAIGN TRACKING #16 10/20/04 EMBARGOED FOR RELEASE AFTER 5 p.m. Thursday, Oct. 21, 2004 Turnout Key in Close Race; Young Voters Favor Kerry John Kerry has improved his standing among young
not human choice is used to select the sample.
 [notes for days 2 and 3] Random Sampling All statistical sampling designs have in common the idea that chance not human choice is used to select the sample. Randomize let chance do the choosing! Randomization
Section 6.4. Sampling Distributions and Estimators
 Section 6.4 Sampling Distributions and Estimators IDEA Ch 5 and part of Ch 6 worked with population. Now we are going to work with statistics. Sample Statistics to estimate population parameters. To make
Question 1. The following set of data gives exam scores in a class of 12 students. a) Sketch a box and whisker plot of the data.
 Sketch a box and whisker plot of the data.") Question 1 The following set of data gives exam scores in a class of 12 students 25, 67, 86, 72, 97, 80, 86, 55, 68, 70, 81, 12 a) Sketch a box and whisker plot of the data. b) Determine the Interquartile
Question 1 The following set of data gives exam scores in a class of 12 students 25, 67, 86, 72, 97, 80, 86, 55, 68, 70, 81, 12 a) Sketch a box and whisker plot of the data. b) Determine the Interquartile
Ch. 12: Sample Surveys
 Ch. 12: Sample Surveys The election of 1948 The Predictions If you don t believe in random sampling, the next time you have a blood test tell the doctor to take it all. The Candidates Crossley Gallup Roper
CH 13. Probability and Data Analysis
 11.1: Find Probabilities and Odds 11.2: Find Probabilities Using Permutations 11.3: Find Probabilities Using Combinations 11.4: Find Probabilities of Compound Events 11.5: Analyze Surveys and Samples 11.6:
Lesson 7: Calculating Probabilities of Compound Events
 Lesson 7: alculating Probabilities of ompound Events A previous lesson introduced tree diagrams as an effective method of displaying the possible outcomes of certain multistage chance experiments. Additionally,
Math 4610, Problems to be Worked in Class
 Math 4610, Problems to be Worked in Class Bring this handout to class always! You will need it. If you wish to use an expanded version of this handout with space to write solutions, you can download one
Lotto! Online Product Guide
 BCLC Lotto! Online Product Guide Resource Manual for Lottery Retailers October 18, 2016 The focus of this document is to provide retailers the tools needed in order to feel knowledgeable when selling and
Honors Statistics. Daily Agenda
 Honors Statistics Aug 23-8:26 PM Daily Agenda 3. Review Homework C5#8 Aug 23-8:31 PM 1 Dec 15-7:22 PM Dec 3-10:54 AM 2 Nov 9-5:30 PM Nov 9-5:34 PM 3 A skips 75, 78, 91 How do you want it - the crystal
Spitzer Support Slides; Still Strong
 SIENA RESEARCH INSTITUTE SIENA COLLEGE, LOUDONVILLE, NY www.siena.edu/sri For Immediate Release: Monday, March 26, 2007 Contact: Steven Greenberg at 518-469-9858 Siena New York Poll: Spitzer Support Slides;
Pan (7:30am) Juan (8:30am) Juan (9:30am) Allison (10:30am) Allison (11:30am) Mike L. (12:30pm) Mike C. (1:30pm) Grant (2:30pm)
 Juan (8:30am) Juan (9:30am) Allison (10:30am) Allison (11:30am) Mike L. (12:30pm) Mike C. (1:30pm) Grant (2:30pm)") STAT 225 FALL 2012 EXAM ONE NAME Your Section (circle one): Pan (7:30am) Juan (8:30am) Juan (9:30am) Allison (10:30am) Allison (11:30am) Mike L. (12:30pm) Mike C. (1:30pm) Grant (2:30pm) Grant (3:30pm)
STAT 225 FALL 2012 EXAM ONE NAME Your Section (circle one): Pan (7:30am) Juan (8:30am) Juan (9:30am) Allison (10:30am) Allison (11:30am) Mike L. (12:30pm) Mike C. (1:30pm) Grant (2:30pm) Grant (3:30pm)
Moore, IPS 6e Chapter 05
 Page 1 of 9 Moore, IPS 6e Chapter 05 Quizzes prepared by Dr. Patricia Humphrey, Georgia Southern University Suppose that you are a student worker in the Statistics Department and they agree to pay you
7.1 Sampling Distribution of X
 7.1 Sampling Distribution of X Definition 1 The population distribution is the probability distribution of the population data. Example 1 Suppose there are only five students in an advanced statistics
Bell Work. Warm-Up Exercises. Two six-sided dice are rolled. Find the probability of each sum or 7
 Warm-Up Exercises Two six-sided dice are rolled. Find the probability of each sum. 1. 7 Bell Work 2. 5 or 7 3. You toss a coin 3 times. What is the probability of getting 3 heads? Warm-Up Notes Exercises
FAVORITE MEALS NUMBER OF PEOPLE Hamburger and French fries 17 Spaghetti 8 Chili 12 Vegetarian delight 3
 Probability 1. Destiny surveyed customers in a restaurant to find out their favorite meal. The results of the survey are shown in the table. One person in the restaurant will be picked at random. Based
Name: Class: Date: 6. An event occurs, on average, every 6 out of 17 times during a simulation. The experimental probability of this event is 11
 Class: Date: Sample Mastery # Multiple Choice Identify the choice that best completes the statement or answers the question.. One repetition of an experiment is known as a(n) random variable expected value
< 1 / j, po&i*(sl. Statistics 300 X* > Summer 2011
 < 1 / j, po&i*(sl Statistics 300 X* > Summer 2011 Instructor: L. C. Larsen Name: ^MVnjJ-V\ -3^ \\A~\\ g"v\ _ Mon/Ti Mon/Tue/Wed/Thu 5:30-8:15 pm 1. (4 points; 5 minutes) Identify the sampling approach
News English.com Ready-to-use ESL/EFL Lessons by Sean Banville Facebook creator is Time Person of the Year
 www.breaking News English.com Ready-to-use ESL/EFL Lessons by Sean Banville 1,000 IDEAS & ACTIVITIES FOR LANGUAGE TEACHERS The Breaking News English.com Resource Book http://www.breakingnewsenglish.com/book.html
1. Two cards are drawn from a deck of 52 cards. What is the probability that a) both are clubs b) both are Jacks.
 both are clubs b) both are Jacks.") MATHEMATICS 360-255-LW Quantitative Methods II Philip Foth 1. Two cards are drawn from a deck of 52 cards. What is the probability that a) both are clubs both are Jacks. 2. A single card is drawn from
MATHEMATICS 360-255-LW Quantitative Methods II Philip Foth 1. Two cards are drawn from a deck of 52 cards. What is the probability that a) both are clubs both are Jacks. 2. A single card is drawn from
Section 7.1 Experiments, Sample Spaces, and Events
 Section 7.1 Experiments, Sample Spaces, and Events Experiments An experiment is an activity with observable results. 1. Which of the follow are experiments? (a) Going into a room and turning on a light.
Sampling Designs and Sampling Procedures
 Business Research Methods 9e Zikmund Babin Carr Griffin 16 Sampling Designs and Sampling Procedures Chapter 16 Sampling Designs and Sampling Procedures 2013 Cengage Learning. All Rights Reserved. May not
Probability Homework
 Probability Homework Section P 1. A pair of fair dice are tossed. What is the conditional probability that the two dice are the same given that the sum equals 8? 2. A die is tossed. a) Find the probability
Name: Spring P. Walston/A. Moore. Topic worksheet # assigned #completed Teacher s Signature Tree Diagrams FCP
 Name: Spring 2016 P. Walston/A. Moore Topic worksheet # assigned #completed Teacher s Signature Tree Diagrams 1-0 13 FCP 1-1 16 Combinations/ Permutations Factorials 1-2 22 1-3 20 Intro to Probability
Money Responsibility
 Student Activities $ Lesson Two Money Responsibility 03/09 money responsibility directions Money choices are sometimes difficult. Consider each of these situations. You may want to print these and cut
Marist College Institute for Public Opinion Poughkeepsie, NY Phone Fax
 Marist College Institute for Public Opinion Poughkeepsie, NY 12601 Phone 845.575.5050 Fax 845.575.5111 www.maristpoll.marist.edu NY1/YNN-Marist Poll Cuomo Keeping Campaign Promises Approval Rating Grows
Statistical and operational complexities of the studies I Sample design: Use of sampling and replicated weights
 Statistical and operational complexities of the studies I Sample design: Use of sampling and replicated weights Andrés Sandoval-Hernández IEA DPC Workshop on using PISA, PIAAC, TIMSS & PIRLS, TALIS datasets
Geometric Distribution
 Geometric Distribution Review Binomial Distribution Properties The experiment consists of n repeated trials. Each trial can result in just two possible outcomes. The probability of success is the same
Something to Think About
 Probability Facts Something to Think About Name Ohio Lottery information: one picks 6 numbers from the set {1,2,3,...49,50}. The state then randomly picks 6 numbers. If you match all 6, you win. The number
Sampling, Part 2. AP Statistics Chapter 12
 Sampling, Part 2 AP Statistics Chapter 12 bias error Sampling error is just sampling variation! Bias vs Error BIAS is something that causes your measurements to systematically miss in the same direction,
Gore Inches Closer, But Bush Still Leads
 ABC NEWS/WASHINGTON POST POLL: DEM. CONVENTION OPENER - 8/10/00 EMBARGO: 6:30 P.M. BROADCAST, 9 P.M. PRINT/WEB, Friday, Aug. 11, 2000 Gore Inches Closer, But Bush Still Leads Al Gore has inched closer
Elements of the Sampling Problem!
 Elements of the Sampling Problem! Professor Ron Fricker! Naval Postgraduate School! Monterey, California! Reading Assignment:! 2/1/13 Scheaffer, Mendenhall, Ott, & Gerow,! Chapter 2.1-2.3! 1 Goals for
MAT Midterm Review
 MAT 120 - Midterm Review Name Identify the population and the sample. 1) When 1094 American households were surveyed, it was found that 67% of them owned two cars. Identify whether the statement describes
Lesson 5: Understanding Subtraction of Integers and Other Rational Numbers
 \ Lesson 5: Understanding Subtraction of Integers and Other Rational Numbers Student Outcomes Students justify the rule for subtraction: Subtracting a number is the same as adding its opposite. Students
Using Graphing Skills
 Name Class Date Laboratory Skills 8 Using Graphing Skills Introduction Recorded data can be plotted on a graph. A graph is a pictorial representation of information recorded in a data table. It is used
PUBLIC EXPENDITURE TRACKING SURVEYS. Sampling. Dr Khangelani Zuma, PhD
 PUBLIC EXPENDITURE TRACKING SURVEYS Sampling Dr Khangelani Zuma, PhD Human Sciences Research Council Pretoria, South Africa http://www.hsrc.ac.za kzuma@hsrc.ac.za 22 May - 26 May 2006 Chapter 1 Surveys
Exam #1. Good luck! Page 1 of 7
 Exam # Total: 00 points Date: July, 008 Time: :00 :0 You have hour and 0 minutes to finish the exam. Please read the question carefully and assign your time smartly. Please PRINIT your name on each page
Math 227 Elementary Statistics. Bluman 5 th edition
 Math 227 Elementary Statistics Bluman 5 th edition CHAPTER 4 Probability and Counting Rules 2 Objectives Determine sample spaces and find the probability of an event using classical probability or empirical
THE ALGEBRA III MIDTERM EXAM REVIEW Name
 THE ALGEBRA III MIDTERM EXAM REVIEW Name This review MUST be turned in when you take the midterm exam OR you will not be allowed to take the midterm and will receive a ZERO for the exam. ALG III Midterm
MULTIPLE CHOICE. Choose the one alternative that best completes the statement or answers the question.
 Mathematical Ideas Chapter 2 Review Name MULTIPLE CHOICE. Choose the one alternative that best completes the statement or answers the question. ) In one town, 2% of all voters are Democrats. If two voters
1) What is the total area under the curve? 1) 2) What is the mean of the distribution? 2)
 What is the total area under the curve? 1) 2) What is the mean of the distribution? 2)") Math 1090 Test 2 Review Worksheet Ch5 and Ch 6 Name Use the following distribution to answer the question. 1) What is the total area under the curve? 1) 2) What is the mean of the distribution? 2) 3) Estimate
Math 1090 Test 2 Review Worksheet Ch5 and Ch 6 Name Use the following distribution to answer the question. 1) What is the total area under the curve? 1) 2) What is the mean of the distribution? 2) 3) Estimate
WEEK 11 REVIEW ( and )
") Math 141 Review 1 (c) 2014 J.L. Epstein WEEK 11 REVIEW (7.5 7.6 and 8.1 8.2) Conditional Probability (7.5 7.6) P E F is the probability of event E occurring given that event F has occurred. Notation: (
Math 141 Review 1 (c) 2014 J.L. Epstein WEEK 11 REVIEW (7.5 7.6 and 8.1 8.2) Conditional Probability (7.5 7.6) P E F is the probability of event E occurring given that event F has occurred. Notation: (
Chapter 4. September 08, appstats 4B.notebook. Displaying Quantitative Data. Aug 4 9:13 AM. Aug 4 9:13 AM. Aug 27 10:16 PM.
 Objectives: Students will: Chapter 4 1. Be able to identify an appropriate display for any quantitative variable: stem leaf plot, time plot, histogram and dotplot given a set of quantitative data. 2. Be
6.041/6.431 Spring 2009 Quiz 1 Wednesday, March 11, 7:30-9:30 PM.
 6.04/6.43 Spring 09 Quiz Wednesday, March, 7:30-9:30 PM. Name: Recitation Instructor: TA: Question Part Score Out of 0 3 all 40 2 a 5 b 5 c 6 d 6 3 a 5 b 6 c 6 d 6 e 6 f 6 g 0 6.04 Total 00 6.43 Total
STAT 100 Fall 2014 Midterm 1 VERSION B
 STAT 100 Fall 2014 Midterm 1 VERSION B Instructor: Richard Lockhart Name Student Number Instructions: This is a closed book exam. You may use a calculator. It is a 1 hour long exam. It is out of 30 marks
SAMPLING. A collection of items from a population which are taken to be representative of the population.
 SAMPLING Sample A collection of items from a population which are taken to be representative of the population. Population Is the entire collection of items which we are interested and wish to make estimates