Smart Cities: New Ideas about Data Driven Driven Modelling, Visualisation, Simulation, Prediction and Design
|
|
|
- Candice Parker
- 6 years ago
- Views:
Transcription

1 July 27- August 2, 2014 Smart Cities: New Ideas about Data Driven Driven Modelling, Visualisation, Simulation, Prediction and Design Michael
2 Outline Some Preliminary Remarks about Cities Smart Cities: A New Paradigm? An Old Exemplar 1: Land Use Transport Modelling An Old Exemplar 2: 2D into 3D Symbolic into Iconic Exemplar 3: Public Transport Networks & Flows Exemplar 4: Public Bike Schemes: Local Routing and Local Models of Movement Exemplar 5: Crowd Sourcing & Social Media Where Do We Go From Here? The Next 50 Years
3 Some Preliminary Remarks about Cities Three topics: smart cities, land use transport models, and size and scaling in cities Smart cities deal with short term issues mobility, energy etc Land Use Transport Models deal with long term more aggregative issues, prediction in cities Size and Scaling deal with complexity in cities These topics not seamlessly connected but all define aspects of the new digital world in cities These all sit in an enormous sea of knowledge about cities and their planning reflecting many disciplines
4 Let me begin A couple of examples about what smart cities are all about Real time, streamed big data An example from public transport in London where smart card data is now key


5 Smart Card Data Oyster Card Taps Tap at start and end of train journeys Tap at start only on buses Accepted at 695 Underground and rail stations, and on thousands of buses 991 million Oyster Card taps over Summer 2012 this is big data

6 And how can we make sense of this


7


8
9 Smart Cities: A New Paradigm What then is the smart city? This is a peculiarly American word Well cities where computers are being used to make them more efficient, and perhaps more equitable Essentially computers have moved out of the corporate and individual domains into the collective domain of the city to control things and to deliver services They are also used to help our understanding and planning the city and this is the idea that we used them to understand how they are being used
10 What is happening is that we are getting a much better sense of the short term changes in the city. Much of our geographic science of the city is about how it changes over the long term the very long term like the rise of cities over years and decades But the smart city is about what happens in the next 5 minutes or the next 5 hours or even the next 5 days This is changing our ability to respond and it is also changing our abilities to function in cities our behaviour. This lecture is an example informed by my access to the web and pulling down things like my bikes example for London which I will show later
11 By putting sensors into the built environment and also linking them to ourselves, then great streams of data are being released This is Big Data: a Billion Oyster card records in 3 months now you can t use an Excel spreadsheet to analyse that Smart Cities and Big Data are strongly related. If this then is the Future of Cities, we need to dig a little behind the hype and the media spin. So what have we learnt and what are we learning? What is the geography of the smart city? Let us see through my examples most taken from London.
12 I will begin with two old examples of what we can do with new technologies in terms of simulating and visualising the city. First we have been building land use transportation models for a long time but now we can visualise their simulations, their data, how big they are, and how we can quickly we can generate what if? scenarios Second, visualisation is not now about simply maps in GIS which is now routine but 3 d geometry that is becoming routine the virtual city that we can use as a visual set of filing cabinets to which we can add content and not just render but real attribute data.


13 An Old Exemplar 1: Land Use Transport Modelling Our core expertise is in land use transportation modelling and we have several such models for the London region:


14
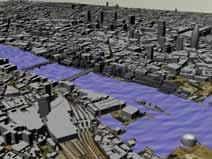
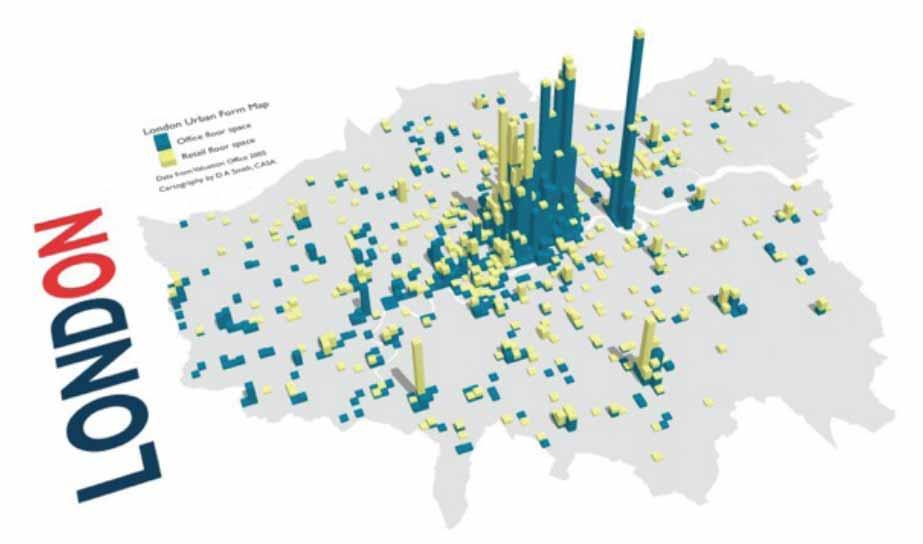
15 An Old Exemplar 2: 2D into 3D Symbolic into Iconic We have built a large scale 3 D model for London based on RS data at parcel levels. The model is different from our LUT models requiring different skills The models are being tagged with socio economic data. We have used it for flooding, visualising air pollution, we have looked at the morphology of building form, and used it to visualise 2D to 3D design proposals. What is intriguing is the way iconic and symbolic models are beginning to merge land use transport models with virtual city models. We are not yet in the realms of the smart city but you can see how our computers are beginning to help us understand and communicate ideas better across the web.


16

17 Flooding from our 3D Virtual London Model


18 Shifts in Traffic Accessibility if all Bridges across the Thames are Inoperable as far West as Hammersmith
19 Exemplar 3: Public Transport Networks & Flows Many new sources of network data now exist, much of coming from digital sources and we are working with mining this data and extracting functionality from it Our key data sets are telecoms data (landline) for the UK, the online travel card data (Oyster) for public transport schemes in London which is massive, really massive and the online bike movement data for the London bikes scheme. These are big data sets that record every phone call, trip etc over a period of days with each object time stamped. Let me show some more of the smart card Oyster project first I have shown you the flows but there are many things we can do with all this like work out disruption on the network and inform travellers eventually in real time


20 Oyster Card Data interpreting urban structure, multitrips, etc.

21 We can examine origins volumes, destination volumes separately and we are doing but here we will simply add these together as total volumes in this sense they will not have meaning any longer as trips We will now examine the profiles of behaviour during the 24 hour day to provide some sense of the problem
22 Examining the Dynamics of the Hub Volumes
23 Night am peak pm peak

24 Entries Exits Leakage
25 Particular Events: Weekdays, Saturdays and Sundays Entry at Camden Town (10 Mn. Intervals) Weekday Saturday Sunday Entry at Arsenal (10 Mn. Intervals) Weekday Saturday Sunday Number of Events Number of Events Events Nightlife am 4am 6am 8am 10am 12pm 2pm 4pm 6pm 8pm 10pm 12am 2am 4am Time of Day 100 2am 4am 6am 8am 10am 12pm 2pm 4pm 6pm 8pm 10pm 12am 2am 4am Time of Day Entry at Bank (10 Mn. Intervals) Weekday Saturday Sunday 150 Entry at Bayswater (10 Mn. Intervals) Weekday Saturday Sunday Number of Events Number of Events Work Tourism? am 4am 6am 8am 10am 12pm 2pm 4pm 6pm 8pm 10pm 12am 2am 4am Time of Day 2am 4am 6am 8am 10am 12pm 2pm 4pm 6pm 8pm 10pm 12am 2am 4am Time of Day 150
26 Disruption caused by closing Liverpool Street in terms of the graph of the tube network Closing Green Park shifts in betweenness centrality

27 Bank & Monument Stations: 5 Lines and 2 Modes 60k Entries/Exits Weekdays 35k Entries/Exits Weekends

28 Circle and District line part closure From Edgware Road to Aldgate/Aldgate East 19 th July :49 to 12: Oyster Cards with regular pattern during disrupted time period travelled


29 Increased Travel Time Greater than 2SD above mean increase on usual travel time for that Oyster Card Size equal to proportion of users that regularly travel from station during time period, and travelled that during disruption

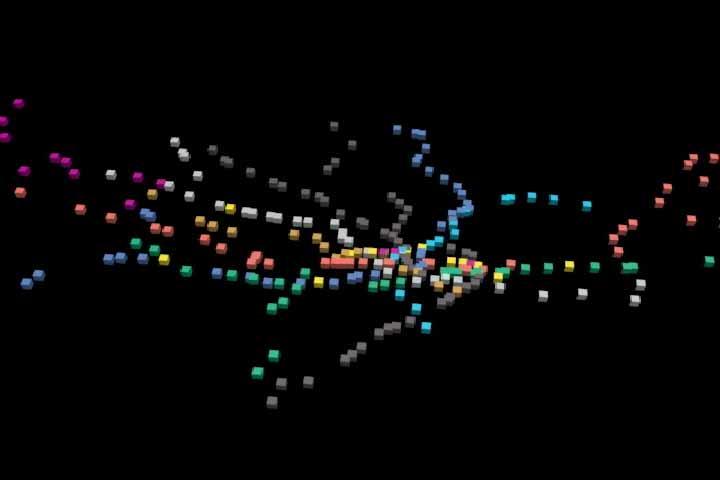
30 The Public Transport System in Terms of Vehicle Flows


31
32

33


34 Delays from Tube, National Rail and Bus Fused Key National Rail more than 5 minutes late Tube stations showing a wait time 15% above expected Tuesday 9 October 10:30 Bus stops showing a wait time 20% above expected Tube delays from the TfL status feed are also plotted as lines

35 Tube, Overground and National Rail Networks in London where Oyster cards can be used


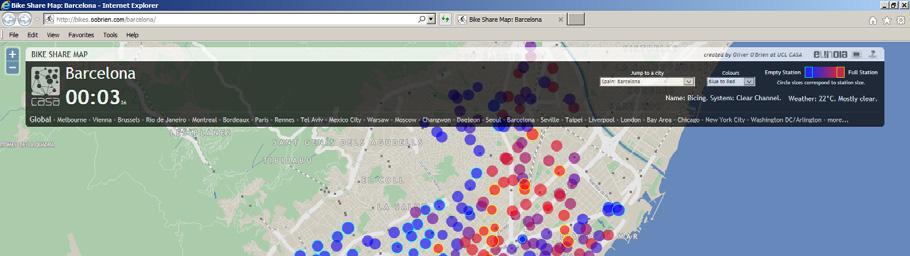
36 Exemplar 4: The Public Bike Scheme: Local Routing and Local Models of Movement Bikes Data 4200 bikes, started Nov 2010, all the data everything all trips, all times, all stations/docks


37


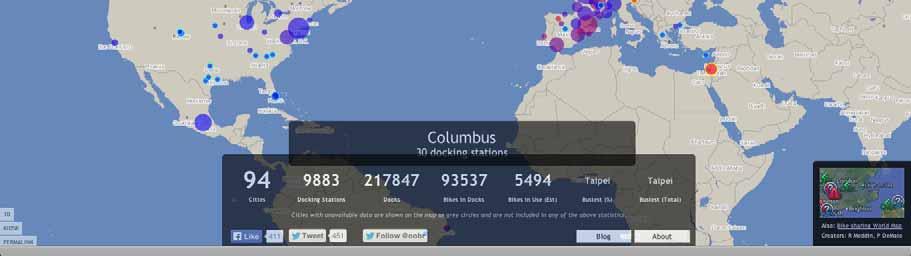
38 The Website: Real Time Visualisation of Origins and Destinations Activity


39

40 Your can play back the last couple of days from the animator for many of the cities where the data is captured online
41 We have shown a lot of data and examples of flow data which is big data taken from streaming in real time What has become very popular is the notion of the dashboard a way of presenting all this streamed data in terms of a one stop shop a portal that gives access to the streams all arranged to provide an instant picture of what is happening. Some of these focus on the performance of cities and are evaluative but these will evolve in time and as everywhere with new information technologies, these glimpses of the state of things will become widespread. Here is our contribution.


42


43 Simulating Crowds: Fine Scale Modelling and Sensing In a different tradition but one which is rapidly converging with our interests in sensing and networks, we have developed a number of pedestrian models, first for the Notting Hill Carnival, and then for many town centres


44 We are now working on fine scale models which are mirror diffusion and spread in situations ranging from epidemics to evacuation and shopping. We have a simple model of epidemics on networks in London and we are looking at evacuations of major shopping centres such as Covent Garden (right)
45 Let us change tack from sensing to mapping Exemplar 5: Crowd Sourcing and New Data: Sources from Social Media We have a number of mapping projects using Web 2 and these involve using these online mapping systems to elicit simple data from the crowd but data that is geotagged, hence the production of online maps of the crowdsourced data in real time We have looked at Manchester congestion charge, anti social behaviour and credit crunch where in all cases we have used the BBC to broadcast the questions and provide the forum for response while our servers and software have produced the maps.


46 23,475 responses April, May, June 2008 A new credit crunch survey started in October and currently has 3,802 responses.


47


48 BBC Look East: Anti Social Behaviour July, August, September ,902 responses


49 Manchester Congestion Charge 15,902 responses October to December 2008

50

51 BBC Look East Survey - Broadband Speed Test
52 Extracting and Mapping Social Media We have started to mine, map, interpret much social media because of the ease of its availability and we have started looking at Short Text Messaging Twitter data. We have also begun to look at phone tracking data from the iphone for example but many of our data sets such as the bikes data, the Oyster card and such like data are really part of the same domain of new bottom up data. We have no control over this but some of the social media data we are mining we have greater control over. Here are some examples. And Here is a Map of Tweets above London which uses our 3D model to visualise these data

53


54 New York London Paris Moscow


55
56 Returning to our old exemplars these are being enriched with new tools and new data and new animations Our LUTI models are being informed by 3 d visualisation and can now be imported into 3 D in working form Our 3 d visualisations are being enriched with new and rapid sensing technologies using everything from phones to drones and new data attributes in terms of social media.
57


58

59
60 Where Do We Go From Here? The Next 100 Years I have not mentioned that much of this is being ported to hand held devices in fact this is obvious I have not mentioned digital participation which is key to the smart cities movement, indeed reinforces the point you can t have smart cities without smart people. I think we need to fashion a new science out of this and some of it is coming. This will be built on many ideas of the last century but a lot of new ones too across many different dimensions Let me finish by saying what we are trying to do to tie all this together in A Science of Cities and our progress in this will always be a moving target as cities continue to change as new technologies are invented which then change us.
61 Thanks Acknowledgements Andy Hudson Smith, Richard Milton, Oliver O Brien, Stephen Gray, Fabian Neuhaus, Pete Ferguson, Martin Austwick, Joan Serras, Camilo Vargas Ruiz, Paul Longley, Jon Reades, Ed Manley, Anders Johansson, Flora Roumpani and Stephan Hugel


62 Some of our books which are about some of this
Thanks, and Apologies What This Lecture will be About
 5 October 2013 Prix Vautrin Lud Smart Cities, Virtual Realities & Big Data in the Global Age Michael Batty m.batty@ucl.ac.uk @jmichaelbatty http://www.complexcity.info/ http://www.spatialcomplexity.info/
2 Smart Cities. Big Data, Real Time Transport, Social Media, and Urban Simulation Michael
 5 th February 2014 2 Smart Cities Big Data, Real Time Transport, Social Media, and Urban Simulation Michael Batty m.batty@ucl.ac.uk @jmichaelbatty http://www.complexcity.info/ http://www.casa.ucl.ac.uk/
Visualising Cities Through Models, Maps & Machines
 Visualizing Information in Complex Environments ASSyST-FuturICT, Torino Italy 17-18 November 2011 Visualising Cities Through Models, Maps & Machines Michael Batty University College London m.batty@ucl.ac.uk
Connecting Manchester. How BT s Internet of Things solutions became central to the CityVerve smart city project
 How BT s Internet of Things solutions became central to the CityVerve smart city project November 2017 An introduction to CityVerve Manchester s CityVerve project brings together 21 organisations including
Innovative mobility data collection tools for sustainable planning
 Innovative mobility data collection tools for sustainable planning Dr. Maria Morfoulaki Center for Research and Technology Hellas (CERTH)/ Hellenic Institute of Transport (HIT) marmor@certh.gr Data requested
Aimsun Next User's Manual
 Aimsun Next User's Manual 1. A quick guide to the new features available in Aimsun Next 8.3 1. Introduction 2. Aimsun Next 8.3 Highlights 3. Outputs 4. Traffic management 5. Microscopic simulator 6. Mesoscopic
Smart Cities the who s, what s, where s?
 Smart Cities the who s, what s, where s? The term smarter moving cities has been circulating for a while now but, while we in the world of travel behaviour change can comprehend its meaning, what does
UCL Institute for Digital Innovation in the Built Environment. MSc Digital Innovation in Built Asset Management
 UCL Institute for Digital Innovation in the Built Environment MSc Digital Innovation in Built Asset Management A better world We are the innovators The digital realm offers solutions to some of society
MAPS & ENHANCED CONTENT
 MAPS & ENHANCED Delivering high quality maps to enterprise, government, automotive and consumer markets MAPS & SUPERIOR HOW SEAMLESS COVERAGE IS COMMUNITY DRIVEN THE FRESHEST MAP The heart of location
Foreword_. Smart Santander Foreword
 Smart Santander_ 00 - Foreword Foreword_ More than half of the world s population lives in cities and this proportion is increasing day by day. As urban environments are becoming more densely populated
BIG DATA EUROPE TRANSPORT PILOT: INTRODUCING THESSALONIKI. Josep Maria Salanova Grau CERTH-HIT
 BIG DATA EUROPE TRANSPORT PILOT: INTRODUCING THESSALONIKI Josep Maria Salanova Grau CERTH-HIT Thessaloniki on the map ~ 1.400.000 inhabitants & ~ 1.300.000 daily trips ~450.000 private cars & ~ 20.000
How can (GPS) and (GIS) Improve Ambulance Performance Levels
 and (GIS) Improve Ambulance Performance Levels") CRP 514: Introduction to GIS Term Paper Presentation How can (GPS) and (GIS) Improve Ambulance Performance Levels The supervisor: Dr. Baqer AL-Ramadan Done by: Saleh Bahartha ID 200804320 Sunday 9 th January
CRP 514: Introduction to GIS Term Paper Presentation How can (GPS) and (GIS) Improve Ambulance Performance Levels The supervisor: Dr. Baqer AL-Ramadan Done by: Saleh Bahartha ID 200804320 Sunday 9 th January
Connecting Place: Making Geospatial more Intelligent and Accessible for decision makers. Andrew Coote Chief Executive 3rd February 2013
 Connecting Place: Making Geospatial more Intelligent and Accessible for decision makers Andrew Coote Chief Executive 3rd February 2013 Hype Geospatial Hype Cycle Geo Cloud Crowd Sourcing Augmented Reality
No TfL Rail service between Brentwood and Shenfield
 TfL Rail TFL Rail No TfL Rail service between and Shenfield Tuesday 3 January until late May 2017 Slightly reduced peak service between Gidea Park and Trains on the rest of the line may be busier than
Exploring Pedestrian Bluetooth and WiFi Detection at Public Transportation Terminals
 Exploring Pedestrian Bluetooth and WiFi Detection at Public Transportation Terminals Neveen Shlayan 1, Abdullah Kurkcu 2, and Kaan Ozbay 3 November 1, 2016 1 Assistant Professor, Department of Electrical
Appendix CANADA / Québec Montréal tunnels Ville-Marie & Viger
 PIARC WG5 Complex Underground Road Networks Part A Case Studies - appendices Appendix 3.1 - CANADA / Québec Montréal tunnels Ville-Marie & Viger 1. SUMMARY The Ville-Marie and Viger tunnel complex is part
USE OF BLUETOOTH TECHNOLOGY IN TRAFFIC DATA COLLECTION & MANAGEMENT
 USE OF BLUETOOTH TECHNOLOGY IN TRAFFIC DATA COLLECTION & MANAGEMENT Justin Effinger, EIT Research Assistant/Teaching Assistant Department of Civil Engineering & Mechanics University of Wisconsin Milwaukee
Coles Bay Ferry Proposal - point 1 Provide a shorter and safer route for visitors to Coles Bay and Freycinet National Park
 Friday 20 th May 2016 Nicholas Johnston Coles Bay Ferry Pty Ltd 14 Invercargill Road Mount Nelson TAS 7007 Dear Mr Johnston, I am writing on behalf of the Swanwick Community Association (SCA) regarding
TELLING STORIES OF VALUE WITH IOT DATA
 TELLING STORIES OF VALUE WITH IOT DATA VISUALIZATION BAREND BOTHA VIDEO TRANSCRIPT Tell me a little bit about yourself and your background in IoT. I came from a web development and design background and
Smart Cities SESSION IV: Lecture 1: Big Data and Urban Information Systems
 Wednesday, 14 October 2015 Smart Cities SESSION IV: Lecture 1: Big Data and Urban Information Systems Michael Batty m.batty@ucl.ac.uk @jmichaelbatty http://www.spatialcomplexity.info/ http://www.casa.ucl.ac.uk/
TRENDS % 33% of MILLENNIALS. 3 in 5 think SHARING IS BETTER for the environment. 3M s 15% TIME TO THINK cultivates Intrapreneurship.
 8 KEY TRENDS 2015-2020 SHAPING PEOPLE, CITIES & BUSINESSES 3M s 15% TIME TO THINK cultivates Intrapreneurship People BETAPRENEURS WE WE SMART CITIES Planet SMART URBAN SERVICES will be worth $400 billion
Intelligent City Transport Hubs: Characteristics for success
 Intelligent City Transport Hubs: Characteristics for success As cities continue to grow fuelled by cultural change and people moving from the countryside to urban areas, the movement of these populations
Big data in Thessaloniki
 Big data in Thessaloniki Josep Maria Salanova Grau Center for Research and Technology Hellas Hellenic Institute of Transport Email: jose@certh.gr - emit@certh.gr Web: www.hit.certh.gr Big data in Thessaloniki
Advanced Techniques for Mobile Robotics Location-Based Activity Recognition
 Advanced Techniques for Mobile Robotics Location-Based Activity Recognition Wolfram Burgard, Cyrill Stachniss, Kai Arras, Maren Bennewitz Activity Recognition Based on L. Liao, D. J. Patterson, D. Fox,
Mapping the capacity and performance of the arterial road network in Adelaide
 Australasian Transport Research Forum 2015 Proceedings 30 September - 2 October 2015, Sydney, Australia Publication website: http://www.atrf.info/papers/index.aspx Mapping the capacity and performance
Vistradas: Visual Analytics for Urban Trajectory Data
 Vistradas: Visual Analytics for Urban Trajectory Data Luciano Barbosa 1, Matthías Kormáksson 1, Marcos R. Vieira 1, Rafael L. Tavares 1,2, Bianca Zadrozny 1 1 IBM Research Brazil 2 Univ. Federal do Rio
our community. our nation. our world. Connect with the most influential, highly-educated and affluent radio audience.
 our community. our nation. our world. Connect with the most influential, highly-educated and affluent radio audience. 2017 Media Kit The WYSO Difference Underwriting on WYSO provides you with access to
Railway Training Simulators run on ESRI ArcGIS generated Track Splines
 Railway Training Simulators run on ESRI ArcGIS generated Track Splines Amita Narote 1, Technical Specialist, Pierre James 2, GIS Engineer Knorr-Bremse Technology Center India Pvt. Ltd. Survey No. 276,
Estimating Transit Ridership Patterns Through Automated Data Collection Technology
 Estimating Transit Ridership Patterns Through Automated Data Collection Technology A Case Study in San Luis Obispo, CA Ashley Kim ITE Western District Annual Meeting San Diego, CA June 20, 2017 1 Overview
Speech during the 12 th Esri Eastern Africa Users Conference at the Hyatt Regency, Dar es Salaam, Tanzania
 Speech during the 12 th Esri Eastern Africa Users Conference at the Hyatt Regency, Dar es Salaam, Tanzania By Dr. Eng. Maria Sasabo(PhD), Permanent Secretary, for Communication Sector, Ministry of Works,
A Reconfigurable Citizen Observatory Platform for the Brussels Capital Region. by Jesse Zaman
 1 A Reconfigurable Citizen Observatory Platform for the Brussels Capital Region by Jesse Zaman 2 Key messages Today s citizen observatories are beyond the reach of most societal stakeholder groups. A generic
Tait Radio Communications
 Tait Radio Communications Integrated communications solutions for integrated transport systems Paul Gwynn Business Development Manager EMEA Region paul.gwynn@taitradio.com Presentation Overview Introducing
Railway Maintenance Trends in Technology and management. Uday Kumar Luleå University of Technology LULEÅ-SWEDEN
 Railway Maintenance Trends in Technology and management Uday Kumar Luleå University of Technology LULEÅ-SWEDEN 2 LTU Our Strengths Leading-edge multidisciplinary applied research Our geographical location
The Vehicle Emission Penalty of Traffic Congestion
 Institute for Transport Studies FACULTY OF ENVIRONMENT IAQM York Monday 23 rd June 2013 The Vehicle Emission Penalty of Traffic Congestion Dr James Tate Lecturer Email: j.e.tate@its.leeds.ac.uk Twitter:
Graham Hughes, Executive Director: Economy, Transport & Environment, Cambridgeshire County Council. Smarter Cambridgeshire Work stream
 Report To: Greater Cambridge City Deal Executive Board 4 August 2015 Lead Officer: Workstream ref.: Graham Hughes, Executive Director: Economy, Transport & Environment, Cambridgeshire County Council D
Human factors and design in future health care
 Human factors and design in future health care Peter Buckle 1, Simon Walne 1, Simone Borsci 1,2 and Janet Anderson 3 1. NIHR London In Vitro Diagnostics Co-operative, Division of Surgery, Department of
Smart Infrastructure for Urban Mobility
 Smart Infrastructure for Urban Mobility Stephen F. Smith TRAFFIC CONGESTION costs $121 billion per year in the US produces 56 billion pounds of CO2 annually 40% of time spent on surface streets in urban
Transport poverty meets the Digital Divide: accessibility and connectivity in rural communities
 Transport poverty meets the Digital Divide: accessibility and connectivity in rural communities John D Nelson Centre for Transport Research and RCUK dot.rural Digital Economy Research Hub University of
Data, innovation and transformation of public sector services
 Atkins Lectures Data, innovation and transformation of public sector services One Public Sector Scotland 19 June 2014 Introduction to Atkins 2 At a glance Atkins is one of the world s leading design, engineering
PYBOSSA Technology. What is PYBOSSA?
 PYBOSSA Technology What is PYBOSSA? PYBOSSA is our technology, used for the development of platforms and data collection within collaborative environments, analysis and data enrichment scifabric.com 1
Where smart, connected and autonomous vehicles come to life
 Where smart, connected and autonomous vehicles come to life Introducing The Living Lab Created by TRL, the UK Smart Mobility Living Lab @ Greenwich has been established to create an open innovation environment
DATA AT THE CENTER. Esri and Autodesk What s Next? February 2018
 DATA AT THE CENTER Esri and Autodesk What s Next? February 2018 Esri and Autodesk What s Next? Executive Summary Architects, contractors, builders, engineers, designers and planners face an immediate opportunity
The GATEway Project London s Autonomous Push
 The GATEway Project London s Autonomous Push 06/2016 Why TRL? Unrivalled industry position with a focus on mobility 80 years independent transport research Public and private sector with global reach 350+
STATE OF THE ART 3D DESKTOP SIMULATIONS FOR TRAINING, FAMILIARISATION AND VISUALISATION.
 STATE OF THE ART 3D DESKTOP SIMULATIONS FOR TRAINING, FAMILIARISATION AND VISUALISATION. Gordon Watson 3D Visual Simulations Ltd ABSTRACT Continued advancements in the power of desktop PCs and laptops,
S8223: Simulating a City: GPU Simulations of Traffic, Crowds and Beyond
 S8223: Simulating a City: GPU Simulations of Traffic, Crowds and Beyond Dr Paul Richmond Contributors: Peter Heywood, Robert Chisholm, Mozhgan Kabiri-Chimeh, John Charlton & Steve Maddock Context: Everyone
The Next Era of Global Technological Development
 The Next Era of Global Technological Development Seminar at the John Curtin Institute of Public Policy Curtin University WA. Tuesday June 17 th 2014. Presented by Mal Bryce, Kelvin Willoughby and Ron Johnston
AUGMENTED REALITY IN URBAN MOBILITY
 AUGMENTED REALITY IN URBAN MOBILITY 11 May 2016 Normal: Prepared by TABLE OF CONTENTS TABLE OF CONTENTS... 1 1. Overview... 2 2. What is Augmented Reality?... 2 3. Benefits of AR... 2 4. AR in Urban Mobility...
T E Wellington House, Wellington Street, Leeds LS1 2DE
 The Urban Transport Group brings together public sector transport authorities in the UK s largest urban areas. Our members aim to support sustainable and inclusive economic growth by promoting, planning
Modern Operational Spectrum Monitoring Requirements
 Modern Operational Spectrum Monitoring Requirements A distributed monitoring system that covers everything, everywhere. Flexible design, packaging, performance so devices can be matched to operational
Urban Accessibility: perception, measurement and equitable provision
 Urban Accessibility: perception, measurement and equitable provision José Viegas, Secretary General, International Transport Forum Luis Martinez, Instituto Superior Técnico, Lisboa jose.viegas@oecd.org
TTÜ infotehnoloogiateaduskond Informaatikainstituut. Enn Õunapuu Vanemteadur
 TTÜ infotehnoloogiateaduskond Informaatikainstituut Enn Õunapuu enn.ounapuu@ttu.ee Vanemteadur Towards a connected world TEDxBNMIT We are moving towards a more connected, instrumented and data driven world
Lighting and Smart Cities
 David Scheer, AIA BEMP Sr Product Manager, Special Projects Lighting and Smart Cities David Scheer, AIA BEMP, Sr Product Manager, Special Projects 2013 Lighting and Smart Cities David Scheer, AIA BEMP,
How Connected Mobility Technology Is Driving The Future Of The Automotive Industry
 How Connected Mobility Technology Is Driving The Future Of The Automotive Industry After over 20 years of advances in the world of mobile connectivity, big data and social networks, technology is now rapidly
Millimetre Wave Wireless Access:
 Millimetre Wave Wireless Access: The Path to 5G Enhanced Mobile Broadband Professor Mark Beach Communication and Networks Group, University of Bristol, Bristol. UK http://www.bristol.ac.uk/engineering/research/csn/
Comparison of Simulation-Based Dynamic Traffic Assignment Approaches for Planning and Operations Management
 Comparison of Simulation-Based Dynamic Traffic Assignment Approaches for Planning and Operations Management Ramachandran Balakrishna Daniel Morgan Qi Yang Howard Slavin Caliper Corporation 4 th TRB Conference
LEARNING OBJECTIVES. Watch and understand a video about places. Write descriptive sentences
 LEARNING OBJECTIVES Watch and listen Reading skills Academic writing skills Writing task Watch and understand a video about places Scan for numbers Use capital letters and full stops correctly Write descriptive
MAKING IOT SENSOR SOLUTIONS FUTURE-PROOF AT SCALE
 WHITE PAPER MAKING IOT SENSOR SOLUTIONS FUTURE-PROOF AT SCALE Wireless sensor range vs. scalability: Understanding the key trade-offs Terje Lassen Product Manager Wireless Communication Disruptive Technologies
A Simulation System of Experience with a Disaster by Locating Memories on a Virtual Space
 A Simulation System of Experience with a Disaster by Locating Memories on a Virtual Space Kohki Yoshida 1( ), Takayoshi Kitamura 2, Tomoko Izumi 2, and Yoshio Nakatani 2 1 Graduated School of Information
Traffic Management for Smart Cities TNK115 SMART CITIES
 Traffic Management for Smart Cities TNK115 SMART CITIES DAVID GUNDLEGÅRD DIVISION OF COMMUNICATION AND TRANSPORT SYSTEMS Outline Introduction Traffic sensors Traffic models Frameworks Information VS Control
Esri and Autodesk What s Next?
 AN ESRI VISION PAPER JANUARY 2018 Esri and Autodesk What s Next? Copyright 2018 Esri All rights reserved. Printed in the United States of America. The information contained in this document is the exclusive
Technology & Sustainable Tourism. Quebec City, March 18 th, 2009
 Technology & Sustainable Tourism Quebec City, March 18 th, 2009 1 My Scope & Purpose Today Re thinking Sustainability The Need for Innovation The Role of Technology in Changing the Agenda 2 Sources of
Application of Dynamic Traffic Assignment (DTA) Model to Evaluate Network Traffic Impact during Bridge Closure - A Case Study in Edmonton, Alberta
 Model to Evaluate Network Traffic Impact during Bridge Closure - A Case Study in Edmonton, Alberta") Application of Dynamic Traffic Assignment (DTA) Model to Evaluate Network Traffic Impact during Bridge Closure - A Case Study in Edmonton, Alberta Peter Xin, P.Eng. Senior Transportation Engineer Policy
Application of Dynamic Traffic Assignment (DTA) Model to Evaluate Network Traffic Impact during Bridge Closure - A Case Study in Edmonton, Alberta Peter Xin, P.Eng. Senior Transportation Engineer Policy
Service Recommendations
 Berkshire Regional Transit Authority REGIONAL TRANSIT PLAN Service Recommendations May 2015 Outline Introduction Study Process Service Recommendations Public comments Questions 2 Introduction URS Team
Copyright 2015 Silicon Valley Digital Marketing Institute, All Rights Reserved
 If your business is hoping to expand their business reach with some new opportunities, then Tumblr is the tool you should be thinking about incorporating into your social media marketing strategy. If you
Comparison: On-Device and Drive Test Measurements
 OpenSignal Commercial in Confidence Comparison: On-Device and Drive Test Measurements Methodology Background opensignal.com 0 The only thing that really matters when it comes to network performance is
On the Attendance Figure of the. Sykehus til Alta March. August 26 th 2017
 On the Attendance Figure of the Sykehus til Alta March August 26 th 2017 Study and Report by: Bert Bruyninckx & Jade Patel Crowd Safety and Risk Analysis October 9, 2017 Contents 1 INTRODUCTION AND SCOPE...
DIGITAL IN MINING: PROGRESS... AND OPPORTUNITY
 DIGITAL IN MINING: PROGRESS... AND OPPORTUNITY INTRODUCTION The mining industry has gotten some good news lately, with a lift in commodity prices and China s infrastructure growth plans. But challenges
(Beijing, China,25 May2017)
") Remarks by the Secretary General of the International Civil Aviation Organization (ICAO), Dr. Fang Liu, to the First Session of the 2017 China Civil Aviation Development Forum: New Opportunities for Aviation
Remarks by the Secretary General of the International Civil Aviation Organization (ICAO), Dr. Fang Liu, to the First Session of the 2017 China Civil Aviation Development Forum: New Opportunities for Aviation
A New Perspective in the Search for Extraterrestrial Intelligence
 A New Perspective in the Search for Extraterrestrial Intelligence A new study conducted by Dr. Nicolas Prantzos of the Institut d Astrophysique de Paris (Paris Institute of Astrophysics) takes a fresh
Discovering the source of smart:
 Discovering the source of smart: Intelligent decisions, intelligent infrastructure... How we need to integrate different ways of creating and managing information to support better decision making through
Emerging Subsea Networks
 FIBRE-TO-PLATFORM CONNECTIVITY, WORKING IN THE 500m ZONE Andrew Lloyd (Global Marine Systems Limited) Email: andrew.lloyd@globalmarinesystems.com Global Marine Systems Ltd, New Saxon House, 1 Winsford
Part I New Sensing Technologies for Societies and Environment
 Part I New Sensing Technologies for Societies and Environment Introduction New ICT-Mediated Sensing Opportunities Andreas Hotho, Gerd Stumme, and Jan Theunis During the last century, the application of
Are Cities Getting More Complex?
 8 th November 2011 Are Cities Getting More Complex? The Need for a Global Planning Institute Michael Batty m.batty@ucl.ac.uk @jmichaelbatty http://www.complexcity.info/ http://www.casa.ucl.ac.uk/ I will
Visualisation of Traffic Behaviour Using Computer Simulation Models
 Journal of Maps ISSN: (Print) 1744-5647 (Online) Journal homepage: http://www.tandfonline.com/loi/tjom20 Visualisation of Traffic Behaviour Using Computer Simulation Models Joerg M. Tonndorf & Vladimir
MSC Project Workplan
 Social Media Analytics Research and Training for the U.S. Coast Guard David Ebert APPROVED June 13, 2018 Abstract: This research project will increase the understanding of information and intelligence
THE ANV MEASUREMENT SYSTEMS SOUND INSULATION TESTING SYSTEM INSTRUCTION MANUAL FOR FIELD TESTING OF WALLS, FLOORS & STAIRS
 THE ANV MEASUREMENT SYSTEMS SOUND INSULATION TESTING SYSTEM INSTRUCTION MANUAL FOR FIELD TESTING OF WALLS, FLOORS & STAIRS HASTINGS HOUSE, AUCKLAND PARK, MILTON KEYNES, MK1 1BU 01908 642846 01908 642814
Open Research Online The Open University s repository of research publications and other research outputs
 Open Research Online The Open University s repository of research publications and other research outputs Exploring the role of intermediaries in smart grid developments Conference or Workshop Item How
Bandwidth Requirements for Day-to-Day Operations on Canada s 700 MHz Public Safety Broadband Network
 2017-05-02 DRDC-RDDC-2017-L130 Produced for: Mark Williamson, DG / DRDC Scientific Letter Bandwidth Requirements for Day-to-Day Operations on Canada s 700 MHz Public Safety Broadband Network Background
Tapping Your Inner Futurist Imagining the Future of Performing Arts Experiences. February 16,
 Tapping Your Inner Futurist Imagining the Future of Performing Arts Experiences February 16, 2017 @GarryGolden Warm up Foresight 101 Drivers of Change Discussion More or Less Change Ahead? Last ten years
Extending SUMO to support tailored driving styles
 Extending SUMO to support tailored driving styles Joel Gonçalves, Rosaldo J. F. Rossetti Artificial Intelligence and Computer Science Laboratory (LIACC) Department of Informatics Engineering (DEI) Faculty
AN0503 Using swarm bee LE for Collision Avoidance Systems (CAS)
") AN0503 Using swarm bee LE for Collision Avoidance Systems (CAS) 1.3 NA-14-0267-0019-1.3 Document Information Document Title: Document Version: 1.3 Current Date: 2016-05-18 Print Date: 2016-05-18 Document
AN0503 Using swarm bee LE for Collision Avoidance Systems (CAS) 1.3 NA-14-0267-0019-1.3 Document Information Document Title: Document Version: 1.3 Current Date: 2016-05-18 Print Date: 2016-05-18 Document
THE FUTURE OF DATA AND INTELLIGENCE IN TRANSPORT
 THE FUTURE OF DATA AND INTELLIGENCE IN TRANSPORT Humanity s ability to use data and intelligence has increased dramatically People have always used data and intelligence to aid their journeys. In ancient
This position will be subject to a full DBS check https://www.gov.uk/disclosure-barring-servicecheck/overview
 Title: Portfolio Outreach Coordinator Responsible to: Salary Schools Officer 24,000 pro-rata Hours 2 days per week (15 hours) Annual leave 33 days pro-rata including Bank Holidays Contract Temporary contract
7 th Asia Smart City Conference
 7 th Asia Smart City Conference In Yokohama 13-15 Nov. 2018 Program Outline (tentative) Organizers Organizer :City of Yokohama Co-organizer :Tokyo Development Learning Center (World Bank Group) Asian Development
Pedestrian Simulation in Transit Stations Using Agent-Based Analysis
 Urban Rail Transit (2017) 3(1):54 60 DOI 10.1007/s40864-017-0053-5 http://www.urt.cn/ ORIGINAL RESEARCH PAPERS Pedestrian Simulation in Transit Stations Using Agent-Based Analysis Ming Tang 1 Yingdong
FUTURE OF MOBILITY. Dr Rupert Wilmouth Head of Sustainable Economy
 FUTURE OF MOBILITY Dr Rupert Wilmouth Head of Sustainable Economy Government Office for Science Leading GO-Science is Professor Sir Mark Walport, Government Chief Scientific Adviser: Our role is to advise
Dunhuang: On the Silk Road with smart tourism and big data
 Voices from Industry Dunhuang: On the Silk Road with smart tourism and big data As an ancient hub along the Silk Road, China s Dunhuang started life as a meeting point for different people and cultures.
CLICK HERE TO KNOW MORE
 CLICK HERE TO KNOW MORE BUILDING SMART CITIES WITH SMART CITIZENS Dr. Mazlan Abbas CEO - REDtone IOT Sdn Bhd Email: mazlan.abbas@redtone.com GeoSmart Asia 2015, Malaysia PRESENTATION CONTENTS Smart City
Staff get data back just hours after fire guts The Academy, Selsey. Redstor to the rescue after disaster strikes
 Staff get data back just hours after fire guts The Academy, Selsey Redstor to the rescue after disaster strikes Blaze destroys server room Redstor restores 100% of school s data Redstor came to the rescue,
LEARNING CENTRE INFORMATION GUIDE
 LEARNING CENTRE INFORMATION GUIDE ROC-ED LEARNING CENTRE ROC ED Foreword The Pilbara region of Western Australia is widely known for the extent of its mineral wealth and has been home to world-class iron
The Traffic Jam of Robots: Implications of Autonomous Vehicles for Trip-Making and Society
 The Traffic Jam of Robots: Implications of Autonomous Vehicles for Trip-Making and Society Joan Walker University of California, Berkeley ASILOMAR 2017 The 16 TH Biennial Conference on Transportation and
MILTON KEYNES: HOW WE MADE OUR CITY SMARTER
 MILTON KEYNES: HOW WE MADE OUR CITY SMARTER Alan Fletcher Knowledge Media Institute The Open University UK September 2016 LOCATION Where? London: 88 km Oxford: 74 km Cambridge: 77 km Birmingham: 110 km
European Utility Week 2014 Amsterdam. Case Study Power Network 2030 Stettlen
 European Utility Week 2014 Amsterdam Case Study Power Network 2030 Stettlen Oliver Krone Head of Smart Grid Engineering BKW Energie AG - Switzerland 5 November 2014 Agenda BKW Group and Activities Motivation
Scoping Paper for. Horizon 2020 work programme Societal Challenge 4: Smart, Green and Integrated Transport
 Scoping Paper for Horizon 2020 work programme 2018-2020 Societal Challenge 4: Smart, Green and Integrated Transport Important Notice: Working Document This scoping paper will guide the preparation of the
The Response of Motorola Ltd. to the. Consultation on Spectrum Commons Classes for Licence Exemption
 The Response of Motorola Ltd to the Consultation on Spectrum Commons Classes for Licence Exemption Motorola is grateful for the opportunity to contribute to the consultation on Spectrum Commons Classes
COST OF TRAFFIC US alone wasted about 3 billion gallons of fuel thanks to traffic in 2014, America blew through $160 billion in wasted time and fuel
 COST OF TRAFFIC US alone wasted about 3 billion gallons of fuel thanks to traffic in 2014, America blew through $160 billion in wasted time and fuel last year -- an average cost of $960 per typical motorist,
SMART MANUFACTURING: A Competitive Necessity. SMART MANUFACTURING INDUSTRY REPORT Vol 1 No 1.
 SMART MANUFACTURING: A Competitive Necessity SMART MANUFACTURING INDUSTRY REPORT Vol 1 No 1. Get Smart Three years ago the world was introduced to Amazon Echo, and its now popular intelligent personal
Distributed Robotics: Building an environment for digital cooperation. Artificial Intelligence series
 Distributed Robotics: Building an environment for digital cooperation Artificial Intelligence series Distributed Robotics March 2018 02 From programmable machines to intelligent agents Robots, from the
Road Traffic Estimation from Multiple GPS Data Using Incremental Weighted Update
 Road Traffic Estimation from Multiple GPS Data Using Incremental Weighted Update S. Sananmongkhonchai 1, P. Tangamchit 1, and P. Pongpaibool 2 1 King Mongkut s University of Technology Thonburi, Bangkok,
Internet of Things. (Ref: Slideshare)
") Internet of Things (Ref: Slideshare) Contents Introduction/Overview The Internet of Things Applications of IoT Challenges and Barriers in IoT Future of IoT Internet Revolution Impact of the Internet Education
Internet of Things (Ref: Slideshare) Contents Introduction/Overview The Internet of Things Applications of IoT Challenges and Barriers in IoT Future of IoT Internet Revolution Impact of the Internet Education