QUANTAX. think forward. EDS Analysis for SEM and TEM MICROANALYSIS
|
|
|
- Brett Brooks
- 5 years ago
- Views:
Transcription


1 Bruker AXS Microanalysis QUANTAX EDS Analysis for SEM and TEM think forward MICROANALYSIS

2 The new QUANTAX EDS systems unprecedented speed, accuracy and ease of use Our unique 5000 series of LN 2 --free XFlash Silicon Drift Detectors and the latest version of the powerful ESPRIT software deliver extraordinary performance in qualitative and quantitative energy-dispersive microanalysis.


3 QUANTAX the future of microanalysis The design of Bruker s QUANTAX microanalysis system is based on many years of experience in developing and manufacturing energy-dispersive X-ray spectrometers in close partnership with our user community. Our users requirements have driven development priorities: n Reliable analysis results n Intuitive operation, powerful visualization options n Convenient result presentation n Integration with complementary analytical methods The EDS spectrometer The QUANTAX EDS system is modular and can be easily configured for any application. The outstanding hardware is controlled by the intuitive ESPRIT software suite. The ESPRIT interface is carefully tailored to the way that you actually work. All the tools and controls to easily acquire, display, and analyze your data are at your fingertips. guarantee optimal performance under all conditions. The XFlash Detectors unite unbeatable technical parameters with high reliability. Ultra fast signal processing electronics and new analytical options like real-time spectrometry, ColorScan and HyperMap turn QUANTAX into the fastest and most comprehensive EDS system on the market. Superior technology, intelligent solutions, and attention to detail in both the design and manufacturing processes combine to ensure the high quality of QUANTAX EDS systems. Bruker s signal processors for single-channel operation (upright) and with four channels for the XFlash QUAD (horizontal) ESPRIT features both standardless and standard-based quantification and also offers the unique possibility of combining standardless and standard-based algorithms in one evaluation procedure. Evaluation can be done automatically or interactively. Interactive operation allows expert users to optimize their analysis, while our flexible and powerful automated batch processing is ideal for applications requiring repetitive analyses, such as quality control. The high-performance, liquid nitrogenfree XFlash Silicon Drift Detectors (SDDs), in combination with the unique hybrid pulse processor technology, FWHM [ev] Si(Li) (10 mm²) XFlash 5010 (10 mm 2 ) Input count rate [kcps] Comparison of the energy resolution of the XFlash 5010 and a 10 mm² Si(Li) detector at various input count rates
.")
4 The XFlash started a new era The heart of this modern detector technology is a silicon chip using the principle of sideward depletion and a small anode to minimize capacitance (and thus maximize the effective signal-to-noise ratio). This mode of operation allows the XFlash Detectors to cope with extremely high count rates while also maintaining an energy resolution unrivaled by any other energy-dispersive detection system. The 5000 series XFlash Silicon Drift Detectors display high pulse load capability combined with excellent and stable energy resolution (down to 123 ev). Their optimized electron trap allows interference-free analysis even at low excitation energies. Special software adaptations and the world s most comprehensive atomic data library now also containing N-lines make QUANTAX the perfect system for nanoanalysis. The XFlash Detectors are based on Bruker s long experience in developing liquid nitrogen-free detector technology. Today, with more than 3,000 detectors currently in use, Bruker AXS Microanalysis is the acknow ledged leader in SDD technology. The chip temperature is stabilized by a two-stage, passive Peltier cooler. The great advantage of Peltier cooling is that it introduces absolutely no vibrations that could degrade the operation of the microscope (unlike other systems that use noisy mechanical coolers). Already in 1998, our innovative technology received the Macres Award - Best Instrumentation from the Microbeam Analysis Society of America. XFlash 5010 features the best energy resolution ever specified for a commercial X-ray detector 123 ev. On top of that, the resolution is specified at an input count rate of 100,000 cps. Conventional Si(Li) detectors are usually specified at 1,000 or 2,500 cps. This outstanding energy resolution allows an excellent peak separation, especially in the low energy range below 1 kev, resulting in outstanding performance for light element detection and quantification.
5 FWHM [ev] ICR [kcps] Drift rings Irradiated area Signal elec trons Anode and integrated FET XFlash 5010 s droplet-shaped detector chip Comparison of the energy resolution of the XFlash 5010 and another SDD at increasing count rates 2,5 Other SDD (10 mm²) XFlash 5010 (10 mm 2 ) Input count rate of several detectors at their best resolution 50 Input count rate [kcps] 100 Si(Li) SDD with XFlash 5010 digital pulse processor When working with applications that deliver low count rates, such as applications with cold field emission scanning electron microscopes or transmission electron microscopes, high detection efficiency is necessary. The XFlash 5030, with an active area of 30 mm 2, complies with this requirement and, at the same time, achieves a superb energy resolution. The XFlash QUAD impresses with in credible speed and excellent energy resolution. This detector has four independently operating 10 mm 2 sensors on a single chip that provide a total active area of 40 mm 2. The great advantage of this new design concept is that the detec tor maintains the high energy resolution of a single 10 mm 2 SDD while offering 4 times the solid angle and throughput capability. This detector can collect a maximum of 1,100,000 cps into the spectrum. Due to the combination of large solid angle and supreme energy resolution, the XFlash QUAD is also suitable for low beam current and low energy applications. With its four separate sensors, this detector can process the fourfold number of counts compared to a single-channel system. Hybrid pulse processor Bruker s hybrid pulse processor, specially developed for XFlash SDDs, combines the best of both worlds: analog and digital techniques facilitate signal processing at extremely high count rates. This makes the system up to ten times faster than conventional Si(Li) detectors using digital pulse processors. Even at low count rates, QUANTAX accelerates ana lysis due to its extremely low dead times. At 1,000 cps the system performs 30% faster than and at 5,000 cps, twice as fast as conventional Si(Li) systems. The third graphic on the left shows the superiority of Bruker s hybrid pulse processors compared to SDDs operated with digital pulse processors. Our unique technology also makes problematic pileup software correction techniques unnecessary, even at high input count rates. All specifications are of course warran ted in situ on the SEM or TEM. The detectors are adaptable to all types of SEMs or TEMs. A perfect detector/microscope interface and optimum conditions regarding covered solid angle and take-off angle are guaranteed in all cases. XFlash is a registered trademark of Bruker AXS Microanalysis GmbH. Energy resolution Resulting energy resolution Mn Kα C Kα F Kα 133 ev 65 ev 73 ev 123 ev 46 ev 54 ev Input count rate 1,000 cps 30 % 5,000 cps 50 % Speed advantage XFlash vs. Si(Li) 750,000 cps 10 times faster


6 Element identification and spectrum evaluation Al contact Si dead layer Bi-Mζ 1,2 Calculation of the bremsstrahlung background according to a physical model. The graphic shows the magnified representation of the adaptation to a bismuth spectrum. The absorption edges of the single element lines and the detector effects (Al contact, Si dead layer) are visible. Carefully designed down to the smallest detail while following customer requirements: Bruker sets new standards for ease of use and in spectrum evaluation. Real-life samples consist of many different materials and structures such as fragments, powders and fibers. Standard-based quantification techniques are often not appropriate, as adequate standards are not available or the samples cannot be prepared properly. M5 M4 Bi-Mα Bi-Mß Bi-Mγ M3 M2 M kev Standardless P/B-ZAF quantification In these cases, Bruker recommends using our unique standardless quantification method. This method relies on peak-to-background ZAF evaluation (P/B-ZAF) and provides reliable quantification results for all types of samples even for challenging analysis tasks. The P/B-ZAF algorithm is based on a physical model using information obtained from bremsstrahlung background radiation as an internal standard for quantification. Peak-to-background (P/B) ratios used for calculating quantitative data are more robust than net intensities used by other algorithms. Accordingly, roughsurfaced samples and particles can be accurately quantified. The P/B-ZAF method is a genuinely standardless approach; all information necessary for complete and exact quantification is extracted from the spectrum itself. No additional information stored in spectra libraries is required, as in many other approaches also called standardless. The world s most comprehensive atomic data base ESPRIT s enhanced atomic data base guarantees proper identification and correct deconvolution of overlapped element lines and therefore a reliable quantification. Important additional information regarding the position, classification or relative intensity of the existing L and M-lines is included in ESPRIT. Furthermore, N-lines are inte grated into the software a worldwide first. The intensity of these lines exceeds the intensity of the M-lines at very low excitation energies ( 3 kev). In this way, they play an increasingly important role in nanoanalysis. 5


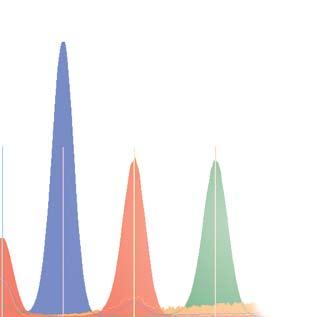
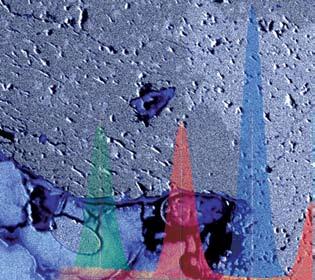
7 ESPRIT user interface 1 Hardware section 2 Project section 3 Acquisition and evaluation 4 Function-specific section, selected function is highlighted 5 Main menu ESPRIT allows analyses to be carried out automatically or in an interactive mode permitting the user to monitor and control every step of the quantification procedure. Every spectrum processing or evaluation option can be selected consecutively. The menus are clearly structured and show high functionality. An integrated expert system supports the user during the analysis and gives hints for optimizing the evaluation. Pt-N O Cu 1.0 Pt-M Platinum spectrum acquired at 3.0 kv. At this excitation energy, the platinum N-line is almost as high as the M-line kev Be B C N O F 0.5 kev 1.0 Composite spectrum made up of several single measurements showing XFlash 5010 s impressive performance in the light element range.
 matrix correction. This approach is implemented in the ESPRIT HSQuant software module.")
8 Standard-based spectrum evaluation Dialog for the easy selection of appropriate standards for quantification In addition to our comprehensive standardless P/B-ZAF quantification method, ESPRIT provides a standard-based method relying on net intensities and Φ(ρ,z) matrix correction. This approach is implemented in the ESPRIT HSQuant software module. Compared to the standardless method, the standard-based quantification yields the highest possible accuracy. However, standard-based measurements involve considerable efforts. If all necessary requirements are met, accuracy is often better than two percent. Apart from the high parameter stabi lity and reproducibility, this analysis method also requires standards with matrix similar to the sample. QUANTAX provides the user with easy-to-use library management tools. Pure element standards as well as composite standards can be measured and added with only a few mouse clicks. Standards to be used for a particular analytical task can be determined automatically by the system or manually by the user if desired. Standard-based quantifications using a single reference sample can be used for routine analyses in process and quality control. In these cases, highly accurate and reproducible results are already achieved by means of calibration measurements on the reference sample without involving a standard library. The best of two worlds the combination of Φ(ρ,z) and P/B-ZAF analysis In 2005, Bruker introduced a method that combines the advantages of the standard-based Φ(ρ,z) correction with those of the true standardless P/B-ZAFapproach. If adequate standards are available, they are used to quantify corresponding elements. All other elements are automatically quantified using the standardless method. The user-friendly operating philosophy, the integrated help menu and the detailed documentation permit a fast familiarization with the system for beginners. But this combined method s high efficiency will also convince the more experienced user.
 and rough (red measuring points) areas Ni P 1.0 2.")
![0 kev Smooth areas Rough areas Smooth areas Rough areas Measuring point Ni [%] P [%] Measuring point Ni [%] P [%] 1 95.28 4.72 7 95.01 4.99 2 95.29 4.71 8 94.72 5.28 3 95.26 4.74 9 95.32 4.68 4 95.](/docs-images/87/96527077/images/9-1.jpg "38 4.62 10 94.64 5.36 5 95.29 4.71 11 94.64 5.36 6 95.25 4.75 12 96.06 3.94 Average 95.29 4.71 Average 95.06 4.94 Measuring point Ni [%] P [%] Measuring point Ni [%] P [%] 1 95.27 4.73 7 95.32 4.")
9 Comparison of standardless and standard-based quantification Overlay of the spectra acquired at the six measuring points in rough-surfaced areas of the sample (red crosses in the image below) Ni Surface of a galvanic nickel phosphide film with smooth (green measuring points) and rough (red measuring points) areas Ni P kev Smooth areas Rough areas Smooth areas Rough areas Measuring point Ni [%] P [%] Measuring point Ni [%] P [%] Average Average Measuring point Ni [%] P [%] Measuring point Ni [%] P [%] Average Average Target value 4.72 % P Acceptable tolerance ± 0.25 % Target value 4.72 % P Acceptable tolerance ± 0.25 % The standard-based analysis with Φ(ρ, z)-correction delivers unrivaled results in the case of smooth areas. However, the analysis of rough areas is quite problematic. The standardless P/B-ZAF-method delivers the best results for the analysis of rough surfaces.


10 Your SEM learns to see colors TV, computer screens or digital photography in black and white are remnants of the past. Nowadays everything is in color. Surprisingly, black and white images are still common in electron microscopy. The ultra fast QUANTAX hardware now delivers the necessary count rates for generating element distribution images in color with the accuracy and speed of an electron image. The ESPRIT line scan feature collects element profiles at incredible speed providing the user with noticeably more convenience. Acquisition needs only a fraction of the time compared to standard Si(Li) systems using digital pulse processors. ESPRIT an intuitive, easy-to-use interface provides flexible analysis options. All important information is visible at a glance. The line to be profiled can be freely drawn on the SEM image with a few mouse clicks. After having determined the elements of interest in the overview spectrum, the magnified electron image and the scanned line are displayed directly below the line scan profile. The line scan profile can then be immediately related to the topography of the electron image. In contrast to other EDS systems, QUANTAX allows an unlimited number of elements to be selected for line scan analysis. Variable scan speed is combined with pixel and line averaging capabilities to enable the use of high beam currents, even for sensitive samples. Qualitative line scan of an oxidic sample. A magnified image of the analyzed area is displayed below the line scan. Interesting points can be exactly located by moving the vertical line cursor. Linescan When analyzing element distributions in a sample, the advantages of the high-speed, high-resolution XFlash SDDs in combination with the hybrid pulse processor technology are outstanding. The results for which you had to wait for hours in the past are now on your desk within a few minutes or even seconds. Complete spectra are stored at every pixel along the scanned line. Identifying and evaluating new elements is possible at any time later without having to collect new line scan data. In-depth analyses need not be carried out at the microscope; they can easily be performed on a remote computer. Especially when dealing with rough surfaces or particles, line scans based on intensities only may lead to wrong results due to varying absorption in the sample. Quantitative line scans using the P/B-ZAF evaluation method avoid such misinterpretation and therefore generate highly reliable quantitative element profiles.

 to americium (95) can be mapped.")


11 High-resolution mapping original size 2048 x 1536 of tiny solder pellets on carbon adhesive tape. Lead is represented in green, tin in red and the adhesive tape, which can be seen between the pellets, in blue. QUANTAX s high precision makes it possible to see details typically seen in SE images in color! Single element maps can contain up to 65,000 colors. There is no limitation to the number of simultaneous element maps and all elements from beryllium (4) to americium (95) can be mapped. Element mapping QUANTAX collects maps up to ten times faster than conventional systems. Brilliant element distribution images are generated right in front of your eyes like never before! As a part of the intuitive ESPRIT software, the element mapping feature is easy to use. All needed data is clearly laid out and results are only a mouse click away. If you are used to waiting for hours for a reasonable map, prepare for a completely new experience: high-resolution maps within minutes. In addition to a large number of pixels, the Bruker system s high resolution also means high information density at each pixel, clearly showing even minor differences in concentration. Mapped images can be displayed as single element maps or superimposed. SE or BSE images can be added to the map showing topographical information on phases, micro-inclusions, grains, etc. Discover brilliant element images of unprecedented quality after only a few minutes of acquisition. Just like quantitative line scan, quantitative mapping delivers impressive results even for rough surfaces and particles. The advantages of the P/B-ZAF approach are evident here. Real-time spectrometry QUANTAX s extreme speed permits a totally new approach to spectrometry. Detailed information on the element distribution of a sample becomes visible instantly thanks to the XFlash detector technology and can be refined with every repetitive scan. High-resolution mapping images of various materials
, phase analysis helps achieve a clearer representation of the sample s characteristics. ESPRIT HyperMap provides users with complete new perspectives.")


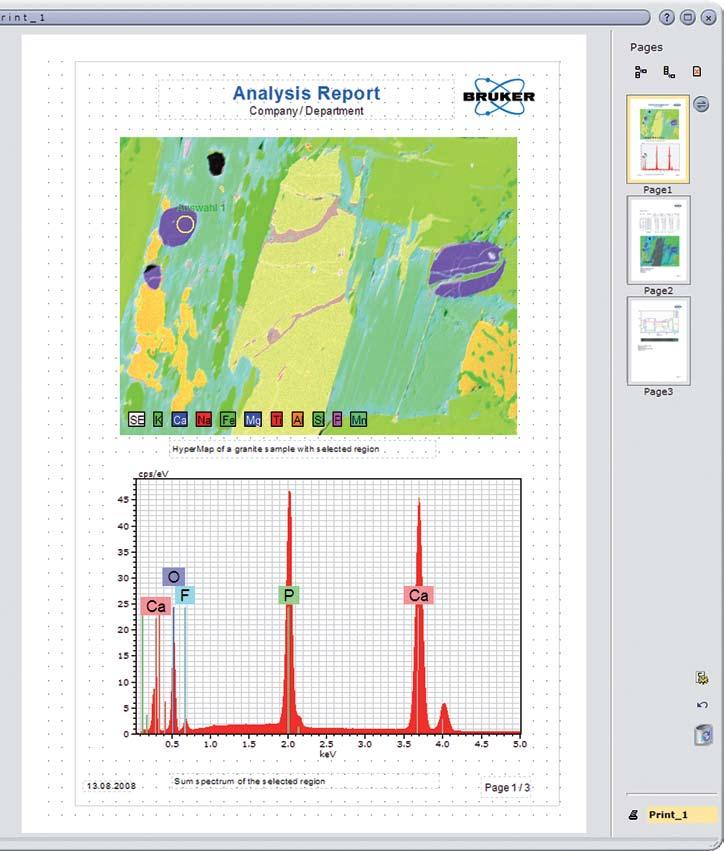
12 HyperMap discover new insights If mappings become unclear due to the element distribution and the resulting color contrast (such as in the shown mapping of a concrete sample with the elements aluminum, silicon, calcium and iron), phase analysis helps achieve a clearer representation of the sample s characteristics. ESPRIT HyperMap provides users with complete new perspectives. HyperMap is Bruker s version of position-tagged spectrometry (PTS). This technique was first introduced in 1996 by Princeton Gamma-Tech (now part of Bruker AXS Microanalysis). Spectra are stored at each pixel of a map or line scan. This allows collected data to be completely reanalyzed at any time, including examination of new elements, without having to acquire new data. Until now, all available systems had a critical problem: due to the low count rates delivered by Si(Li) detectors, a precise evaluation was obtained only after an excessively long acquisition time. With the introduction of the XFlash detector technology, the mapping techniques have become of practical relevance, since the result statistic is now sufficient after measuring for only a few minutes. Thanks to these technical improvements, the mapping function has been extended by additional features to obtain further valuable information on sample composition. Maximum Pixel Spectrum This feature was originally developed by the National Institute of Standards and Technology (NIST). It is actually quite simple: a spectrum is synthesized by determining the highest count value in each channel of all spectra in the HyperMap. In this way, elements can be found, even if they are contained only in one single pixel. n Sum spectrum n Maximum Pixel Spectrum Maximum Pixel Spectrum of a granite sample (red) that indicates traces of the rare lanthanoids cerium, lanthanum and thorium. These elements are not evident in the sum spectrum (blue).
, titanium (Ti) and phosphorus (P) is highlighted.")


13 HyperMap of a granite sample, qualitative representation. The distribution of the single elements iron (Fe), titanium (Ti) and phosphorus (P) is highlighted. Phase analysis ESPRIT Autophase can be used on qualitative and quantitative maps, as well as on HyperMaps. This feature reliably determines which phases are present in your sample. The phases can be identified automatically or manually according to the user s preferences (e.g. histogram analysis or predefined objects). Phase analysis result of a granite sample. (Sample courtesy of the Berlin Museum of Natural History) Drift correction When acquiring a map at a high beam current or over longer periods of time, the electron image may drift. This effect also occurs in the case of sample charging. ESPRIT Drift Correction compen sates for the drift. This feature can be used on HyperMaps, as well as on normal mappings and image acquisition. The drift correction feature compensates for image distortions. The top half of the picture shows a mapping without drift correction; the bottom half, the same with drift correction.

14 ESPRIT Report The ESPRIT Report Editor enables the user to freely generate templates (e.g. in the corporate design of your company). All results spectra, maps, line scans, tables, graphics, and images can be read, rearranged, resized, edited, and supplemented with annotations. Spectra, maps, line scans, and tables can be altered directly and at any time later in the Report Manager. Easy-to-use tools for adding text, objects and drawings are included to help customize presentations. Whatever your demands might be, ESPRIT will give you the means to fulfil them. There are certain fields where compromises can not be accepted. One of them is your final analysis step report generation. QUANTAX offers one of the most modern and convenient tools for report generation, result presentation, and archiving. Spectra, images, tables, and graphics can be stored or archived indi vidually or in projects containing all material belonging to a user-defined topic. Several export formats can be used for flexible data exchange with third-party software applications. A simple mouse click transfers a complete report to Microsoft Word. Combining Methods In order to obtain additional analytical information, QUANTAX can be integrated with various software and hardware solutions making it easy to obtain results from complementary analytical methods. For special applications, QUANTAX provides an API interface for external control. Enthusiastic QUANTAX users from all over the world and more than 3,000 installed XFlash detectors encourage us to continue striving for constant technological progress!
15
16 QUANTAX systems QUANTAX model QUAD Short description Entry level modular EDS system Universally applicable modular EDS system High-end modular EDS system Top of the range 4-channel EDS system Available detectors XFlash 5010 XFlash 5030 XFlash 5010 XFlash 5030 XFlash 5010 XFlash 5030 XFlash QUAD 5040 ESPRIT software Module Spectrum Quant EQuant UQuant HSQuant CLQuant SpecMatch Scan ColorScan SEMLink Vision MultiPoint Line QLine Description Spectra acquisition, element identification Automatic standardless quantification Extended spectrum analysis options User defined quantification strategies Combined Φ(ρ,z) and standardless analysis Cliff-Lorimer quantification Spectrum matching, search similar spectra Image acquisition Colored element image Data communication with microscope Digital image processing and enhancement Automatic multi-point and object analysis Spectrum data based line scan Quantitative line scan Module Map QMap HyperMap MaxSpec DriftCorr Project Report User LAN Support StageControl JobControl AutoPhase Feature Description Ultra high speed digital X-ray mapping Quantitative mapping Mapping with hyper spectral database Element trace determination for HyperMap Correction of specimen drift Data management and filing system Result presentation and report generation Multi-user operation and administration Client/server architecture Application support and remote diagnosis Motorized stage control Automatic task processing Automatic phase analysis Feature analysis, chemical classification All configurations and specifications are subject to change without notice. Order No. DOC-B82-EXS Bruker AXS Microanalysis GmbH. Printed in Germany. Bruker AXS Microanalysis Schwarzschildstr Berlin Germany Tel. +49 (30) Fax +49 (30) Bruker AXS Microanalysis in: Australia Tel. +61 (3) Korea Tel. +82 (2) Brazil Tel. +55 (11) Mexico Tel. +52 (55) P.R. China Tel. +86 (10) Nordic Countries Tel. +46 (8) Japan Tel. +81 (45) South Africa Tel. +27 (11) Southeast Asia Tel USA Tel. +1 (609) Or find your local partner at:
Quantax 100 Low-Cost EDS System. Innovation with Integrity
 Quantax 100 Low-Cost EDS System Innovation with Integrity XFlash 410 Low Cost Silicon Drift Detector Quantax 100 EDS system includes the XFlash 410 SDD Proven Bruker SDD technology, since 1997 Maintenance-free,
QUANTAX. Innovation with Integrity. EDS with Slim-line Technology for SEM and TEM EDS
 QUANTAX EDS with Slim-line Technology for SEM and TEM Innovation with Integrity EDS Excellence in X-ray Analysis for the Electron Microscope The new generation of QUANTAX EDS features slim-line technology
BRUKER ADVANCED X-RAY SOLUTIONS. SPECTROMETRY SOLUTIONS ARTAX mxrf SPECTROMETER
 BRUKER ADVANCED X-RAY SOLUTIONS SPECTROMETRY SOLUTIONS ARTAX mxrf SPECTROMETER Microanalysis ARTAX Elemental Analysis for the Art Community and More Non-destructive elemental analysis is strictly required
Bruker Nano. M4 tornado. High performance micro-xrf spectrometer. think forward
 Bruker Nano M4 tornado High performance micro-xrf spectrometer think forward µ-xrf M4 TORNADO setting standards in µ-xrf µ-xrf is the method of choice for highly sensitive and non-destructive elemental
M4 TORNADO PLUS. Innovation with Integrity. Super Light Element Micro-XRF Spectrometer. Micro-XRF
 M4 TORNADO PLUS Super Light Element Micro-XRF Spectrometer Innovation with Integrity Micro-XRF M4 TORNADO PLUS - A New Era in Micro-XRF M4 TORNADO PLUS is the world's first Micro-XRF spectrometer that
X-Ray Spectroscopy with a CCD Detector. Application Note
 X-Ray Spectroscopy with a CCD Detector In addition to providing X-ray imaging solutions, including CCD-based cameras that image X-rays using either direct detection (0.5-20 kev) or indirectly using a scintillation
Quick and simple installation and no maintenance needed. 3 Times More affordable Than a normal SEM. Obtaining results in less than 4 minutes
 INTRODUCTION We believe that every laboratory working in the field of nanotechnology needs an SEM, therefore we would like to introduce to you our IEM series of SEM. In short space of time, our device
Lab Report XRF 441 Elemental distribution analysis on geological samples with the M4 TORNADO
 Bruker Nano Spectrum Geological sample M4 TORNADO Quantification Lab Report XRF 441 Elemental distribution analysis on geological samples with the M4 TORNADO Geological samples are inhomogeneous. The distribution
Advancing EDS Analysis in the SEM Quantitative XRF. International Microscopy Congress, September 5 th, Outline
 Advancing EDS Analysis in the SEM with in-situ Quantitative XRF Brian J. Cross (1) & Kenny C. Witherspoon (2) 1) CrossRoads Scientific, El Granada, CA 94018, USA 2) ixrf Systems, Inc., Houston, TX 77059,
QUANTAX FlatQUAD. Innovation with Integrity. EDS for SEM with the XFlash FlatQUAD EDS
 QUANTAX FlatQUAD EDS for SEM with the XFlash FlatQUAD Innovation with Integrity EDS Maximum Efficiency in X-ray Detection... QUANTAX FlatQUAD is the EDS microanalysis system based on the revolutionary
LYNXEYE XE. Innovation with Integrity. High-Resolution Energy-Dispersive Detector for 0D, 1D, and 2D Diffraction XRD
 High-Resolution Energy-Dispersive Detector for 0D, 1D, and 2D Diffraction The is the first energy dispersive 0D, 1D, and 2D detector operating at room temperature for ultra fast X-ray diffraction measurements.
Evaluating the Performance of a Commercial Silicon Drift Detector for X-ray Microanalysis
 Evaluating the Performance of a Commercial Silicon Drift Detector for X-ray Microanalysis Edward A. Kenik Materials Science & Technology Division, Oak Ridge National Laboratory, Oak Ridge, TN 37831 kenikea@ornl.gov
INTRODUCTION We believe that every laboratory working in the field of nanotechnology needs an SEM, therefore we would like to introduce to you our IEM
 INTRODUCTION We believe that every laboratory working in the field of nanotechnology needs an SEM, therefore we would like to introduce to you our IEM series of SEM. In short space of time, our device
M6 JETSTREAM. Innovation with Integrity. Large Area Micro X-ray Fluorescence Spectrometer. Micro-XRF
 M6 JETSTREAM Large Area Micro X-ray Fluorescence Spectrometer Innovation with Integrity Micro-XRF Spatially Resolved Elemental Analysis of Large Objects The Bruker M6 JETSTREAM is designed for the nondestructive
FIRST Newsletter March 2013, Issue 20. Elemental Distribution Analysis of a Meteorite Sample from the Rochechouart Structure with the µ-xrf M4 TORNADO
 FIRST Newsletter March 2013, Issue 20 Elemental Distribution Analysis of a Meteorite Sample from the Rochechouart Structure with the µ-xrf M4 TORNADO By Dr. Roald Tagle, Ulrich Waldschlager, Dr. Michael
ARTAX. Innovation with Integrity. Portable Micro-XRF Spectrometer. Micro-XRF
 ARTAX Portable Micro-XRF Spectrometer Innovation with Integrity Micro-XRF ARTAX Elemental Analysis for the Art Community and More The ARTAX is the first portable X ray fluorescence (XRF) spectrometer designed
LYNXEYE XE-T. < 380 ev. Innovation with Integrity. Energy. Resolution. High-Resolution Position Sensitive Detector with Superb Energy Resolution XRD
 Energy < 380 ev Resolution High-Resolution Position Sensitive Detector with Superb Energy Resolution The is the next generation "Compound Silicon Strip" detector with superb energy resolution for ultrafast
NSS Spectral Imaging System Handbook Version 3.0
 NSS Spectral Imaging System Handbook Version 3.0 The information in this publication is provided for reference only. All information contained in this publication is believed to be correct and complete.
System NMI. Accuracy is the Key. Classifying the Content of Non-metallic Inclusions in Steel in Accordance with Current Industrial Standards
 Microscopy from Carl Zeiss System NMI Accuracy is the Key Classifying the Content of Non-metallic Inclusions in Steel in Accordance with Current Industrial Standards New Guidelines Require New Priorities:
X-Supreme8000. A powerful innovative XRF analytical solution combining performance with flexibility
 QUALITY A powerful innovative XRF analytical solution combining performance with flexibility Centre of Excellence For many years Oxford Instruments has been at the centre of innovative science and its
AZtecEnergy. EDS Acquisition and Analysis....the ultimate EDS System
 AZtecEnergy EDS EDS Acquisition and Analysis...the ultimate EDS System AZtecEnergy EDS The most powerful, the most flexible EDS system you ll ever see AZtec integrates AZtecEnergy acquisition and analysis
Add CLUE to your SEM. High-efficiency CL signal-collection. Designed for your SEM and application. Maintains original SEM functionality
 Add CLUE to your SEM Designed for your SEM and application The CLUE family offers dedicated CL systems for imaging and spectroscopic analysis suitable for most SEMs. In addition, when combined with other
WIDE ANGLE GEOMETRY EDXRF SPECTROMETERS WITH SECONDARY TARGET AND DIRECT EXCITATION MODES
 Copyright(C)JCPDS-International Centre for Diffraction Data 2000, Advances in X-ray Analysis, Vol.42 11 Copyright(C)JCPDS-International Centre for Diffraction Data 2000, Advances in X-ray Analysis, Vol.42
CLEMEX intelligent microscopy
 CLEMEX intelligent microscopy Vision PE 5.0 Advanced Image Analysis Experience in Image Analysis Research and Quality Control Solutions With Vision PE, Clemex provides a powerful image analysis solution
Development of JEM-2800 High Throughput Electron Microscope
 Development of JEM-2800 High Throughput Electron Microscope Mitsuhide Matsushita, Shuji Kawai, Takeshi Iwama, Katsuhiro Tanaka, Toshiko Kuba and Noriaki Endo EM Business Unit, JEOL Ltd. Electron Optics
Processing of MA(or µ)-xrf Data with the M6 software
-xrf Data with the M6 software") Processing of MA(or µ)-xrf Data with the M6 software Roald Tagle, Max Bügler, Falk Reinhardt, and Ulrich Waldschläger Bruker Nano Berlin Innovation with Integrity Outline 1. Introduction 2. From the object
Processing of MA(or µ)-xrf Data with the M6 software Roald Tagle, Max Bügler, Falk Reinhardt, and Ulrich Waldschläger Bruker Nano Berlin Innovation with Integrity Outline 1. Introduction 2. From the object
High specification CCD-based spectrometry for metals analysis
 High specification CCD-based spectrometry for metals analysis New developments in hardware and spectrum processing enable the ARL QUANTRIS CCD-based spectrometer to achieve the performance of photo-multiplier
Silicon Drift Detectors Explained
 Silicon Drift Detectors Explained 1.0 Introduction EDS (Energy Dispersive Spectroscopy) is an established technique used to characterise the elemental composition of a sample under the beam of an electron
ALTURA EDS. Rev. 0915
 ALTURA EDS Rev. 0915 Enable the Oxford PC Enable the Altura-EDS under Dual Beam Tools in Coral. Or enter your NETID and password directly into the Oxford PC. Warning: Ion-milling, GISs/microprobe, and
STEM Spectrum Imaging Tutorial
 STEM Spectrum Imaging Tutorial Gatan, Inc. 5933 Coronado Lane, Pleasanton, CA 94588 Tel: (925) 463-0200 Fax: (925) 463-0204 April 2001 Contents 1 Introduction 1.1 What is Spectrum Imaging? 2 Hardware 3
Keysight Technologies Why Magnification is Irrelevant in Modern Scanning Electron Microscopes. Application Note
 Keysight Technologies Why Magnification is Irrelevant in Modern Scanning Electron Microscopes Application Note Introduction From its earliest inception, the Scanning Electron Microscope (SEM) has been
FAST ELEMENTAL MAPPING WITH MICRO-XRF
 286 FAST ELEMENTAL MAPPING WITH MICRO-XRF Haschke, M.; Rossek, U.; Tagle, R.; Waldschläger, U. Bruker Nano GmbH, 12489 Berlin, Schwarzschildstr.12 ABSTRACT X-Ray optics are now in common use for concentrating
Aqualog. Water Quality Measurements Made Easy PARTICLE CHARACTERIZATION ELEMENTAL ANALYSIS FLUORESCENCE
 Aqualog Water Quality Measurements Made Easy ELEMENTAL ANALYSIS FLUORESCENCE GRATINGS & OEM SPECTROMETERS OPTICAL COMPONENTS PARTICLE CHARACTERIZATION RAMAN SPECTROSCOPIC ELLIPSOMETRY SPR IMAGING Water
Energy Dispersive Spectrometry Hardware
 from: http://www.x-raymicroanalysis.com/pages/tutorial1/system1.htm Energy Dispersive Spectrometry Hardware Introduction The Microanalysis System Ease of use has become a major focus in the selection of
Leading in Desktop SEM Imaging and Analysis
 Leading in Desktop SEM Imaging and Analysis Fast. Outstanding. Reliable SEM imaging and analysis. The Phenom: World s Fastest Scanning Electron Microscope With its market-leading Phenom desktop Scanning
The SS6000 Gold Mate Series For analyzing all precious metals and other elements from Mg to U
 The SS6000 Gold Mate Series For analyzing all precious metals and other elements from Mg to U Portable desk top EDXRF analyzers Responsive, bright, color touch screen display Uses Silicon Drift or Silicon
JEM-F200. Multi-purpose Electron Microscope. Scientific / Metrology Instruments Multi-purpose Electron Microscope
 Scientific / Metrology Instruments Multi-purpose Electron Microscope JEM-F200 Multi-purpose Electron Microscope JEM-F200/F2 is a multi-purpose electron microscope of the new generation to meet today's
Aqualog. Water Quality Measurements Made Easy FLUORESCENCE
 Aqualog Water Quality Measurements Made Easy FLUORESCENCE Water quality measurements made easy The only simultaneous absorbance and fluorescence system for water quality analysis! The new Aqualog is the
Chroma. Optical Spectral Analysis and Color Measurement
 Chroma Optical Spectral Analysis and Color Measurement Seeing is not seeing. Seeing is thinking. Contents Methods and Data Sources page 4 // 5 Measurement and Series Measurement page 6 // 7 Spectral Analysis
LONG TERM STATISTICS OF X-RAY SPECTROMETERS
 403 LONG TERM STATISTICS OF X-RAY SPECTROMETERS J. F. Dlouhy*, D. Mathieu Department of the Environment, Environmental Technology Center, River Road, Ottawa, Ontario, Canada Kl A OH3 K. N. Stoev Bulgarian
Discover the difference in efficiency
 Y.CT Compact Fan-beam computed tomography (CT) inspection system for high-density medium and large-sized parts Discover the difference in efficiency Technology with Passion Explore the art of detection
AxioCam MRc 5 A World of Digital Possibilities
 Microscopy from Carl Zeiss AxioCam MRc 5 A World of Digital Possibilities More flexibility and more performance in microscope camera technology Impressive Performance A trend setter in digital microscopy,
SCIENTIFIC INSTRUMENT NEWS. Introduction. Design of the FlexSEM 1000
 SCIENTIFIC INSTRUMENT NEWS 2017 Vol. 9 SEPTEMBER Technical magazine of Electron Microscope and Analytical Instruments. Technical Explanation The FlexSEM 1000: A Scanning Electron Microscope Specializing
Magellan XHR SEM. Discover the world of extreme high resolution scanning electron microscopy
 Magellan XHR SEM Discover the world of extreme high resolution scanning electron microscopy Gold particles on carbon test sample imaged at 200 V and a horizontal field width (HFW) of 500 nm. Unprecedented
Imaging Photometer and Colorimeter
 W E B R I N G Q U A L I T Y T O L I G H T. /XPL&DP Imaging Photometer and Colorimeter Two models available (photometer and colorimetry camera) 1280 x 1000 pixels resolution Measuring range 0.02 to 200,000
Introduction of New Products
 Field Emission Electron Microscope JEM-3100F For evaluation of materials in the fields of nanoscience and nanomaterials science, TEM is required to provide resolution and analytical capabilities that can
attocfm I for Surface Quality Inspection NANOSCOPY APPLICATION NOTE M01 RELATED PRODUCTS G
 APPLICATION NOTE M01 attocfm I for Surface Quality Inspection Confocal microscopes work by scanning a tiny light spot on a sample and by measuring the scattered light in the illuminated volume. First,
XRF Instrumentation. Introduction to spectrometer
 XRF Instrumentation Introduction to spectrometer AMPTEK, INC., Bedford, MA 01730 Ph: +1 781 275 2242 Fax: +1 781 275 3470 sales@amptek.com 1 Instrument Excitation source Sample X-ray tube or radioisotope
MAGNATEST D. Magneto-Inductive Component Testing for Magnetic and Electrical Properties
 MAGNATEST D Magneto-Inductive Component Testing for Magnetic and Electrical Properties COMPONENT TESTING (CT) The Company FOERSTER is a global technology leader for non-destructive testing of metallic
Dual-FL. World's Fastest Fluorometer. Measure absorbance spectra and fluorescence simultaneously FLUORESCENCE
 Dual-FL World's Fastest Fluorometer Measure absorbance spectra and fluorescence simultaneously FLUORESCENCE 100 Times Faster Data Collection The only simultaneous absorbance and fluorescence system available
QUANTOF. High-resolution, accurate mass, quantitative time-of-flight MS technology
 QUANTOF High-resolution, accurate mass, quantitative time-of-flight MS technology Orthogonal-acceleration time-of-flight (oatof) mass spectrometers are invaluable tools for the detection and identification
Optical Sensor Systems from Carl Zeiss CORONA PLUS. Tuned by Carl Zeiss. The next generation in the compact class
 Optical Sensor Systems from Carl Zeiss CORONA PLUS Tuned by Carl Zeiss The next generation in the compact class Standard: Innovative spectrometer technologies, superior measuring convenience, optimal handling.
The ArtemiS multi-channel analysis software
 DATA SHEET ArtemiS basic software (Code 5000_5001) Multi-channel analysis software for acoustic and vibration analysis The ArtemiS basic software is included in the purchased parts package of ASM 00 (Code
SCANNING ELECTRON MICROSCOPY AND X-RAY MICROANALYSIS
 SCANNING ELECTRON MICROSCOPY AND X-RAY MICROANALYSIS Robert Edward Lee Electron Microscopy Center Department of Anatomy and Neurobiology Colorado State University P T R Prentice Hall, Englewood Cliffs,
Silicon Drift Detector. with On- Chip Ele ctronics for X-Ray Spectroscopy. KETEK GmbH Am Isarbach 30 D O berschleißheim GERMANY
 KETEK GmbH Am Isarbach 30 D-85764 O berschleißheim GERMANY Silicon Drift Detector Phone +49 (0)89 315 57 94 Fax +49 (0)89 315 58 16 with On- Chip Ele ctronics for X-Ray Spectroscopy high energy resolution
AVL X-ion. Adapts. Acquires. Inspires.
 AVL X-ion Adapts. Acquires. Inspires. THE CHALLENGE Facing ever more stringent emissions targets, the quest for an efficient and affordable powertrain leads invariably through complexity. On the one hand,
Electron Microscopy RADIUS. Control & Imaging Software. RADIUS - The way forward in electron microscopy
 RADIUS - The way forward in electron microscopy Electron Microscopy RADIUS Control & Imaging Software THE ESSENCE OF ELECTRON MICROSCOPY: RADIUS RADIUS is the visionary software for electron microscopy
Material analysis by infrared mapping: A case study using a multilayer
 Material analysis by infrared mapping: A case study using a multilayer paint sample Application Note Author Dr. Jonah Kirkwood, Dr. John Wilson and Dr. Mustafa Kansiz Agilent Technologies, Inc. Introduction
Prodigy DC Arc. The Ultimate Solution for Elemental Analysis of Solid Samples
 Prodigy DC Arc The Ultimate Solution for Elemental Analysis of Solid Samples Why Choose DC Arc for Elemental Analysis Fast, easy, quantitative, elemental analyses of difficult samples are hallmarks of
Fastest high definition Raman imaging. Fastest Laser Raman Microscope RAMAN
 Fastest high definition Raman imaging Fastest Laser Raman Microscope RAMAN - 11 www.nanophoton.jp Observation A New Generation in Raman Observation RAMAN-11 developed by Nanophoton was newly created by
LumaSpec 800S User Manual
 LumaSpec 800S User Manual Worldwide distribution VERSION 09112014 Prior Scientific, Ltd Cambridge, UK Prior Scientific, Inc Rockland, MA. USA Prior Scientific, GmbH Jena, Germany Prior Scientific KK Tokyo,
Keyser, Ronald M., Twomey, Timothy R., and Bingham, Russell D. ORTEC, 801 South Illinois Avenue, Oak Ridge, TN 37831s
 Improved Performance in Germanium Detector Gamma Spectrometers based on Digital Signal Processing Keyser, Ronald M., Twomey, Timothy R., and Bingham, Russell D. ORTEC, 801 South Illinois Avenue, Oak Ridge,
FT-IR IMAGING THAT'S CLEARLY MEASURABLY AMAZING. Spotlight 400 FT-IR and 400N FT-NIR Imaging Systems
 FT-IR IMAGING THAT'S CLEARLY MEASURABLY AMAZING Spotlight 400 FT-IR and 400N FT-NIR Imaging Systems YOUR CHALLENGES COME IN ALL SHAPES AND SIZES ONE SYSTEM CAN HANDLE THEM ALL It s been called the most
X-ray fluorescence Analyzer
 X-ray Fluorescence Spectrometer New Energy Dispersive X-ray fluorescence Analyzer www.matsusada.com Measures for compliance with the RoHS / ELV and other regulations Lead content control in the solder
771 Series LASER SPECTRUM ANALYZER. The Power of Precision in Spectral Analysis. It's Our Business to be Exact! bristol-inst.com
 771 Series LASER SPECTRUM ANALYZER The Power of Precision in Spectral Analysis It's Our Business to be Exact! bristol-inst.com The 771 Series Laser Spectrum Analyzer combines proven Michelson interferometer
Nicolet Almega XR. High Performance Micro and Macro Dispersive Raman Analysis Systems
 m o l e c u l a r s p e c t r o s c o p y Nicolet Almega XR High Performance Micro and Macro Dispersive Raman Analysis Systems Materials Research Identification/Verification Characterization Failure Analysis
Part I: Bruker Esprit Mapping Options
 Part I: Bruker Esprit Mapping Options Mapping Panel Overview 5. 4. 2. 6. 3. 7. 8. 9. 1. 10. Mapping Panel Overview 1. Element selector - can turn individual elements (as well as the image overlay) on/off.
Microprobe Power User Part 3: X-Ray Maps
 Microprobe Power User Part 3: X-Ray Maps Mike Spilde Spring IOM Seminar September 17, 2008 X-Ray Mapping Why use X-ray maps? Characterize the sample at microscopic scales with relatively high sensitivity.
printcontrol Printing process control at a click of the mouse
 printcontrol Printing process control at a click of the mouse Printing process control with GMG PrintControl and GMG RapidCheck The significance of process control in the graphic arts industry has grown
AKM AK8973 and AK Axis Electronic Compass
 AKM AK8973 and AK8974 Process Review For comments, questions, or more information about this report, or for any additional technical needs concerning semiconductor and electronics technology, please call
 R AMP TEK Landed on Mars July 4, 1997 All Solid State Design No Liquid Nitrogen Be Window FET Detector Temperature Monitor Cooler Mounting Stud FEATURES Si-PIN Photodiode Thermoelectric Cooler Beryllium
Invisible sophistication. Visible simplicity. CS Welcome to the simplicity of compact panoramic imaging
 Invisible sophistication. Visible simplicity. CS 8100 Welcome to the simplicity of compact panoramic imaging Introducing the CS 8100 The Carestream Dental Factor Humanized technology We keep our technology
Fast Laser Raman Microscope RAMAN
 Fast Laser Raman Microscope RAMAN - 11 www.nanophoton.jp Fast Raman Imaging A New Generation of Raman Microscope RAMAN-11 developed by Nanophoton was created by combining confocal laser microscope technology
Agilent 8700 LDIR Chemical Imaging System. Bringing Clarity and Unprecedented Speed to Chemical Imaging.
 Agilent 8700 LDIR Chemical Imaging System Bringing Clarity and Unprecedented Speed to Chemical Imaging. What if you could save time and achieve better results? The Agilent 8700 Laser Direct Infrared (LDIR)
ESA400 Electrochemical Signal Analyzer
 ESA4 Electrochemical Signal Analyzer Electrochemical noise, the current and voltage signals arising from freely corroding electrochemical systems, has been studied for over years. Despite this experience,
DROP SHAPE ANALYZER DSA100 THE VERSATILE HIGH-END INSTRUMENT FOR ANALYZING COATING AND WETTING PROCESSES
 DROP SHAPE ANALYZER DSA100 THE VERSATILE HIGH-END INSTRUMENT FOR ANALYZING COATING AND WETTING PROCESSES PRECISION AND PERFECTION QUITE AUTOMATICALLY Options for complete software-controlled surface analysis
(Refer Slide Time: 00:10)
") Fundamentals of optical and scanning electron microscopy Dr. S. Sankaran Department of Metallurgical and Materials Engineering Indian Institute of Technology, Madras Module 03 Unit-6 Instrumental details
Fundamentals of optical and scanning electron microscopy Dr. S. Sankaran Department of Metallurgical and Materials Engineering Indian Institute of Technology, Madras Module 03 Unit-6 Instrumental details
Philips EasyDiagnost Eleva
 Philips EasyDiagnost Eleva The Philips EasyDiagnost Eleva Recognized for its ease of use and superb image quality, the EasyDiagnost Eleva has for many years been entrusted with a variety of R/F applications
MICRO XRF OF LIGHT ELEMENTS USING A POLYCAPILLARY LENS AND AN ULTRA THIN WINDOW SILICON DRIFT DETECTOR INSIDE A VACUUM CHAMBER
 Copyright JCPDS - International Centre for Diffraction Data 2005, Advances in X-ray Analysis, Volume 48. 229 MICRO XRF OF LIGHT ELEMENTS USING A POLYCAPILLARY LENS AND AN ULTRA THIN WINDOW SILICON DRIFT
printcontrol Printing process control at a click of the mouse
 printcontrol Printing process control at a click of the mouse Printing process control with GMG PrintControl and GMG RapidCheck The significance of process control in the graphic arts industry has grown
Fast Laser Raman Microscope RAMAN
 Fast Laser Raman Microscope RAMAN - 11 www.nanophoton.jp Fast Raman Imaging A New Generation of Raman Microscope RAMAN-11 developed by Nanophoton was created by combining confocal laser microscope technology
2014 HTD-E with options
 with options The HT7700 : a user-friendly, ergonomic digital TEM with options User-Friendly r end Design Ambient light operation. Multiple automated functions for alignment, focus and stigmation as standard
This procedure assumes the user is already familiar with basic operation of the SEM and the MiraTC interface.
 Tescan MIRA3 SEM: EDS using EDAX TEAM Nicholas G. Rudawski ngr@ufl.edu Cell: (805) 252-4916 Office: (352) 392-3077 Last updated: 12/04/17 This procedure assumes the user is already familiar with basic
Scanning electron microscope
 Scanning electron microscope 5 th CEMM workshop Maja Koblar, Sc. Eng. Physics Outline The basic principle? What is an electron? Parts of the SEM Electron gun Electromagnetic lenses Apertures Detectors
FTIR microscopy and imaging for failure analysis in electronics manufacturing
 FTIR microscopy and imaging for failure analysis in electronics manufacturing Application Note Author Steven M. Barnett, Ellen V. Miseo, and Wayne Jalenak Agilent Technologies, Inc. Introduction The electronics
3D Distortion Measurement (DIS)
") 3D Distortion Measurement (DIS) Module of the R&D SYSTEM S4 FEATURES Voltage and frequency sweep Steady-state measurement Single-tone or two-tone excitation signal DC-component, magnitude and phase of
3D Distortion Measurement (DIS) Module of the R&D SYSTEM S4 FEATURES Voltage and frequency sweep Steady-state measurement Single-tone or two-tone excitation signal DC-component, magnitude and phase of
Qualitative analysis tutorial for Tracer III SD and V+ data
 Qualitative analysis tutorial for Tracer III SD and V+ data Outline What does the spectrum mean? What to watch out for How to normalize Using Artax What does the spectrum mean? Bremsstrahlung radiation
High Quality Automotive Glass
 High Quality Automotive Glass SCREENSCAN-Final Fully Automated & Complete Optical Inspection of Automotive Screens Passion for Glass Driven by Competence. Powered by Innovation. The first step to highest
OCT Spectrometer Design Understanding roll-off to achieve the clearest images
 OCT Spectrometer Design Understanding roll-off to achieve the clearest images Building a high-performance spectrometer for OCT imaging requires a deep understanding of the finer points of both OCT theory
picoemerald Tunable Two-Color ps Light Source Microscopy & Spectroscopy CARS SRS
 picoemerald Tunable Two-Color ps Light Source Microscopy & Spectroscopy CARS SRS 1 picoemerald Two Colors in One Box Microscopy and Spectroscopy with a Tunable Two-Color Source CARS and SRS microscopy
Diamond Analysis. Innovation with Integrity. Reliable identification and type determination by FTIR spectroscopy FTIR
 Diamond Analysis Reliable identification and type determination by FTIR spectroscopy Innovation with Integrity FTIR FTIR Diamond Analysis Since the appearance of synthetic diamonds, nearly perfect imitates
m+p Analyzer Revision 5.2
 Update Note www.mpihome.com m+p Analyzer Revision 5.2 Enhanced Project Browser New Acquisition Configuration Windows Improved 2D Chart Reference Traces in 2D Single- and Multi-Chart Template Projects Trigger
Tribometrics. Version 2.11
 Tribometrics Version 2.11 Table of Contents Tribometrics... 1 Version 2.11... 1 1. About This Document... 4 1.1. Conventions... 4 2. Introduction... 5 2.1. Software Features... 5 2.2. Tribometrics Overview...
SPECTROLABLAVM11. Performance Meets Flexibility: The Best in Metal Analysis
 SPECTROLABLAVM11 Performance Meets Flexibility: The Best in Metal Analysis SPECTROLAB Performance Meets Flexibility: The Best in Metal Analysis The SPECTROLAB s housing includes storage space to hold required
ANALYTICAL MICRO X-RAY FLUORESCENCE SPECTROMETER
 Copyright(c)JCPDS-International Centre for Diffraction Data 2001,Advances in X-ray Analysis,Vol.44 325 ANALYTICAL MICRO X-RAY FLUORESCENCE SPECTROMETER ABSTRACT William Chang, Jonathan Kerner, and Edward
Case Study: Custom CCD for X-ray Free Electron Laser Experiment
 Introduction The first XFEL (X-ray Free Electron Laser) experiments are being constructed around the world. These facilities produce femto-second long bursts of the most intense coherent X-rays ever to
Layout Analysis Floorplan
 Sample Report Analysis from a Touch Screen Controller For any additional technical needs concerning semiconductor and electronics technology, please call Sales at Chipworks. 3685 Richmond Road, Suite 500,
The Most Efficient SMT Solder Paste Stencil Cutter Available LPKF StencilLaser G 6080
 The Most Efficient SMT Solder Paste Stencil Cutter Available LPKF StencilLaser G 6080 Improved Quality No Chiller Needed In Process Inspection Specific Configurations Stencils up to 1 600 mm long See for
Clemex Vision Lite. Capture, Measure, Analyze. the image analysis people
 Clemex Vision Lite Capture, Measure, Analyze the image analysis people Acquire, Measure, Analyze with Clemex Vision Lite Clemex Vision Lite is a flexible yet affordable software solution that enables