CHANGE DETECTION USING OPTICAL DATA IN SNAP
|
|
|
- Robyn Gardner
- 5 years ago
- Views:
Transcription
1 CHANGE DETECTION USING OPTICAL DATA IN SNAP EXERCISE 1 (Water change detection) Data: Sentinel-2A Level 2A: S2A_MSIL2A_ T082332_N0204_R121_T34HCH_ T SAFE S2A_MSIL2A_ T082251_N0206_R121_T34HCH_ T SAFE 1. Open file 1.1. File / Open Product 1.2. Browse to: /day_2/practice/change_detection/data/waterchange/s2a_msil2a_ t082332_n0204_r121_t34hch_ T SAFE /day_2/practice/change_detection/data/waterchange/s2a_msil2a_ t082251_n0206_r121_t34hch_ T SAFE 1.3. Select the MTD_MSIL2A.xml file for each product and click Open 2. View RGB image view 2.1. Select the first product in Product Explorer window 2.2. Select: Window / Open RGB Image Window 2.3. Leave default natural colour combination and click OK 2.4. Repeat the step for the second product [2] 3. View multiple viewers 3.1. Synchronise views by selecting the relevant icons in the Navigation tab 3.2. Select: Window / Tile Horizontally The Sentinel-2 data contains 13 spectral bands at different spatial resolution (10, 20 and 60 meters), therefore before to apply the processing involving bands at different resolution we need to resample them. Due to the short time slot dedicated to the practical we will focus the attention to the Waterskloof Dam (South Africa) running a pre-processing graph that will subset spatially and spectrally the original product. The steps to set-up the pre-processing graph in SNAP are shown below. 4. Pre-processing Graph Builder 4.1. Select the product in Product Explorer window 4.2. Select: Tools / GraphBuilder or the icon 4.3. In the GraphBuilder window we can start to build our graph clicking the right button of the mouse and add all the SNAP modules that we need Resample Module: Add / Raster / Geometrics / Resample 4.5. Subset Module: Add / Raster / Geometrics / Subset


2 4.6. Right click on the GraphBuilder window and select Connect Graph 4.7. Once that all the modules of the graph are connected we can set up the parameters as shown below Reader: Select the product acquired on 2017.


3 Resample: Select the third option By pixel resolution (in m) and specify 10. Subset: From the Source Bands select B2, B3, B4, B8, B11 and B12. To crop spatially select Geographic Coordinates option and copy and paste the polygon on the Waterskloof Dam Polygon.txt file and click on update. 5. Open the newly created product 5.1. Close all viewers 5.2. Select image name in Product Explorer window 5.3. Select: Window / Open RGB Image Window Leave default natural colour combination and click OK 5.4. Synchronise views by selecting the relevant icons in the Navigation tab 5.5. Select: Window / Tile Horizontally and compare the images 6. NDWI-2 (Second Normalized Difference Water Index) The second Normalized Difference Water Index algorithm was developed by McFeeters (1996) to detect surface waters in wetland environments and to allow for the measurement of surface water extent. The equation is similar to NDVI, except that it uses Green (B3) and the Near InfraRed (NIR) wavelengths.

4 (GGGGGGGGGG NNNNNN) (BB3 BB8) NNNNNNNN2 = = (GGGGGGGGGG + NNNNNN) (BB3 + BB8) The NDWI-2 makes use of reflected near-infrared radiation and visible green light to enhance the presence of such features while eliminating the presence of soil and terrestrial vegetation features. A high NDWI-2 value generally indicates presence of water. The water curve is characterised by a high absorption at near infrared wavelengths range and beyond. Because of this absorption property, water bodies as well as features containing water can easily be detected, located and delineated with remote sensing data. Image Source: Siegmund, Menz 2005 with modifications 6.1. Create New NDWI2 Band (based on band maths expression) Select: Raster / Band Maths Set up the I/O and the processing parameters as shown in the Figure below Change the output name in NDWI2_ Deselect Virtual Select Edit Expression Type the following expression in the Expression field: ($3.B3 $3.B8) / ($3.B3 + $3.B8) The symbol $ is the link to the product as displayed in the Product Explorer Window Click OK Repeat the process for the second product [4] changing the output name NDWI2_ SWM (Sentinel Water Mask) The Sentinel Water Mask algorithm was presented by Marta Milczarek during ESA Land Training Corse 2017 winning the best poster award in the category "Optical Remote Sensing". SWM provides quick and effective detection of water.
 were selected and new index formula was developed: SSSSSS = (BBBBBBBB + GGGGGGGGGG) (NNNNNN + SSSSSSSS) = (BB2 + BB3) (BB8 + BB11) 7.1. Create New SWM Band (based on band maths expression) 7.")
5 After analysis of spectral reflectance curves for water and other types of land cover (Figure above), two bands with the highest reflectance for water (Blue and Green) and two with the lowest one (NIR and SWIR) were selected and new index formula was developed: SSSSSS = (BBBBBBBB + GGGGGGGGGG) (NNNNNN + SSSSSSSS) = (BB2 + BB3) (BB8 + BB11) 7.1. Create New SWM Band (based on band maths expression) Select: Raster / Band Maths Set up the I/O and the processing parameters as shown in the Figure below Change the output name in SWM_ Deselect Virtual Select Edit Expression Type the following expression in the Expression field: ($3.B2 + $3.B3) / ($3.B8 + $3.B11) The symbol $ is the link to the product as displayed in the Product Explorer Window Click OK Repeat the process for the second product [4] changing the output name SWM_ The symbol $ is the link to the product as displayed in the Product Explorer Window. 8. Create Water band based on NDWI2 and SWM 8.1. Close all viewers 8.2. Select product in Product Explorer window 8.3. Select: Raster / Band Maths 8.4. Set up the I/O and the processing parameters as shown in the Figure below 8.5. Change the output name in WaterMask_ Deselect Virtual 8.7. Select Edit Expression 8.8. Type the following expression: if (($3.NDWI2_2017 > 0.3) or ($3.SWM_2017 > 1.0)) then 1 else 0
![8.9. Click OK 8.10. Repeat the process for the second product [4] changing the output name WaterMask_2018 8.10.1. The symbol $ is the link to the product as displayed in the Product Explorer Window.](/docs-images/95/126502591/images/6-0.jpg "9. Water Change detection 9.1. Close all viewers 9.2. Select product in Product Explorer window 9.3. Select: Raster / Band Maths 9.4.")

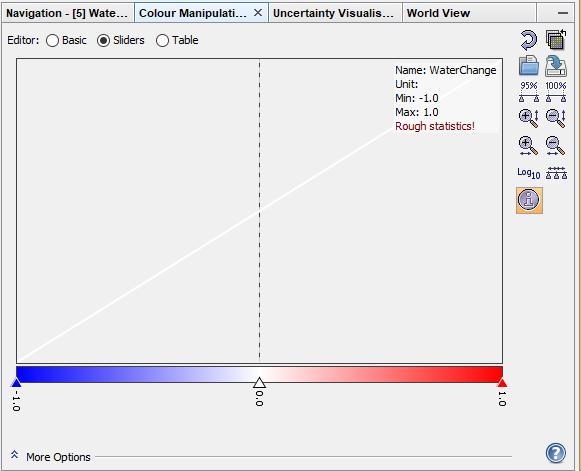
6 8.9. Click OK Repeat the process for the second product [4] changing the output name WaterMask_ The symbol $ is the link to the product as displayed in the Product Explorer Window. 9. Water Change detection 9.1. Close all viewers 9.2. Select product in Product Explorer window 9.3. Select: Raster / Band Maths 9.4. Set up the I/O and the processing parameters as shown in the Figure below 9.5. Change the output name in WaterChange 9.6. Deselect Virtual 9.7. Select Edit Expression 9.8. Type the following expression: $3.WaterMask_ $4.WaterMask_ Click OK Open the newly generated product Select: Colour Manipulation tab [-1.0: Blue]; [0.0: White]; [1.0: Red] The red pixels indicate water decreasing, the white ones represent no change in water level and the blue pixels are associated to an increasing of the water.
7


8 EXERCISE 2 (Forest change detection) Data: Sentinel-2A Level-2A pre-processed: Subset_S2A_MSIL2A_ T112111_N0205_R037_T29TNE_ T112422_10m.data Subset_S2A_MSIL2A_ T112111_N0205_R037_T29TNE_ T112431_10m.data The data have been atmospherically corrected, resampled at 10m, cropped spatially and spectrally (B2, B3, B4, B8, B11, B12) and exported in BEAM-DIMAP (SNAP native file format). 1. Open files 1.1. File / Open Product 1.2. Browse to: /day_2/practice/change_detection/data/forestchange/subset_s2a_msil2a_ t112111_n0205_r037_t 29TNE_ T112422_10m.dim /day_2/practice/change_detection/data/forestchange/subset_s2a_msil2a_ t112111_n0205_r037_t 29TNE_ T112431_10m.dim 1.3. Click Open 2. View RGB image view 2.1. Select image name in Product Explorer window 2.2. Select: Window / Open RGB Image Window 2.3. Leave default natural colour combination and click OK 2.4. Repeat for both of the products 3. View multiple viewers 3.1. Synchronise views by selecting the relevant icons in the Navigation tab 3.2. Select: Window / Tile Horizontally 4. NBR (Normalized Burn Ratio) The Normalized Burn Ratio (NBR) was designed to highlight burned areas and estimate fire severity and is calculated applying the equation reported below: NNNNNN = (NNNNNN SSSSSSSS) (BB8 BB12) = (NNNNNN + SSSSSSSS) (BB8 + BB12) Pre-fire, healthy vegetation has very high near-infrared reflectance and low reflectance in the shortwave infrared portion of the spectrum. Recently burned areas on the other hand have relatively low reflectance in the near-infrared and high reflectance in the shortwave infrared band. A high NBR value generally indicates healthy vegetation while a low value indicates bare ground and recently burned areas. Image Credit: US Forest Service 4.1. By Band Maths Select: Raster / Band Maths Set up the I/O and the processing parameters as shown in the Figure below Change the output name in NBR_June

9 Deselect Virtual Select Edit Expression Type in the following expression in the Expression field: ($1.B8 $1.B12) / ($1.B8 + $1.B12) Click OK The newly created NBR band is added as band of the input product Replicate the action for the second product [2] changing the output name NBR_July 5. View NBR bands 5.1. Select NBR_June band name in Product Explorer window and double click 5.2. Repeat for the NBR_July band associated to the second image 5.3. Synchronise views by selecting the relevant icons in the Navigation tab 5.4. Select: Window / Tile Horizontally 6. Colour Manipulation 6.1. Select NBR_June image displayed 6.2. Select: Colour Manipulation tab 6.3. Click on Auto-adjust to 100% of all pixels as shown in figure below 6.4. [Min: Red]; [Mean: Orange]; [Max: Green] 6.5. Repeat for the NBR_July obtaining the following result

10 7. Burn Severity Normalized Burn Ratio is frequently used to estimate burn severity. Imagery collected before a fire will have very high near infrared band values and very low mid infrared band values and a Imagery collected over a forest after a fire will have very low near infrared band values and very high mid infrared band values. Higher dnbr indicate more severe damage. Areas with negative dnbr values may indicate increased vegetation productivity following a fire. dddddddd oooo NNNNNN = PPPPPPPPPPPPPPPPPPPP PPPPPPPPPPPPPPPPPPPPPP = NNNNRR JJJJJJJJ NNNNRR JJJJJJJJ The meaning of the NBR values can vary by scene, and for best results interpretation in specific instances should always be based on some field assessment. However, the table below from the USGS FireMon program can be useful as a first approximation for interpreting the NBR difference. dnbr Burn Severity < High post-fire regrowth to -0.1 Low post-fire regrowth -0.1 to +0.1 Unburned 0.1 to 0.27 Low-severity burn 0.27 to 0.44 Moderate-low severity burn 0.44 to 0.66 Moderate-high severity burn > 0.66 High-severity burn 7.1. Select: Raster / Band Maths 7.2. Set up the I/O and the processing parameters as shown in the Figure below 7.3. Change the output name in dnbr 7.4. Deselect Virtual 7.5. Select Edit Expression 7.6. Type in the following expression in the Expression field: $1.NBR_June - $2.NBR_July
 and select Basic as editor 8.3.")
11 7.7. The symbols $1. and $2. are the links to the different products 7.8. Obtaining the following result 7.9. The brightest pixels represent high dnbr meaning high-severity burn. 8. Colour Manipulation 8.1. Select dnbr band displayed on the screen 8.2. Go to Colour Manipulation tab (bottom left) and select Basic as editor 8.3. Import colour palette from text file clicking on the icon and selecting the file named dnbr_colourpalette.cpd 8.4. In order to take the range from the file click No on the pop-up message

12 dnbr Burn Severity Colour Palette < High post-fire regrowth to -0.1 Low post-fire regrowth -0.1 to +0.1 Unburned 0.1 to 0.27 Low-severity burn 0.27 to 0.44 Moderate-low severity burn 0.44 to 0.66 Moderate-high severity burn > 0.66 High-severity burn
INTRODUCTION TO SNAP TOOLBOX
 INTRODUCTION TO SNAP TOOLBOX EXERCISE 1 (Exploring S2 data) Data: Sentinel-2A Level 1C: S2A_MSIL1C_20180303T170201_N0206_R069_T14QNG_20180303T221319.SAFE 1. Open file 1.1. File / Open Product 1.2. Browse
Enhancement of Multispectral Images and Vegetation Indices
 Enhancement of Multispectral Images and Vegetation Indices ERDAS Imagine 2016 Description: We will use ERDAS Imagine with multispectral images to learn how an image can be enhanced for better interpretation.
Module 11 Digital image processing
 Introduction Geo-Information Science Practical Manual Module 11 Digital image processing 11. INTRODUCTION 11-1 START THE PROGRAM ERDAS IMAGINE 11-2 PART 1: DISPLAYING AN IMAGE DATA FILE 11-3 Display of
Image Change Tutorial
 Image Change Tutorial In this tutorial, you will use the Image Change workflow to compare two images of an area over Indonesia that was impacted by the December 26, 2004 tsunami. The first image is a before
Files Used in this Tutorial
 Burn Indices Tutorial This tutorial shows how to create various burn index images from Landsat 8 imagery, using the May 2014 San Diego County wildfires as a case study. You will learn how to perform the
Google Earth Engine Image Pre-processing Tool: User guide
 Google Earth Engine Image Pre-processing Tool: Lukas Würsch, Kaspar Hurni, and Andreas Heinimann Centre for Development and Environment (CDE) University of Bern 2017 Introduction The image pre-processing
Assessment of Spatiotemporal Changes in Vegetation Cover using NDVI in The Dangs District, Gujarat
 Assessment of Spatiotemporal Changes in Vegetation Cover using NDVI in The Dangs District, Gujarat Using SAGA GIS and Quantum GIS Tutorial ID: IGET_CT_003 This tutorial has been developed by BVIEER as
How to Access Imagery and Carry Out Remote Sensing Analysis Using Landsat Data in a Browser
 How to Access Imagery and Carry Out Remote Sensing Analysis Using Landsat Data in a Browser Including Introduction to Remote Sensing Concepts Based on: igett Remote Sensing Concept Modules and GeoTech
Exercise 4-1 Image Exploration
 Exercise 4-1 Image Exploration With this exercise, we begin an extensive exploration of remotely sensed imagery and image processing techniques. Because remotely sensed imagery is a common source of data
Remote Sensing Instruction Laboratory
 Laboratory Session 217513 Geographic Information System and Remote Sensing - 1 - Remote Sensing Instruction Laboratory Assist.Prof.Dr. Weerakaset Suanpaga Department of Civil Engineering, Faculty of Engineering
Comparing of Landsat 8 and Sentinel 2A using Water Extraction Indexes over Volta River
 Journal of Geography and Geology; Vol. 10, No. 1; 2018 ISSN 1916-9779 E-ISSN 1916-9787 Published by Canadian Center of Science and Education Comparing of Landsat 8 and Sentinel 2A using Water Extraction
Software requirements * : Part I: 1 hr. Part III: 2 hrs.
 Title: Product Type: Developer: Target audience: Format: Software requirements * : Data: Estimated time to complete: Using MODIS to Analyze the Seasonal Growing Cycle of Crops Part I: Understand and locate
Software requirements * : Part I: 1 hr. Part III: 2 hrs.
 Title: Product Type: Developer: Target audience: Format: Software requirements * : Data: Estimated time to complete: Using MODIS to Analyze the Seasonal Growing Cycle of Crops Part I: Understand and locate
Seasonal Progression of the Normalized Difference Vegetation Index (NDVI)
") Seasonal Progression of the Normalized Difference Vegetation Index (NDVI) For this exercise you will be using a series of six SPOT 4 images to look at the phenological cycle of a crop. The images are SPOT
Seasonal Progression of the Normalized Difference Vegetation Index (NDVI) For this exercise you will be using a series of six SPOT 4 images to look at the phenological cycle of a crop. The images are SPOT
8th ESA ADVANCED TRAINING COURSE ON LAND REMOTE SENSING
 Urban Mapping Practical Sebastian van der Linden, Akpona Okujeni, Franz Schug Humboldt Universität zu Berlin Instructions for practical Summary The Urban Mapping Practical introduces students to the work
Basic Hyperspectral Analysis Tutorial
 Basic Hyperspectral Analysis Tutorial This tutorial introduces you to visualization and interactive analysis tools for working with hyperspectral data. In this tutorial, you will: Analyze spectral profiles
Figure 1: Percent reflectance for various features, including the five spectra from Table 1, at different wavelengths from 0.4µm to 1.4µm.
 Section 1: The Electromagnetic Spectrum 1. The wavelength range that has the highest reflectance for broadleaf vegetation and needle leaf vegetation is 0.75µm to 1.05µm. 2. Dry soil can be distinguished
Remote Sensing for Fire Management. FOR 435: Remote Sensing for Fire Management
 Remote Sensing for Fire Management FOR 435: Remote Sensing for Fire Management 2. Remote Sensing Primer Primer A very Brief History Modern Applications As a young man, my fondest dream was to become a
GIS Data Collection. Remote Sensing
 GIS Data Collection Remote Sensing Data Collection Remote sensing Introduction Concepts Spectral signatures Resolutions: spectral, spatial, temporal Digital image processing (classification) Other systems
Due Date: September 22
 Geography 309 Lab 1 Page 1 LAB 1: INTRODUCTION TO REMOTE SENSING Due Date: September 22 Objectives To familiarize yourself with: o remote sensing resources on the Internet o some remote sensing sensors
Package ASIP. May 11, 2018
 Type Package Date 2018-05-11 Title Automated Satellite Image Processing Version 0.4.9 Author M J Riyas [aut, cre], T H Syed [aut] Maintainer M J Riyas Package ASIP May 11, 2018 Efficiently
Lesson 9: Multitemporal Analysis
 Lesson 9: Multitemporal Analysis Lesson Description Multitemporal change analyses require the identification of features and measurement of their change through time. In this lesson, we will examine vegetation
Downloading and formatting remote sensing imagery using GLOVIS
 Downloading and formatting remote sensing imagery using GLOVIS Students will become familiarized with the characteristics of LandSat, Aerial Photos, and ASTER medium resolution imagery through the USGS
v Introduction Images Import images in a variety of formats and register the images to a coordinate projection WMS Tutorials Time minutes
 v. 10.1 WMS 10.1 Tutorial Import images in a variety of formats and register the images to a coordinate projection Objectives Import various types of image files from different sources. Learn how to work
CanImage. (Landsat 7 Orthoimages at the 1: Scale) Standards and Specifications Edition 1.0
 Standards and Specifications Edition 1.0") CanImage (Landsat 7 Orthoimages at the 1:50 000 Scale) Standards and Specifications Edition 1.0 Centre for Topographic Information Customer Support Group 2144 King Street West, Suite 010 Sherbrooke, QC
CanImage (Landsat 7 Orthoimages at the 1:50 000 Scale) Standards and Specifications Edition 1.0 Centre for Topographic Information Customer Support Group 2144 King Street West, Suite 010 Sherbrooke, QC
SEN3APP Stakeholder Workshop, Helsinki Yrjö Rauste/VTT Kaj Andersson/VTT Eija Parmes/VTT
 Optical Products from Sentinel-2 and Suomi- NPP/VIIRS SEN3APP Stakeholder Workshop, Helsinki 19.11.2015 Yrjö Rauste/VTT Kaj Andersson/VTT Eija Parmes/VTT Structure of Presentation High-resolution data
GEOSS Americas/Caribbean Remote Sensing Workshop November Lab 2 Investigating Cloud Phase, NDVI, Ocean Color and Sea Surface Temperatures
 GEOSS Americas/Caribbean Remote Sensing Workshop 26-30 November 2007 Lab 2 Investigating Cloud Phase, NDVI, Ocean Color and Sea Surface Temperatures Kathleen Strabala kathy.strabala@ssec.wisc.edu Table:
Using QuickBird Imagery in ESRI Software Products
 Using QuickBird Imagery in ESRI Software Products TABLE OF CONTENTS 1. Introduction...2 Purpose Scope Image Stretching Color Guns 2. Imagery Usage Instructions...4 ArcView 3.x...4 ArcGIS...7 i Using QuickBird
FluorCam PAR- Absorptivity Module & NDVI Measurement
 FluorCam PAR- Absorptivity Module & NDVI Measurement Instruction Manual Please read this manual before operating this product P PSI, spol. s r. o., Drásov 470, 664 24 Drásov, Czech Republic FAX: +420 511
Digital Photography 1
 Digital Photography 1 Photoshop Lesson 3 Resizing and transforming images Name Date Create a new image 1. Choose File > New. 2. In the New dialog box, type a name for the image. 3. Choose document size
Apply Colour Sequences to Enhance Filter Results. Operations. What Do I Need? Filter
 Apply Colour Sequences to Enhance Filter Results Operations What Do I Need? Filter Single band images from the SPOT and Landsat platforms can sometimes appear flat (i.e., they are low contrast images).
Dirty REMOTE SENSING Lecture 3: First Steps in classifying Stuart Green Earthobservation.wordpress.com
 Dirty REMOTE SENSING Lecture 3: First Steps in classifying Stuart Green Earthobservation.wordpress.com Stuart.Green@Teagasc.ie You have your image, but is it any good? Is it full of cloud? Is it the right
Remote Sensing for Rangeland Applications
 Remote Sensing for Rangeland Applications Jay Angerer Ecological Training June 16, 2012 Remote Sensing The term "remote sensing," first used in the United States in the 1950s by Ms. Evelyn Pruitt of the
LIGHT-SCENE ENGINE MANAGER GUIDE
 ambx LIGHT-SCENE ENGINE MANAGER GUIDE 20/05/2014 15:31 1 ambx Light-Scene Engine Manager The ambx Light-Scene Engine Manager is the installation and configuration software tool for use with ambx Light-Scene
2017 REMOTE SENSING EVENT TRAINING STRATEGIES 2016 SCIENCE OLYMPIAD COACHING ACADEMY CENTERVILLE, OH
 2017 REMOTE SENSING EVENT TRAINING STRATEGIES 2016 SCIENCE OLYMPIAD COACHING ACADEMY CENTERVILLE, OH This presentation was prepared using draft rules. There may be some changes in the final copy of the
GEOG432: Remote sensing Lab 3 Unsupervised classification
 GEOG432: Remote sensing Lab 3 Unsupervised classification Goal: This lab involves identifying land cover types by using agorithms to identify pixels with similar Digital Numbers (DN) and spectral signatures
In late April of 1986 a nuclear accident damaged a reactor at the Chernobyl nuclear
 CHERNOBYL NUCLEAR POWER PLANT ACCIDENT Long Term Effects on Land Use Patterns Project Introduction: In late April of 1986 a nuclear accident damaged a reactor at the Chernobyl nuclear power plant in Ukraine.
Using Landsat Imagery to Monitor Post-Fire Vegetation Recovery in the Sandhills of Nebraska: A Multitemporal Approach.
 University of Nebraska - Lincoln DigitalCommons@University of Nebraska - Lincoln Environmental Studies Undergraduate Student Theses Environmental Studies Program Spring 5-2012 Using Landsat Imagery to
Digital Design and Communication Teaching (DiDACT) University of Sheffield Department of Landscape. Adobe Photoshop CS5 INTRODUCTION WORKSHOPS
 University of Sheffield Department of Landscape. Adobe Photoshop CS5 INTRODUCTION WORKSHOPS") Adobe INTRODUCTION WORKSHOPS WORKSHOP 1 - what is Photoshop + what does it do? Outcomes: What is Photoshop? Opening, importing and creating images. Basic knowledge of Photoshop tools. Examples of work.
Adobe INTRODUCTION WORKSHOPS WORKSHOP 1 - what is Photoshop + what does it do? Outcomes: What is Photoshop? Opening, importing and creating images. Basic knowledge of Photoshop tools. Examples of work.
UV-Vis-NIR Spectrophotometer Quick Start Guide
 UV-Vis-NIR Spectrophotometer Quick Start Guide The following instructions are provided as a Quick Start Guide for powering up, running measurements, and shutting down the Lambda 950 UV-Vis Spectrophotometer.
Separation of crop and vegetation based on Digital Image Processing
 Separation of crop and vegetation based on Digital Image Processing Mayank Singh Sakla 1, Palak Jain 2 1 M.TECH GEOMATICS student, CEPT UNIVERSITY 2 M.TECH GEOMATICS student, CEPT UNIVERSITY Word Limit
GST 101: Introduction to Geospatial Technology Lab Series. Lab 6: Understanding Remote Sensing and Aerial Photography
 GST 101: Introduction to Geospatial Technology Lab Series Lab 6: Understanding Remote Sensing and Aerial Photography Document Version: 2013-07-30 Organization: Del Mar College Author: Richard Smith Copyright
Monitoring of mine tailings using satellite and lidar data
 Surveying Monitoring of mine tailings using satellite and lidar data by Prevlan Chetty, Southern Mapping Geospatial This study looks into the use of high resolution satellite imagery from RapidEye and
Development of normalized vegetation, soil and water indices derived from satellite remote sensing data
 Development of normalized vegetation, soil and water indices derived from satellite remote sensing data Takeuchi, W. & Yasuoka, Y. IIS/UT, Japan E-mail: wataru@iis.u-tokyo.ac.jp Nov. 25th, 2004 ACRS2004
Lab 1: Introduction to MODIS data and the Hydra visualization tool 21 September 2011
 WMO RA Regional Training Course on Satellite Applications for Meteorology Cieko, Bogor Indonesia 19-27 September 2011 Kathleen Strabala University of Wisconsin-Madison, USA kathy.strabala@ssec.wisc.edu
Land Cover Type Changes Related to. Oil and Natural Gas Drill Sites in a. Selected Area of Williams County, ND
 Land Cover Type Changes Related to Oil and Natural Gas Drill Sites in a Selected Area of Williams County, ND FR 3262/5262 Lab Section 2 By: Andrew Kernan Tyler Kaebisch Introduction: In recent years, there
An Introduction to Remote Sensing & GIS. Introduction
 An Introduction to Remote Sensing & GIS Introduction Remote sensing is the measurement of object properties on Earth s surface using data acquired from aircraft and satellites. It attempts to measure something
Spatial Analyst is an extension in ArcGIS specially designed for working with raster data.
 Spatial Analyst is an extension in ArcGIS specially designed for working with raster data. 1 Do you remember the difference between vector and raster data in GIS? 2 In Lesson 2 you learned about the difference
Evaluation of Sentinel-2 bands over the spectrum
 Evaluation of Sentinel-2 bands over the spectrum S.E. Hosseini Aria, M. Menenti, Geoscience and Remote sensing Department Delft University of Technology, Netherlands 1 outline ointroduction - Concept odata
Lecture 13: Remotely Sensed Geospatial Data
 Lecture 13: Remotely Sensed Geospatial Data A. The Electromagnetic Spectrum: The electromagnetic spectrum (Figure 1) indicates the different forms of radiation (or simply stated light) emitted by nature.
Digital Imaging - Photoshop
 Digital Imaging - Photoshop A digital image is a computer representation of a photograph. It is composed of a grid of tiny squares called pixels (picture elements). Each pixel has a position on the grid
GEOG432: Remote sensing Lab 3 Unsupervised classification
 GEOG432: Remote sensing Lab 3 Unsupervised classification Goal: This lab involves identifying land cover types by using agorithms to identify pixels with similar Digital Numbers (DN) and spectral signatures
Land Remote Sensing Lab 4: Classication and Change Detection Assigned: October 15, 2017 Due: October 27, Classication
 Name: Land Remote Sensing Lab 4: Classication and Change Detection Assigned: October 15, 2017 Due: October 27, 2017 In this lab, you will generate several gures. Please sensibly name these images, save
Hydraulics and Floodplain Modeling Managing HEC-RAS Cross Sections
 WMS 10.1 Tutorial Hydraulics and Floodplain Modeling Managing HEC-RAS Cross Sections Modify cross sections in an HEC-RAS model to use surveyed cross section data v. 10.1 Objectives Build a basic HEC-RAS
GeoBase Raw Imagery Data Product Specifications. Edition
 GeoBase Raw Imagery 2005-2010 Data Product Specifications Edition 1.0 2009-10-01 Government of Canada Natural Resources Canada Centre for Topographic Information 2144 King Street West, suite 010 Sherbrooke,
The (False) Color World
 Color World") There s more to the world than meets the eye In this activity, your group will explore: The Value of False Color Images Different Types of Color Images The Use of Contextual Clues for Feature Identification
There s more to the world than meets the eye In this activity, your group will explore: The Value of False Color Images Different Types of Color Images The Use of Contextual Clues for Feature Identification
Guidance on Using Scanning Software: Part 5. Epson Scan
 Guidance on Using Scanning Software: Part 5. Epson Scan Version of 4/29/2012 Epson Scan comes with Epson scanners and has simple manual adjustments, but requires vigilance to control the default settings
Satellite data processing and analysis: Examples and practical considerations
 Satellite data processing and analysis: Examples and practical considerations Dániel Kristóf Ottó Petrik, Róbert Pataki, András Kolesár International LCLUC Regional Science Meeting in Central Europe Sopron,
Image Band Transformations
 Image Band Transformations Content Band math Band ratios Vegetation Index Tasseled Cap Transform Principal Component Analysis (PCA) Decorrelation Stretch Image Band Transformation Purposes Image band transforms
Introduction to Remote Sensing Fundamentals of Satellite Remote Sensing. Mads Olander Rasmussen
 Introduction to Remote Sensing Fundamentals of Satellite Remote Sensing Mads Olander Rasmussen (mora@dhi-gras.com) 01. Introduction to Remote Sensing DHI What is remote sensing? the art, science, and technology
DEVELOPMENT OF A NEW SOUTH AFRICAN LAND-COVER DATASET USING AUTOMATED MAPPING TECHINQUES. Mark Thompson 1
 DEVELOPMENT OF A NEW SOUTH AFRICAN LAND-COVER DATASET USING AUTOMATED MAPPING TECHINQUES. Mark Thompson 1 1 GeoTerraImage Pty Ltd, Pretoria, South Africa Abstract This talk will discuss the development
Viewing Landsat TM images with Adobe Photoshop
 Viewing Landsat TM images with Adobe Photoshop Reformatting images into GeoTIFF format Of the several formats in which Landsat TM data are available, only a few formats (primarily TIFF or GeoTIFF) can
Quantifying Land Cover Changes in Maine
 Quantifying Land Cover Changes in Maine! STUDENT HANDOUT Introduction Change detection tools enable us to compare satellite data from different times to assess damage from natural disasters, characterize
v WMS 10.0 Tutorial Introduction Images Read images in a variety of formats and register the images to a coordinate projection
 v. 10.0 WMS 10.0 Tutorial Read images in a variety of formats and register the images to a coordinate projection Objectives Read various types of image files from different sources. Learn how to work with
IKONOS High Resolution Multispectral Scanner Sensor Characteristics
 High Spatial Resolution and Hyperspectral Scanners IKONOS High Resolution Multispectral Scanner Sensor Characteristics Launch Date View Angle Orbit 24 September 1999 Vandenberg Air Force Base, California,
Monitoring agricultural plantations with remote sensing imagery
 MPRA Munich Personal RePEc Archive Monitoring agricultural plantations with remote sensing imagery Camelia Slave and Anca Rotman University of Agronomic Sciences and Veterinary Medicine - Bucharest Romania,
Lesson 3: Working with Landsat Data
 Lesson 3: Working with Landsat Data Lesson Description The Landsat Program is the longest-running and most extensive collection of satellite imagery for Earth. These datasets are global in scale, continuously
Files Used in This Tutorial. Background. Calibrating Images Tutorial
 In this tutorial, you will calibrate a QuickBird Level-1 image to spectral radiance and reflectance while learning about the various metadata fields that ENVI uses to perform calibration. This tutorial
Final Examination Introduction to Remote Sensing. Time: 1.5 hrs Max. Marks: 50. Section-I (50 x 1 = 50 Marks)
") Final Examination Introduction to Remote Sensing Time: 1.5 hrs Max. Marks: 50 Note: Attempt all questions. Section-I (50 x 1 = 50 Marks) 1... is the technology of acquiring information about the Earth's
Final Examination Introduction to Remote Sensing Time: 1.5 hrs Max. Marks: 50 Note: Attempt all questions. Section-I (50 x 1 = 50 Marks) 1... is the technology of acquiring information about the Earth's
Remote Sensing. The following figure is grey scale display of SPOT Panchromatic without stretching.
 Remote Sensing Objectives This unit will briefly explain display of remote sensing image, geometric correction, spatial enhancement, spectral enhancement and classification of remote sensing image. At
USDA Forest Service, Remote Sensing Applications Center,
 Deriving the BARC from Satellite Imagery Demonstration Deriving the BARC from Satellite Imagery French Fire 2004 BARC Dataset Rodeo Chediski Fire 2002 Landsat 7 ETM + Imagery Step 1: Pre-processing Step
Unsupervised Classification
 Unsupervised Classification Using SAGA Tutorial ID: IGET_RS_007 This tutorial has been developed by BVIEER as part of the IGET web portal intended to provide easy access to geospatial education. This tutorial
Photoshop CS2. Step by Step Instructions Using Layers. Adobe. About Layers:
 About Layers: Layers allow you to work on one element of an image without disturbing the others. Think of layers as sheets of acetate stacked one on top of the other. You can see through transparent areas
GEO/EVS 425/525 Unit 3 Composite Images and The ERDAS Imagine Map Composer
 GEO/EVS 425/525 Unit 3 Composite Images and The ERDAS Imagine Map Composer This unit involves two parts, both of which will enable you to present data more clearly than you might have thought possible.
Land Cover Change Analysis An Introduction to Land Cover Change Analysis using the Multispectral Image Data Analysis System (MultiSpec )
") Land Cover Change Analysis An Introduction to Land Cover Change Analysis using the Multispectral Image Data Analysis System (MultiSpec ) Level: Grades 9 to 12 Windows version With Teacher Notes Earth Observation
Land Cover Change Analysis An Introduction to Land Cover Change Analysis using the Multispectral Image Data Analysis System (MultiSpec ) Level: Grades 9 to 12 Windows version With Teacher Notes Earth Observation
Satellite Remote Sensing: Earth System Observations
 Satellite Remote Sensing: Earth System Observations Land surface Water Atmosphere Climate Ecosystems 1 EOS (Earth Observing System) Develop an understanding of the total Earth system, and the effects of
LAND SURFACE TEMPERATURE MONITORING THROUGH GIS TECHNOLOGY USING SATELLITE LANDSAT IMAGES
 Abstract LAND SURFACE TEMPERATURE MONITORING THROUGH GIS TECHNOLOGY USING SATELLITE LANDSAT IMAGES Aurelian Stelian HILA, Zoltán FERENCZ, Sorin Mihai CIMPEANU University of Agronomic Sciences and Veterinary
SENTINEL-1 Toolbox. Polarimetric Tutorial Issued March 2015 Updated August Luis Veci
 SENTINEL-1 Toolbox Polarimetric Tutorial Issued March 2015 Updated August 2016 Luis Veci Copyright 2015 Array Systems Computing Inc. http://www.array.ca/ http://step.esa.int Polarimetric Tutorial The goal
Hydraulics and Floodplain Modeling Managing HEC-RAS Cross Sections
 v. 9.1 WMS 9.1 Tutorial Hydraulics and Floodplain Modeling Managing HEC-RAS Cross Sections Modify cross sections in an HEC-RAS model to use surveyed cross section data Objectives Build a basic HEC-RAS
Module 3 Introduction to GIS. Lecture 8 GIS data acquisition
 Module 3 Introduction to GIS Lecture 8 GIS data acquisition GIS workflow Data acquisition (geospatial data input) GPS Remote sensing (satellites, UAV s) LiDAR Digitized maps Attribute Data Management Data
The New Rig Camera Process in TNTmips Pro 2018
 The New Rig Camera Process in TNTmips Pro 2018 Jack Paris, Ph.D. Paris Geospatial, LLC, 3017 Park Ave., Clovis, CA 93611, 559-291-2796, jparis37@msn.com Kinds of Digital Cameras for Drones Two kinds of
AmericaView EOD 2016 page 1 of 16
 Remote Sensing Flood Analysis Lesson Using MultiSpec Online By Larry Biehl Systems Manager, Purdue Terrestrial Observatory (biehl@purdue.edu) v Objective The objective of these exercises is to analyze
TimeSync V3 User Manual. January Introduction
 TimeSync V3 User Manual January 2017 Introduction TimeSync is an application that allows researchers and managers to characterize and quantify disturbance and landscape change by facilitating plot-level
Supervised Land Cover Classification An introduction to digital image classification using the Multispectral Image Data Analysis System (MultiSpec )
") Supervised Land Cover Classification An introduction to digital image classification using the Multispectral Image Data Analysis System (MultiSpec ) Level: Grades 9 to 12 Windows version With Teacher Notes
Supervised Land Cover Classification An introduction to digital image classification using the Multispectral Image Data Analysis System (MultiSpec ) Level: Grades 9 to 12 Windows version With Teacher Notes
Comparison between Landsat 7 Enhanced Thematic Mapper Plus (ETM+) and Landsat 8 Operational Land Imager (OLI) Assessment of Vegetation Indices
 and Landsat 8 Operational Land Imager (OLI) Assessment of Vegetation Indices") Nigerian Journal of Environmental Sciences and Technology (NIJEST) www.nijest.com ISSN (Print): 2616-051X ISSN (electronic): 2616-0501 Vol 1, No. 2 July 2017, pp 355-366 Comparison between Landsat 7 Enhanced
Nigerian Journal of Environmental Sciences and Technology (NIJEST) www.nijest.com ISSN (Print): 2616-051X ISSN (electronic): 2616-0501 Vol 1, No. 2 July 2017, pp 355-366 Comparison between Landsat 7 Enhanced
Visualizing a Pixel. Simulate a Sensor s View from Space. In this activity, you will:
 Simulate a Sensor s View from Space In this activity, you will: Measure and mark pixel boundaries Learn about spatial resolution, pixels, and satellite imagery Classify land cover types Gain exposure to
Importing and processing gel images
 BioNumerics Tutorial: Importing and processing gel images 1 Aim Comprehensive tools for the processing of electrophoresis fingerprints, both from slab gels and capillary sequencers are incorporated into
Interpreting land surface features. SWAC module 3
 Interpreting land surface features SWAC module 3 Interpreting land surface features SWAC module 3 Different kinds of image Panchromatic image True-color image False-color image EMR : NASA Echo the bat
Lab #10 Digital Orthophoto Creation (Using Leica Photogrammetry Suite)
") Lab #10 Digital Orthophoto Creation (Using Leica Photogrammetry Suite) References: Leica Photogrammetry Suite Project Manager: Users Guide, Leica Geosystems LLC. Leica Photogrammetry Suite 9.2 Introduction:
Lab #10 Digital Orthophoto Creation (Using Leica Photogrammetry Suite) References: Leica Photogrammetry Suite Project Manager: Users Guide, Leica Geosystems LLC. Leica Photogrammetry Suite 9.2 Introduction:
Spectral Signatures. Vegetation. 40 Soil. Water WAVELENGTH (microns)
") Spectral Signatures % REFLECTANCE VISIBLE NEAR INFRARED Vegetation Soil Water.5. WAVELENGTH (microns). Spectral Reflectance of Urban Materials 5 Parking Lot 5 (5=5%) Reflectance 5 5 5 5 5 Wavelength (nm)
Spectral Signatures % REFLECTANCE VISIBLE NEAR INFRARED Vegetation Soil Water.5. WAVELENGTH (microns). Spectral Reflectance of Urban Materials 5 Parking Lot 5 (5=5%) Reflectance 5 5 5 5 5 Wavelength (nm)
1. Start a bit about Linux
 GEOG432/632 Fall 2017 Lab 1 Display, Digital numbers and Histograms 1. Start a bit about Linux Login to the linux environment you already have in order to view this webpage Linux enables both a command
Using Multi-spectral Imagery in MapInfo Pro Advanced
 Using Multi-spectral Imagery in MapInfo Pro Advanced MapInfo Pro Advanced Tom Probert, Global Product Manager MapInfo Pro Advanced: Intuitive interface for using multi-spectral / hyper-spectral imagery
Lecture 2. Electromagnetic radiation principles. Units, image resolutions.
 NRMT 2270, Photogrammetry/Remote Sensing Lecture 2 Electromagnetic radiation principles. Units, image resolutions. Tomislav Sapic GIS Technologist Faculty of Natural Resources Management Lakehead University
ADOBE PHOTOSHOP CS 3 QUICK REFERENCE
 ADOBE PHOTOSHOP CS 3 QUICK REFERENCE INTRODUCTION Adobe PhotoShop CS 3 is a powerful software environment for editing, manipulating and creating images and other graphics. This reference guide provides
FOR 474: Forest Inventory. FOR 474: Forest Inventory. Why do we Care About Forest Sampling?
 FOR 474: Forest Inventory 1. Advanced Forest Inventory The Need for Forest Sampling Brief Intro to Remote Sensing and GIS Readings: FOR 474: Forest Inventory Related Courses! FOR 274: Forest Measurements
REMOTE SENSING INTERPRETATION
 REMOTE SENSING INTERPRETATION Jan Clevers Centre for Geo-Information - WU Remote Sensing --> RS Sensor at a distance EARTH OBSERVATION EM energy Earth RS is a tool; one of the sources of information! 1
Satellite Imagery and Remote Sensing. DeeDee Whitaker SW Guilford High EES & Chemistry
 Satellite Imagery and Remote Sensing DeeDee Whitaker SW Guilford High EES & Chemistry whitakd@gcsnc.com Outline What is remote sensing? How does remote sensing work? What role does the electromagnetic
MultiSpec Exercise: Creating Vegetation Indices Images
 MultiSpec Exercise: Creating Vegetation Indices Images Requirements: MultiSpec application and ag020522_dpac_cd.lan. One can create images that represent algebraic combinations of the original channels
Introduction to image processing for remote sensing: Practical examples
 Università degli studi di Roma Tor Vergata Corso di Telerilevamento e Diagnostica Elettromagnetica Anno accademico 2010/2011 Introduction to image processing for remote sensing: Practical examples Dr.
NON-PHOTOGRAPHIC SYSTEMS: Multispectral Scanners Medium and coarse resolution sensor comparisons: Landsat, SPOT, AVHRR and MODIS
 NON-PHOTOGRAPHIC SYSTEMS: Multispectral Scanners Medium and coarse resolution sensor comparisons: Landsat, SPOT, AVHRR and MODIS CLASSIFICATION OF NONPHOTOGRAPHIC REMOTE SENSORS PASSIVE ACTIVE DIGITAL