Communicating the Structure and
|
|
|
- Anthony Glenn
- 5 years ago
- Views:
Transcription

1 Communicating the Structure and Evolution of Science Dr. Katy Börner Cyberinfrastructure for Network Science Center, Director Information Visualization Laboratory, Director School of Library and Information Science Indiana University, Bloomington, IN SAP Media X 2009 Winter Quarter Seminar Series Y2E2 Room 292A, Jerry Yang and Akiko Yamazaki Environment & Energy Building Stanford University Wednesday, January 21, 2009 Growth of Scientific Knowledge, 1665 to 2006
2 2005 World Population The population map uses a quarter degree box resolution. Boxes with zero people are given in white. Darker shades of red indicate higher population counts per box using a logarithmic interpolation. The highest density boxes appear in Mumbai, with 11,687, people in the quarter degree block, Calcutta (10,816,010), 010) and Shanghai (8,628,088) Night on Earth This image shows city lights at night. It was composed from hundreds of pictures made by orbiting satellites. The seaboards of Europe, the eastern United States, and Japan are particularly well lit. Many cities exist near rivers or oceans so that goods can be exchanged cheaply by boat. The central parts of South America, Africa, Asia, and Australia are rather dark despite their high population density, see map to the left.
3 2007 IP Address Ownership This map shows IP address ownership by location. Each owner is represented by a circle and the area size of the circle corresponds to the number of IP addresses owned. The larges circle denotes MIT s holdings of an entire class A subnet, which equates to 16,581,375 IP addresses. The countries that own the most IP addresses are US (560 million), Japan (130 million), Great Britain (47 million) Scientific Productivity Shown is where science is performed today. Each circle indicates a geographic location at which scholarly papers are published. The larger the circle the more papers are produced. Boston, MA, London, England, and New York, NY are the top three paper production areas. Note the strong resemblance with the Night on Earth and the IP Ownership maps and the striking differences to the world population map.


, Annual Review of Information")


 (2004).")


.")


4 Computational Scientometrics: Studying Science by Scientific ifi Means Börner, Katy, Chen, Chaomei, and Boyack, Kevin. (2003). Visualizing Knowledge Domains. In Blaise Cronin (Ed.), Annual Review of Information Science & Technology, Medford, NJ: Information Today, Inc./American Society for Information Science and Technology, Volume 37, Chapter 5, pp / /p / p Shiffrin, Richard M. and Börner, Katy (Eds.) (2004). Mapping Knowledge Domains. Proceedings of the National Academy of Sciences of the United States of America, 101(Suppl_1). Börner, Katy, Sanyal, Soma and Vespignani, i Alessandro (2007). Nt Network ksi Science. In Blaise Cronin (Ed.), Annual Review of Information Science & Technology, Information Today, Inc./American Society for Information Science and Technology, Medford, NJ, Volume 41, Chapter 12, pp p p Places & Spaces: Mapping Scienc exhibit, see also 7
5 Science of Science Opportunities Advantages for Funding Agencies Supports monitoring of (long-term) money flow and research developments, evaluation of funding strategies for different programs, decisions on project durations, funding gpatterns. Staff resources can be used for scientific program development, to identify areas for future development, and the stimulation of new research areas. Advantages for Researchers Easy access to research results, relevant funding programs and their success rates, potential collaborators, competitors, related projects/publications (research push). More time for research and teaching. Advantages for Industry Fast and easy access to major results, experts, etc. Can influence the direction of research by entering information on needed technologies (industry-pull). Advantages for Publishers Unique interface to their data. Publicly funded development of databases and their interlinkage. For Society Dramatically improved access to scientific knowledge and expertise. Process of Analyzing and Mapping Knowledge Domains, Topics Börner, Katy, Chen, Chaomei, and Boyack, Kevin. (2003) Visualizing Knowledge Domains. In Blaise Cronin (Ed.), Annual Review of Information Science & Technology, Volume 37, Medford, NJ: Information Today, Inc./American Society for Information Science and Technology, chapter 5, pp


.")
6 Latest Base Map of Science Kevin W. Boyack, Katy Börner, & Richard Klavans (2007). Mapping the Structure and Evolution of Chemistry Research. 11th International Conference on Scientometrics i and Informetrics. pp Uses combined SCI/SSCI Math Law from M papers, 24.5M Computer Tech Policy Statistics references, 7,300 journals Economics CompSci Bibliographic coupling of ppr papers, aggregated tdto Education Vision Physics journals Psychology Brain Initial ordination and clustering Environment Psychiatry of journals gave 671 clusters MRI Coupling counts were Bio- BioChem Materials reaggregated at the journal cluster level to calculate the Plant Cancer (x,y) positions for each Disease & Animal journal cluster Treatments Virology Infectious Diseases by association, (x,y) positions for each journal Phys-Chem Chemistry GeoScience Biology Microbiology Science map applications: Identifying core competency Kevin W. Boyack, Katy Börner, & Richard Klavans (2007). Funding patterns of the US Department of Energy (DOE) Law Math Policy Statistics Computer Tech Economics CompSci Phys-Chem Education Vision Physics Chemistry Psychology Psychiatry Brain Environment GeoScience GI MRI Bio- Materials BioChem Biology Cancer Animal Plant Microbiology Virology Infectious Diseases
 Law Math Policy Statistics Computer Tech Economics CompSci Phys-Chem Education")
 Law Math Policy Statistics Computer Tech Economics CompSci")

7 Science map applications: Identifying core competency Kevin W. Boyack, Katy Börner, & Richard Klavans (2007). Funding Patterns of the National Science Foundation (NSF) Law Math Policy Statistics Computer Tech Economics CompSci Phys-Chem Education Vision Physics Chemistry Psychology Psychiatry Brain Environment GeoScience GI BioChem Biology Cancer Animal Plant Microbiology Virology Infectious Diseases Science map applications: Identifying core competency Kevin W. Boyack, Katy Börner, & Richard Klavans (2007). Funding Patterns of the National Institutes of Health (NIH) Law Math Policy Statistics Computer Tech Economics CompSci Phys-Chem Education Vision Physics Chemistry Psychology Psychiatry Brain Environment GeoScience GI MRI Bio- Materials MRI Bio- Materials BioChem Biology Cancer Animal Plant Microbiology Virology Infectious Diseases
8 Sample Science Studies Mapping the Evolution of Co-Authorship Networks Ke, Visvanath & Börner, (2004) Won 1st price at the IEEE InfoVis Contest. 16
9 113 Years of Physical Review Bruce W. Herr II and Russell Duhon (Data Mining & Visualization), Elisha F. Hardy (Graphic Design), Shashikant Penumarthy (Data Preparation) and Katy Börner (Concept) 17
 Mapping the Diffusion i of Scholarly l Knowledge Among Major U.S. US Research Institutions. Scientometrics. 68(3), pp. 415-426. Research questions: 1.")


10 Spatio-Temporal Information Production and Consumption of Major U.S. Research Institutions Börner, Katy, Penumarthy, Shashikant, Meiss, Mark and Ke, Weimao. (2006) Mapping the Diffusion i of Scholarly l Knowledge Among Major U.S. US Research Institutions. Scientometrics. 68(3), pp Research questions: 1. Does space still matter in the Internet age? 2. Does one still have to study and work at major research institutions in order to have access to high quality data and expertise and to produce high quality research? 3. Does the Internet lead to more global lcitation i patterns, i.e., more citation links between papers produced at geographically distant research instructions? Contributions: Answer to Qs is YES. Answer to Qs 3 is NO. Novel approach to analyzing the dual role of institutions as information producers and consumers and to study and visualize the diffusion of information among them. Mapping Topic Bursts Co-word space of the top 50 highly frequent and bursty words used in the top 10% most highly hl cited PNAS publications in Mane & Börner. (2004) PNAS, 101(Suppl. 1):
11


12 Mapping Indiana s Intellectual Space Identify Pockets of innovation Pathways from ideas to products Interplay of industry and academia Wikipedian Activity Studying large scale social networks such as Wikipedia Vizzards 2007 Entry Second Sight: An Emergent Mosaic of Wikipedian Activity, The NewScientist, May 19, 2007 Rendered as Google Map: Jan 8 th, 2008 Data Version on Gigapan:

, 6,474 science (green), and")

, - number of major edits (top right), -")
. Bruce W.")
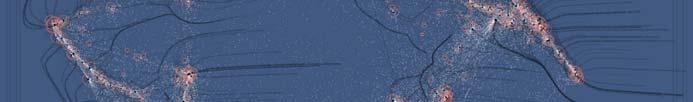
13 Science Related Wikipedian Activity detail php?map id=165 Same base map. Overlaid are 3,599 math (blue), 6,474 science (green), and 3,164 technology relevant articles (yellow). All other articles are given in grey. Corners show articles size coded according to -article edit activity (top left), - number of major edits (top right), - number of bursts in edit activity (bottom, right) - indegree (bottom left). Bruce W. Herr II, Gully Burns (USC), David Newman (UCI), Society for Neuroscience, 2006 Visual Browser, 2007,
,")


14 Bruce W. Herr II, Gully Burns (USC), David Newman (UCI), Society for Neuroscience, 2006 Visual Browser, 2007, Bruce W. Herr II, Gully Burns (USC), David Newman (UCI), Society for Neuroscience, 2006 Visual Browser, 2007,

, Society for")


15 Bruce W. Herr II, Gully Burns (USC), David Newman (UCI), Society for Neuroscience, 2006 Visual Browser, 2007, Bruce W. Herr II, Gully Burns (USC), David Newman (UCI), Society for Neuroscience, 2006 Visual Browser, 2007,


16 Mapping Science Exhibit Places & Spaces: Mapping Science a science exhibit that introduces people to maps of sciences, their hi makers and users. Exhibit Curators: Dr. Katy Börner & Elisha F. Hardy 32

 The Power of Reference Systems")
 Science Maps as Visual")
 Science Forecasts (2013) The Power of Forecasts")


 Mapping,")


17 Mapping Science Exhibit 10 Iterations in 10 years The Power of Maps (2005) Science Maps for Economic Decision Makers (2008) The Power of Reference Systems (2006) Science Maps for Science Policy Makers (2009) Science Maps for Scholars (2010) Science Maps as Visual Interfaces to Digital Libraries (2011) Science Maps for Kids (2012) Science Forecasts (2013) The Power of Forecasts (2007) How to Lie with Science Maps (2014) Exhibit has been shown in 49 venues on four continents. Also at - NSF, 10th Floor, 4201 Wilson Boulevard, Arlington, VA. - Chinese Academy of Sciences, China, May 17-Nov. 15, University i of Alberta, Edmonton, Canada, Nov 10-Jan 31, Center of Advanced European Studies and Research, Bonn, Germany, Dec , Illuminated Diagram Display W. Bradford Paley, Kevin W. Boyack, Richard Kalvans, and Katy Börner (2007) Mapping, Illuminating, and Interacting with Science. SIGGRAPH Questions: Who is doing research on what topic and where? What is the footprint of interdisciplinary research fields? What impact have scientists? Contributions: Interactive, high resolution interface to access and make sense of data about scholarly activity. Large-scale, high resolution prints illuminated via projector or screen. Interactive touch panel. 34
18
19
20


21
22
23 Science Puzzle Map for Kids by Fileve Palmer, Julie Smith, Elisha Hardy and Katy Börner, Indiana University, (Base map taken from Illuminated Diagram display by Kevin Boyack, Richard Klavans, and W. Bradford Paley.)
24


25 Science of Science Cyberinfrastructure


")


26 Scholarly Database: Web Interface Search across publications, patents, grants. Download records and/or (evolving) co-author,,paper-citation p networks. Register for free access at Katy Börner: Mapping the Structure and Dynamics of Science 51 Scholarly Database: # Records & Years Covered Datasets available via the Scholarly Database Dataset #Records Years Coverage updated Restricted Access Medline 16,053, Yes PhysRev 398, Yes PNAS 16, Yes JCR 59, ,1979,1984,19 Yes 89, USPTO 3,710, Yes NSF 174, Yes NIH 1,043, Yes Total 21,456, Aim for comprehensive temporal, geospatial, and topic coverage. Katy Börner: Mapping the Structure and Dynamics of Science 52

 Huang, Bruce Herr, Heng Zhang, Duygu Balcan, Bryan Hook, Ben")


27 Network Workbench (NWB) Project Investigators: Katy Börner, Albert-Laszlo Barabasi, Santiago Schnell, Alessandro Vespignani & Stanley Wasserman, Eric Wernert Software Team: Lead: Micah Linnemeier Members: Patrick Phillips, Russell Duhon, Tim Kelley & Ann McCranie Previous Developers: Weixia (Bonnie) Huang, Bruce Herr, Heng Zhang, Duygu Balcan, Bryan Hook, Ben Markines, Santo Fortunato, Felix Terkhorn, Ramya Sabbineni, Vivek S. Thakre & Cesar Hidalgo Goal: Develop a large-scale e network analysis, a s, modeling and visualization at toolkit t for physics, biomedical, and social science research. Amount: $1,120,926, NSF IIS award Duration: Sept Aug Website: Katy Börner: Mapping the Structure and Dynamics of Science 53 Serving Non-CS Algorithm Developers & Users Developers Users CIShell Wizards CIShell IVC Interface NWB Interface Katy Börner: Mapping the Structure and Dynamics of Science 54


28 See July 1st, 2008 Katy Börner: Mapping the Structure and Dynamics of Science 55 EpiC will Build on and Extend NWB Katy Börner: Mapping the Structure and Dynamics of Science 56


29
Science of Science: Dr. Katy Börner Cyberinfrastructure for Network Science Center, Director Information Visualization Laboratory, Director
 Science of Science: Visualization of Scholarly Activity Dr. Katy Börner Cyberinfrastructure for Network Science Center, Director Information Visualization Laboratory, Director School of Library and Information
Mapping the Structure and Evolution
 Mapping the Structure and Evolution of World Wide Science Dr. Katy Börner Cyberinfrastructure for Network Science Center, Director Information Visualization Laboratory, Director School of Library and Information
The Science of Science
 The Science of Science Dr. Katy Börner Cyberinfrastructure for Network Science Center, Director Information Visualization Laboratory, Director School of Library and Information Science Indiana University,
Recommendations for Evaluating Large, Interdisciplinary Research Initiatives
 Recommendations for Evaluating Large, Interdisciplinary Research Initiatives Dr. Katy Börner Cyberinfrastructure for Network Science Center, Director Information Visualization Laboratory, Director School
Envisioning and Communicating Science
 Envisioning and Communicating Science Dr. Katy Börner Cyberinfrastructure for Network Science Center, Director Information Visualization Laboratory, Director School of Library and Information Science Indiana
1. Dream Tools for Scholarly Knowledge Management
 Mapping the Structure and Evolution of Scholarly Knowledge: Data (Integration) Issues Dr. Katy Börner Cyberinfrastructure for Network Science Center, Director Information Visualization Laboratory, Director
Mapping, Illuminating, and Interacting with Science (sap_0116) Mapping, Illuminating, and Interacting with Science (sap_0116)
 Mapping, Illuminating, and Interacting with Science (sap_0116)") Mapping, Illuminating, and Interacting with Science (sap_0116) Kevin W. Boyack Sandia National Laboratories Richard Klavans SciTech Strategies, Inc. W. Bradford Paley Digital Image Design Incorporated
Mapping, Illuminating, and Interacting with Science (sap_0116) Kevin W. Boyack Sandia National Laboratories Richard Klavans SciTech Strategies, Inc. W. Bradford Paley Digital Image Design Incorporated
Network Workbench (NWB)
") Network Workbench: A CI-Marketplace for Network Scientists Dr. Katy Börner Cyberinfrastructure for Network Science Center, Director Information Visualization Laboratory, Director School of Library and
Network Workbench: A CI-Marketplace for Network Scientists Dr. Katy Börner Cyberinfrastructure for Network Science Center, Director Information Visualization Laboratory, Director School of Library and
Atlas of Science. MIT Press May 6, 2010
 Atlas of Science Dr. Katy Börner Cyberinfrastructure for Network Science Center, Director Information Visualization Laboratory, Director School of Library and Information Science Indiana University, Bloomington,
Places & Spaces: Mapping Science Maps at an Exhibition
 Places & Spaces: Mapping Science Maps at an Exhibition Dr. Katy Börner Cyberinfrastructure for Network Science Center, Director Information Visualization Laboratory, Director School of Library and Information
Computational Scientometrics
 Computational Scientometrics That Informs Science Policy Dr. Katy Börner Cyberinfrastructure for Network Science Center, Director Information Visualization Laboratory, Director School of Library and Information
Open Data and Open Code for S&T Assessment
 Open Data and Open Code for S&T Assessment Dr. Katy Börner Cyberinfrastructure for Network Science Center, Director Information Visualization Laboratory, Director School of Library and Information Science
Towards Scholarly Marketplaces
 Towards Scholarly Marketplaces Dr. Katy Börner Cyberinfrastructure for Network Science Center, Director Information Visualization Laboratory, Director School of Library and Information Science Indiana
Mapping Science Locally and Globally
 Mapping Science Locally and Globally Dr. Katy Börner Cyberinfrastructure for Network Science Center, Director Information Visualization Laboratory, Director School of Library and Information Science Indiana
Places & Spaces: Mapping Science An International Exhibit
 Places & Spaces: Mapping Science An International Exhibit Katy Börner, Samantha Hale, and Todd Theriault CNS, SLIS, IU, Bloomington, IN katy@indiana.edu http://cns.iu.edu Statewide IT Conference at Indiana
Information Visualizations that Improve Access to Scholarly Knowledge and Expertise
 Information Visualizations that Improve Access to Scholarly Knowledge and Expertise Katy Börner School of Library and Information Science katy@indiana.edu ACM Board Meeting, NYC, Oct 22 nd, 2004 Users
Mapping Knowledge Domains
 Mapping Knowledge Domains Katy Börner School of Library and Information Science katy@indiana.edu Talk at IU s Technology Transfer Office Indianapolis, IN, July 12 th, 2005. Overview 1. Motivation for Mapping
Towards a Macroscope for Decision Support in Science & Technology Policy
 Towards a Macroscope for Decision Support in Science & Technology Policy Dr. Katy Börner Cyberinfrastructure for Network Science Center, Director Information Visualization Laboratory, Director School of
Modeling and Mapping Science ~ Computational Scientometrics: Studying Science by Scientific Means
 Modeling and Mapping Science ~ Possible Futures Dr. Katy Börner Cyberinfrastructure for Network Science Center, Director Information Visualization Laboratory, Director School of Library and Information
How can we communicate the beauty, structure, and dynamics of science to a general audience?
 How can we communicate the beauty, structure, and dynamics of science to a general audience? Mapping Science Exhibit 10 Iterations in 10 years http://scimaps.org The Power of Maps (2005) Science Maps for
Managing Humanity's Knowledge & Expertise
 Managing Humanity's Knowledge & Expertise Katy Börner School of Library and Information Science katy@indiana.edu NSF IIS/CISE Talk, Room 1120, Oct 20 th, 2004 Overview The Problem Maps of Science / Knowledge
Envisioning Knowledge (and Expertise)
") Envisioning Knowledge (and Expertise) Dr. Katy Börner Cyberinfrastructure for Network Science Center, Director Information Visualization Laboratory, Director School of Library and Information Science Indiana
Envisioning Knowledge (and Expertise) Dr. Katy Börner Cyberinfrastructure for Network Science Center, Director Information Visualization Laboratory, Director School of Library and Information Science Indiana
Mapping Scientific Networks
 Mapping Scientific Networks Dr. Katy Börner Cyberinfrastructure for Network Science Center, Director Information Visualization Laboratory, Director School of Library and Information Science Indiana University,
Plug-and-Play Macroscopes
 Plug-and-Play Macroscopes Dr. Katy Börner Cyberinfrastructure for Network Science Center, Director Information Visualization Laboratory, Director School of Library and Information Science Indiana University,
Envisioning (Biomedical) Science
 Science") Envisioning (Biomedical) Science Dr. Katy Börner Cyberinfrastructure for Network Science Center, Director Information Visualization Laboratory, Director School of Library and Information Science Indiana
Envisioning (Biomedical) Science Dr. Katy Börner Cyberinfrastructure for Network Science Center, Director Information Visualization Laboratory, Director School of Library and Information Science Indiana
Rete-Netzwerk-Red: Analyzing and Visualizing Scholarly Networks Using the Network Workbench Tool
 Rete-Netzwerk-Red: Analyzing and Visualizing Scholarly Networks Using the Network Workbench Tool Dr. Katy Börner Cyberinfrastructure for Network Science Center, Director Information Visualization Laboratory,
Plug-and-Play Macroscopes
 Plug-and-Play Macroscopes Katy Börner Cyberinfrastructure for Network Science Center, Director Information Visualization Laboratory, Director School of Library and Information Science Indiana University,
Modelling Co-Evolving Scholarly Networks and the Collective Allocation of Research Funding, and Broadcasting STI Forecasts
 Modelling Co-Evolving Scholarly Networks and the Collective Allocation of Research Funding, and Broadcasting STI Forecasts Katy Börner, Cyberinfrastructure for Network Science Center School of Informatics
International, Interdisciplinary Plug-and-Play Macroscopes
 International, Interdisciplinary Plug-and-Play Macroscopes Katy Börner Cyberinfrastructure for Network Science Center, Director Information Visualization Laboratory, Director School of Library and Information
Plug-and-Play Macroscopes That Empower Science
 Plug-and-Play Macroscopes That Empower Science Joseph Biberstine Senior Software Developer and Research Analyst Cyberinfrastructure for Network Science Center School of Library and Information Science
InfoVis.net>Magazine>message nº 170 Published También disponible en Español. The digital magazine of InfoVis.
 Page 1 of 5 InfoVis.net>Magazine>message nº 170 Published 2005-07-25 También disponible en Español Inf@Vis! The digital magazine of InfoVis.net by Juan C. Dürsteler [message nº 170] Katy Börner, one of
Plug-and-Play Macroscopes That Empower Science
 Plug-and-Play Macroscopes That Empower Science Katy Börner Cyberinfrastructure for Network Science Center, Director Information Visualization Laboratory, Director School of Library and Information Science
Interactive Maps of Science and Technology
 Interactive Maps of Science and Technology Dr. Katy Börner Cyberinfrastructure for Network Science Center, Director Information Visualization Laboratory, Director School of Library and Information Science
Mining, Mapping, and Accelerating Science and Technology
 Mining, Mapping, and Accelerating Science and Technology Katy Börner Cyberinfrastructure for Network Science Center, Director Information Visualization Laboratory, Director School of Library and Information
Mining, Visualizing, and Accelerating Science and Technology
 Mining, Visualizing, and Accelerating Science and Technology Katy Börner Royal Netherlands Academy of Arts and Sciences (KNAW), The Netherlands and Cyberinfrastructure for Network Science Center, Director
Envisioning Science and Technology
 Envisioning Science and Technology Katy Börner Cyberinfrastructure for Network Science Center, Director Information Visualization Laboratory, Director School of Library and Information Science Indiana
Envisioning Big S&T Data
 Envisioning Big S&T Data Katy Börner CNS, SLIS, IU, Bloomington, IN katy@indiana.edu http://cns.iu.edu November 16, 2012 Find your way Descriptive & Predictive Models Terra bytes of data Find collaborators,
Monitoring, Modeling & Forecasting Tools for Fostering Innovative S&T Workforce
 Monitoring, Modeling & Forecasting Tools for Fostering Innovative S&T Workforce Katy Börner (her PhD student Scott Weingart attended on Oct 5 th ) Cyberinfrastructure for Network Science Center, Director
Data Visualizations: Drawing Actionable Insights from Science and Technology Data
 Data Visualizations: Drawing Actionable Insights from Science and Technology Data Katy Börner Victor H. Yngve Professor of Information Science Director, Cyberinfrastructure for Network Science Center School
Serving the Needs of Science Policy
 Serving the Needs of Science Policy Decision Makers (What Science Policy Makers Really Want and Resulting Research Challenges) Dr. Katy Börner Cyberinfrastructure for Network Science Center, Director Information
Researcher Networking, Research Management, and Research Reporting Using VIVO
 Researcher Networking, Research Management, and Research Reporting Using VIVO Katy Börner Cyberinfrastructure for Network Science Center, Director Information Visualization Laboratory, Director School
Médialab Sciences Po, 27 rue Saint Guillame 7eme arrondissement, Room Eugene D'EICHTAL - A35 Wednesday, April 11, 2012
 Envisioning and Accelerating Science and Technology CNS, SLIS, IU, Bloomington, IN, USA & KNAW, Amsterdam, The Netherlands katy@indiana.edu http://cns.iu.edu Médialab Sciences Po, 27 rue Saint Guillame
Using Our Collective Wisdom. Supporting the Global Brain Emerging on this Planet
 Using Our Collective Wisdom Supporting the Global Brain Emerging on this Planet Intro for Day 3 by Katy Borner, Indiana University Howard Bloom (2000) Global Brain: The Evolution of Mass Mind From the
Visualizing (Web) Science
 Science") Mapping the Structure and Evolution of (Web) Science Katy Börner Victor H. Yngve Distinguished Professor of Information Science Director, Cyberinfrastructure for Network Science Center School of Informatics
Mapping the Structure and Evolution of (Web) Science Katy Börner Victor H. Yngve Distinguished Professor of Information Science Director, Cyberinfrastructure for Network Science Center School of Informatics
Modelling Science, Technology, and Innovation
 Modelling Science, Technology, and Innovation Katy Börner Victor H. Yngve Distinguished Professor of Information Science Director, Cyberinfrastructure for Network Science Center School of Informatics and
Modelling Science, Technology, and Innovation
 Modelling Science, Technology, and Innovation Katy Börner Victor H. Yngve Distinguished Professor of Information Science Director, Cyberinfrastructure for Network Science Center School of Informatics and
Open Data, Open Source NRN Systems for Global Science Decision-Making: Let s Compete!
 8/7/2014 Open Data, Open Source NRN Systems for Global Science Decision-Making: Let s Compete! Katy Börner, Cyberinfrastructure for Network Science Center School of Informatics and Computing Indiana University,
Combining scientometrics with patentmetrics for CTI service in R&D decisionmakings
 Combining scientometrics with patentmetrics for CTI service in R&D decisionmakings ---- Practices and case study of National Science Library of CAS (NSLC) By: Xiwen Liu P. Jia, Y. Sun, H. Xu, S. Wang,
Cyberinfrastructure and Datasets for Science of Team Science Research
 Cyberinfrastructure and Datasets for Science of Team Science Research Katy Börner Cyberinfrastructure for Network Science Center, Director Information Visualization Laboratory, Director School of Library
Visualizing Nanoscience and Technology
 Visualizing Nanoscience and Technology Katy Börner Victor H. Yngve Distinguished Professor of Information Science Director, Cyberinfrastructure for Network Science Center Department of Intelligent Systems
A STUDY ON THE DOCUMENT INFORMATION SERVICE OF THE NATIONAL AGRICULTURAL LIBRARY FOR AGRICULTURAL SCI-TECH INNOVATION IN CHINA
 A STUDY ON THE DOCUMENT INFORMATION SERVICE OF THE NATIONAL AGRICULTURAL LIBRARY FOR AGRICULTURAL SCI-TECH INNOVATION IN CHINA Qian Xu *, Xianxue Meng Agricultural Information Institute of Chinese Academy
Overview. 2. Novel approaches and services that improve information access, researcher networking, and research management.
 Mining, Mapping, and Accelerating Science and Technology Katy Börner Royal Netherlands Academy of Arts and Sciences(KNAW), The Netherlands Cyberinfrastructure for Network Science Center, SLIS, IUB, USA
Visual Design Principles
 Visual Design Principles Katy Börner Cyberinfrastructure for Network Science Center, Director Information Visualization Laboratory, Director School of Library and Information Science Indiana University,
Open Source Data and Tools for Global Science Decision-Making
 Open Source Data and Tools for Global Science Decision-Making Katy Börner, Cyberinfrastructure for Network Science Center School of Informatics and Computing Indiana University, USA PEGASCIS Scoping Meeting
College of Information Science and Technology
 College of Information Science and Technology Drexel E-Repository and Archive (idea) http://idea.library.drexel.edu/ Drexel University Libraries www.library.drexel.edu The following item is made available
3D Virtual Worlds and the Active Worlds Toolkit
 3D Virtual Worlds and the Active Worlds Toolkit Our contribution to the discussion of spatially explicit, multi-participatory software platforms for the Interdisciplinary Experimental Lab Katy Börner &
Big data for the analysis of digital economy & society Beyond bibliometrics
 0 Big data for the analysis of digital economy & society Beyond bibliometrics Stephane Berghmans, DVM PhD VP Academic & Research Relations EU, Elsevier With support from Judith Kamalski (Analytical Services)
Comparison of Patents Studies between China and Abroad
 YIN Li-chun, YANG Zhong-kai, LIU Ze-yuan,ZHAO Ying-xu 1 Comparison of Patents Studies between China and Abroad YIN Li-chun 1, YANG Zhong-kai 1, LIU Ze-yuan 1,ZHAO Ying-xu 2 31 May 2008 Abstract With classic
How can we communicate the beauty, structure, and dynamics of science to a general audience?
 1 How can we communicate the beauty, structure, and dynamics of science to a general audience? April, 2005: 101st Annual Meeting of the Association of American Geographer, Denver, Colorado. 2 April, 2005:
Examining the Evolution and Distribution of Patent Classifications
 Examining the Evolution and Distribution of Patent Classifications Daniel O. Kutz School of Library and Information Science Indiana University 1320 E. 10th St., LI 011 Bloomington, IN 47405 dokutz@indiana.edu
Technology forecasting used in European Commission's policy designs is enhanced with Scopus and LexisNexis datasets
 CASE STUDY Technology forecasting used in European Commission's policy designs is enhanced with Scopus and LexisNexis datasets EXECUTIVE SUMMARY The Joint Research Centre (JRC) is the European Commission's
Patent filing statistics
 Patent filing statistics WIPO IP Statistics data presentation of the latest trends Bruno Le Feuvre Statistical analyst Economics and Statistics Division IP information roundtable Geneva, October 25, 2017
Chapter 5 STI productivity or STI output?
 Chapter 5 STI productivity or STI output? 1 - Introduction Patent statistics and publication statistics provide important indicators for measuring R&D output. Long time series are available and the data
Building a Science Observatory: Data, Tools, and Maps
 Building a Science Observatory: Data, Tools, and Maps Katy Börner Cyberinfrastructure for Network Science Center, Director Information Visualization Laboratory, Director School of Library and Information
Bridging Disciplines: Assessing the Interdisciplinary Impact of Open Data
 Bridging Disciplines: Assessing the Interdisciplinary Impact of Open Data Robert R. Downs 1 and Robert S. Chen 2 1 rdowns@ciesin.columbia.edu 2 bchen@ciesin.columbia.edu NASA Socioeconomic Data and Applications
The Innovation Machine and the Role of Research! Infrastructure Investment:! Part 3!
 The Innovation Machine and the Role of Research! Infrastructure Investment:! Part 3! Diane Baxter, Ph.D.! Associate Director - Education! San Diego Supercomputer Center (SDSC)! University of California,
Global Trends in Neuroscience Publishing Background and Developments
 Global Trends in Neuroscience Publishing Background and Developments Presented by: Paul Carton PhD, Senior Publisher Elsevier S&T Journals Date: July 2008 Presentation created by James Milne 2007 / 2008
(Network) Data Visualization Literacy
 Data Visualization Literacy") (Network) Data Visualization Literacy Katy Börner Victor H. Yngve Distinguished Professor of Information Science Director, Cyberinfrastructure for Network Science Center School of Informatics and Computing
(Network) Data Visualization Literacy Katy Börner Victor H. Yngve Distinguished Professor of Information Science Director, Cyberinfrastructure for Network Science Center School of Informatics and Computing
TOKYO, JP. Foundations of Entrepreneurial Ecosystems Working Session: Innovative Capacity
 TOKYO, JP Foundations of Entrepreneurial Ecosystems Working Session: Innovative Capacity Disclaimer The data provided are designed to help initiate and frame your thinking about data-driven decision making
Solutions. Trusted Content to Innovative. From
 pg.02 From Trusted Content to Innovative The world s largest scientific and technical publisher, Elsevier provides trusted, industryleading content and intuitive information tools for chemical professionals.
Building a Science Observatory
 Building a Science Observatory Katy Börner Visiting Scientist in Dirk Helbing s Group, SOMS, ETHZ Cyberinfrastructure for Network Science Center, Director Information Visualization Laboratory, Director
College of Information Science and Technology
 College of Information Science and Technology Drexel E-Repository and Archive (idea) http://idea.library.drexel.edu/ Drexel University Libraries www.library.drexel.edu The following item is made available
Find and analyse the most relevant patents for your research
 Derwent Innovation Find and analyse the most relevant patents for your research Powering the innovation lifecycle from idea to commercialisation The pace of technology change is unprecedented with new
Tracing and Visualizing Knowledge Diffusion
 I II Tracing and Visualizing Knowledge Diffusion By Sana Sikander MCS143001 A thesis submitted to the Department of Computer Science In partial fulfillment of the requirements for the degree of MASTER
From Science of Science to Science of Science Policy
 ICSTI 2011 From Science of Science to Science of Science Policy Mari Jibu Department of Databases for Information and Knowledge Infrastructure Innovation Headquarters Japan Science and Technology Agency
Academia. Elizabeth Mezzacappa, Ph.D. & Kenneth Short, Ph.D. Target Behavioral Response Laboratory (973)
") Subject Matter Experts from Academia Elizabeth Mezzacappa, Ph.D. & Kenneth Short, Ph.D. Stress and Motivated Behavior Institute, UMDNJ/NJMS Target Behavioral Response Laboratory (973) 724-9494 elizabeth.mezzacappa@us.army.mil
Subject Matter Experts from Academia Elizabeth Mezzacappa, Ph.D. & Kenneth Short, Ph.D. Stress and Motivated Behavior Institute, UMDNJ/NJMS Target Behavioral Response Laboratory (973) 724-9494 elizabeth.mezzacappa@us.army.mil
COMPUTATIONAL SOCIAL SCIENCE AND ADVANCED COMPUTING INFRASTRUCTURE: CHALLENGES AND OPPORTUNITIES
 COMPUTATIONAL SOCIAL SCIENCE AND ADVANCED COMPUTING INFRASTRUCTURE: CHALLENGES AND OPPORTUNITIES Myron Gutmann Directorate for the Social, Behavioral and Economic Sciences March, 2012 1 10/24/11 Portrait
Microbiology Workshops. 5+ Keynote Lectures. 20+ Exhibitor Opportunities. 50+ Lectures. B2B Meetings. conferenceseries.com
 16+ conferenceseries.com 48th World Congress on Microbiology Keynote June 24-25, 2019 Moscow, Russia Dear Attendees, Invitation Keynote We are glad to announce the initiation of the 48 th World Congress
Computational Problem-Solving, Competitive Programming, Cows, and the USA Computing Olympiad. My Background
 Computational Problem-Solving, Competitive Programming, Cows, and the USA Computing Olympiad Brian C. Dean Director, USA Computing Olympiad Associate Professor of Computer Science, Clemson University ingenius,
DISCIPLINARY AND INTERDISCIPLINARY RESEARCH AT NSF
 DISCIPLINARY AND INTERDISCIPLINARY RESEARCH AT NSF Myron Gutmann Leah Nichols COSSA Colloquium 2012 November 2012 1 ACKNOWLEDGEMENTS Dave Newman, University of California, Irvine Julia Lane, American Institutes
Linking Science to Technology - Using Bibliographic References in Patents to Build Linkage Schemes
 Page 1 of 5 Paper: Linking Science to Technology - Using Bibliographic References in Patents to Build Linkage Schemes Author s information Arnold Verbeek 1 Koenraad Debackere 1 Marc Luwel 2 Petra Andries
Are Asia-Pacific Advances in Higher Education & Research Sustainable?
 Are Asia-Pacific Advances in Higher Education & Research Sustainable? AIEC Conference Canberra 10 October 2013 Dr Christopher Tremewan, Secretary General, APRU Dr Erik Lithander, Pro Vice-Chancellor, ANU
European Commission. 6 th Framework Programme Anticipating scientific and technological needs NEST. New and Emerging Science and Technology
 European Commission 6 th Framework Programme Anticipating scientific and technological needs NEST New and Emerging Science and Technology REFERENCE DOCUMENT ON Synthetic Biology 2004/5-NEST-PATHFINDER
APPLYING ONOMASTICS TO SCIENTOMETRICS
 1 APPLYING ONOMASTICS TO SCIENTOMETRICS 2015-01-19 Tania Vichnevskaia, French National Institute for Health Cultural bias and diaspora through publications 2 Appling onomastics to approach cultural bias
Data and Knowledge as Infrastructure. Chaitan Baru Senior Advisor for Data Science CISE Directorate National Science Foundation
 Data and Knowledge as Infrastructure Chaitan Baru Senior Advisor for Data Science CISE Directorate National Science Foundation 1 Motivation Easy access to data The Hello World problem (courtesy: R.V. Guha)
TIPLO News FEBRUARY 2018 (E219)
") TAIPEI MAIN OFFICE 7 th Floor We Sheng Building, No.125, Nanking East Rd. Sec.2, P.O.BOX 39-243, Taipei 10409, Taiwan Tel: 886-2-2507-2811 Fax: 886-2-2508-3711 E-mail: tiplo@tiplo.com.tw Website:www.tiplo.com.tw
TAIPEI MAIN OFFICE 7 th Floor We Sheng Building, No.125, Nanking East Rd. Sec.2, P.O.BOX 39-243, Taipei 10409, Taiwan Tel: 886-2-2507-2811 Fax: 886-2-2508-3711 E-mail: tiplo@tiplo.com.tw Website:www.tiplo.com.tw
The modern global researcher:
 The modern global researcher: How can libraries support today s technological community? CONCERT Taipei, November 12, 2018 Rachel Berrington, MLIS Director, IEEE Client Services If we understand how research
20+ CNS staff and students work on 20+ projects
 20+ CNS staff and students work on 20+ projects Monitoring, Modeling, and Forecasting Tools for Fostering an Innovative S&T Workforce. NIH U01 GM098959-01 (Katy Börner & James P. Crutchfield, UC Davis)
Mixed-indicators model for identifying emerging research areas
 Scientometrics (2011) 89:421 435 DOI 10.1007/s11192-011-0433-7 Mixed-indicators model for identifying emerging research areas Hanning Guo Scott Weingart Katy Börner Received: 2 June 2011 / Published online:
Graduate Studies in Computational Science at U-M. Graduate Certificate in Computational Discovery and Engineering. and
 Graduate Studies in Computational Science at U-M Graduate Certificate in Computational Discovery and Engineering and PhD Program in Computational Science Eric Michielssen and Ken Powell 1 Computational
Why Google Result Positioning Matters
 Why Google Result Positioning Matters A publication of Introduction 1 Research Methodology 2 Results + Report Findings 3 Traffic Distribution by Position 4 Traffic Distribution by Page 5 The Verdict +
Size of California s economy US$ trillions, 2009
 Size of California s economy US$ trillions, 2009 Rank Country Gross domestic product 1 United States 14 2 Japan 5.1 3 China 4.9 4 Germany 3.3 5 France 2.6 6 United Kingdom 2.2 7 44 Italy 2.1 8 California
CDP-EIF ITAtech Equity Platform
 CDP-EIF ITAtech Equity Platform New financial instruments to support technology transfer in Italy TTO Circle Meeting, Oxford June 22nd 2017 June, 2017 ITAtech: the "agent for change" in TT landscape A
computational social networks 5th pdf Computational Social Networks Home page Computational Social Networks SpringerLink
 DOWNLOAD OR READ : COMPUTATIONAL SOCIAL NETWORKS 5TH INTERNATIONAL CONFERENCE CSONET 2016 HO CHI MINH CITY VIETNAM AUGUST 2 4 2016 PROCEEDINGS LECTURE NOTES IN COMPUTER SCIENCE PDF EBOOK EPUB MOBI Page
China s R&D & Innovation Policies
 China s R&D & Innovation Policies 26 March 2012 Lars Christensen Technology & Science Attaché Innovation Center Denmark, Shanghai Innovation Center Denmark Back to the future? Quick Overview of Chinese
Tracking and predicting growth of health information using scientometrics methods and Google Trends
 Submitted on: 16.06.2018 Tracking and predicting growth of health information using scientometrics methods and Google Trends Angela Repanovici Transilvania University of Brasov, Brasov, Romania, Email:
The Reproducible Research Movement in Statistics
 The Reproducible Research Movement in Statistics Victoria Stodden Department of Statistics Columbia University 59th ISI World Statistics Congress Sharing Data, Code and Publications - Making Research Reproducible
Université de Bretagne Occidentale BREST QUIMPER MORLAIX
 Université de Bretagne Occidentale 2 2 Technology Parks 7 Higher Education Institutions A Regional Teaching Hospital An Ocean Discovery Park Océanopolis Brest 3 research centers Ifremer, IPEV, Roscoff
THE SUBJECT COMPOSITION OF THE WORLD'S SCIENTIFIC JOURNALS
 Scientometrics, Vol. 2, No. 1 (198) 53-63 THE SUBJECT COMPOSITION OF THE WORLD'S SCIENTIFIC JOURNALS M. P. CARPENTER, F. NARIN Computer Horizons, Inc., 15 Kings Highway North, Cherry Hill, New Jersey 834
Outline. Patents as indicators. Economic research on patents. What are patent citations? Two types of data. Measuring the returns to innovation (2)
") Measuring the returns to innovation (2) Prof. Bronwyn H. Hall Globelics Academy May 26/27 25 Outline This morning 1. Overview measuring the returns to innovation 2. Measuring the returns to R&D using productivity
Measuring the returns to innovation (2) Prof. Bronwyn H. Hall Globelics Academy May 26/27 25 Outline This morning 1. Overview measuring the returns to innovation 2. Measuring the returns to R&D using productivity